Probing the incompressibility of nuclear matter at ultra-high density through the prompt collapse of asymmetric neutron star binaries
Abstract
Using 250 neutron star merger simulations with microphysics, we explore for the first time the role of nuclear incompressibility in the prompt collapse threshold for binaries with different mass ratios. We demonstrate that observations of prompt collapse thresholds, either from binaries with two different mass ratios or with one mass ratio but combined with the knowledge of the maximum neutron star mass or compactness, will constrain the incompressibility at the maximum neutron star density, to within tens of percent. This, otherwise inaccessible, measure of can potentially reveal the presence of hyperons or quarks inside neutron stars.
pacs:
04.25.D- , 97.60.Jd , 21.65.+fIntroduction.- The equation of state (EOS) of neutron star (NS) matter is one of the most fundamental, yet elusive, relations in physics (Lattimer and Prakash, 2016; Oertel et al., 2017). It lays at the interface between several disciplines including nuclear physics, high-energy astrophysics, heavy-ion collisions, multimessenger astronomy and gravitational wave (GW) physics. Our knowledge of NS matter properties is still partial, mostly due to the difficulties in studying strongly interacting bulk matter in the low energy limit typical of nuclear interactions (Machleidt and Entem, 2011). Even the appropriate degrees of freedom are uncertain: while nucleons are the relevant species around the nuclear saturation density, , it is still unclear if hyperons Chatterjee and Vidaña (2016); Logoteta (2021) or a phase transition to quark matter Bombaci et al. (2016); Braun-Munzinger and Wambach (2009); Benic et al. (2015) can appear at densities in NS interiors.
NS EOS models are experimentally constrained by the masses of ordinary nuclei, as well as by the energy per baryon and its derivatives with respect to baryon density, , around and close to isospin symmetry, i.e. for symmetry parameter , being the density of neutrons and protons. If is the matter pressure, the nuclear incompressibility of cold nuclear matter at fixed composition is defined as
| (1) |
It describes the response of matter to compression and its value can be currently measured only for symmetric matter at saturation density, , although with some controversy Garg and Colò (2018); Shlomo et al. (2006); Youngblood et al. (1999); Stone et al. (2014); Avogadro and Bertulani (2013). While isoscalar giant monopole resonance experiments for closed shell nuclei provided , studies based on open-shell nuclei reported quite different values in the range - Stone et al. (2014) or even values around Avogadro and Bertulani (2013). Nevertheless, is unconstrained at densities and compositions relevant for NSs (far from and ). In particular, the NS central density increases monotonically with the NS mass and at the stability limit, corresponding to mass and radius (, ), can reach , depending on the EOS. Moreover, for , -equilibrated matter is very neutron rich, .
In addition to nuclear constraints, astrophysical NS properties provide useful insights on the EOS. Constraints derived from the observation of massive, isolated NS (Demorest et al., 2010; Antoniadis et al., 2013; Cromartie et al., 2019; Fonseca et al., 2021; Miller et al., 2021; Riley et al., 2021; Zhang and Li, 2021), from GW signals (Abbott et al., 2018a; De et al., 2018) and multimessenger observations of binary neutron star (BNS) mergers (Radice et al., 2018a; Radice and Dai, 2019; Bauswein et al., 2017; Margalit and Metzger, 2017; Most et al., 2018; Breschi et al., 2021), or by their combination (Raaijmakers et al., 2021; Pang et al., 2021), are very informative about the high density regime. A key phenomenon in this respect is the prompt collapse (PC) to black hole (BH) of the merger remnant, since this behavior can influence both the GW and electromagnetic (EM) signals produced by BNS mergers (Hotokezaka et al., 2013a, b; Bauswein et al., 2013a; Agathos et al., 2020; Radice et al., 2018; Bernuzzi et al., 2020). The PC behavior of equal mass BNSs was extensively explored in Ref. (Shibata et al., 2005; Hotokezaka et al., 2011; Bauswein et al., 2013b; Köppel et al., 2019; Bauswein and Stergioulas, 2019; Bauswein et al., 2020; Kashyap et al., 2021). It was shown, for example, that the threshold mass for PC, , normalized to , linearly correlates with the maximum compactness, defined as , where and are the speed of light and the gravitational constant, respectively, as well as with other NS equilibrium properties. More recently, also the study of asymmetric BNS mergers has received attention (Bauswein et al., 2020, 2021; Tootle et al., 2021; Kölsch et al., 2021). Bauswein et al. (2020, 2021) concluded that PC in asymmetric BNS usually occurs for masses equal or smaller than in the equal mass case, with the possible exception of modest asymmetries and very soft EOSs. The total mass reduction is stronger for more extreme mass ratios and it has a non-trivial dependence on the NS EOS. Tootle et al. (2021) suggested instead a quasi-universal relation. In all these works, several fitting formulae to numerical results were provided.
In this Letter, we show that , the incompressibility of nuclear, -equilibrated matter at , determines the behavior of BNS mergers close to PC and, in particular, their dependence on the mass ratio. Our results stem from the largest set of numerical relativity simulations of irrotational, asymmetric binaries with finite temperature, composition dependent microphysical EOSs to date. We demonstrate that the detection of at two different mass ratios can provide a direct measurement of in a regime otherwise inaccessible. Additionally, we suggest that its value can yield information about the relevant thermodynamics degrees of freedom close to .
Methods and models.- We simulate 250 irrotational BNS mergers with different gravitational masses and mass ratios . We perform series of simulations at fixed while changing to explore the onset of the PC behavior and determine . For the definition of and its numerical error, , we follow Refs. (Bauswein et al., 2012, 2020; Kashyap et al., 2021), monitoring the maximum of the rest mass density, , throughout the computational domain. Simulations are performed with the same codes and setup as in Ref. Kashyap et al. (2021); data are from Ref. Kashyap et al. (2021), while data are presented here for the first time. See the Supplemental Material for more details.
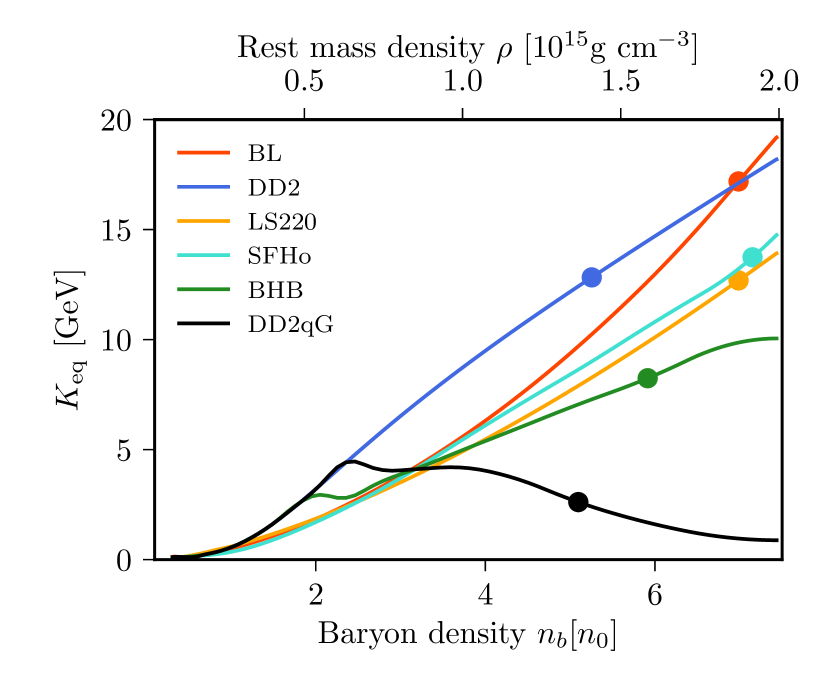
To span present uncertainties, we consider six finite-temperature, composition dependent NS EOSs. Four are purely nucleonic and widely used: BL (Bombaci and Logoteta, 2018; Logoteta et al., 2020), SFHo (Steiner et al., 2013) and HS(DD2) (Typel et al., 2010; Hempel and Schaffner-Bielich, 2010, hereafter DD2), and LS220 (Lattimer and Swesty, 1991). Additionally, we consider an EOS including hyperons, HS(BHB) (Banik et al., 2014, hereafter BHB), and one including a phase transition to quark matter, DD2qG, also presented in Ref. (Kashyap et al., 2021). In both cases, the nucleonic baseline is DD2. In Figure 1, we present the nuclear incompressibility of neutrinoless, -equilibrated, cold NS matter, , defined as in Eq. (1) but for , for the six different EOSs above as a function of . For each EOS we highlight . It is striking that the properties in the low density regime () do not necessarily correlate with those at . Moreover, the BL, SFHo and LS220 EOSs, despite being softer than the DD2 EOS, reach larger and provide similar, if not larger, .
Results.- Our simulations robustly indicate that PC occurs as approaches at merger. With the exception of the DD2qG EOS, for which , for the heaviest non-PC BNS we observe at the first remnant bounce, with larger values usually associated to .
Two opposite effects influence the evolution of with respect to . On the one hand, for a given , binaries with smaller ’s have smaller orbital angular momentum and the NS cores are more prone to fuse (and thus to increase toward ) due to the smaller rotational support (Bauswein et al., 2020, 2021). On the other hand, the nuclear incompressibility usually increases as grows, providing a larger nuclear repulsion that contrasts its further increase. Since PC is observed for , it is understandable that is the incompressibility value relevant for the PC behavior.
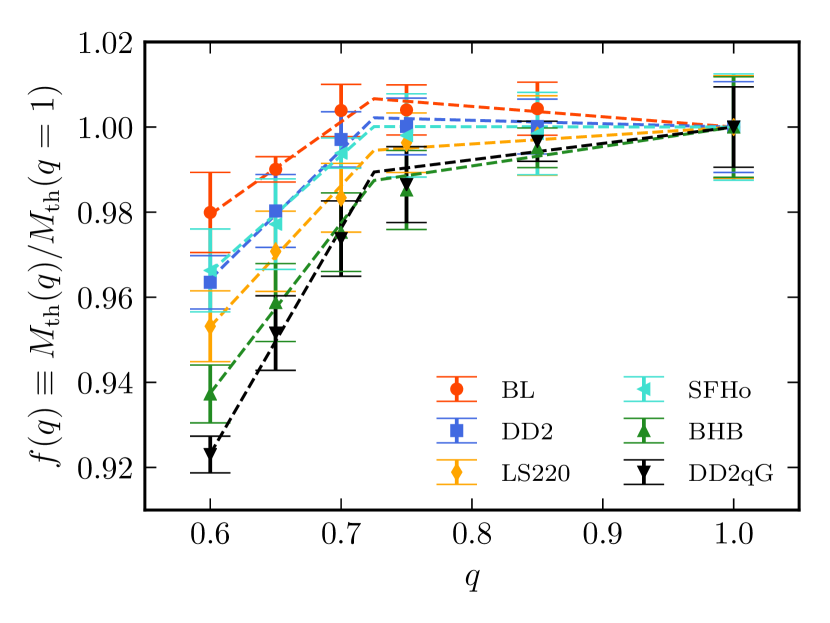
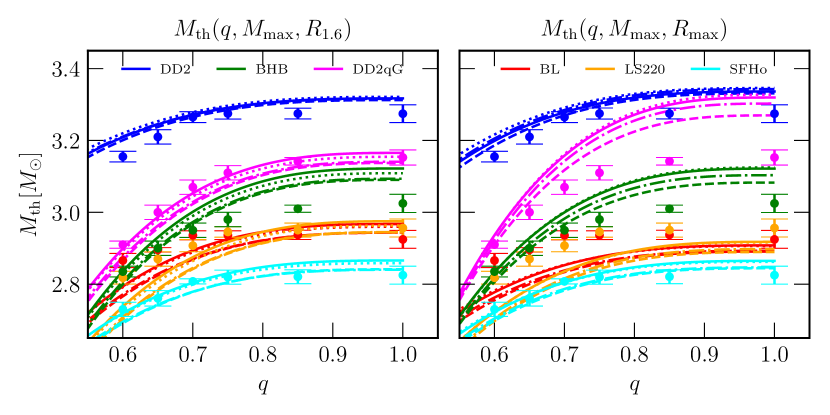
To analyse the dependence of PC on , in Figure 2 we first consider for all EOSs, where (to be conservative) the error bars have been obtained by propagating the errors both on and . Values of and are reported in the Supplemental Material. We first observe that our results do not have a universal behavior for the different EOSs. Second, we notice that a variation of almost a factor of 1.7 in has a small effect on , with the corresponding variation in ranging between 3% and 8%, larger for EOSs with a smaller . This is broadly compatible to what observed in (Bauswein et al., 2020, 2021; Tootle et al., 2021; Kölsch et al., 2021) and should be compared with the larger () variation in or reported in Refs. (Hotokezaka et al., 2011; Bauswein et al., 2012; Köppel et al., 2019; Agathos et al., 2020; Bauswein and Stergioulas, 2019; Bauswein et al., 2020; Kashyap et al., 2021).
Focusing on the behavior of for we observe that, depending on the EOS, can decrease, stay approximately constant or even increase as decreases (see also Kiuchi et al., 2019; Bauswein et al., 2021; Kölsch et al., 2021). We interpret this as the result of the interplay between the binary orbital angular momentum and the incompressibility of nuclear matter, in light of the merger dynamics. For BNSs with and , the central density inside the more massive NS ranges in 0.40-0.49 (depending on the EOS) and the merger is driven by the fusion of two comparable NS cores. If increases steeply enough with , nuclear repulsion contrasts efficiently gravity-driven compression. The net result is that for EOSs with a relatively large (as BL, SFHo and DD2), can stay rather constant or even increase as decreases. On the opposite, if does not increase significantly with and is relatively low (as for DD2qG and BHB), nuclear repulsion is not enough to counterbalance the lack of rotational support and PC occurs for .
Moving to , we notice a clear change of behavior: decreases as decreases for all EOSs. But, once again, the variation depends sensitively on : EOSs characterized by a smaller result not only in smaller , but also in larger relative variations with respect to . We explain this transition in terms of the different merger dynamics. For BNSs at the PC threshold and with , the central density inside the more massive NS increases to 0.5-0.57 , while the secondary NS is more significantly deformed and tidally disrupted during the last orbits. As decreases, the denser core of the more massive NS is compressed by more massive streams of accreting matter (Bauswein et al., 2013a; Dietrich et al., 2015, 2017; Bernuzzi et al., 2020; Bauswein et al., 2020). The nuclear incompressibility still opposes compression, but less efficiently than in the regime. still provides a measure of the NS matter resistance to compression in the relevant density interval and different EOSs result in different relative variations.
Our data qualitatively agree with those from independent simulations recently reported in Refs. (Bauswein and Stergioulas, 2019; Tootle et al., 2021; Kölsch et al., 2021). However, quantitative differences comparable to the overall variation observed in our results are found. This is possibly due to different definitions of PC threshold, gravity treatment or numerical resolutions. A comparison with the some of the available fits is reported in the Supplemental Material. Moreover, our extended set of EOS indicates a sub-leading but significant and systematic EOS dependence emerging for asymmetric binaries, in contrast to a quasi-universal behavior (Tootle et al., 2021).
Figure 2 suggests the existence of two different regimes, separated by , which is largely independent from the EOS. In each of the two regimes, is well described by a linear relation. Thus, for each EOS we fit our data by considering:
| (2) |
We fix in Eq. (2) by imposing the continuity of at and . Moreover, we assume by closely inspecting Figure 2. Least square fits (dashed lines) are performed on the two parameters , corresponding to the slopes of the two linear regimes. The residuals relative to the errors are always smaller than 0.5 and without clear systematic trends both with respect to the EOS and .
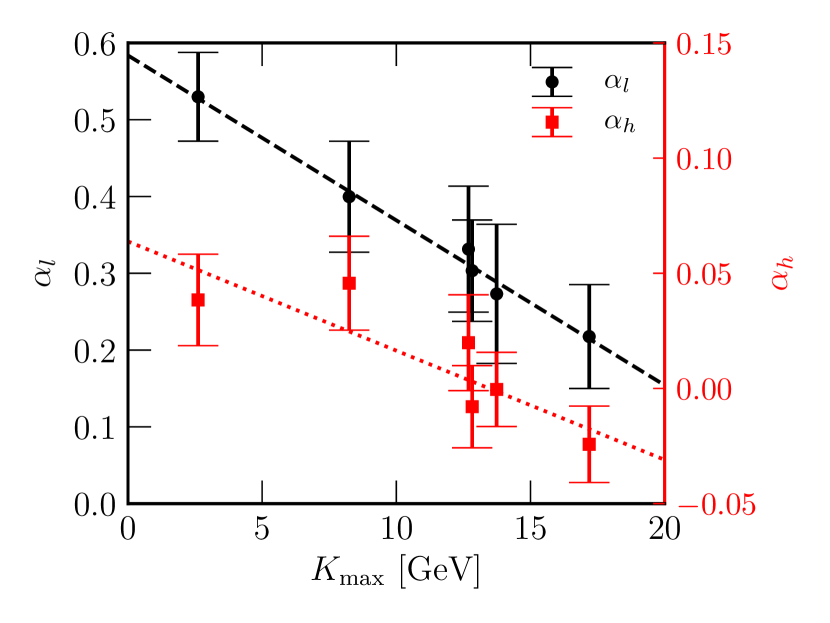
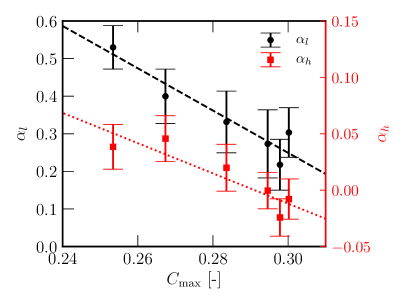
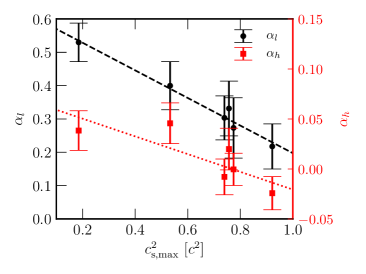
Our simulations reveal a correlation between and supporting the interpretation that the latter is one of the key properties that control the PC. In Figure 3, we represent with their uncertainties as a function of for each EOS. Given the reduced number of EOSs and the relatively large uncertainties, we fit with a first order polynomial in (dashed lines in Figure 3):
| (3) |
The slopes of the linear behaviors observed in Figure 2 usually decrease as the incompressibility increases. This confirms that EOSs with a large incompressibility provide a possible increase in for and a less steep decrease for .
Discussion.- Our results suggest that the determination of at two different ’s, , allows to determine by solving:
| (4) |
where and are defined consistently with Eqs. (2) and (3). To test this, we repeat the previous fits excluding results from the SFHo EOS. The new fitted coefficients, , are compatible to within uncertainties with in Eq. (3). We deduce for SFHo using these new fits and the SFHo results at two different ’s. In particular, we randomly sample the intervals one thousand times to set simulated values for the threshold masses, , and to compute by solving Eq. (4). We finally extract the average relative discrepancy between the computed and actual values. For example, using and we recover to within 2% of its actual value. The uncertainty increases when considering and . In this case, is recovered to within 15%. Our method does not necessarily require the knowledge of at two . For example, using and we recover within 3.5%. The above discrepancies on are compatible with the uncertainties implied by Figure 3.
To further challenge our method, we consider the independent results for from Ref. Tootle et al. (2021) obtained for irrotational NSs and for the TNTYST EOS Togashi et al. (2017), an EOS not included in our sample and for which 111We notice, however, that the TNTYST EOS becomes acausal close to .. We consider the fits, Eq. (3), and we solve Eqs. (4) and (5) using and . Despite possible systematical differences related to the different way to determine , we recover the expected value of to within 25% (6 GeV) of its actual value.
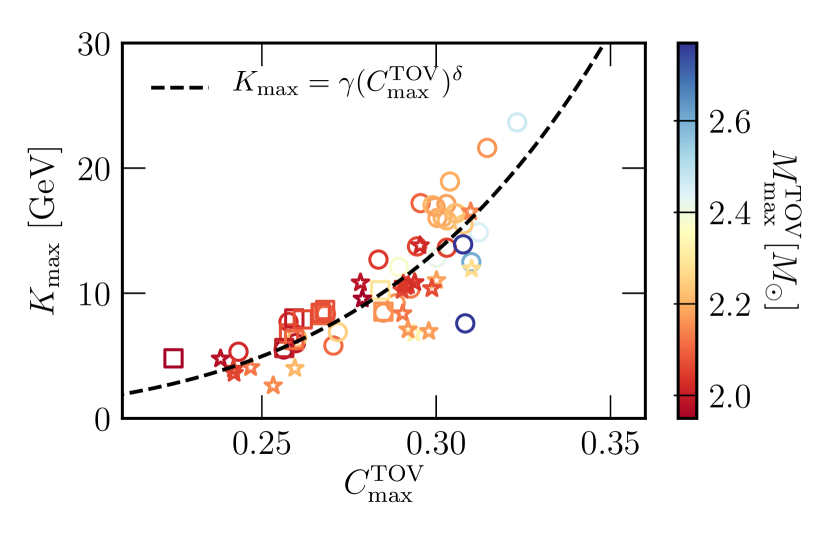
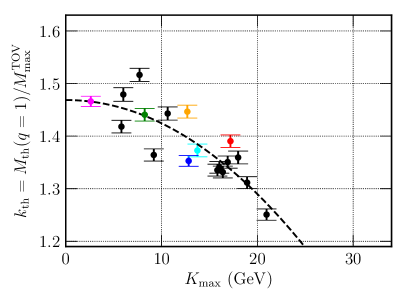
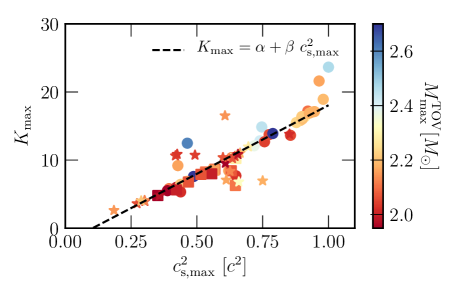
Prompted by these results, we investigate a direct correlation between and and we find that the values of can provide information on the relevant degrees of freedom in ultradense matter. In Figure 4, we present as a function of for a large set of EOSs. In particular, we selected EOSs that stay causal up to and for which . More detailed information can be found in the Supplemental Material. Different symbols refer to different particle contents while colors to . We suggest that large GeV) are more easily associated with purely nucleonic EOSs, while EOSs containing hyperons or showing a phase transition to quarks are characterized by small . A tighter threshold at 12GeV can be observed if only two EOSs containing just and quarks, out a sample of 34 EOSs containing quarks or hyperons, were removed. Moreover, can be fitted in good approximation with a power law, . Standard least squared methods provide and . Despite not being trivial, such a relation is not surprising, since both and depend on the equilibrium response of the heaviest NS to radial perturbations for , and thus on . Moreover, it provides a possible connection between our findings and previous, different fits for expressed in terms of and , both for symmetric and asymmetric mergers (Bauswein et al., 2013b; Köppel et al., 2019; Bauswein et al., 2020, 2021; Kashyap et al., 2021; Kölsch et al., 2021). For example, we have repeated our analysis in terms of rather than , finding comparable results, as reported in the Supplemental Material. Even if this relation directly connects to , we stress that provides a cleaner and more intuitive physical interpretation of the PC behavior for .
This relation, combined with the linear relation first proposed in Ref. (Bauswein et al., 2013b) but with coefficients from Ref. Kashyap et al. (2021), suggests that can be also related to and :
| (5) |
Eqs. (2) and (5) together suggest that can be estimated by the knowledge of only one , if is known:
| (6) |
For example, using the fits while employing and SFHo results as input data, we recover and to within 40% and 1.6%, respectively. Comparable results were obtained from smaller ’s.
The analogy between the definition of and the square of the speed of sound of NS matter, , where is the density of internal energy, suggests that the measurement of the PC threshold at different ’s can also provide constraints on the value of close to . Indeed, the and coefficients of Eq. (2) also correlate with in a comparable way as with and , as visible in the Supplemental Material. Constraints on can provide further insight into the physics governing the EOS of nuclear matter (see e.g. Tews et al., 2018; Capano et al., 2020).
The larger detection horizon associated to massive BNS mergers suggests that, as in the case of GW190425 (Abbott et al., 2020), PCs are a viable observational phenomenon associated to a significant fraction of BNSs that will become accessible in the next GW observing runs (Abbott et al., 2018b, c) and with 3rd generation GW detectors (Punturo et al., 2010; Maggiore et al., 2020; Reitze et al., 2019). While current GW detections allow the precise measurement of the chirp mass and, up to a certain extent, of the total mass, the mass ratio is more uncertain. High enough signal-to-noise ratios and good sky localizations favoring followup EM observations will be key to provide better constraints on . We estimate the possible impact of the uncertainties on and on on the estimate of by solving again Eq. (4), using the fitted coefficients (i.e. considering SFHo as our underlying EOS and removing it from our fitting sample). We randomly sample both and within and , where and are the uncertainties in the determination of . In the case of and , to determine with at least 30% accuracy at 90% confidence level we estimate and . For and , the uncertainties should decrease to and to get a similar accuracy. The difference between the two cases proves that, due to the larger slope of at , the determination of for very asymmetric systems is more constraining. Such uncertainties are within reach of future observations and detectors Borhanian and Sathyaprakash (2022).
More theoretical PC studies will be needed to reduce systematic uncertainties and include more detailed physics. Nevertheless, our results clearly indicate a new and unique way to access critical information on extreme density nuclear physics using observations of promptly collapsing BNS mergers.
Acknowledgements.
Acknowledgments.- A.Pe. thanks Matteo Breschi for useful discussions. A.Pe., D.L. and S.B. acknowledge the INFN for the usage of computing and storage resources through the tullio cluster in Turin. The authors acknowledge the usage of EOS tables from the CompOSE website, https://compose.obspm.fr. D.L. thanks also C. Providencia for providing some EOS tables. A.Pe. and D.L. acknowledge PRACE for awarding them access to Joliot-Curie at GENCI@CEA. A.Pe. also acknowledges the usage of computer resources under a CINECA-INFN agreement (allocation INF20_teongrav and INF21_teongrav). S.B. acknowledges funding from the EU H2020 under ERC Starting Grant, no.BinGraSp-714626, and from the Deutsche Forschungsgemeinschaft, DFG, project MEMI number BE 6301/2-1. D.R. acknowledges funding from the U.S. Department of Energy, Office of Science, Division of Nuclear Physics under Award Number(s) DE-SC0021177 and from the National Science Foundation under Grants No. PHY-2011725, PHY-2020275, PHY-2116686, and AST-2108467. NR simulations were performed on Joliot-Curie at GENCI@CEA (PRACE-ra5202), SuperMUC-LRZ (Gauss project pn56zo), Marconi-CINECA (ISCRA-B project HP10BMHFQQ, INF20_teongrav and INF21_teongrav allocation); Bridges, Comet, Stampede2 (NSF XSEDE allocation TG-PHY160025), NSF/NCSA Blue Waters (NSF AWD-1811236), supercomputers. This research used resources of the National Energy Research Scientific Computing Center, a DOE Office of Science User Facility supported by the Office of Science of the U.S. Department of Energy under Contract No. DE-AC02-05CH11231.References
- Lattimer and Prakash (2016) J. M. Lattimer and M. Prakash, Phys. Rept. 621, 127 (2016), arXiv:1512.07820 [astro-ph.SR] .
- Oertel et al. (2017) M. Oertel, M. Hempel, T. Klähn, and S. Typel, Rev. Mod. Phys. 89, 015007 (2017), arXiv:1610.03361 [astro-ph.HE] .
- Machleidt and Entem (2011) R. Machleidt and D. R. Entem, Phys. Rept. 503, 1 (2011), arXiv:1105.2919 [nucl-th] .
- Chatterjee and Vidaña (2016) D. Chatterjee and I. Vidaña, Eur. Phys. J. A 52, 29 (2016), arXiv:1510.06306 [nucl-th] .
- Logoteta (2021) D. Logoteta, Universe 7, 408 (2021).
- Bombaci et al. (2016) I. Bombaci, D. Logoteta, I. Vidaña, and C. Providência, Eur. Phys. J. A 52, 58 (2016), arXiv:1601.04559 [astro-ph.HE] .
- Braun-Munzinger and Wambach (2009) P. Braun-Munzinger and J. Wambach, Reviews of Modern Physics 81, 1031 (2009).
- Benic et al. (2015) S. Benic, D. Blaschke, D. E. Alvarez-Castillo, T. Fischer, and S. Typel, Astron. Astrophys. 577, A40 (2015), arXiv:1411.2856 [astro-ph.HE] .
- Garg and Colò (2018) U. Garg and G. Colò, Prog. Part. Nucl. Phys. 101, 55 (2018), arXiv:1801.03672 [nucl-ex] .
- Shlomo et al. (2006) S. Shlomo, V. M. Kolomietz, and G. Colò, European Physical Journal A 30, 23 (2006).
- Youngblood et al. (1999) D. H. Youngblood, H. L. Clark, and Y. W. Lui, Phys. Rev. Lett. 82, 691 (1999).
- Stone et al. (2014) J. R. Stone, N. J. Stone, and S. A. Moszkowski, Phys. Rev. C 89, 044316 (2014), arXiv:1404.0744 [nucl-th] .
- Avogadro and Bertulani (2013) P. Avogadro and C. A. Bertulani, Phys. Rev. C 88, 044319 (2013), arXiv:1305.7299 [nucl-th] .
- Demorest et al. (2010) P. Demorest, T. Pennucci, S. Ransom, M. Roberts, and J. Hessels, Nature 467, 1081 (2010), arXiv:1010.5788 [astro-ph.HE] .
- Antoniadis et al. (2013) J. Antoniadis, P. C. Freire, N. Wex, T. M. Tauris, R. S. Lynch, et al., Science 340, 6131 (2013), arXiv:1304.6875 [astro-ph.HE] .
- Cromartie et al. (2019) H. T. Cromartie et al. (NANOGrav), Nature Astron. 4, 72 (2019), arXiv:1904.06759 [astro-ph.HE] .
- Fonseca et al. (2021) E. Fonseca et al., Astrophys. J. Lett. 915, L12 (2021), arXiv:2104.00880 [astro-ph.HE] .
- Miller et al. (2021) M. C. Miller et al., Astrophys. J. Lett. 918, L28 (2021), arXiv:2105.06979 [astro-ph.HE] .
- Riley et al. (2021) T. E. Riley et al., Astrophys. J. Lett. 918, L27 (2021), arXiv:2105.06980 [astro-ph.HE] .
- Zhang and Li (2021) N.-B. Zhang and B.-A. Li, Astrophys. J. 921, 111 (2021), arXiv:2105.11031 [nucl-th] .
- Abbott et al. (2018a) B. P. Abbott et al. (LIGO Scientific, Virgo), Phys. Rev. Lett. 121, 161101 (2018a), arXiv:1805.11581 [gr-qc] .
- De et al. (2018) S. De, D. Finstad, J. M. Lattimer, D. A. Brown, E. Berger, and C. M. Biwer, Phys. Rev. Lett. 121, 091102 (2018), [Erratum: Phys. Rev. Lett.121,no.25,259902(2018)], arXiv:1804.08583 [astro-ph.HE] .
- Radice et al. (2018a) D. Radice, A. Perego, F. Zappa, and S. Bernuzzi, Astrophys. J. 852, L29 (2018a), arXiv:1711.03647 [astro-ph.HE] .
- Radice and Dai (2019) D. Radice and L. Dai, Eur. Phys. J. A55, 50 (2019), arXiv:1810.12917 [astro-ph.HE] .
- Bauswein et al. (2017) A. Bauswein, O. Just, H.-T. Janka, and N. Stergioulas, Astrophys. J. 850, L34 (2017), arXiv:1710.06843 [astro-ph.HE] .
- Margalit and Metzger (2017) B. Margalit and B. D. Metzger, Astrophys. J. 850, L19 (2017), arXiv:1710.05938 [astro-ph.HE] .
- Most et al. (2018) E. R. Most, L. R. Weih, L. Rezzolla, and J. Schaffner-Bielich, Phys. Rev. Lett. 120, 261103 (2018), arXiv:1803.00549 [gr-qc] .
- Breschi et al. (2021) M. Breschi, A. Perego, S. Bernuzzi, W. Del Pozzo, V. Nedora, D. Radice, and D. Vescovi, Mon. Not. Roy. Astron. Soc. 505, 1661 (2021), arXiv:2101.01201 [astro-ph.HE] .
- Raaijmakers et al. (2021) G. Raaijmakers, S. K. Greif, K. Hebeler, T. Hinderer, S. Nissanke, A. Schwenk, T. E. Riley, A. L. Watts, J. M. Lattimer, and W. C. G. Ho, Astrophys. J. Lett. 918, L29 (2021), arXiv:2105.06981 [astro-ph.HE] .
- Pang et al. (2021) P. T. H. Pang, I. Tews, M. W. Coughlin, M. Bulla, C. Van Den Broeck, and T. Dietrich, Astrophys. J. 922, 14 (2021), arXiv:2105.08688 [astro-ph.HE] .
- Hotokezaka et al. (2013a) K. Hotokezaka, K. Kiuchi, K. Kyutoku, H. Okawa, Y.-i. Sekiguchi, et al., Phys.Rev. D87, 024001 (2013a), arXiv:1212.0905 [astro-ph.HE] .
- Hotokezaka et al. (2013b) K. Hotokezaka, K. Kiuchi, K. Kyutoku, T. Muranushi, Y.-i. Sekiguchi, et al., Phys.Rev. D88, 044026 (2013b), arXiv:1307.5888 [astro-ph.HE] .
- Bauswein et al. (2013a) A. Bauswein, S. Goriely, and H.-T. Janka, Astrophys.J. 773, 78 (2013a), arXiv:1302.6530 [astro-ph.SR] .
- Agathos et al. (2020) M. Agathos, F. Zappa, S. Bernuzzi, A. Perego, M. Breschi, and D. Radice, Phys. Rev. D101, 044006 (2020), arXiv:1908.05442 [gr-qc] .
- Radice et al. (2018b) D. Radice, A. Perego, K. Hotokezaka, S. A. Fromm, S. Bernuzzi, and L. F. Roberts, Astrophys. J. 869, 130 (2018b), arXiv:1809.11161 [astro-ph.HE] .
- Bernuzzi et al. (2020) S. Bernuzzi et al., Mon. Not. Roy. Astron. Soc. (2020), 10.1093/mnras/staa1860, arXiv:2003.06015 [astro-ph.HE] .
- Shibata et al. (2005) M. Shibata, K. Taniguchi, and K. Uryu, Phys. Rev. D71, 084021 (2005), arXiv:gr-qc/0503119 .
- Hotokezaka et al. (2011) K. Hotokezaka, K. Kyutoku, H. Okawa, M. Shibata, and K. Kiuchi, Phys.Rev. D83, 124008 (2011), arXiv:1105.4370 [astro-ph.HE] .
- Bauswein et al. (2013b) A. Bauswein, T. Baumgarte, and H. T. Janka, Phys.Rev.Lett. 111, 131101 (2013b), arXiv:1307.5191 [astro-ph.SR] .
- Köppel et al. (2019) S. Köppel, L. Bovard, and L. Rezzolla, Astrophys. J. 872, L16 (2019), arXiv:1901.09977 [gr-qc] .
- Bauswein and Stergioulas (2019) A. Bauswein and N. Stergioulas, J. Phys. G 46, 113002 (2019), arXiv:1901.06969 [gr-qc] .
- Bauswein et al. (2020) A. Bauswein, S. Blacker, V. Vijayan, N. Stergioulas, K. Chatziioannou, J. A. Clark, N.-U. F. Bastian, D. B. Blaschke, M. Cierniak, and T. Fischer, Phys. Rev. Lett. 125, 141103 (2020), arXiv:2004.00846 [astro-ph.HE] .
- Kashyap et al. (2021) R. Kashyap et al., (2021), arXiv:2111.05183 [astro-ph.HE] .
- Bauswein et al. (2021) A. Bauswein, S. Blacker, G. Lioutas, T. Soultanis, V. Vijayan, and N. Stergioulas, Phys. Rev. D 103, 123004 (2021), arXiv:2010.04461 [astro-ph.HE] .
- Tootle et al. (2021) S. D. Tootle, L. J. Papenfort, E. R. Most, and L. Rezzolla, (2021), arXiv:2109.00940 [gr-qc] .
- Kölsch et al. (2021) M. Kölsch, T. Dietrich, M. Ujevic, and B. Bruegmann, (2021), arXiv:2112.11851 [gr-qc] .
- Bauswein et al. (2012) A. Bauswein, H. Janka, K. Hebeler, and A. Schwenk, Phys.Rev. D86, 063001 (2012), arXiv:1204.1888 [astro-ph.SR] .
- Bombaci and Logoteta (2018) I. Bombaci and D. Logoteta, Astron. Astrophys. 609, A128 (2018), arXiv:1805.11846 [astro-ph.HE] .
- Logoteta et al. (2020) D. Logoteta, A. Perego, and I. Bombaci, (2020), 10.1051/0004-6361/202039457, arXiv:2012.03599 [nucl-th] .
- Steiner et al. (2013) A. W. Steiner, M. Hempel, and T. Fischer, Astrophys. J. 774, 17 (2013), arXiv:1207.2184 [astro-ph.SR] .
- Typel et al. (2010) S. Typel, G. Ropke, T. Klahn, D. Blaschke, and H. H. Wolter, Phys. Rev. C81, 015803 (2010), arXiv:0908.2344 [nucl-th] .
- Hempel and Schaffner-Bielich (2010) M. Hempel and J. Schaffner-Bielich, Nucl. Phys. A837, 210 (2010), arXiv:0911.4073 [nucl-th] .
- Lattimer and Swesty (1991) J. M. Lattimer and F. D. Swesty, Nucl. Phys. A535, 331 (1991).
- Banik et al. (2014) S. Banik, M. Hempel, and D. Bandyopadhyay, Astrophys. J. Suppl. 214, 22 (2014), arXiv:1404.6173 [astro-ph.HE] .
- Kiuchi et al. (2019) K. Kiuchi, K. Kyohei, K. Kyutoku, Y. Sekiguchi, and M. Shibata, (2019), arXiv:1907.03790 [astro-ph.HE] .
- Dietrich et al. (2015) T. Dietrich, N. Moldenhauer, N. K. Johnson-McDaniel, S. Bernuzzi, C. M. Markakis, B. Brügmann, and W. Tichy, Phys. Rev. D92, 124007 (2015), arXiv:1507.07100 [gr-qc] .
- Dietrich et al. (2017) T. Dietrich, M. Ujevic, W. Tichy, S. Bernuzzi, and B. Brügmann, Phys. Rev. D95, 024029 (2017), arXiv:1607.06636 [gr-qc] .
- Togashi et al. (2017) H. Togashi, K. Nakazato, Y. Takehara, S. Yamamuro, H. Suzuki, and M. Takano, Nucl. Phys. A 961, 78 (2017), arXiv:1702.05324 [nucl-th] .
- Bastian (2021) N.-U. F. Bastian, Phys. Rev. D 103, 023001 (2021), arXiv:2009.10846 [nucl-th] .
- Tews et al. (2018) I. Tews, J. Carlson, S. Gandolfi, and S. Reddy, Astrophys. J. 860, 149 (2018), arXiv:1801.01923 [nucl-th] .
- Capano et al. (2020) C. D. Capano, I. Tews, S. M. Brown, B. Margalit, S. De, S. Kumar, D. A. Brown, B. Krishnan, and S. Reddy, Nature Astron. 4, 625 (2020), arXiv:1908.10352 [astro-ph.HE] .
- Abbott et al. (2020) B. Abbott et al. (LIGO Scientific, Virgo), Astrophys. J. Lett. 892, L3 (2020), arXiv:2001.01761 [astro-ph.HE] .
- Abbott et al. (2018b) B. P. Abbott et al. (VIRGO, KAGRA, LIGO Scientific), Living Rev. Rel. 21, 3 (2018b), [Living Rev. Rel.19,1(2016)], arXiv:1304.0670 [gr-qc] .
- Abbott et al. (2018c) B. P. Abbott et al. (KAGRA, LIGO Scientific, Virgo, VIRGO), Living Rev. Rel. 21, 3 (2018c), arXiv:1304.0670 [gr-qc] .
- Punturo et al. (2010) M. Punturo, M. Abernathy, F. Acernese, B. Allen, N. Andersson, et al., Class.Quant.Grav. 27, 194002 (2010).
- Maggiore et al. (2020) M. Maggiore et al., JCAP 03, 050 (2020), arXiv:1912.02622 [astro-ph.CO] .
- Reitze et al. (2019) D. Reitze, R. X. Adhikari, S. Ballmer, B. Barish, L. Barsotti, G. Billingsley, D. A. Brown, Y. Chen, D. Coyne, R. Eisenstein, M. Evans, P. Fritschel, E. D. Hall, A. Lazzarini, G. Lovelace, J. Read, B. S. Sathyaprakash, D. Shoemaker, J. Smith, C. Torrie, S. Vitale, R. Weiss, C. Wipf, and M. Zucker, in Bulletin of the American Astronomical Society, Vol. 51 (2019) p. 35, arXiv:1907.04833 [astro-ph.IM] .
- Borhanian and Sathyaprakash (2022) S. Borhanian and B. S. Sathyaprakash, (2022), arXiv:2202.11048 [gr-qc] .
I Supplemental Material
I.1 Simulation sample
We evolve our BNSs using the publicly available WhiskyTHC code Radice and Rezzolla (2012); Radice et al. (2014a, b), built on the top of the EinsteinToolkit Loffler et al. (2012). WhiskyTHC solves general relativistic hydrodynamics in conservative form using high-resolution shock-capturing finite-volume schemes based on high-order reconstruction operators. The spacetime metric is evolved in the Z4c formulation of Einstein’s equations Bernuzzi and Hilditch (2010); Hilditch et al. (2013) implemented by the CTGamma module Pollney et al. (2011); Reisswig et al. (2013) of EinsteinToolkit.
To properly resolve the merger dynamics, we employ an adaptive mesh refinement consisting in seven nested grids with 1:2 linear scaling between consecutive grids and provided by the Carpet library Schnetter et al. (2004). The latter implements the Berger-Oliger scheme with refluxing Berger and Oliger (1984); Berger and Colella (1989). The resolution of the innermost grid, , characterizes each simulation and we distinguish between low (, LR), standard (, SR) and high (, HR) resolutions. More details on the grid setup were discussed in detail in Ref. Radice et al. (2018). All simulations were performed with microphysical EOS, also accounting for neutrino emission using the leakage scheme discussed in Galeazzi et al. (2013); Radice et al. (2016).
Initial conditions are obtained by the pseudospectral elliptic solver Lorene Gourgoulhon et al. (2001). The initial separation between the centers of the two stars is typically taken to be .
All configuration immediately above or below were run at least at two resolutions (LR and SR). For a few selected cases we performed also HR runs. In total, we performed 250 BNS merger simulations: 125 at LR, 116 at SR and 9 at HR. The PC threshold and its error have been computed using the two highest available resolutions. Thus the error bars include numerical resolution uncertainty. A summary of our results is reported in Table (1).
| EOS | ||||||
|---|---|---|---|---|---|---|
| BL | ||||||
| DD2 | ||||||
| LS220 | ||||||
| SFHo | ||||||
| BHB | ||||||
| DD2qG | ||||||
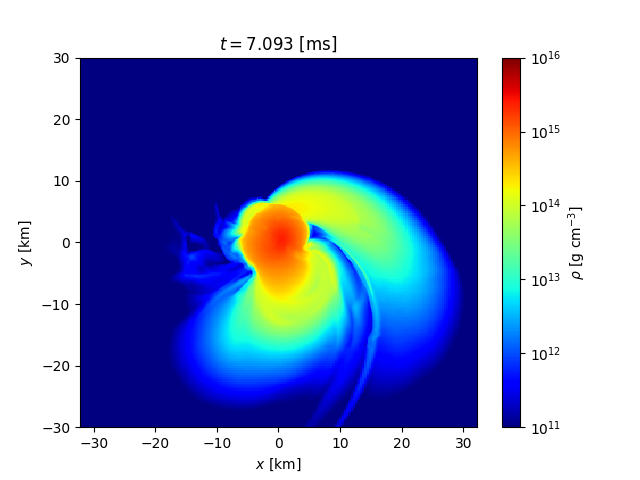
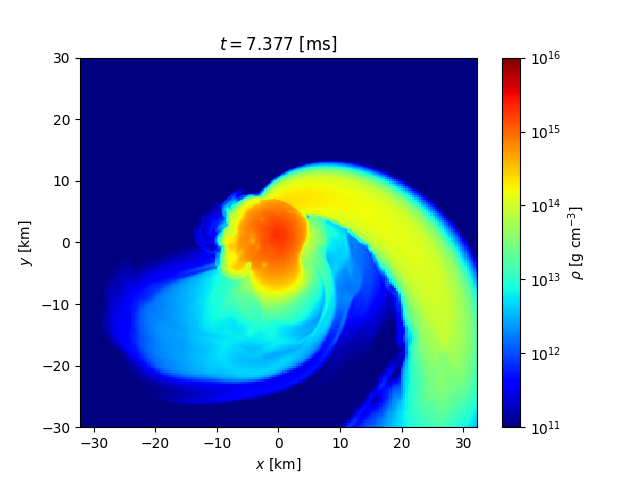
In Figure 5, we present the rest mass density on the orbital plane just after merger for a and for two SR simulations characterized by (left panel) and (right panel) to highlight quantitative differences. Tidal interaction and deformation is present in both cases, but with different features. In the case, the two NS cores are mostly preserved during the late inspiral and the subsequent remnant dynamics is governed by the core fusion process. This is visible in the left panel of Figure 5 where, opposite to the tidal tail produced by the tidal stripping of secondary NS, a larger amount of shocked matter is expelled as consequence of the collision of the two cores. As decreases further below , the secondary NS is more significantly deformed during the last orbits and even its core gets affected. A significant accretion stream flows from the deformed core of the secondary toward the primary such that the debris of the secondary form an envelop that wraps the primary NS up (Bauswein et al., 2013a; Dietrich et al., 2015, 2017; Bernuzzi et al., 2020; Bauswein et al., 2020). This prominent change in the dynamics is visible in the right panel of of Figure 5 where the tidal tail of the secondary is now much more relevant and the interaction between the two cores happens in form of an accretion stream rather than of the fusion of two comparable cores.
I.2 Nuclear Incompressibility
In Table (2), we report some of the relevant properties of all the EOSs used to produce figure 4 of the main text. For each EOS, in addition to the name, we report the mass and the radius of the heaviest NS, respectively, its central density, , and the incompressibility at , . Overall, our sample consists of 66 cold, beta equilibrated EOSs. Among them, 12 include hyperons and 22 model a phase transition to quark matter.
| EOS | Ref. | EOS | Ref. | ||||||||
|---|---|---|---|---|---|---|---|---|---|---|---|
| [GeV] | [GeV] | ||||||||||
| ALF2 | 1.99 | 11.31 | 6.05 | 6.0 | Alford et al. (2005) | BA | 2.60 | 12.39 | 4.72 | 12.4 | Fattoyev et al. (2018) |
| BHB | 2.10 | 11.59 | 5.94 | 8.2 | Banik et al. (2014) | BL | 2.10 | 10.50 | 7.18 | 17.2 | Bombaci and Logoteta (2018); Logoteta et al. (2020) |
| BSK20 | 2.16 | 10.16 | 7.03 | 21.6 | Pearson et al. (2011) | BSK21 | 2.27 | 10.99 | 6.09 | 16.3 | Pearson et al. (2012) |
| CMF | 2.10 | 11.58 | 5.94 | 8.3 | Dexheimer and Schramm (2008) | CMFy | 2.07 | 11.58 | 5.72 | 6.7 | Dexheimer et al. (2015) |
| CMFy1 | 2.00 | 11.51 | 5.00 | 5.6 | Dexheimer et al. (2015) | CMFy2 | 2.07 | 11.42 | 6.13 | 8.6 | Dexheimer et al. (2015) |
| CMFy3 | 2.07 | 11.47 | 6.02 | 8.4 | Dexheimer et al. (2015) | DD2 | 2.42 | 11.90 | 5.26 | 12.8 | Typel et al. (2010); Hempel et al. (2012) |
| DD2F-RDF (1.1) | 2.14 | 10.21 | 7.17 | 16.5 | Bastian (2021) | DD2F-RDF (1.2) | 2.16 | 10.95 | 6.42 | 7.09 | Bastian (2021) |
| DD2F-RDF (1.3) | 2.04 | 10.37 | 7.28 | 10.74 | Bastian (2021) | DD2F-RDF (1.4) | 2.03 | 10.21 | 7.27 | 10.86 | Bastian (2021) |
| DD2F-RDF (1.5) | 2.04 | 10.34 | 7.27 | 10.63 | Bastian (2021) | DD2F-RDF (1.6) | 2.02 | 10.09 | 7.64 | 13.81 | Bastian (2021) |
| DD2F-RDF (1.7) | 2.13 | 10.81 | 6.67 | 8.37 | Bastian (2021) | DD2F-RDF (1.8) | 2.07 | 10.22 | 7.30 | 10.38 | Bastian (2021) |
| DD2F-RDF (1.9) | 2.17 | 10.78 | 6.44 | 6.69 | Bastian (2021) | DD2qG | 2.15 | 12.53 | 5.11 | 2.6 | Kashyap et al. (2021) |
| DDH | 2.16 | 11.19 | 6.09 | 8.4 | Douchin and Haensel (2001) | DDHy | 2.04 | 11.31 | 6.02 | 8.5 | Oertel et al. (2015) |
| DD2hyp1 | 2.00 | 11.37 | 6.28 | 8.0 | Fortin et al. (2017) | DD2hyp2 | 2.06 | 11.65 | 5.90 | 7.9 | Fortin et al. (2017) |
| GM1 | 2.38 | 12.14 | 5.26 | 12.0 | Glendenning and Moszkowski (1991) | GM1y1 | 2.29 | 11.90 | 5.26 | 10.1 | Oertel et al. (2015) |
| GM1y2 | 2.11 | 12.01 | 5.27 | 6.2 | Oertel et al. (2015) | H3 | 1.70 | 11.17 | 6.84 | 4.7 | Glendenning and Moszkowski (1991); Lackey et al. (2006); Read et al. (2009) |
| H4 | 2.02 | 11.62 | 5.98 | 7.7 | Glendenning and Moszkowski (1991); Lackey et al. (2006); Read et al. (2009) | HB | 2.45 | 11.59 | 4.21 | 14.8 | Glendenning and Moszkowski (1991); Lackey et al. (2006); Read et al. (2009) |
| HOLO | 2.33 | 11.71 | 5.23 | 6.8 | Jokela et al. (2021) | IUFSU | 1.95 | 11.23 | 6.33 | 5.5 | Roca-Maza et al. (2011) |
| LS220 | 2.04 | 10.65 | 7.03 | 12.6 | Lattimer and Swesty (1991) | MPA1 | 2.47 | 11.28 | 5.49 | 23.6 | Müther et al. (1987) |
| MS1 | 2.76 | 13.26 | 4.21 | 7.5 | Müller and Serot (1996) | NL3 | 2.79 | 13.38 | 4.11 | 13.9 | Shen et al. (2011) |
| OOS1 | 2.05 | 12.54 | 4.93 | 3.9 | Otto et al. (2020a) | OOS2 | 2.12 | 12.72 | 4.74 | 4.0 | Otto et al. (2020b) |
| OOS3 | 1.94 | 13.02 | 4.22 | 2.5 | Otto et al. (2020b) | QHC18 | 2.04 | 10.36 | 7.07 | 10.5 | Baym et al. (2018) |
| QHC19A | 1.92 | 10.21 | 7.48 | 9.5 | Baym et al. (2019) | QHC19B | 2.06 | 10.51 | 6.85 | 10.2 | Baym et al. (2019) |
| QHC19C | 2.18 | 10.73 | 6.43 | 11.0 | Baym et al. (2019) | QHC19D | 2.27 | 10.83 | 6.21 | 11.9 | Baym et al. (2019) |
| SFHo | 2.05 | 10.32 | 7.18 | 13.7 | Steiner et al. (2013) | SFHx | 2.13 | 10.74 | 6.59 | 10.3 | Steiner et al. (2013) |
| SKa | 2.20 | 10.90 | 6.39 | 17.0 | Gulminelli and Raduta (2015) | SKb | 2.18 | 10.62 | 6.62 | 17.1 | Gulminelli and Raduta (2015) |
| SkI6 | 2.19 | 10.76 | 6.47 | 16.0 | Gulminelli and Raduta (2015) | SLy4 | 2.05 | 10.01 | 6.47 | 13.6 | Chabanat et al. (1998) |
| SRO(0) | 2.20 | 10.74 | 6.51 | 15.8 | Schneider et al. (2017); Kashyap et al. (2021) | SRO(2) | 2.16 | 11.06 | 6.40 | 9.1 | Schneider et al. (2017); Kashyap et al. (2021) |
| SRO(3) | 2.23 | 10.71 | 6.46 | 15.5 | Schneider et al. (2017); Kashyap et al. (2021) | SRO(4) | 2.20 | 10.75 | 6.53 | 16.0 | Schneider et al. (2017); Kashyap et al. (2021) |
| SRO(5) | 2.19 | 10.65 | 6.64 | 18.9 | Schneider et al. (2017); Kashyap et al. (2021) | SRO(6) | 2.10 | 11.50 | 6.04 | 5.8 | Schneider et al. (2017); Kashyap et al. (2021) |
| SRO(7) | 2.22 | 10.72 | 6.53 | 16.3 | Schneider et al. (2017); Kashyap et al. (2021) | SRO(8) | 2.18 | 10.73 | 6.67 | 16.8 | Schneider et al. (2017); Kashyap et al. (2021) |
| TM1 | 2.21 | 12.56 | 5.15 | 6.4 | Shen et al. (1998); Hempel and Schaffner-Bielich (2010) | TM1-2 | 2.25 | 12.23 | 5.28 | 6.8 | Logoteta et al. (2022) |
| TM1-2q1 | 2.06 | 12.56 | 5.10 | 6.7 | Logoteta et al. (2022) | TM1-2q2 | 2.21 | 12.57 | 5.03 | 4.0 | Logoteta et al. (2022) |
| TM1-2y | 1.98 | 12.27 | 5.42 | 4.7 | Logoteta et al. (2022) | TMA | 2.02 | 12.27 | 5.60 | 5.3 | Sugahara and Toki (1994) |
I.3 Alternative analysis and comparison with exisiting fits
As highlighted in the main text, the relation between and implied by figure 4 suggests the possibility of repeating the PC analysis in terms of a single variable, either or . We first consider the data presented in Ref. (Kashyap et al., 2021) for which the linear fit was proposed (see e.g. Bauswein et al., 2013b). By inserting the ansatz , we obtain . Standard least square methods yield to , and . The points and the result of the fit are reported in the left panel of Figure 6. However, the fit in should be preferred since it provides a tighter correlation and it uses one fitting parameter less.
Additionally, we repeat our analysis in terms of . In the right panel of Figure 6, we present fits for the coefficients introduced in equation 2 of the main text in terms of . The results are:
| (7) |
The quality of the fits (estimated for example by the adjusted coefficient of determination, ) are comparable, but overall slightly worse than the ones obtained in the main text for : moves from 0.70 and 0.99 for the fits in to 0.76 and 0.88 for the fits in , for the high- and low- fits, respectively.
Finally, given the analogy between the definition of (equation 1 of the main text) and the square of the speed of sound of NS matter, , where and are the pressure and the density of internal energy, and is the symmetry parameter for NS matter in neutrinoless weak equilibrium, we investigate also the relation between and , defined as the square of the speed of sound at . In the left panel of Figure 7 we present as a function of for all the EOSs in Table (2). With the exception of a few outliers, a linear relation between and holds. We perform a linear interpolation, , finding and , with . For approaching unity, a possible divergence or an upper limit for are suggested. However, no firm conclusions can be drawn from the paucity of models and from the intrinsic limitation of non-relativistic nucleonic EOSs in modeling such a regime. Motivated by this result, we repeat our analysis also in terms of . In the right panel of Figure 7, we present fits for the coefficients introduced in equation 2 of the main text as a function of . The results are:
| (8) |
Also in this case, the quality of the fits are comparable, but overall slightly worse, than the ones obtained in the main text for : is 0.60 and 0.95 for the high- and low- fits, respectively.
The study of the behavior of has been the subject of several recent works, that provided useful fits in different variables and according to different ansatz. Tootle et al. Tootle et al. (2021) and Kolsch et al. Kölsch et al. (2021) used a definition of PC that is not equivalent to ours. Despite providing similar results, the average and the maximum variations between the two methods reported by Ref. Tootle et al. (2021) are larger than our numerical errors and comparable to the overall variation we are interested to model. Moreover, Ref. Tootle et al. (2021) studied the possible existence of a quasi-universal relation, while here we focus on a EOS dependent relation. Thus, we abstain from a detailed comparison with the results reported in these two works. On the other hand, our definition of PC is equivalent to the one used in (Bauswein et al., 2021) and thus we can compare our results with the polynomial fits discussed in (Bauswein et al., 2021) and presented in their equation 10. In Figure 8, we compare our results with all the sets of fits (”b”, ”b+h”, ”b+e”, ”b+h+e”) reported in their table VI for and . We note that the fit in predicts results that are, on average, closer to ours than the fit in , despite the fact that the latter shares the same set of independent variables. However, for most of the EOSs, differences larger than our numerical uncertainties and than the fit residuals reported in Bauswein et al. (2021) can be observed between the fits and our results in at least a portion of the relevant interval. In particular, both the fits are not able to reproduce the slight increase in for for the BLh EOS, as also observed by Kolsch et al. for other EOSs Kölsch et al. (2021).
References
- Radice and Rezzolla (2012) D. Radice and L. Rezzolla, Astron. Astrophys. 547, A26 (2012), arXiv:1206.6502 [astro-ph.IM] .
- Radice et al. (2014a) D. Radice, L. Rezzolla, and F. Galeazzi, Mon.Not.Roy.Astron.Soc. 437, L46 (2014a), arXiv:1306.6052 [gr-qc] .
- Radice et al. (2014b) D. Radice, L. Rezzolla, and F. Galeazzi, Class.Quant.Grav. 31, 075012 (2014b), arXiv:1312.5004 [gr-qc] .
- Loffler et al. (2012) F. Loffler et al., Class. Quant. Grav. 29, 115001 (2012), arXiv:1111.3344 [gr-qc] .
- Bernuzzi and Hilditch (2010) S. Bernuzzi and D. Hilditch, Phys. Rev. D81, 084003 (2010), arXiv:0912.2920 [gr-qc] .
- Hilditch et al. (2013) D. Hilditch, S. Bernuzzi, M. Thierfelder, Z. Cao, W. Tichy, and B. Bruegmann, Phys. Rev. D88, 084057 (2013), arXiv:1212.2901 [gr-qc] .
- Pollney et al. (2011) D. Pollney, C. Reisswig, E. Schnetter, N. Dorband, and P. Diener, Phys. Rev. D83, 044045 (2011), arXiv:0910.3803 [gr-qc] .
- Reisswig et al. (2013) C. Reisswig, C. Ott, E. Abdikamalov, R. Haas, P. Mösta, et al., Phys.Rev.Lett. 111, 151101 (2013), arXiv:1304.7787 [astro-ph.CO] .
- Schnetter et al. (2004) E. Schnetter, S. H. Hawley, and I. Hawke, Class.Quant.Grav. 21, 1465 (2004), arXiv:gr-qc/0310042 [gr-qc] .
- Berger and Oliger (1984) M. J. Berger and J. Oliger, J.Comput.Phys. 53, 484 (1984).
- Berger and Colella (1989) M. J. Berger and P. Colella, Journal of Computational Physics 82, 64 (1989).
- Radice et al. (2018) D. Radice, A. Perego, K. Hotokezaka, S. A. Fromm, S. Bernuzzi, and L. F. Roberts, Astrophys. J. 869, 130 (2018), arXiv:1809.11161 [astro-ph.HE] .
- Galeazzi et al. (2013) F. Galeazzi, W. Kastaun, L. Rezzolla, and J. A. Font, Phys.Rev. D88, 064009 (2013), arXiv:1306.4953 [gr-qc] .
- Radice et al. (2016) D. Radice, F. Galeazzi, J. Lippuner, L. F. Roberts, C. D. Ott, and L. Rezzolla, Mon. Not. Roy. Astron. Soc. 460, 3255 (2016), arXiv:1601.02426 [astro-ph.HE] .
- Gourgoulhon et al. (2001) E. Gourgoulhon, P. Grandclement, K. Taniguchi, J.-A. Marck, and S. Bonazzola, Phys.Rev. D63, 064029 (2001), arXiv:gr-qc/0007028 [gr-qc] .
- Bauswein et al. (2013a) A. Bauswein, S. Goriely, and H.-T. Janka, Astrophys.J. 773, 78 (2013a), arXiv:1302.6530 [astro-ph.SR] .
- Dietrich et al. (2015) T. Dietrich, N. Moldenhauer, N. K. Johnson-McDaniel, S. Bernuzzi, C. M. Markakis, B. Brügmann, and W. Tichy, Phys. Rev. D92, 124007 (2015), arXiv:1507.07100 [gr-qc] .
- Dietrich et al. (2017) T. Dietrich, M. Ujevic, W. Tichy, S. Bernuzzi, and B. Brügmann, Phys. Rev. D95, 024029 (2017), arXiv:1607.06636 [gr-qc] .
- Bernuzzi et al. (2020) S. Bernuzzi et al., Mon. Not. Roy. Astron. Soc. (2020), 10.1093/mnras/staa1860, arXiv:2003.06015 [astro-ph.HE] .
- Bauswein et al. (2020) A. Bauswein, S. Blacker, V. Vijayan, N. Stergioulas, K. Chatziioannou, J. A. Clark, N.-U. F. Bastian, D. B. Blaschke, M. Cierniak, and T. Fischer, Phys. Rev. Lett. 125, 141103 (2020), arXiv:2004.00846 [astro-ph.HE] .
- Alford et al. (2005) M. Alford, M. Braby, M. W. Paris, and S. Reddy, Astrophys. J. 629, 969 (2005), arXiv:nucl-th/0411016 .
- Fattoyev et al. (2018) F. J. Fattoyev, J. Piekarewicz, and C. J. Horowitz, Phys. Rev. Lett. 120, 172702 (2018), arXiv:1711.06615 [nucl-th] .
- Banik et al. (2014) S. Banik, M. Hempel, and D. Bandyopadhyay, Astrophys. J. Suppl. 214, 22 (2014), arXiv:1404.6173 [astro-ph.HE] .
- Bombaci and Logoteta (2018) I. Bombaci and D. Logoteta, Astron. Astrophys. 609, A128 (2018), arXiv:1805.11846 [astro-ph.HE] .
- Logoteta et al. (2020) D. Logoteta, A. Perego, and I. Bombaci, (2020), 10.1051/0004-6361/202039457, arXiv:2012.03599 [nucl-th] .
- Pearson et al. (2011) J. M. Pearson, S. Goriely, and N. Chamel, Phys. Rev. C 83, 065810 (2011).
- Pearson et al. (2012) J. M. Pearson, N. Chamel, S. Goriely, and C. Ducoin, Phys. Rev. C 85, 065803 (2012), arXiv:1206.0205 [nucl-th] .
- Dexheimer and Schramm (2008) V. Dexheimer and S. Schramm, Astrophys. J. 683, 943 (2008), arXiv:0802.1999 [astro-ph] .
- Dexheimer et al. (2015) V. Dexheimer, R. Negreiros, and S. Schramm, Phys. Rev. C 92, 012801 (2015), arXiv:1503.07785 [astro-ph.HE] .
- Typel et al. (2010) S. Typel, G. Ropke, T. Klahn, D. Blaschke, and H. H. Wolter, Phys. Rev. C81, 015803 (2010), arXiv:0908.2344 [nucl-th] .
- Hempel et al. (2012) M. Hempel, T. Fischer, J. Schaffner-Bielich, and M. Liebendorfer, Astrophys. J. 748, 70 (2012), arXiv:1108.0848 [astro-ph.HE] .
- Bastian (2021) N.-U. F. Bastian, Phys. Rev. D 103, 023001 (2021), arXiv:2009.10846 [nucl-th] .
- Kashyap et al. (2021) R. Kashyap et al., (2021), arXiv:2111.05183 [astro-ph.HE] .
- Douchin and Haensel (2001) F. Douchin and P. Haensel, Astron. Astrophys. 380, 151 (2001), astro-ph/0111092 .
- Oertel et al. (2015) M. Oertel, C. Providência, F. Gulminelli, and A. R. Raduta, J. Phys. G 42, 075202 (2015), arXiv:1412.4545 [nucl-th] .
- Fortin et al. (2017) M. Fortin, S. S. Avancini, C. Providência, and I. Vidaña, Phys. Rev. C 95, 065803 (2017), arXiv:1701.06373 [nucl-th] .
- Glendenning and Moszkowski (1991) N. K. Glendenning and S. A. Moszkowski, Phys. Rev. Lett. 67, 2414 (1991).
- Lackey et al. (2006) B. D. Lackey, M. Nayyar, and B. J. Owen, Phys. Rev. D 73, 024021 (2006), arXiv:astro-ph/0507312 .
- Read et al. (2009) J. S. Read, C. Markakis, M. Shibata, K. Uryu, J. D. Creighton, et al., Phys.Rev. D79, 124033 (2009), arXiv:0901.3258 [gr-qc] .
- Jokela et al. (2021) N. Jokela, M. Järvinen, G. Nijs, and J. Remes, Phys. Rev. D 103, 086004 (2021), arXiv:2006.01141 [hep-ph] .
- Roca-Maza et al. (2011) X. Roca-Maza, X. Vinas, M. Centelles, P. Ring, and P. Schuck, Phys. Rev. C 84, 054309 (2011), [Erratum: Phys.Rev.C 93, 069905 (2016)], arXiv:1110.2311 [nucl-th] .
- Lattimer and Swesty (1991) J. M. Lattimer and F. D. Swesty, Nucl. Phys. A535, 331 (1991).
- Müther et al. (1987) H. Müther, M. Prakash, and T. L. Ainsworth, Phys. Lett. B 199, 469 (1987).
- Müller and Serot (1996) H. Müller and B. D. Serot, Nucl. Phys. A606, 508 (1996), arXiv:nucl-th/9603037 [nucl-th] .
- Shen et al. (2011) G. Shen, C. J. Horowitz, and S. Teige, (2011), arXiv:1101.3715 [astro-ph.SR] .
- Otto et al. (2020a) K. Otto, M. Oertel, and B.-J. Schaefer, Phys. Rev. D 101, 103021 (2020a), arXiv:1910.11929 [hep-ph] .
- Otto et al. (2020b) K. Otto, M. Oertel, and B.-J. Schaefer, Eur. Phys. J. ST 229, 3629 (2020b), arXiv:2007.07394 [hep-ph] .
- Baym et al. (2018) G. Baym, T. Hatsuda, T. Kojo, P. D. Powell, Y. Song, and T. Takatsuka, Rept. Prog. Phys. 81, 056902 (2018), arXiv:1707.04966 [astro-ph.HE] .
- Baym et al. (2019) G. Baym, S. Furusawa, T. Hatsuda, T. Kojo, and H. Togashi, Astrophys. J. 885, 42 (2019), arXiv:1903.08963 [astro-ph.HE] .
- Steiner et al. (2013) A. W. Steiner, M. Hempel, and T. Fischer, Astrophys. J. 774, 17 (2013), arXiv:1207.2184 [astro-ph.SR] .
- Gulminelli and Raduta (2015) F. Gulminelli and A. R. Raduta, Phys. Rev. C 92, 055803 (2015), arXiv:1504.04493 [nucl-th] .
- Chabanat et al. (1998) E. Chabanat, P. Bonche, P. Haensel, J. Meyer, and R. Schaeffer, Nucl. Phys. A 635, 231 (1998), [Erratum: Nucl.Phys.A 643, 441–441 (1998)].
- Schneider et al. (2017) A. S. Schneider, L. F. Roberts, and C. D. Ott, Phys. Rev. C96, 065802 (2017), arXiv:1707.01527 [astro-ph.HE] .
- Shen et al. (1998) H. Shen, H. Toki, K. Oyamatsu, and K. Sumiyoshi, Nucl. Phys. A637, 435 (1998), arXiv:nucl-th/9805035 .
- Hempel and Schaffner-Bielich (2010) M. Hempel and J. Schaffner-Bielich, Nucl. Phys. A837, 210 (2010), arXiv:0911.4073 [nucl-th] .
- Logoteta et al. (2022) D. Logoteta et al., submitted to Eur. Phys. J. A (2022).
- Sugahara and Toki (1994) Y. Sugahara and H. Toki, Nucl. Phys. A 579, 557 (1994).
- Bauswein et al. (2013b) A. Bauswein, T. Baumgarte, and H. T. Janka, Phys.Rev.Lett. 111, 131101 (2013b), arXiv:1307.5191 [astro-ph.SR] .
- Bauswein et al. (2021) A. Bauswein, S. Blacker, G. Lioutas, T. Soultanis, V. Vijayan, and N. Stergioulas, Phys. Rev. D 103, 123004 (2021), arXiv:2010.04461 [astro-ph.HE] .
- Tootle et al. (2021) S. D. Tootle, L. J. Papenfort, E. R. Most, and L. Rezzolla, (2021), arXiv:2109.00940 [gr-qc] .
- Kölsch et al. (2021) M. Kölsch, T. Dietrich, M. Ujevic, and B. Bruegmann, (2021), arXiv:2112.11851 [gr-qc] .