Crystal Electic Field and Possible Coupling with Phonon in Kondo lattice CeCuGa
Abstract
We investigate the magnetic and crystal electric field (CEF) states of the Kondo lattice system CeCuGa3 by muon spin relaxation (SR), neutron diffraction, and inelastic neutron scattering (INS) measurements. A noncentrosymmetric BaNiSn3-type tetragonal crystal structure (space group ) is inferred from x-ray as well as from neutron powder diffraction. The low-temperature magnetic susceptibility and heat capacity data show an anomaly near 2.3 - 2.5 K associated with long range magnetic ordering, which is further confirmed by SR and neutron diffraction data. The neutron powder diffraction collected at 1.7 K shows the presence of magnetic Bragg peaks indexed by an incommensurate magnetic propagation vector k and the magnetic structure is best described by a longitudinal spin density wave with ordered moments lying in -plane. An analysis of the INS data based on a CEF model reveals the presence of two magnetic excitations near 4.5 meV and 6.9 meV. The magnetic heat capacity data suggest an overall CEF splitting of 20.7 meV, however the excitation between 20 and 30 meV is very broad and weak in our INS data, but could provide an evidence of CEF level in this energy range in agreement with the magnetic entropy. Our analysis of INS data based on the CEF-phonon model indicates that the two excitations at 4.5 meV and 6.9 meV have their origin in CEF-phonon coupling (i.e. splitting of one CEF peak into two peaks, called vibron), with an overall splitting of 28.16 meV, similar to the case of CeCuAl3 and CeAuAl3.
I INTRODUCTION
Ce-based intermetallic compounds have been very appealing for their intriguing properties owing to the strongly competing Ruderman-Kittel-Kasuya-Yosida (RKKY) and Kondo interactions.[1, 3, 2, 4, 5, 6] They present a wide variety of electronic ground states including magnetic ordering, superconductivity, valence fluctuations, heavy-fermion and quantum critical behavior. For example, the Kondo lattice heavy fermion systems CeRhSi3 and CeIrSi3 exhibit long-range antiferromagnetic ordering and undergo pressure-induced superconductivity.[7, 8, 9, 10] Interestingly, they have noncentrosymmetric crystal structures (BaNiSn3-type tetragonal, space group ) due to which the superconductivity in these Ce compounds is unconventional in nature as it allows mixing between the spin singlet and spin-triplet parities and hence mixed parity.[11]
Recently our group has been working on ( = rare earth, = transition metal and = Si, Ge, Al, Sn, Ga) compounds [12, 13, 14, 15, 16, 17, 18, 19, 20, 21, 22, 23, 24, 25, 26, 27] to search for novel materials and understand the magnetism, superconductivity and crystal electric field (CEF) effects in , in particular, using neutron and muon techniques. In our efforts, very recently some of us investigated the crystal electric field (CEF) excitations in noncentrosymmetric tetragonal CeCuAl3 using inelastic neutron scattering (INS) measurements and found the presence of three magnetic excitations.[26] For Ce3+ (), being a Kramers ion, according to Kramer’s degeneracy theorem, in the paramagnetic state one would expect only two CEF excitations from the ground state. Therefore the observation of three CEF excitations in CeCuAl3 had been very exciting, providing evidence of strong CEF-phonon coupling (under a magneto-elastic mechanism) in this compound.[26] Similarly, the inelastic neutron scattering study on CeAuAl3 single crystal also revealed the presence of CEF-phonon coupling.[28] Motivated by these observations, we have performed an INS investigation of CEF excitations in the Kondo lattice CeCuGa3.
The physical properties of CeCuGa3 have been investigated by different groups, and depending on the stoichiometry of Cu and Ga, a sample dependent ground state has been found.[29, 30, 31, 32, 33, 35, 34, 36, 37] Mentink et al. [30] reported a paramagnetic behavior down to 0.4 K and found evidence for Kondo lattice heavy fermion behavior in polycrystalline CeCuGa3 having BaNiSn3-type noncentrosymmetric tetragonal structure (space group ). On the other hand, Martin et al. suggested an antiferromagnetic ordering below 1.9 K in BaNiSn3-type polycrystalline CeCuGa3.[31] Neutron diffraction (ND) study on polycrystalline noncentrosymmetric CeCuGa3 revealed an incommensurate magnetic structure with a magnetic propagation vector and a helical arrangement of moments.[33] For single crystal CeCuGa3, in addition to the magnetic Bragg peaks [indexed by k = (0.176, 0.176, 0)], the ND data also revealed the presence of satellite peaks indexed by an incommensurate propagation vector of which persists up to 300 K and is suggested to be the result of a short-ranged structural modulation of the crystal structure [33]. Oe et al. found evidence for ferromagnetic ordering in single crystal CeCu0.8Ga3.2 having BaAl4-type () crystal structure. [35] Joshi et al. also found a ferromagnetic ground state in single crystal CeCuGa3 which formed in disordered ThCr2Si2-type tetragonal structure (space group ).[36] It has been conjectured that the ground state properties are controlled by the degree of Cu-Ga disorder which in turn leads to two variants of crystal structure: ThCr2Si2-type tetragonal structure () and BaNiSn3-type tetragonal structure (, a noncentrosymmetric structure). According to Joshi et al. CeCuGa3 forming in disordered ThCr2Si2-type tetragonal structure () exhibits a ferromagnetic ground state.[36] The structure dependent magnetic properties can be correlated to the different atomic environments for disordered centrosymmetric () and ordered noncentrosymmetric () structures.
We have investigated the CEF excitations in polycrystalline CeCuGa3 sample forming in noncentrosymmetric BaNiSn3 structure () which we report here. CEF excitations in CeCuGa3 have not been previously investigated by INS measurements. Oe et al. and Joshi et al. extracted information about CEF parameters by fitting the single crystal susceptibility data in the paramagnetic temperature range of ferromagnetically ordered CeCuGa3 ().[35, 36] From INS data we find two strong CEF excitations at 4.5 meV and 6.9 meV. Our CEF results substantially differ from those obtained from the fitting of magnetic susceptibility by Joshi et al. who found an overall CEF splitting of 228 K (19.6 meV) with a first excited CEF doublet at 50 K (4.3 meV).[36] Our magnetic heat capacity also reveals an overall CEF splitting of 20.7 meV. Apparently, the two excitations seen in INS (below 7 K) do not seem to originate from single-ion CEF transitions, but rather result from CEF-phonon coupling as found in CeCuAl3 [26] and CeAuAl3.[28] Furthermore, our SR study finds a long range magnetic ordering in CeCuGa3, and the neutron powder diffraction data reflect a longitudinal spin density wave with ordered moments in the (1 1 0) direction.
II Experimental
The polycrystalline samples of CeCuGa3 as well as the nonmagnetic analog LaCuGa3 ( g each) were prepared by the standard arc-melting of high purity elements (Ce and La 99.9% and Cu and Ga 99.99%) in stoichiometric ratios. In order to improve the homogeneity and reaction among the constituent elements, the samples were flipped and re-melted several times during the arc-melting process. The resulting ingots were subsequently annealed at 900∘ C for 7 days in vacuum of Torr. The BaNiSn3-type crystal structure and the phase purity of the annealed sample were checked by the x-ray powder diffraction (XRPD) using the copper Kα radiation. Magnetization versus temperature and versus magnetic field measurements were made using a commercial superconducting quantum interference device (SQUID) magnetometer (MPMS, Quantum Design Inc.). The heat capacity measurements were made using the heat capacity option of a physical properties measurements system (PPMS, Quantum Design Inc.).
The SR measurements were carried out in zero field using the MuSR spectrometer at the ISIS facility, Didcot, U.K. The powdered CeCuGa3 sample was mounted on a high purity silver plate using diluted GE varnish and cooled inside the standard He-4 cryostat. The SR data were collected at several temperatures between 1.2 K to 10 K. The neutron diffraction (ND) measurements were carried out on powdered CeCuGa3 sample using the D20 powder neutron diffractometer at the Institute Laue Langevin, Grenoble, France. The powder sample was filled in a 10 mm vanadium can and cooled down to 1.7 K using a standard He-4 cryostat. The ND data were collected at 10 K and 1.7 K with the neutron beam of wavelength Å. The ND data were analyzed by using the package FullProf.[38]
The INS experiments on CeCuGa3 and LaCuGa3 were performed on the MARI time of flight (TOF) spectrometer at the UK ISIS Neutron Spallation source. The powdered samples of these materials were wrapped in thin Al-foils and mounted inside thin-walled cylindrical Al-cans. Low temperatures down to 4.5 K were obtained by cooling the sample mounts in a top-loading closed cycle refrigerator with He-exchange gas. The INS data were collected for scattering angles between 3∘ and 135∘ using neutrons with incident energies , 15, and 40 meV. The data are presented in absolute units, mb/meV/sr/f.u. by using the absolute normalization obtained from the standard vanadium sample measured in identical conditions. Low energy INS data were collected at 6 K using the time-of-flight inverted-geometry crystal analyzer spectrometer OSIRIS with a PG002 analyzer and selecting the final neutron energy of 1.845 meV at the ISIS Facility. The elastic resolution (FWHM) was eV.
III Magnetic Susceptibility and Heat Capacity
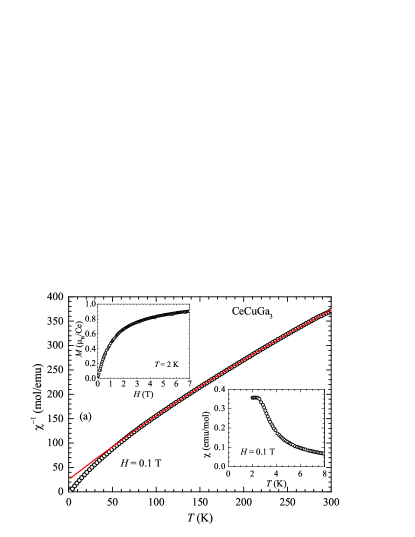
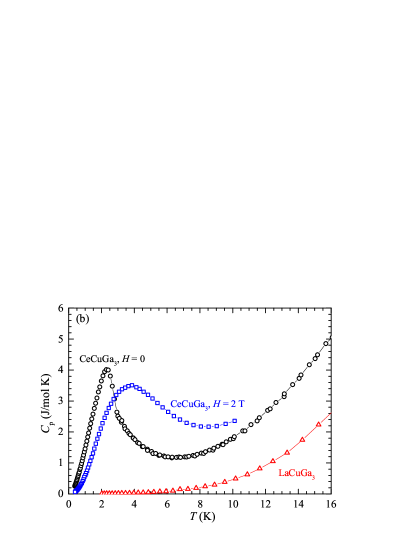
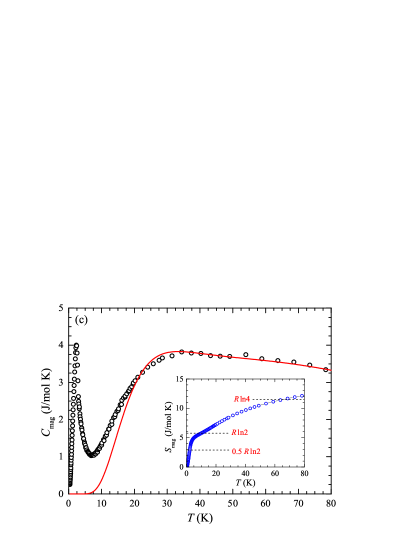
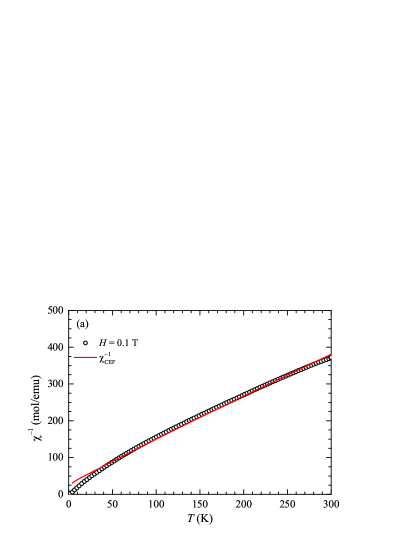
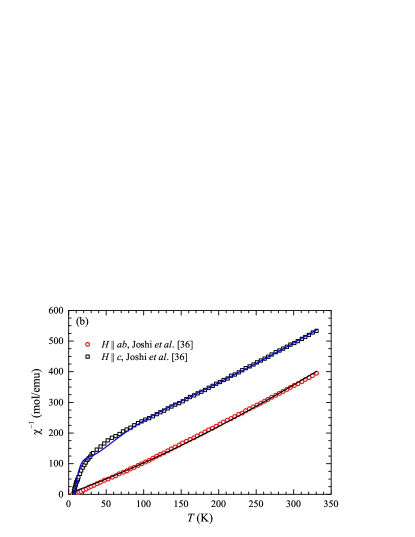
Figure 1(a) shows the temperature dependence of the inverse magnetic susceptibility for CeCuGa3 measured in a field of T. The low- data reveal an anomaly near 2.5 K (lower inset of Fig. 1(a)) indicating a magnetic phase transition. The isothermal magnetization measured at 2 K presented in the upper inset of Fig. 1(a) shows a nonlinear behavior and a tendency of near saturation however with reduced of at 2 K and 7 T. The near saturation magnetization is much lower than the theoretically expected saturation value of for Ce3+ ions. The reduction in can be attributed to combined effects of both Kondo and crystal electric field.
At high- the data follow a modified Curie-Weiss behavior . A fit of the data over 100 K to 300 K (solid red curve in Fig. 1(a)) yields emu/mol, an effective moment of and a Weiss temperature K. The effective moment so obtained is close to the theoretically expected value of for Ce3+ ions. The negative value of is indicative of dominant antiferromagnetic interaction. From the value of we estimate the Kondo temperature using the relation which yields K.[39] The value of so obtained is close to the value of – 6.9 K reported by Martin et al. based on the analysis of heat capacity data. [31]
Figure 1(b) shows the heat capacity versus for CeCuGa3 and its non-magnetic analog LaCuGa3 measured in T and T. While no anomaly is seen in the of LaCuGa3, the of CeCuGa3 shows a well pronounced anomaly near 2.3 K associated with the magnetic phase transition as inferred from the data above. Furthermore, it is seen that with the application of magnetic field, the peak position in CeCuGa3 moves towards the higher temperature side. At T the peak moves to 3.9 K from 2.3 K at T. Within the mean field theory such a behavior with magnetic field is generally considered to be an indication for ferromagnetic coupling which would contrast the deduction of dominant antiferromagnetic interaction inferred from the negative . The broadening of heat capacity peak in magnetic field can be attributed to Zeeman splitting of CEF-split ground state doublet. The magnetic structure determined from the neutron diffraction measurement, as discussed in the next section, reveals an antiferromagnetic coupling in the -plane and a ferromagnetic coupling along -direction. As such, we infer that at low fields the dominating exchange interaction is antiferromagnetic in nature whereas at high fields the dominating exchange interaction becomes ferromagnetic in nature. A close look of curve presented in the upper inset of Fig. 1(a) suggests that at fields near 2 T where the nonlinearity and saturation tendency is prominent one should expect a dominating ferromagnetic exchange interaction.
The low- data of LaCuGa3 are well described by , allowing us to estimate and . A linear fit of vs plot in the -range 2 K to 7 K provides a Sommerfeld coefficient mJ/mol K2 and mJ/mol K4. We estimate the Debye temperature = 328(5) K, where is the molar gas constant, and the number of atoms per formula units. Due to the presence of magnetic correlations at low-, we fit the versus for CeCuGa3 in the -range 10 K to 20 K which gives a Sommerfeld coefficient mJ/mol K2 that is significantly enhanced compared to the value of LaCuGa3. Martin et al. [31] reported a value of mJ/mol K2 for antiferromagnetically ordered CeCuGa3 () whereas Joshi et al. [36] found a value of mJ/mol K2 for ferromagnetically ordered CeCuGa3 ().
The magnetic contributions to the heat capacity and magnetic entropy are shown in Fig. 1(c). The attains a value of 3.2 J/mol K at the transition temperature which is much lower than the value of expected for a doublet ground state, the value is attained near 10.3 K [see inset of Fig. 1(c)]. The attains a value of near 2.2 K, therefore the empirical relation for the Kondo temperature, per Ce atom yields K. This value of is close to the value of K deduced above from . One can also estimate from the jump in at using the universal plot of versus for Ce- and Yb-based Kondo lattice systems.[40, 41] Our value of J/mol K [Fig. 1(c)] corresponds to . Accordingly, for K we get K, which is again quite consistent with the values obtained from other estimates. From the quasielastic linewidth of low energy inelastic neutron scatttering data we obtain K (see Fig. 11, Appendix).
The presents a broad Schottky-type anomaly centered around 30 K [see Fig. 1(c)] which could be reproduced by a three-level crystal electric field scheme. Under the effect of crystal field the ()-fold degenerate ground state multiplet of Kramers ion Ce3+ () splits into three doublets. From the analysis of data by three-level CEF scheme [42, 43, 24] we find that the first excited doublet is situated at K and the second excited doublet at K. The fit of by this CEF level scheme is shown by the solid red curve in Fig. 1(c). The attains a value of near 66 K which further supports the deduced splitting energy between the ground state doublet and the first excited doublet to be 70 K. Our , and CEF scheme of CeCuGa3 is in agreement with that reported by Joshi et al. [36]. Joshi et al. reported a value of close to at 250 K which is consistent with our K.
IV Muon Spin Relaxation
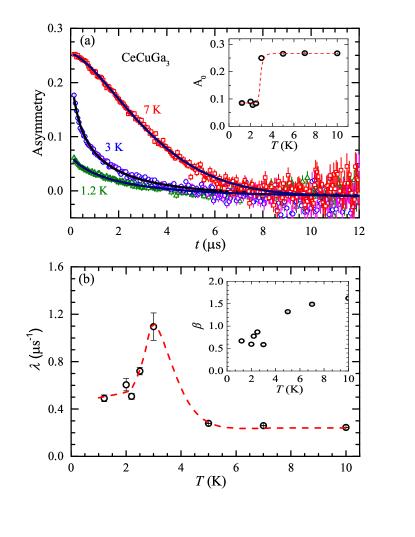
Magnetic ordering in CeCuGa3 was further probed by muon spin relaxation measurements in zero-field (ZF). The representative ZF-SR spectra collected at 1.2 K, 3 K, and 7 K are shown in Fig. IV(a). As can be seen from Fig. IV(a), a loss in initial asymmetry clearly depicts a magnetic phase transition in CeCuGa3. The ZF-SR data are well described by a stretched exponential function, i.e.,
| (1) |
where is the initial asymmetry, is the muon spin relaxation rate, is an exponent, and is a constant accounting for the contribution from the sample holder. The value of was determined by fitting the SR data at 10 K, and kept fixed to this value while fitting the data at other temperatures. The fits of the representative ZF-SR spectra by Eq. (1) are shown as solid curves in Fig. IV(a). The fitting parameters , and obtained from the fits are shown in Fig. IV. A huge loss in initial asymmetry [inset of Fig. IV(a)], and a peak in [Fig. IV(b)] clearly mark a magnetic phase transition near 3 K. Furthermore, a significant decrease in exponent is found to accompany the magnetic phase transition. The loss in in the ordered state reflects a highly damped SR signal in the ordered state, which can be associated with the incommensurate nature of magnetic structure as inferred from the neutron diffraction data (discussed below). For an incommensurate antiferromagnetic order there will be a broad distribution of local fields at the muon stopping sites, resulting in a stronger damping of SR signal below (relaxation rate depends on the width of the field distribution).
V Neutron Powder Diffraction
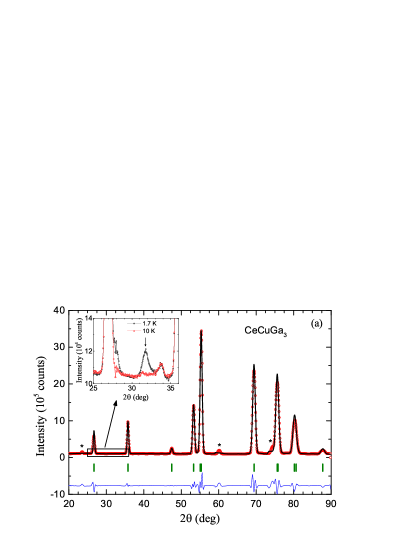
In order to determine the nature of the long range magnetic ordering in CeCuGa3 we also performed neutron diffraction measurements on powdered sample at 1.7 K (ordered state) and 10 K (paramagnetic state). The neutron powder diffraction pattern collected at 10 K and the calculated pattern for the nuclear structure are shown in Fig. 3(a). The structural Rietveld refinement for the BaNiSn3-type tetragonal (space group ) structure yielded the lattice parameters Å and Å which are in very good agreement with the literature values.[33] We also see a few weak unindexed peaks (marked with asterisks in Fig. 3(a)) which could be due to the presence of tiny amount of unidentified impurities in sample.
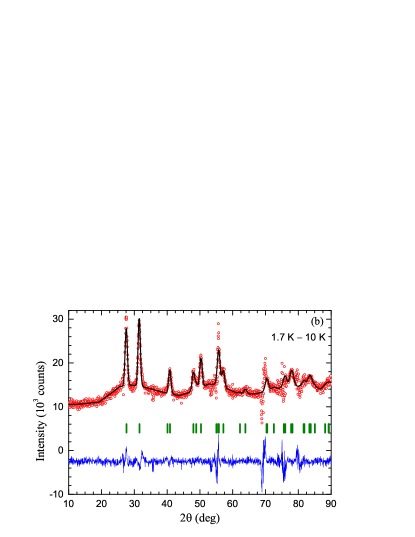
A comparison of the ND patterns at 1.7 K (ordered state) and 10 K (paramagnetic state) clearly displays the appearance of magnetic Bragg peaks at 1.7 K. The inset of Fig. 3(a) shows the expanded view of the two ND patterns over the range of 25∘ to 36∘. The difference plot of 1.7 K and 10 K ND patterns presented in Fig. 3(b) clearly shows the presence of a number of magnetic Bragg peaks at 1.7 K. All the magnetic Bragg peaks are well indexed by a propagation wave vector implying an incommensurate magnetic structure. Our k is very similar to the one reported by Martin et al. [33] who found to index the magnetic Bragg peaks in the case of polycrystalline sample, and the same magnetic propagation vector was also used to index the magnetic Bragg peaks of single crystal CeCuGa3.
Magnetic symmetry analysis using the program BASIREPS [44, 45] for k and space group revealed two allowed magnetic representations for Ce atoms occupying the Wyckoff position . The first one has only one basis vector of type (1 0) corresponding to magnetic moments lying in the tetragonal basal plane, while the second one has two basis vectors of type (1 1 0) and (0 0 1). Only the second magnetic representation is able to reproduce the magnetic intensity present in the diffraction pattern at 1.7 K with apparently no contribution from the basis vector (0 0 1), and all Ce moments lying in the basal plane corresponding to the basis vector (1 1 0).
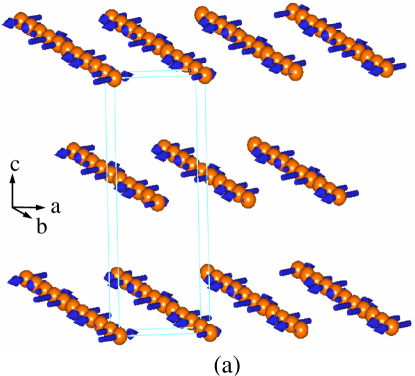
The refinement of the difference data set which contains only the magnetic diffraction intensity is shown in Fig. 3(b) and the corresponding magnetic structure is shown in Fig. 4. The incommensurate magnetic structure corresponds to a longitudinal spin density wave where the magnetic moments point along the (1 1 0) direction. The maximum value of the ordered moment is found to be /Ce. Our analysis of ND data reveals a different magnetic structure compared to the one proposed by Martin et al. [33] who also reported an incommensurate magnetic structure but with a helical arrangement of moments having a spiral axis oriented at from -axis, which however does not represent one of the symmetry allowed solutions.
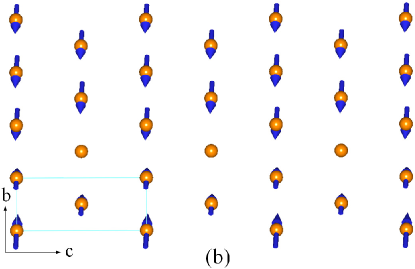
A view of the magnetic structure projected onto the plane i.e., the arrangement of magnetic moments when viewed along the crystallographic -direction is shown in Fig. 4. It is seen that Ce moments are coupled ferromagnetically along the -direction. This explains the indication of ferromagnetic correlation in the heat capacity measurement under the applied field discussed above in Sec. III.
VI Inelastic neutron scattering
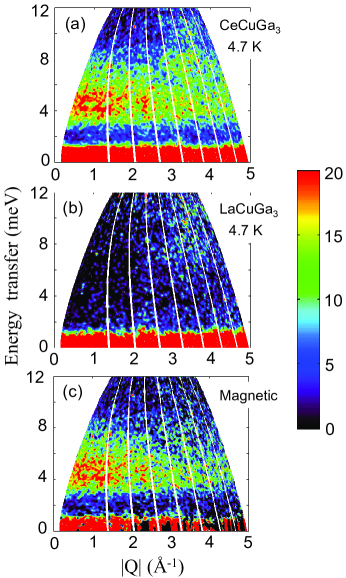
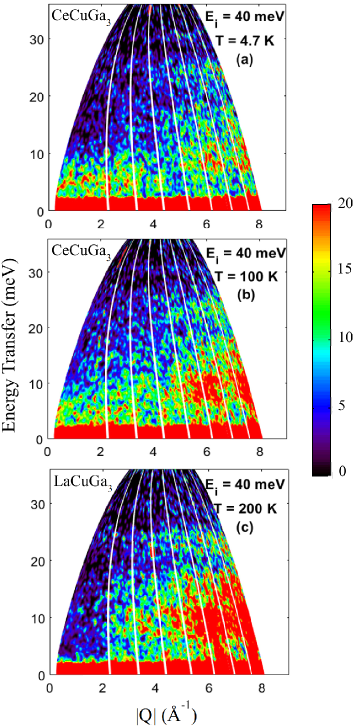
The color coded intensity maps showing inelastic neutron scattering responses from CeCuGa3 and LaCuGa3 measured with meV at K are shown in Fig. 5. While only a phononic excitation is seen for LaCuGa3, at low- a magnetic excitation, near 4.5 meV, is quite evident for CeCuGa3. We see that the magnetic excitation in CeCuGa3 is relatively broader reflecting the possibility of two closely situated excitations [see Fig. 5(c)]. In addition, the magnetic excitation energy does not change with increasing temperature from 4.7 K to 100 K which suggests that this excitation has its origin in the crystal electric field effect. Moreover, very weak and broad excitations were observed over 20 meV to 30 meV range in our INS measurements with meV at 5 K and 100 K (see Figs. 12 and 13 in Appendix).
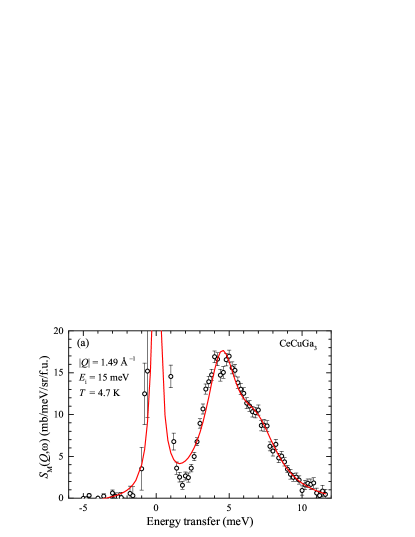
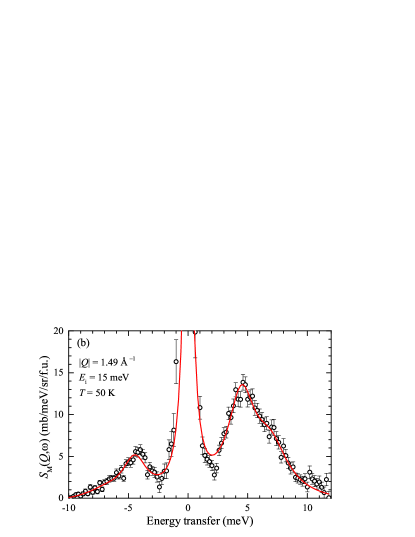
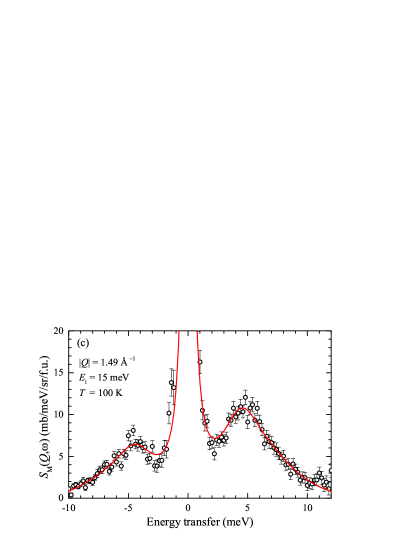
The magnetic excitations are more clear in -integrated one-dimensional energy cuts as shown in Fig. 6. The magnetic contribution to INS response was separated out by subtracting off the phononic contribution using the INS response of LaCuGa3. The with , the ratio of neutron scattering cross sections of CeCuGa3 and LaCuGa3. From the one-dimensional energy cuts of Ei= 15 meV in Fig. 6, it is seen that the CEF excitation in CeCuGa3 consists of two closely situated excitations which is better seen in our fit of the INS data by a model based on CEF (discussed later).
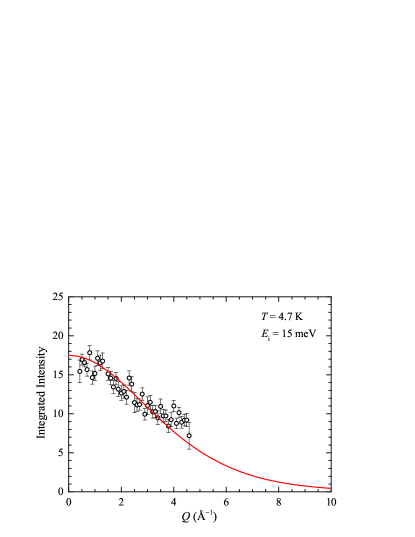
Figure 7 shows the -dependent integrated intensity integrated over an energy range of 3.5 to 6 meV for INS data collected with meV at 4.7 K. The solid red curve is the theoretical value of the square of the Ce3+ magnetic form factor [46], which is scaled to 17.5 times at . The fact that the integrated intensity is consistent with implies that the inelastic excitations mainly result from the single-ion CEF transitions.
The CEF Hamiltonian for the tetragonal symmetry (point symmetry ) of the Ce3+ ions is given by
| (2) |
where are CEF parameters and are the Stevens operators.[47] parameters need to be estimated by fitting the experimental data, such as single crystal susceptibility and/or inelastic neutron scattering data. For the analysis of INS data, we use a Lorentzian line shape for both quasi-elastic (QE) and inelastic excitations.
In order to obtain a set of CEF parameters that consistently fit the INS data at different temperatures, we performed a simultaneous fit of INS data at 4.7 K, 50 K and 100 K. The CEF parameters obtained from the simultaneous fits are (in meV) = 0.195, = 0.0187 and = 0.0190. The solid curves in Fig. 6(a)-(c) show the fits of the INS data. We find that the splitting energy between the ground state doublet and the first excited doublet is meV (52 K) and that between the ground state and the second excited doublet is meV (80 K). Although the fits to INS data look very good, the value of the overall CEF splitting of 6.9 meV is much smaller than the value expected based on the magnetic entropy and heat capacity analysis, which indicates overall CEF splitting about 240-250 K (21-22 meV). Furthermore, this set of the CEF parameters fails to explain the observed magnetic susceptibility of single crystal as well as polycrystal CeCuGa3.
Joshi et al. [36] determined the CEF parameters for ferromagnetically ordered CeCuGa3 () using the single crystal magnetic susceptibility data. They also obtained a positive value for CEF parameter which is consistent with the -plane as the easy plane of magnetization. However, the values of their parameters: K (0.948 meV), K (0.011 meV) and K ( meV) differ significantly from ours. They found the first excited state at 4.3 meV (50 K) which is in good agreement with ours. Nevertheless, they found the second excited state at 19.6 meV (228 K) which is drastically different from our excitations (4.5 and 6.9 meV). We used Joshi et al. CEF parameters and simulated INS spectra at 4.7 K and found excitaions at 0.44 meV (not at 4.3 meV) and 19.7 meV. Furthermore, Joshi et al. [36] also reported that the magnetic entropy is attained near 250 K (21.5 meV), which also suggests a much higher overall splitting energy compared to 6.9 meV. Our analysis of in Sec. III also suggests an overall splitting of 240 K (20.7 meV). CeRhGe3 and CeIrGe3, which are isostructural to CeCuGa3, also have higher overall splitting energy. The INS measurements reveal two well-defined CEF excitations at 7.5 and 18 meV in CeRhGe3 [17], and at 9.7 and 20.9 meV in CeIrGe3 [25].
All these suggest that the two magnetic excitations (4.5 meV and 6.9 meV) detected in the INS spectra of CeCuGa3 do not originate only from single-ion CEF transition. Therefore, it is very likely that the first CEF doublet at 70 K (6 meV), as deduced from the analysis of , splits into two levels due to magneto-elastic CEF-phonon coupling, resulting in two magnetic excitations near 4.5 meV and 6.9 meV. The presence of an additional excitation on account of CEF-phonon coupling has been seen in related compounds CeCuAl3 [26] and CeAuAl3.[28] In the case of CeCuAl3 INS revealed three magnetic excitations near 1.3, 9.8, and 20.5 meV. [26] According to Kramer’s degeneracy theorem for Ce3+ () only two CEF excitations are expected, and the additional excitation in CeCuAl3 arises from CEF-phonon coupling, which gives two excitations at 9.8 meV and 20.5 meV (referred as vibrons) due to coupling with the phonon modes near 14 meV.[26] On the other hand, INS study on single crystal CeAuAl3 has revealed CEF-phonon excitations near 4.9 and 7.9 meV.[28]
In order to consider the possibility of CEF-phonon coupling, and to understand the discrepancy between the CEF parameters obtained from the INS fit of 15 meV (at 4.7 K, 50 K, and 100 K) and that obtained from the single crystal susceptibility by Joshi et al. [36], we have analyzed the 15 meV and 40 meV data (combining two sets of the data) at 4.7 K and 100 K, including the magnetoelastic term (MEL, i.e. CEF-phonon coupling term) to the CEF Hamiltonian given in Eq. (2). Hence, the total Hamiltonian is given as follow:
| (3) |
where the first term is the tetragonal CEF Hamiltonian mentioned above [Eq. (2)], the second term is the phonon Hamiltonian (), and the third term is the (CEF-phonon)-coupling term (). Here denotes the phonon energy, and or are phonon creation or annihilation operators. is the coupling parameter between CEF and phonon excitations and ( is the magnetoelastic CEF-phonon operator within orthorombic symmetry, -mode, the same as used in CeCuxAg1-xAl3 ()[26, 27], with .
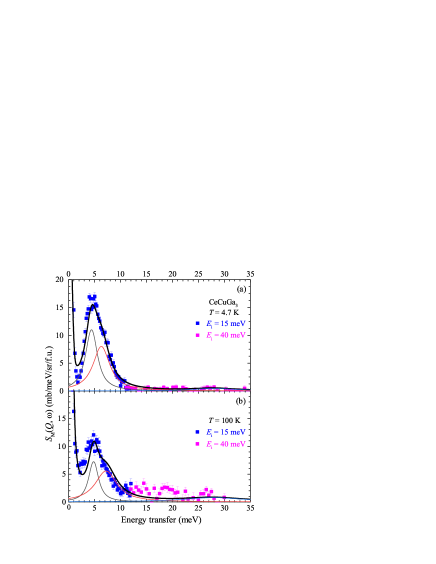
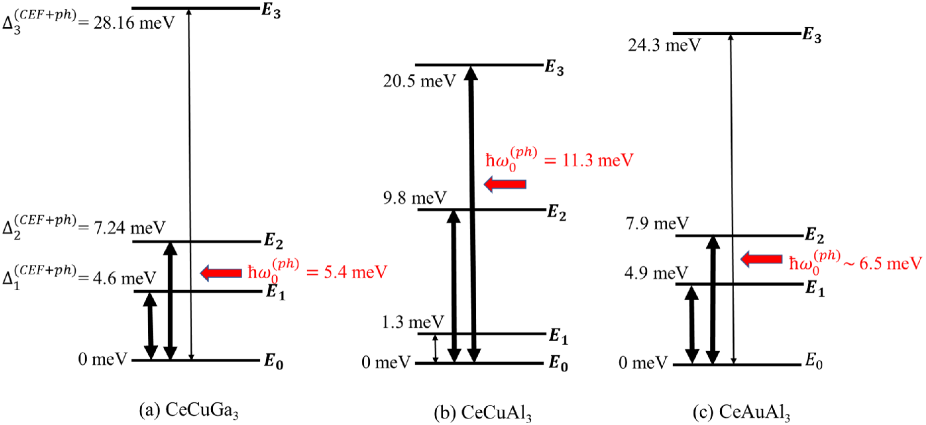
Figure 8 shows the fit (the solid black curves) to the combined 15 and 40 meV data at 4.7 K and 100 K according to Eq. (3), i.e., including the phonon and MEL coupling terms to the CEF-Hamiltonian. This model explains very well the observed excitations in CeCuGa3. Figure 9(a) shows the energy level diagram of CEF-phonon coupled model. The value of fits parameters obtained are: meV, meV and meV, meV and meV. The value of is slightly smaller than the phonon peak at 8 meV in LaCuGa3, which was also found in CeCuAl3 [26]. Moreover, in CeCuGa3 is approximately half of the value found in the CeCuAl3.[26] Since is proportional to the effective intrinsic magnetoelastic parameter, but inversely proportional to the phonon energy,[27] the reduction of CEF-phonon coupling intensity for CeCuGa3 can only be due to an important decay of the intrinsic magnetoelastic interaction, assuming they have a similar elastic modules. It is also interesting to observe that the vibron bound state in CeCuGa3 arises from the coupling of the first excited CEF level with the phonon mode, while in CeCuAl3 it originates from the coupling of the second excited CEF level with the phonon mode.[26] This behavior can be understood as the first excited CEF level in CeCuGa3 moves up in energy (compared to 1.3 meV in CeCuAl3) and the phonon mode (due to heavy Ga atom compared to Al) moves down in energy. The CEF-phonon schematic for CeCuAl3 [26] and CeAuAl3 [28] are also shown in Fig. 9. As seen from Fig. 9(c) the CEF-phonon energy level scheme for CeCuGa3 is similar to that of CeAuAl3.[28]
Next, we calculate the crystal field susceptibility using the same CEF parameters as determined from the CEF-phonon model fit [Eq. (3)] of the INS data discussed above. Figure 10 shows a comparison of the calculated with the experimental for the polycrystalline and single crystal CeCuGa3. Figure 10 reveals good agreement between the experimental and calculated CEF-only (without phonon and MEL terms) susceptibility for both polycrystalline and single crystal of CeCuGa3. The estimated value of the molecular field constant [in (mol/emu)] for the polycrystal sample , and for the single crystal and . The values of the temperature independent susceptibility are [in ( emu/mole)], , and . The CEF-only simulation (without phonon and MEL terms) using the parameters obtained from the analysis of the INS data by the CEF-phonon model [Eq. (3)] suggests three CEF doublets at 0, 5.3 and 27.7 meV (see Fig. 14 in Appendix). The wave functions of three CEF doublets are , and . The values of the ground state moment estimated are and = 0.43 , which are in agreement with an easy plane ansiotropy observed through the single crystal susceptibility and neutron diffraction. The value of the ordered state moment determined from neutron diffraction at 1.7 K is 0.95(1) , a little smaller than the moment obtained from the CEF ground state. This is likely due to the fact that the ordered moment is not yet saturated at 1.7 K as saturation is expected only at temperatures below K.
Finally, it is worth noting that the presence of the anisotropic ferromagnetic correlations discussed in Sec. III is another important argument supporting the existence of a CEF-phonon coupling in CeCuGa3. In fact, the CEF-phonon coupling is a manifestation of a highly anisotropic effective attraction between pairs of -type electrons ferromagnetically coupled via a phonon mode.[27] The presence of these highly anisotropic ferromagnetic correlations represents the clue that must be followed to find the CEF-phonon coupling in the antiferromagnetic systems like CeCuGa3.
VII Conclusion
We have performed a detailed examination of magnetism and crystal field effect in a Kondo lattice heavy fermion system CeCuGa3 using the SR, neutron powder diffraction and inelastic neutron scattering measurements. Both x-ray and neutron diffraction data consistently revealed a BaNiSn3-type crystal structure (space group ) for the polycrystalline CeCuGa3 sample under study. The magnetic susceptibility and heat capacity reveal a magnetic phase transition near 2.3 - 2.5 K. The magnetic phase transition is further confirmed by the SR data which show a rapid loss in initial asymmetry in the magnetically ordered state. The nature of the magnetic phase transition was determined by neutron powder diffraction. The ND data reveal a long range antiferromagnetic ordering described by an incommensurate magnetic propagation vector k . The magnetic structure is found to be a longitudinal spin density wave with a maximum ordered moment of /Ce, and the ordered moments point along (1 1 0) direction. This magnetic structure is different from the one reported by Martin et al. [33] who proposed a helical arrangement of moments. We notice that along the axis the ordered moments are aligned ferromagnetically. As such, we attribute the indication of ferromagnetic coupling in heat capacity measured under applied field to this ferromagnetic alignment of ordered moments. From the magnetic heat capacity, magnetic entropy, Weiss temperature and quasielastic linewidth we estimate Kondo temperature to be 4 - 6 K.
Our investigation of the crystal electric field state using inelastic neutron scattering reveals two magnetic excitations near 4.5 meV and 6.9 meV and, possibility of a very broad and weak excitation between 20 and 30 meV. In the first model, the INS data were analyzed by a model based on pure crystal electric field, focusing on 4.5 and 6.9 meV excitations, and the crystal field level scheme was determined. However, our CEF level scheme deduced from the analysis of the INS data (4.5 and 6.9 meV excitations) is found to be substantially different from the one obtained from the analysis of the magnetic susceptibility of single crystal CeCuGa3 () by Joshi et al.[36] who found the two excited states at 4.3 meV and 19.6 meV. Our magnetic heat capacity data also support an overall splitting of 20.7 meV. Considering this, alternatively, in a second model, we analyzed the INS data (including 15 and 40 meV data) based on the CEF-phonon model which indicates that the two excitations at 4.5 meV and 6.9 meV have their origin in the CEF-phonon coupling (i.e. the splitting of one CEF peak into two peaks) observed in the case of homologue compounds CeCuAl3 [26] and CeAuAl3.[28] The overall CEF splitting energy of 28.16 meV estimated from the INS analysis also explains the observed behavior of the magnetic heat capacity (magnetic entropy) as well as the single crystal magnetic susceptibility of CeCuGa3. Further investigations, preferably on single crystal CeCuGa3, are highly desired to examine the CEF-phonon coupling in this compound.
Acknowledgments We thank Prof. S. Langridge, Prof. A Sundaresan, Dr. D. Le and Dr. Rotter for interesting discussions. DTA and VKA acknowledge financial assistance from CMPC-STFC grant number CMPC-09108. DTA would like to thank the Royal Society of London for Newton Advanced Fellowship funding between UK and China and International Exchange funding between UK and Japan. DTA also thanks EPSRC-UK for the funding. SS and RT would like to thank the Indian Nanomission (DST-India) for post-doctoral fellowship.
Appendix: Inelastic Neutron Scattering Data for low energy transfer and meV
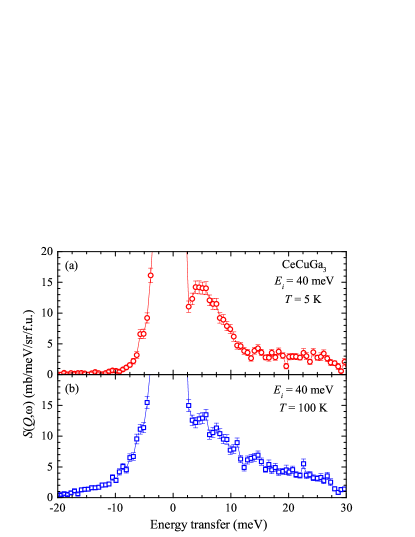
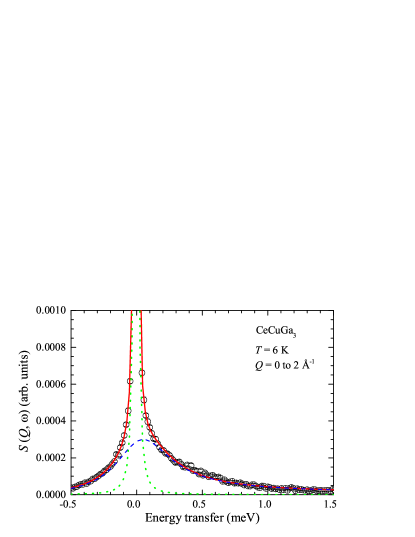
Figure 11 shows the -integrated ( Å-1) quasielastic neutron scattering data collected at 6 K using a PG002 analyser with final fixed energy of neutrons meV using the TOF spectrometer OSIRIS at the ISIS Facility. The quasielastic neutron scattering data were fitted by a Lorentzian line-shape function. From the fit we obtain the quasielastic line width meV, which yields a Kondo temperature K. The value of obtained this way is close to the values obtained from the heat capacity and Weiss temperature.
The color-coded intensity maps for inelastic neutron scattering responses from CeCuGa3 for meV at K and 100 K, and from LaCuGa3 at 200 K are shown in Fig. 12. Figure 13 shows the -integrated ( Å-1) inelastic scattering intensity data which were collected with neutrons having meV at 6 K using the TOF spectrometer MARI. As can be seen from Fig. 13 there is a very broad and weak excitation between 20 and 30 meV range of energy at 5 K. This is in agreement with the heat capacity data, which suggest an overall CEF splitting of 20.7 meV.
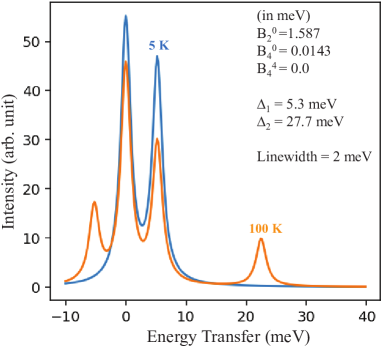
Figure 14 shows the CEF-only simulation (without phonon and MEL terms) using the CEF parameters =1.587(5) meV, =0.0143(2) meV and =0.000(1) meV, which are obtained from the analysis of the INS data by the CEF-phonon model [Eq. (3)]. As can be seen from the simulation, at 5 K there is an excitation from the ground state at 5.3 meV, giving meV. At 5 K the CEF excitation from the ground state to the second excited state (at 27.7 meV) is not allowed in the dipole approximation, and hence its intensity is zero in the INS simulation. However, the simulation for K shows an excitation from the first excited state at 22.4 meV, which in turn implies meV (with respect to the ground state).
References
- [1] G. R. Stewart, Rev. Mod. Phys. 56, 755 (1984); G. R. Stewart, Rev. Mod. Phys. 73, 797 (2001); G. R. Stewart, Rev. Mod. Phys., 78, (2006) 743.
- [2] A. Amato, Rev. Mod. Phys. 69, 1119 (1997).
- [3] P. S. Riseborough, Adv. Phys. 49, 257 (2000).
- [4] H. v. Löhneysen, A. Rosch, M. Vojta, and P. Wölfle, Rev. Mod. Phys. 79, 1015 (2007).
- [5] C. Pfleiderer, Rev. Mod. Phys. 81, 1551 (2009).
- [6] Q. Si and F. Steglich, Science 329, 1161 (2010);
- [7] N. Kimura, K. Ito, K. Saitoh, Y. Umeda, H. Aoki, and T. Terashima, Phys. Rev. Lett. 95, 247004 (2005).
- [8] N. Kimura, Y. Muro, and H. Aoki, J. Phys. Soc. Jpn. 76, 051010 (2007).
- [9] I. Sugitani, Y. Okuda, H. Shishido, T. Yamada, A. Thamizhavel, E. Yamamoto, T. D. Matsuda, Y. Haga, T. Takeuchi, R. Settai, and Y. Ōnuki, J. Phys. Soc. Jpn. 75, 043703 (2006).
- [10] Y. Okuda, Y. Miyauchi, Y. Ida, Y. Takeda, C. Tonohiro, Y. Oduchi, T. Yamada, N. D. Dung, T. D. Matsuda, Y. Haga, T. Takeuchi, M. Hagiwara, K. Kindo, H. Harima, K. Sugiyama, R. Settai, and Y. Ōnuki, J. Phys. Soc. Jpn. 76, 044708 (2007).
- [11] E. Bauer and M. Sigrist (editors): Lecture Notes in Physics Vol. 847: Non-centrosymmetric Superconductors: Introduction and Overview, (Spring-Verlag, Berlin Heidelberg, 2012).
- [12] V. K. Anand, A. D. Hillier, D. T. Adroja, A. M. Strydom, H. Michor, K. A. McEwen, and B. D. Rainford, Phys. Rev. B 83, 064522 (2011).
- [13] V. K. Anand, D. T. Adroja, A. D. Hillier, J. Taylor, and G. Andŕe, Phys. Rev. B 84, 064440 (2011).
- [14] V. K. Anand, D. T. Adroja, A. D. Hillier, W. Kockelmann, A. Fraile, and A. M. Strydom, J. Phys.: Condens. Matter 23, (2011) 276001.
- [15] V. K. Anand, D. T. Adroja, and A. D. Hillier, Phys. Rev. B 85, 014418 (2012).
- [16] D. T. Adroja and V. K. Anand, Phys. Rev. B 86, 104404 (2012).
- [17] A. D. Hillier, D. T. Adroja, P. Manuel, V. K. Anand, J. W. Taylor, K. A. McEwen, B. D. Rainford and M. M. Koza, Phys. Rev. B 85, 134405 (2012).
- [18] V. K. Anand, D. T. Adroja, and A. D. Hillier, J. Phys.: Condens. Matter 25, 196003 (2013).
- [19] M. Smidman, D. T. Adroja, A. D. Hillier, L. C. Chapon, J. W. Taylor, V. K. Anand, R. P. Singh, M. R. Lees, E. A. Goremychkin, M. M. Koza, V. V. Krishnamurthy, D. M. Paul and G. Balakrishnan, Phys. Rev. B 88, 134416 (2013) .
- [20] V. K. Anand, D. Britz, A. Bhattacharyya, D. T. Adroja, A. D. Hillier, A. M. Strydom, W. Kockelmann, B. D. Rainford and K. A. McEwen, Phys. Rev. B 90, 014513 (2014) .
- [21] V. K. Anand, D. T. Adroja, A. Bhattacharyya, A. D. Hillier, J. W. Taylor and A. M. Strydom, J. Phys.: Condens. Matter 26, 306001 (2014).
- [22] M. Smidman, A. D. Hillier, D. T. Adroja, M. R. Lees, V. K. Anand, R. P. Singh, R. I. Smith, D. M. Paul, and G. Balakrishnan, Phys. Rev. B 89, 094509 (2014).
- [23] D. T. Adroja, C. de la Fuente, A. Fraile, A. D. Hillier, A. Daoud-Aladine, W. Kockelmann, J. W. Taylor, M. M. Koza, E. Burzurí, F. Luis, J. I. Arnaudas, and A. del Moral Phys. Rev. B 91, 134425 (2015).
- [24] V. K. Anand, D. T. Adroja, D. Britz, A. M. Strydom, J. W. Taylor and W. Kockelmann, Phys. Rev. B 94, 014440 (2016).
- [25] V. K. Anand, A. D. Hillier, D. T. Adroja, D. D. Khalyavin, P. Manuel, G. Andre, S. Rols, and M. M. Koza, Phys. Rev. B 97, 184422 (2018).
- [26] D. T. Adroja, A. del Moral, C. de la Fuente, A. Fraile, E. A. Goremychkin, J. W. Taylor, A. D. Hillier and F. Fernandez-Alonso, Phys. Rev. Lett. 108, 216402 (2012).
- [27] C. de la Fuente, A. del Moral, J.W. Taylor, D.T. Adroja, J. Magn. Magn. Mater. 530, 167541 (2021).
- [28] P. C̆ermák, A. Schneidewind, B. Liu, M. M. Koza, C. Franz, R. Schönmann, O. Sobolev, and C. Pfleiderer, Proc. Natl. Acad. Sci. 116, 6695 (2019).
- [29] E. V. Sampathkumaran and I. Das, Solid State Commun. 81, 901 (1992).
- [30] S. A. M. Mentink, N. M. Bos, B. J. van Rossum, G. J. Nieuwenhuys, J. A. Mydosh, and K. H. J. Buschow, J. Appl. Phys. 73, 6625 (1993).
- [31] Martin J M, Paul D M, Lees M R, Werner D and Bauer E, J. Magn. Magn. Mater. 159, 223 (1996).
- [32] S. Aoyama, H. Ido, T. Nishioka, M. Kontani, Czechoslov. J. Phys. 46, 2069 (1996)
- [33] J. M. Martin, M. R. Lees, D. M. Paul, P. Dai, C. Ritter, and Y. J. Bi, Phys. Rev. B 57, 7419 (1998).
- [34] Kontani M, Motoyama G, Nishioka T and Murase K: Physica B 259, 24 (1999).
- [35] K. Oe, Y. Kawamura, T. Nishioka, H. Kato, M. Matsumura and K. Kodama, J. Phys.: Conf. Ser. 200, 012147 (2010).
- [36] D. A. Joshi, P. Burger, P. Adelmann, D. Ernst, T. Wolf, K. Sparta, G. Roth, K. Grube, C. Meingast and H. v. Löhneysen, Phys. Rev. B 86, 035144 (2012).
- [37] P. Przybylski, A.P. Pikul, D. Kaczorowski, P. Wiśniewski, J. Phys. Chem. Solids 75, 1284 (2014)
- [38] J. Rodríguez-Carvajal, Physica B 192, 55 (1993); Program Fullprof, LLB-JRC, Laboratoire Léon Brillouin, CEA-Saclay, France, 1996 (www.ill.eu/sites/fullprof/).
- [39] G. Grüner and A. Zawadowski, Rep. Prog. Phys. 37, 1497 (1974).
- [40] M. J. Besnus, A. Braghta, N. Hamdaoui, and A. Meyer, J. Magn. Magn. Mater. 104-107, 1385 (1992).
- [41] J. A. Blanco, M. de Podesta, J. I. Espeso, J. C. Gómez Sal, C. Lester, K. A. McEwen, N. Patrikios, and J. Rodríguez Fernández, Phys. Rev. B 49, 15126 (1994).
- [42] S. Layek, V. K. Anand, and Z. Hossain, J. Magn. Magn. Mater. 321, 3447 (2009).
- [43] A. Prasad, V. K. Anand, U. B. Paramanik, Z. Hossain, R. Sarkar, N. Oeschler, M. Baenitz and C. Geibel, Phys. Rev. B 86, 014414 (2012).
- [44] J. Rodríguez-Carvajal, BASIREPS: a program for calculating irreducible representations of space groups and basis functions for axial and polar vector properties. Part of the FullProf Suite of programs, www.ill.eu/sites/fullprof/
- [45] C. Ritter, Solid State Phenomena 170, 263 (2011)
- [46] P. J. Brown, in International Tables for Crystallography, edited by A.J.C. Wilson, Mathematical, Physical and Chemical Tables, Vol. C (Kluwer Academic, Amsterdam, 1999), pp.450–457.
- [47] K. W. H. Stevens, Proc. Phys. Soc. London A 65, 209 (1952).