Harmonic and non-Harmonic Based Noisy Reverberant Speech Enhancement in Time Domain
Abstract
This paper introduces the single step time domain method named HnH-NRSE, whihc is designed for simultaneous speech intelligibility and quality improvement under noisy-reverberant conditions. In this solution, harmonic and non-harmonic elements of speech are separated by applying zero-crossing and energy criteria. An objective evaluation of the its non-stationarity degree is further used for an adaptive gain to treat masking components. No prior knowledge of speech statistics or room information is required for this technique. Additionally, two combined solutions, IRMO and IRMN, are proposed as composite methods for improvement on noisy-reverberant speech signals. The proposed and baseline methods are evaluated considering two intelligibility and three quality measures, applied for the objective prediction. The results show that the proposed scheme leads to a higher intelligibility and quality improvement when compared to competing methods in most scenarios. Additionally, a perceptual intelligibility listening test is performed, which corroborates with these results. Furthermore, the proposed HnH-NRSE solution attains SRMR quality measure with similar results when compared to the composed IRMO and IRMN techniques.
Index Terms:
Speech Enhancement , Noisy-Reverberant, Non-Stationarity, Speech Intelligibility, Speech QualityI Introduction
Speech communication in urban environments is an essential challenge in daily life. In these scenarios, the speech signal is generally submitted to the presence of acoustic noises and reverberation. This situation may lead to masking effects on speech signals and can also alter the human auditory perception [1][2][3][4]. Consequently, noisy-reverberant interferences reduce the quality and the intelligibility of speech signals by inducing changes on relevant harmonic structures of speech [5][6]. Studies have demonstrated that intelligibility and quality are related [7], which motivates combined solutions that simultaneously improve these characteristics under adverse conditions.
Methods have been designed to exclusively improve speech intelligibility under noisy and reverberant conditions [8][9][10][11][12]. Spectral solutions usually adopt energy equalization to deal with these acoustic distortions. The goal is to change the speech spectral energy distribution in other to have a more intelligible signal propagated inside a room. This is the case of the ACO (Adaptive Compressive Onset-Enhancement) [13], which alters the energy present in different frequency bands considering prior knowledge on the acoustic noise and the Room Impulse Response (RIR). A similar approach based on the PDMSE (Perceptual Distortion Measure-based Speech Enhancement) [9] and FIR (Fast Inverse Filtering) techniques [14] was proposed in [15] with interesting objective and subjective intelligibility results. In [16] two solutions are described to cope with acoustic noise in order to improve speech intelligibility by spectral equalization strategies. Temporal adaptive methods focus on preserving speech transient regions that are considered more relevant for speech intelligibility due to greater phonetic information [17]. The SSS (Steady-State Suppression) [10] was proposed considering the suppression of steady-state components that usually indicates frames with greater energy. By amplitude attenuation, there is a reduction on the masking distortion that affects transient regions, therefore increasing the intelligibility. Another temporal approach is the AGC (Adaptive Gain Control) [11], that adjusts the energy of each frame in order to reduce masking effects on relevant speech regions by an optimization criteria. In the ARANSD (Adaptive Reverberation Absorption using Non-Stationarity Detection) method [12] the non-stationarity of speech regions is accessed by the INS (Index of Non-Stationarity) [18]. This solution is able to restore the natural non-stationary behavior of speech signals. Furthermore, it also attained an interesting speech quality gain [12]. This method defines the RGs (Reverberation Groups) regions in order to observe the non-stationary behavior of speech signals and absorbs masking components based on the non-stationarity variation.
In the literature, speech enhancement approaches are designed to mainly improve the speech quality in adverse conditions [19][20][21][22]. These solutions identify the distortion components based on temporal and spectral estimators [23] or using decomposition techniques such as the EMD (Empirical Mode Decomposition) [24]. The OMLSA (Optimally-Modified Log-Spectral Amplitude) [19] adopts an acoustic noise estimator to access the spectral noise power and reconstruct the speech signal based on the minimization of the log-spectral mean square error. Another speech enhancement, the EMDH (Empirical Mode Decomposition with Hurst exponent) [20][21] is a temporal method that employs the Hurst exponent [25] to identify and remove Intrinsic Mode Functions (IMFs) most corrupted by noise from the EMD decomposition. The NNESE (Nonstationary Noise Estimation for Speech Enhancement) strategy [22] is a temporal solution that employ the robust DATE estimator [26] on a short-time basis, being able to account for the non-stationarity of acoustic signals.
In order to simultaneously improve speech intelligibility and quality, the TSDL (Two-Stage with Deep Learning) [27] approach is proposed based on two DNN (Deep Neural Network) stages. Each stage is trained in to separately and consecutively mitigate noise and reverberation for concurrent improvement. The combined approach presented in [28] is a composition of the acoustic mask IBM (Ideal Binary Mask) [28] and the OMLSA speech enhancement technique [19] to provide intelligibility and quality improvement in noisy environments.
In this paper, the method HnH-NRSE (Harmonic and non-Harmonic based Noisy-Reverberant Speech Enhancement) is proposed as a single approach to attain simultaneous intelligibility and quality improvement of noisy-reverberant speech signals. The solution takes into account the non-stationarity variations of speech for the adaptive gain approach and consider an harmonic and non-harmonic decomposition, since the harmonic components are naturally related to the intelligibility [6][29]. Additionally, two combined solutions IRMO (Ideal Reverberant Mask with OMLSA) and IRMN (Ideal Reverberant Mask with NNESE) are proposed for the noisy-reverberant scenario. These methods adopt the Ideal Reverberant Mask (IRM) [30] in composition with speech enhancement techniques OMLSA and NNESE, and is also designed for both intelligibility and quality improvement.
Extensive experiments are conducted to objectively evaluate the proposed solutions for speech intelligibility and speech quality gain. The noisy-reverberant scenario is composed of two real reverberant rooms from the AIR [31] and LASP_RIR111Available at www.lasp.ime.eb.br databases and two background non-stationary acoustic noises extracted from RSG-10 [32] and DEMAND [33] databases. The intelligibility assessment in performed considering the objective measures STOI [34] and ASIIST [35]. The SRMR [36], PESQ [37] and f2-model PEAQ [38] [39] measures are adopted for quality objective evaluation. A subjective intelligibility listening test is also performed and results show that the proposed HnH-NRSE method outperforms competing techniques in terms of speech intelligibility. Moreover, the HnH-NRSE is able to achieve similar SRMR values when compared to the proposed combined approaches.
The main contributions of this work are:
-
•
introduction of the HnH-NRSE single method for simultaneous intelligibility and quality improvement of noisy-reverberant speech signals in time domain.
-
•
design of composite solutions IRMN for noisy-reverberant speech signals improvement.
-
•
definition of composite solution IRMO for speech improvement under noisy-reverberant environments.
The remainder of this paper is organized as follows. In Section II, the noisy-reverberant effect is defined and analyzed considering the speech harmonic structure and non-stationarity. The single stage HnH-NRSE solution and proposed combined methods IRMO and IRMN are introduced in Section III. The objective measures used to evaluate the techniques on speech quality and intelligibility are briefly described in Section IV. The experiments are exposed in Section V. Then, the results for improvements on speech intelligibility and quality are presented and discussed for all methods. Finally, Section VI concludes this work.
II Noisy-Reverberant Acoustic Effects
The reverberation effect is usually defined as a linear filtering process such that, given a RIR , the reverberated signal can be obtained by convolution. In real environments, acoustic noises are also a common distortion, which means that the resultant noisy-reverberant speech signal can be obtained by
| (1) |
where is the clean speech signal and is the background noise.
(a)
(b)
(c)
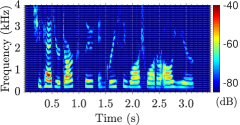
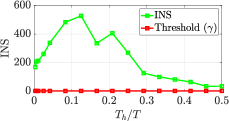
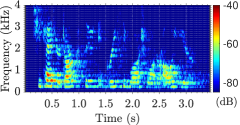
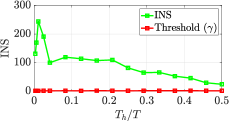
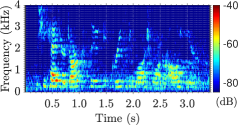
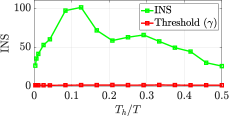
Fig. 1 depicts the spectrogram and INS [18] of the clean, reverberant and noisy-reverberant speech signal considering the LASP2 room11footnotemark: 1 and the Babble noise at dB. It can be seen that the distinction between silence and voice active regions present on the direct signal is masked by the noisy and reverberant effects. Moreover, the harmonic structure of the speech signal is altered, changing observable formants, specially for lower frequencies. This illustrate how the noisy-reverberant effect alter the harmonic structure of the speech signals, change human auditory perception and reduce acoustic intelligibility and quality [1][2][6]. Moreover, the corresponding INS values show how the natural non-stationary behavior of speech signals is altered in these conditions.
This objective measure compares the target signal with stationarity references called surrogates for different time scales , where is the short-time spectral analysis length and is the total signal duration. Surrogate signals have the same absolute spectrogram values of a target signal and phase identically distributed in [18]. For each length , the INS is defined using the ratio between the variance of spectral distances from local to global multitaper spectrograms for the target signal () and corresponding surrogates () as
| (2) |
A threshold is defined to keep the stationarity assumption considering a confidence degree as
| (3) |
The harmonic components of the speech signal are altered by both masking effects that reduce the natural non-stationary behavior of speech signals from a maximum value of down to and for the reverberant and noisy-reverberant scenarios, respectively.
III Proposed Methods
In this Section, the HnH-NRSE method is presented, which aims to simultaneously improve intelligibility and quality of noisy-reverberant speech signals. Moreover, the two composed solutions IRMN and IRMO establish the intrusive reference as a composition of the Ideal Reverberant Mask (IRM) [30] and speech enhancement methods NNESE [22] and OMLSA [19].
III-A Proposed HnH-NRSE: Harmonic and non-Harmonic based Noisy Reverberant Speech Enhancement
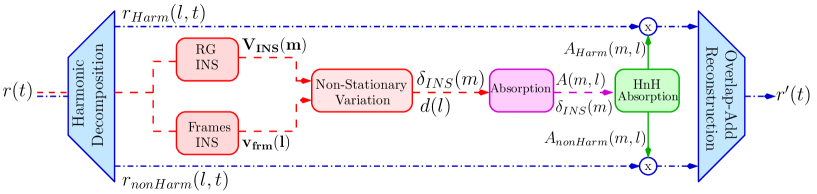
The HnH-NRSE aims to apply the adaptive absorption based on variations of speech non-stationarity [12] taking into account the harmonic elements of speech signal. A block diagram is illustrated in Fig. 2. The solution can be described in three main steps: harmonic and non-harmonic decomposition, adaptive masking absorption and signal reconstruction.
III-A1 Harmonic and non-Harmonic Separation
Given a noisy-reverberant signal , consider its -th frame representation and the maximum energy observed in all frames. The harmonic and non-harmonic separation is performed based on the energy and zero-crossing thresholds [40], and , as
| (4) |
and
| (5) |
where and are the energy and zero-crossing values for a given frame, respectively. For low SNR scenarios, when is greater than , the energy threshold is updated to . This is important to achieve a better discrimination between harmonic and non-harmonic frames.
III-A2 Adaptive Masking Absorption
For the adaptive absorption of masking components, it is adopted a short-time absorption procedure based on variations of the non-stationarity of Reverberation Groups (RG) [12] assessed by the INS [18].
The non-stationarity variation for consecutive RGs is defined by the normalized distance , where stands for the -th RG of a signal and its INS vector. A similar approach is also performed on a frame-by-frame bases as to define the frame absorption which is dependent on a non-stationarity threshold as
| (6) |
where and are the inflection points with growth rates of and , is a minimum shift in order to avoid total absorption. and define the maximum absorption values, where assigns the importance of the present RG and is a factor defined in [12] such that only for .
Considering the harmonic structure of speech signals, the harmonic absorption approach is defined as
| (7) |
where , , and are free parameters adopted to incorporate the harmonic and non-harmonic information of each frame based on the non-stationary variation . This is performed in order to enhance harmonic frames that are relevant for speech intelligibility and reduce noisy-reverberant masking components. Therefore, the processed frame can be obtained by .
III-A3 Speech Signal Reconstruction
The last step of the HnH-NRSE method is the reconstruction of the speech signal as a processed version . To this end, resulting frames are used on the time domain overlap-add signal composition technique.
For the proposed HnH-NRSE, the harmonic factors and exponent coefficients are defined as , , and .
III-B Proposed Composite Methods
In this subsection, the composite methods IRMN and IRMO are introduced as a combination of the acoustic mask IRM and the speech enhancement methods NNESE and OMLSA.
IRMN: The IRM [30] is defined for reverberant environments considering the SRR (Speech-to-Reverberant Ratio). The main idea is to select TF regions on frame and band that have more energy related to the direct path signal and remove overlap-masking components due to reverberation inside a room. Therefore, the IRM can be defined as
| (8) |
where is a threshold in dB that defines the selection of TF regions.
The composite scheme proposed in this paper is based on the temporal speech enhancement method NNESE [22]. In the NNESE procedure the noise standard deviation is estimated using the DATE estimator (d-Dimensional Trimmed Estimator) [26] on a non-overlap frame-by-frame approach. To this end, a detection threshold is defined as
| (9) |
where is the minimum SNR threshold for the -th frame. For a Gaussian noise, and .
The DATE estimator organize the samples of the -th frame by amplitude as . The Bienayme-Chebyshev-Markov inequality is then applied to calculate such that the samples lower than are considered noise-only amplitudes.
| (10) |
where is the confidence degree, which is assumed to be % for a Gaussian noise.
Then, it is verified the existence of a that satisfies the relation
| (11) |
where is adjustment factor that is dependent on the detection threshold:
| (12) |
Otherwise, it is considered to be . The noise standard deviation for that frame is then calculated as
| (13) |
The amplitude is modified directly from the corrupted signal considering attenuation factors and as
| (14) |
The IRM is directly considered for the estimation of . After organizing the samples of a frame , the standard deviation estimate is selected by the fraction threshold of regions dominated by noisy-reverberant distortions in the local acoustic mask. For a total number of frequency bands adopted in the IRM, is defined as
| (15) |
This way, the value in equation (13) is replaced by , where is the integer operator.
After the amplitude removal of the distortion components, the acoustic mask is applied to the enhanced signal. As the NNESE speech enhancement is temporal designed, the posterior application of IRM can deal with spectro-temporal regions that were not completely considered in a intrusive fashion, leading to an overall better speech intelligibility and quality improvement result.
IRMO: The second comparative method is a variation of [41] for environments with the reverberation effect. The proposed adapted strategy adopts the acoustic mask IRM and OMLSA speech enhancement approaches and is denominated as IRMO.
An important step of OMLSA technique is the association of the SSPs (Speech Presence Probabilities) in a given TF region. This is performed in order to calibrate the gain for the enhancement procedure. In this work, this step is replaced by a IRM indication of a TF speech region as follows.
Consider and the respective STFT coefficients of the direct and corrupted speech signals obtained via overlapping Hamming analysis windows. Let the presence and absence of speech be considered under hypothesis and , respectively. Taking into account the assumption of statistically independent Gaussian random variables for the STFT coefficients, the desired gain is defined such that
| (16) |
where is the expectation operator. The OMLSA adopts the IMCRA [42] to estimate the noise power spectrum. After the estimation, this method reconstructs the enhanced speech signal by minimizing the mean-square error of the log-spectral amplitude. Under the constraint of assuming greater values than a threshold when speech is absent it is shown [19] that
| (17) |
where is the gain under the hypothesis that speech is present in the TF bin, is the SPP and is the probability of absence of speech.
For the IRMO composite scheme, the values of and are both determined by IRM, as in
| (18) |
and
| (19) |
where , , and are defined in [41]. The composition of these two methods merges the spectral cues present in the mask that are important to intelligibility with the quality gain imposed by the speech enhancement method. This way, the approach can obtain simultaneous intelligibility and quality improvement under noisy-reverberant conditions. Additionally, the reverberant mask threshold is set to dB for composite solutions IRMO and IRMN.
IV Objective Evaluation of Speech Intelligibility and Quality
This Section, briefly introduces of the objective measures applied in this work for speech intelligibility and speech quality prediction.
IV-A Short-Time Intelligibility Objective Measure
The short-time objective intelligibility measure (STOI) [34] is a correlation-based method to compare the spectrum of the clean and the enhanced speech signals in the frequency domain. The correlation between temporal envelopes of the clean and noisy speech signals is defined as the intermediate intelligibility measure STOI(j,l) of each frequency band and each time frame . The STOI is then computed as
| (20) |
where is the total number of speech frames.
IV-B Short-Time Approximated Speech Intelligibility Index
For approximated short-time versions of the SII [43][35], time-frequency SNR values are computed at each critical frequency band and time frame , and than normalized to the range. The ASIIST measure assumes a smooth normalization for the time-frequency SNR, given by
| (21) |
The ASIIST is then computed as a weighted average of all values given in (21):
| (22) |
where is the total number of critical bands, and are the critical-band-importance weights. A relevant aspect of these short-time based measures is the capacity to account for the natural non-stationarity behavior of acoustic noises.
IV-C Perceptual Evaluation of Speech Quality
The PESQ is an objective measure assess quality of narrow-banded speech and handset telephony [37]. It is also largely adopted to estimate the quality of speech signals corrupted with noise due to its high correlation to hearing perceptual evaluation [44].
The PESQ score is calculated following four major steps of pre-processing, time alignment, loudness perception model transformation and disturbance computation. Due to the non-stationary behavior of acoustic noises, in this work the symmetrical () and asymmetrical () distances are computed per frame between the analyzed and reference speech signals
| (23) |
such that the final PESQ score is average over all frames taking into account the variability of acoustic distortions.
IV-D Speech-to-Reverberation Modulation Energy Ratio
The non-intrusive SRMR quality metric [36] estimates the human perceived reverberation effect on speech signals. This measure uses long-term temporal dynamics information to identify the presence of reverberation considering a double modulation per frame approach. An average per-modulation band energy is obtained from Hilbert temporal envelopes. The SRMR is then computed as
| (24) |
where is the upper summation bound that is dependent on the speech signal under evaluation.
IV-E Perceptual Evaluation of Audio Quality
The PEAQ [38] is a measurement of perceptual evaluation of coded audio signals based on several perceptual features called Model Output Variables (MOVs). These features are typically computed estimated masking thresholds for the error signal or comparing the internal ear representation between processed and reference signals. The measure is finally obtained using the output of a neural network. In this work, the PEAQ f2-model variation is adopted with newly parameters and two MOVs: the Average Distorted Blocks (ADB) and the Average Modulation Difference #1 (AvgModDiff1) as in [39].
V Experiments and Discussion
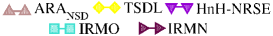
The speech intelligibility and quality results obtained with proposed solutions and baseline techniques ARANSD [12] and TSDL [27] are presented in this Section. Each testing scenario considered speech signals from the IEEE speech database [45]. A total of speech signals is selected for the TSDL training step, with of these signals being used as validation set. Acoustic noises Babble and Cafeteria were extracted from Freesound222Available at www.freesound.org. database identified as “Group Talking” and “Cafe Ambiance”, respectively. Speech utterances have sampling rate of kHz and average time duration of seconds.
Several noisy-reverberant conditions are used to evaluate the proposed techniques in terms of speech intelligibility and quality. In order to compose the noisy-reverberant environment, two real reverberation rooms (LASP2 and Stairway) and two non-stationary acoustic noises (Babble and Cafeteria) are considered in the experiments. The LASP2 room is part of the LASP_RIR333Available at lasp.ime.eb.br. database with a reverberation time of s. Room Stairway is selected from the AIR database [31] and presents reverberation times of s. The Babble and Cafeteria additive background noises are selected, respectively, from the RSG-10 [32] and DEMAND [33] databases. These noises are classified as non-stationary, with maximum INS of and .
| Noise | SNR | UNP | ARANSD | TSDL | HnH-NRSE | IRMO | IRMN |
| Babble INS | 2.3 | 64.0 | 64.2 | 64.6 | 67.1 | 85.1 | 87.0 |
| 0.2 | 60.0 | 60.1 | 61.1 | 64.0 | 83.6 | 85.2 | |
| -1.9 | 56.0 | 56.8 | 58.4 | 61.0 | 81.5 | 83.1 | |
| -4.3 | 52.0 | 52.2 | 54.6 | 57.9 | 79.0 | 80.6 | |
| -7.3 | 48.0 | 48.6 | 50.1 | 54.8 | 75.6 | 77.3 | |
| -10.6 | 44.0 | 44.7 | 44.8 | 51.7 | 70.3 | 71.6 | |
| Average | 54.0 | 54.4 | 55.6 | 59.4 | 79.2 | 80.8 | |
| Cafeteria INS | 1.3 | 64.0 | 64.1 | 65.8 | 66.4 | 85.3 | 87.4 |
| -0.8 | 60.0 | 60.2 | 63.7 | 63.4 | 83.7 | 85.8 | |
| -2.9 | 56.0 | 56.2 | 61.3 | 60.3 | 81.6 | 83.8 | |
| -5.4 | 52.0 | 52.7 | 58.7 | 57.2 | 79.1 | 81.4 | |
| -8.3 | 48.0 | 48.3 | 53.7 | 54.1 | 75.6 | 77.8 | |
| -12.2 | 44.0 | 41.1 | 46.8 | 51.0 | 70.4 | 73.6 | |
| Average | 54.0 | 54.3 | 58.3 | 58.7 | 79.3 | 81.6 | |
| Overall Average | 54.0 | 54.4 | 57.0 | 59.1 | 79.2 | 81.4 | |
| Noise | SNR | UNP | ARANSD | TSDL | HnH-NRSE | IRMO | IRMN |
| Babble INS | 4.2 | 64.0 | 64.3 | 63.5 | 68.6 | 86.9 | 89.0 |
| 2.1 | 60.0 | 60.4 | 61.2 | 65.4 | 85.6 | 87.4 | |
| 0.1 | 56.0 | 56.0 | 58.6 | 62.2 | 83.9 | 85.5 | |
| -2.2 | 52.0 | 52.7 | 55.4 | 59.0 | 81.7 | 83.1 | |
| -4.8 | 48.0 | 48.3 | 51.3 | 55.7 | 78.9 | 80.0 | |
| -8.6 | 44.0 | 44.8 | 45.9 | 52.3 | 74.1 | 75.4 | |
| Average | 54.0 | 54.4 | 56.0 | 60.5 | 81.8 | 83.4 | |
| Cafeteria INS | 2.5 | 64.0 | 64.2 | 66.2 | 68.3 | 87.1 | 89.0 |
| 0.6 | 60.0 | 60.2 | 64.2 | 65.2 | 85.6 | 87.4 | |
| -1.5 | 56.0 | 56.9 | 61.5 | 62.1 | 83.8 | 85.5 | |
| -3.8 | 52.0 | 52.6 | 57.9 | 58.9 | 81.6 | 83.1 | |
| -6.5 | 48.0 | 48.4 | 53.2 | 55.6 | 78.4 | 79.8 | |
| -12.8 | 44.0 | 44.1 | 47.2 | 52.3 | 73.2 | 75.6 | |
| Avg. | 54.0 | 54.4 | 58.4 | 60.4 | 81.6 | 83.4 | |
| Overall Average | 54.0 | 54.4 | 57.2 | 60.5 | 81.7 | 83.4 | |
(a)
(b)
Speech signals are corrupted considering SNRs values ranging from dB up to dB, where the SNRs are measured between the reverberant speech signal and the background noise. For each reverberant signal, SNRs are selected in order to obtain STOI [34] objective intelligibility scores of {, , , , and }. The limit values of and are defined here as thresholds of poor and good intelligibility for the unprocessed (UNP) noisy-reverberant speech. Results are organized considering the increasing value of , i.e., for each measure rooms LASP2 ( s) and Stairway ( s) are presented consecutively with acoustic noises Babble and Cafeteria within each case.
A listening test [46] with native Brazilian volunteers ( male and female) was conducted adopting a closed scenario of phonetic balanced words22footnotemark: 2. Their ages ranged from to years with an average of . A simulated room with x x m3 and s was generated by the image source method (ISM) [47]. The SSN acoustic noise was adopted with SNRs of dB, dB and dB. words were considered for each of test conditions, i.e., SNR levels for methods plus the unprocessed case. Participants were introduced to the task in a training session with words. The material was diotically presented using a pair of Sennheiser HD200 headphones. Listeners heard each word once in an arbitrary presentation order and selected one among five words in order to compute the Word Recognition Rate (WRR).
V-A Objective Speech Intelligibility Evaluation
The proposed and competing methods are first evaluated in terms of STOI intelligibility scores. Tables I and II show the STOI values for rooms LASP2 and Stairway, respectively. Note that, the HnH-NRSE attains the highest STOI average results for most SNR conditions and noises when considering the ARANSD and TSDL methods. This is particularly true for the Stairway room with higher , where the proposed solution surpasses the competing methods in all cases. The HnH-NRSE acquires an average STOI value of and for rooms LASP2 and Stairway. Equivalent intelligibility scores of and are observed for the TSDL whereas and are achieved by the ARANSD. The lower intelligibility acquired by the ARANSD for the STOI measure can be explained by its processing approach that absorbs frames with dominant masking components without considerations on the spectral envelope correlation which are relevant for the STOI intelligibility measures. The highest overall average intelligibility results are achieved by composed solutions IRMO and IRMN. For theses reference approaches, the proposed IRMN is able to acquire the highest intelligibility scores for all scenarios. The IRMN attained, an average STOI of and for rooms LASP2 and Stairway, respectively. This indicates intelligibility gains of and for the IRMN solution against and for the IRMO technique.
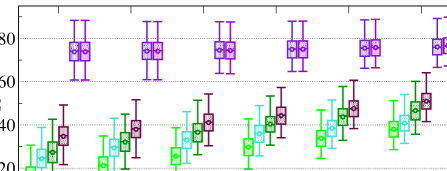
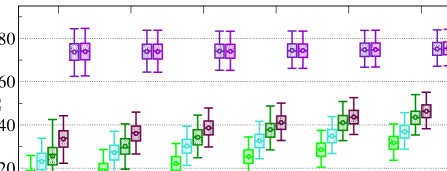
Figure 3 depicts the box-plot of ASIIST intelligibility scores for rooms LASP2 and Stairway considering both acoustic noises Babble and Cafeteria. Note that for this objective measure, the HnH-NRSE surpasses methods ARANSD and TSDL in all conditions, achieving the highest average ASIIST results. In light of these solutions, the variance of ASIIST values are similar for all STOI scenarios. For the LASP2 room, the proposed HnH-NRSE overall average is in comparison with for the TSDL and for the ARANSD. Equivalent scores for Stairway room are , and , respectively. This implies an overall average intelligibility gain of for HnH-NRSE, for TSDL and for ARANSD, which corroborates the capacity of the proposed method to increase speech intelligibility under noisy-reverberant conditions. Furthermore, this indicates that the proposed approach is suited for real acoustic effects with different non-stationary behavior. For the composed techniques, the IRMN attained overall averages of and for rooms LASP2 and Stairway in comparison to and for the IRMO, respectively. The similarity of these results can be partially explained by the direct adoption of local time-frequency SNR for the ASIIST computation and the usage of the IRM acoustic mask for both composite measures, as the IRM imposes on the enhanced speech signal the spectral cues present in the mask that are important to intelligibility.
V-B Perceptual Intelligibility Evaluation
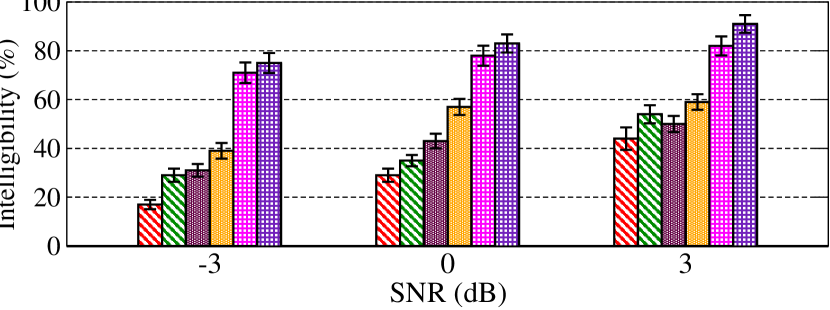
A perceptual evaluation is also performed in this work. The average intelligibility scores and standard deviations values for each method are presented in Fig. 4. The HnH-NRSE improves the intelligibility under all conditions over competing techniques. The proposed method achieves intelligibility improvements of p.p., p.p. and p.p. against p.p., p.p. and p.p. for the TSDL and p.p., p.p. and p.p. for ARANSD under SNR values of dB, dB and dB, respectively. Furthermore, composed solutions attained overall average intelligibility improvements of for IRMO and for IRMN. This result corroborates with previous objective findings on the proposed strategies capacity to provide intelligibility improvement.
| Noise | SNR | UNP | ARANSD | TSDL | HnH-NRSE | IRMO | IRMN |
| Babble INS | 2.3 | 1.93 | 1.79 | 1.95 | 2.01 | 3.02 | 3.02 |
| 0.2 | 1.85 | 1.65 | 1.87 | 1.90 | 2.90 | 2.87 | |
| -1.9 | 1.72 | 1.69 | 1.82 | 1.78 | 2.74 | 2.73 | |
| -4.3 | 1.64 | 1.61 | 1.70 | 1.68 | 2.58 | 2.58 | |
| -7.3 | 1.50 | 1.60 | 1.63 | 1.57 | 2.38 | 2.41 | |
| -10.6 | 1.44 | 1.58 | 1.41 | 1.49 | 2.16 | 2.18 | |
| Average | 1.68 | 1.66 | 1.72 | 1.74 | 2.63 | 2.63 | |
| Cafeteria INS | 1.3 | 1.95 | 1.97 | 1.98 | 2.10 | 3.12 | 3.11 |
| -0.8 | 1.90 | 1.98 | 1.92 | 1.99 | 3.00 | 2.98 | |
| -2.9 | 1.84 | 1.86 | 1.87 | 1.88 | 2.86 | 2.84 | |
| -5.4 | 1.76 | 1.77 | 1.82 | 1.77 | 2.69 | 2.69 | |
| -8.3 | 1.56 | 1.74 | 1.78 | 1.67 | 2.51 | 2.52 | |
| -12.2 | 1.54 | 1.63 | 1.62 | 1.58 | 2.29 | 2.31 | |
| Average | 1.76 | 1.82 | 1.83 | 1.83 | 2.74 | 2.74 | |
| Overall Average | 1.72 | 1.74 | 1.77 | 1.78 | 2.68 | 2.68 | |
| Noise | SNR | UNP | ARANSD | TSDL | HnH-NRSE | IRMO | IRMN |
| Babble INS | 4.2 | 2.00 | 1.97 | 2.03 | 2.26 | 3.12 | 3.12 |
| 2.1 | 1.93 | 1.94 | 1.99 | 2.13 | 3.03 | 3.02 | |
| 0.1 | 1.90 | 1.88 | 1.95 | 2.01 | 2.92 | 2.90 | |
| -2.2 | 1.81 | 1.85 | 1.93 | 1.89 | 2.79 | 2.78 | |
| -4.8 | 1.71 | 1.82 | 1.84 | 1.78 | 2.63 | 2.65 | |
| -8.6 | 1.66 | 1.78 | 1.74 | 1.68 | 2.48 | 2.48 | |
| Average | 1.83 | 1.87 | 1.91 | 1.96 | 2.83 | 2.83 | |
| Cafeteria INS | 2.5 | 2.10 | 2.12 | 2.26 | 2.39 | 3.11 | 3.11 |
| 0.6 | 2.03 | 2.10 | 2.22 | 2.27 | 3.03 | 3.02 | |
| -1.5 | 2.00 | 2.01 | 2.16 | 2.16 | 2.93 | 2.91 | |
| -3.8 | 1.94 | 1.93 | 2.11 | 2.04 | 2.80 | 2.79 | |
| -6.5 | 1.91 | 1.90 | 2.06 | 2.01 | 2.63 | 2.66 | |
| -12.8 | 1.78 | 1.88 | 2.01 | 1.96 | 2.44 | 2.55 | |
| Average | 1.96 | 1.99 | 2.14 | 2.14 | 2.82 | 2.84 | |
| Overall Average | 1.89 | 1.93 | 2.02 | 2.05 | 2.82 | 2.84 | |
V-C Speech Quality Measures
The PESQ quality results are presented in Tables III and IV. In this case, the UNP speech signal attained an overall average quality of and for rooms LASP2 and Stairway. The highest scores are obtained by HnH-NRSE corresponding values of and , followed by TSDL with and and ARANSD with and . This indicates that the proposed method outperforms competing non-composite strategies for the majority of noisy-reverberant scenarios. This can be particularly noted for higher SNR values, where the HnH-NRSE accomplishes the highest PESQ gains. For the composite techniques, the IRMN and IRMO attained the same overall average for room LASP2. Considering the most reverberant room Stairway, the IRMN achieves a better PESQ score of against for the IRMO.
(a) (b)
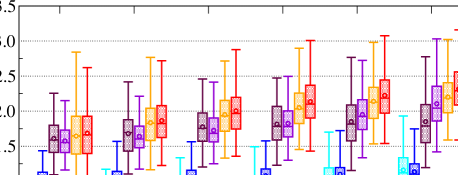
In this work, proposed and competing methods are also evaluated in terms of SRMR quality scores. Figure 5 depicts the SRMR box-plot values for the noisy-reverberant scenarios. Note that, the HnH-NRSE attains the highest SRMR results for most STOI conditions when considering the ARANSD and TSDL methods. This can be noted specially for higher STOI results. The HnH-NRSE attains an average quality of for LASP2 room against and for TSDL and ARANSD. The same behavior can be noted for the Stairway room, with equivalent quality average scores of , and . Note that the proposed HnH-NRSE solution attains SRMR quality scores that are close to composite approaches IRMO and IRMN. This is particularly true for higher STOI scores. For the condition of STOI , the HnH-NRSE attains SRMR of which is the same as the composite method IRMO, which indicates that the proposed approach is able to improve quality of speech signals under adverse noisy-reverberant conditions. Regarding composed methods, the IRMN attained the highest SRMR scores in all noisy-reverberant scenarios, with the average scores of and for rooms LASP2 and Stairway, respectively. The competing IRMO acquired and average SRMR values for the same acoustic environments.

(a) (b)
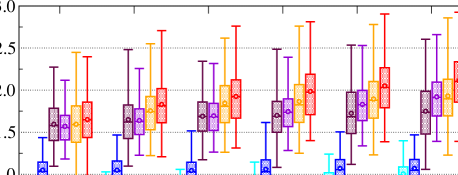
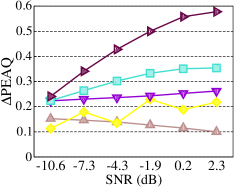
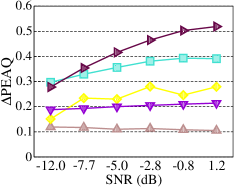
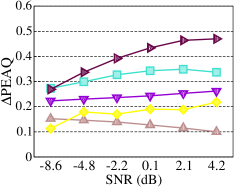
For the PEAQ objective measure, the quality improvement attained by each method is depicted in Figures 6 and 7 for rooms LASP2 and Stairway, respectively. The HnH-NRSE outperforms competing methods in most scenarios, leading to an overall average gain of for LASP2 and for Stairway. Considering the most non-stationary Babble noise and the greater of s for the Stairway room, the proposed method acquired the highest PEAQ gain in all SNR conditions, with an average PEAQ of . This result corroborates the capacity of the proposed method to deal with real acoustic effects of different non-stationary natures, being able to provide both quality and intelligibility under diverse noisy-reverberant environments. As means of comparison, the TSDL and ARANSD strategies achieved average PEAQ values of and for the same condition. Note that quality gains attained by HnH-NRSE are in most cases the closest to the composite methods IRMO and IRMN scores. The IRMN obtains the highest quality improvements for most environments regarding composite methods. This reinforces that the combined usage of IRM and NNESE on noisy-reverberant scenarios simultaneously provide the best quality and intelligibility gains.

(a) (b)
VI Conclusion
In this work, the HnH-NRSE method was proposed as a single time domain solution for simultaneous speech intelligibility and quality improvement under noisy-reverberant conditions. To this end, the technique performs an harmonic decomposition and an objective assessment of the non-stationarity variations of speech signal in order to define an adaptive gain to deal with masking components. Two other composite solutions IRMO and IRMN were presented as combined methods for simultaneous improvement on noisy and reverberant scenarios, combining the IRM mask with OMLSA and NNESE speech enhancement solutions. The HnH-NRSE attained an overall average intelligibility improvement of p.p. for the STOI measure and p.p. for the ASIIST measure. The highest STOI improvement was achieved by the composed solution IRMN with p.p. intelligibility gain. Objective quality results demonstrated that the HnH-NRSE is also able to increase speech quality, with the highest PESQ increment of for the Stairway room with Babble noise at SNR of dB. The proposed HnH-NRSE also obtained average SRMR quality scores of for the Stairway room, which is similar to the reference composed approache IRMO, whereas the IRMN attained in this scenario. A perceptual intelligibility listening test was further considered and corroborated the objective results performed in this work.
References
- [1] R. Bolt and A. MacDonald, “Theory of speech masking by reverberation,” The Journal of the Acoustical Society of America, vol. 21, no. 6, pp. 577–580, 1949.
- [2] A. K. Nabelek and J. M. Pickett, “Monaural and binaural speech perception through hearing aids under noise and reverberation with normal and hearing-impaired listeners,” Journal of Speech and Hearing Research, vol. 17, no. 4, pp. 724–739, 1974.
- [3] Y. Tang, C. Arnold, and T. J. Cox, “A study on the relationship between the intelligibility and quality of algorithmically-modified speech for normal hearing listeners,” Journal of Otorhinolaryngology, Hearing and Balance Medicine, vol. 1, no. 1, p. 5, 2018.
- [4] L. Madmoni, S. Tibor, I. Nelken, and B. Rafaely, “The effect of partial time-frequency masking of the direct sound on the perception of reverberant speech,” IEEE/ACM Transactions on Audio, Speech, and Language Processing, vol. 29, pp. 2037–2047, 2021.
- [5] Y. Lu and M. Cooke, “The contribution of changes in f0 and spectral tilt to increased intelligibility of speech produced in noise,” Speech Communication, vol. 51, no. 12, pp. 1253–1262, 2009.
- [6] C. A. Brown and S. P. Bacon, “Fundamental frequency and speech intelligibility in background noise,” Hearing research, vol. 266, 2010.
- [7] X. Dong and D. S. Williamson, “Towards real-world objective speech quality and intelligibility assessment using speech-enhancement residuals and convolutional long short-term memory networks,” The Journal of the Acoustical Society of America, vol. 148, no. 5, 2020.
- [8] P. Odya, J. Kotus, A. Kurowski, and B. Kostek, “Acoustic sensing analytics applied to speech in reverberation conditions,” Sensors, vol. 21, no. 18, p. 6320, 2021.
- [9] C. H. Taal, R. C. Hendriks, and R. Heusdens, “Speech energy redistribution for intelligibility improvement in noise based on a perceptual distortion measure,” Computer Speech & Language, vol. 28, no. 4, 2014.
- [10] T. Arai, N. Hodoshima, and K. Yasu, “Using steady-state suppression to improve speech intelligibility in reverberant environments for elderly listeners,” IEEE Transactions on Audio, Speech, and Language Processing, vol. 18, no. 7, pp. 1775–1780, 2010.
- [11] P. N. Petkov and Y. Stylianou, “Adaptive gain control for enhanced speech intelligibility under reverberation,” IEEE Signal Processing Letters, vol. 23, no. 10, pp. 1434–1438, 2016.
- [12] G. Zucatelli and R. Coelho, “Adaptive reverberation absorption using non-stationary masking components detection for intelligibility improvement,” IEEE Signal Processing Letters, vol. 27, pp. 1–5, 2020.
- [13] F. Bederna, H. F. Schepker, C. Rollwage, S. Doclo, A. Pusch, J. Bitzer, and J. Rennies, “Adaptive compressive onset-enhancement for improved speech intelligibility in noise and reverberation.” in INTERSPEECH, 2020, pp. 1351–1355.
- [14] H. Tokuno, O. Kirkeby, P. A. Nelson, and H. Hamada, “Inverse filter of sound reproduction systems using regularization,” IEICE Transactions on Fundamentals of Electronics, Communications and Computer Sciences, vol. 80, no. 5, pp. 809–820, 1997.
- [15] H.-Y. Dong and C.-M. Lee, “Speech intelligibility improvement in noisy reverberant environments based on speech enhancement and inverse filtering,” EURASIP Journal on Audio, Speech, and Music Processing, vol. 2018, no. 1, pp. 1–13, 2018.
- [16] M. Niermann and P. Vary, “Listening enhancement in noisy environments: Solutions in time and frequency domain,” IEEE/ACM Transactions on Audio, Speech, and Language Processing, vol. 29, 2021.
- [17] W. Strange, J. J. Jenkins, and T. L. Johnson, “Dynamic specification of coarticulated vowels,” The Journal of the Acoustical Society of America, vol. 74, no. 3, pp. 695–705, 1983.
- [18] P. Borgnat, P. Flandrin, P. Honeine, C. Richard, and J. Xiao, “Testing stationarity with surrogates: A time-frequency approach,” IEEE Transactions on Signal Processing, vol. 58, no. 7, pp. 3459–3470, 2010.
- [19] I. Cohen and B. Berdugo, “Speech enhancement for non-stationary noise environments,” Signal Processing, vol. 81, no. 11, pp. 2403–2418, 2001.
- [20] L. Zão, R. Coelho, and P. Flandrin, “Speech enhancement with EMD and Hurst-based mode selection,” IEEE/ACM Transactions on Audio, Speech, and Language Processing, vol. 22, no. 5, pp. 899–911, 2014.
- [21] R. Coelho and L. Zão, “Empirical mode decomposition theory applied to speech enhancement,” in Signals and Images: Advances and Results in Speech, Estimation, Compression, Recognition, Filtering and Processing, R. Coelho, V. Nascimento, R. Queiroz, J. Romano, and C. Cavalcante, Eds. Boca Raton, Florida: CRC Press, 2015.
- [22] R. Tavares and R. Coelho, “Speech enhancement with nonstationary acoustic noise detection in time domain,” IEEE Signal Processing Letters, vol. 23, no. 1, pp. 6–10, 2016.
- [23] S. Nørholm, J. Jensen, and M. Christensen, “Enhancement and noise statistics estimation for non-stationary voiced speech,” IEEE/ACM Trans. on Audio, Speech, and Language Processing, vol. 24, no. 4, 2016.
- [24] N. E. Huang, Z. Shen, S. R. Long, M. C. Wu, H. H. Shih, Q. Zheng, N.-C. Yen, C. C. Tung, and H. H. Liu, “The empirical mode decomposition and the hilbert spectrum for nonlinear and non-stationary time series analysis,” Proceedings of the Royal Society of London. Series A, vol. 454, no. 1971, pp. 903–995, 1998.
- [25] H. E. Hurst, “Long-term storage capacity of reservoirs,” Trans. Amer. Soc. Civil Eng., vol. 116, pp. 770–799, 1951.
- [26] D. Pastor and F. Socheleau, “Robust estimation of noise standard deviation in presence of signals with unknown distributions and occurrences,” IEEE Transactions on Signal Processing, vol. 60, no. 4, 2012.
- [27] Y. Zhao, Z.-Q. Wang, and D. Wang, “Two-stage deep learning for noisy-reverberant speech enhancement,” IEEE/ACM Transactions on Sudio, Speech, and Language Processing, vol. 27, no. 1, pp. 53–62, 2019.
- [28] N. Li and P. Loizou, “Factors influencing intelligibility of ideal binary-masked speech: Implications for noise reduction,” Journal of the Acoustic Society of America, vol. 123, no. 3, pp. 1673–1682, march 2007.
- [29] H. Hong, Z. Zhao, X. Wang, and Z. Tao, “Detection of dynamic structures of speech fundamental frequency in tonal languages,” IEEE Signal Processing Letters, vol. 17, no. 10, pp. 843–846, 2010.
- [30] K. Kokkinakis, O. Hazrati, and P. C. Loizou, “A channel-selection criterion for suppressing reverberation in cochlear implants,” The Journal of the Acoustical Society of America, vol. 129, no. 5, 2011.
- [31] M. Jeub, M. Schafer, and P. Vary, “A binaural room impulse response database for the evaluation of dereverberation algorithms,” in 2009 16th International Conference on Digital Signal Processing. IEEE, 2009.
- [32] H. J. Steeneken and F. W. Geurtsen, “Description of the RSG-10 noise database,” Report IZF, vol. 3, p. 1988, 1988.
- [33] J. Thiemann, N. Ito, and E. Vincent, “DEMAND: a collection of multi-channel recordings of acoustic noise in diverse environments,” in Proc. Meetings Acoust., 2013.
- [34] C. H. Taal, R. C. Hendriks, R. Heusdens, and J. Jensen, “An algorithm for intelligibility prediction of time–frequency weighted noisy speech,” IEEE Transactions on Audio, Speech, and Language Processing, vol. 19, no. 7, pp. 2125–2136, 2011.
- [35] R. C. Hendriks, J. B. Crespo, J. Jensen, and C. H. Taal, “Optimal near-end speech intelligibility improvement incorporating additive noise and late reverberation under an approximation of the short-time sii,” IEEE/ACM Transactions on Audio, Speech, and Language Processing, vol. 23, no. 5, pp. 851–862, 2015.
- [36] J. F. Santos, M. Senoussaoui, and T. H. Falk, “An improved non-intrusive intelligibility metric for noisy and reverberant speech,” in 14th International Workshop on Acoustic Signal Enhancement. IEEE, 2014.
- [37] A. W. Rix, J. G. Beerends, M. P. Hollier, and A. P. Hekstra, “Perceptual evaluation of speech quality (pesq)-a new method for speech quality assessment of telephone networks and codecs,” in 2001 IEEE International Conference on Acoustics, Speech, and Signal Processing, vol. 2.
- [38] C. Colomes, C. Schmidmer, T. Thiede, and W. C. Treurniet, “Perceptual quality assessment for digital audio: Peaq-the new itu standard for objective measurement of the perceived audio quality,” in Audio Engineering Society Conference: 17th International Conference: High-Quality Audio Coding. Audio Engineering Society, 1999.
- [39] T. Kastner and J. Herre, “An efficient model for estimating subjective quality of separated audio source signals,” in 2019 IEEE Workshop on Applications of Signal Processing to Audio and Acoustics, pp. 95–99.
- [40] L. R. Rabiner and R. W. Schafer, Digital processing of speech signals. Prentice Hall, 1978.
- [41] L. Lightburn, E. De Sena, A. Moore, P. A. Naylor, and M. Brookes, “Improving the perceptual quality of ideal binary masked speech,” in 2017 IEEE International Conference on Acoustics, Speech and Signal Processing (ICASSP). IEEE, 2017, pp. 661–665.
- [42] I. Cohen, “Noise spectrum estimation in adverse environments: Improved minima controlled recursive averaging,” IEEE Transactions on Speech and Audio Processing, vol. 11, no. 5, pp. 466–475, 2003.
- [43] ANSI, American National Standard: Methods for Calculation of the Speech Intelligibility Index. Acoustical Society of America, 1997.
- [44] Y. Hu and P. C. Loizou, “Evaluation of objective quality measures for speech enhancement,” IEEE Transactions on Audio, Speech, and Language Processing, vol. 16, no. 1, pp. 229–238, 2008.
- [45] P. Loizou, Speech enhancement: theory and practice. CRC press, 2007.
- [46] S. Ghimire, “Speech intelligibility measurement on the basis of ITU-T recommendation p.863,” 2012.
- [47] J. B. Allen and D. A. Berkley, “Image method for efficiently simulating small-room acoustics,” The Journal of the Acoustical Society of America, vol. 65, no. 4, pp. 943–950, 1979.