Early Warnings of Binary Neutron Star Coalescence using the SPIIR Search
Abstract
Gravitational waves from binary neutron star mergers can be used as alerts to enable prompt follow-up observations. In particular, capturing prompt electromagnetic and astroparticle emissions from the moment of a binary merger presents unique constraints on the time scale and sky localization for online gravitational wave detection. Here we present the expected performance of the SPIIR online detection pipeline that is designed for this purpose in the upcoming international LIGO-Virgo’s 4th Science Run (O4). Using simulated Gaussian data for the two LIGO observatories with expected O4 sensitivity, we demonstrate that there is a non-negligible opportunity to deliver pre-merger warnings at least before the final plunge. These alerts are expected to be issued at a nominal rate of one binary neutron star coalescence per year and localized within a median searched area of . We envision such a detection to be extremely useful for follow-up observatories with a large field of view such as the Murchison Widefield Array radio facility in Western Australia.
1 Introduction
The era of gravitational wave (GW) astronomy began with its first ever detection from a compact binary coalescence (CBC) in 2015 (Abbott et al., 2016), during the first advanced LIGO observing run. This was achieved using the two LIGO observatories at Hanford (H1) and Livingston (L1), (Aasi et al., 2015). In 2017, Virgo (V1, Acernese et al. (2015)) joined the duo in the second observing run. The iconic detection of a binary neutron star (BNS) merger (Abbott et al., 2017a) and associated electromagnetic (EM) emission signaled the beginning of a new era of GW multi-messenger astronomy (MMA). This was a joint detection of GWs and a short gamma-ray burst (sGRB) detected after the binary merger, by the Fermi-GBM and INTEGRAL space telescopes (Abbott et al., 2017b). This event was followed by numerous other EM observations spanning the entire EM spectrum. This detection has had a tremendous impact in astronomy with several studies emerging from it, including estimation of the Hubble constant (Abbott et al., 2017c), constraints on the neutron star equation of state (Abbott et al., 2019), and also connecting sGRBs and kilonovae to BNS mergers (Abbott et al., 2017b).
GW detections were reported publicly in real-time for the first time during the third LIGO-Virgo observing run O3 (Buikema et al., 2020; Acernese et al., 2019), leading to the search for EM counterparts of GW observations. However, the typical delay between a GW detection and the associated GCN alert was on the order of at least minutes (Magee et al., 2021), and hence the discovery of prompt EM emissions, which are expected during a binary merger (Rezzolla et al., 2011), continued to rely on serendipitous discovery. For example, in the case of GW170817, the sGRB was observed only two seconds after the GW detection. Thus, an advance warning of such events is crucial to alert conventional EM telescopes for prompt follow up observations.
Five gravitational wave detection pipelines have processed GW data in real-time for the past LIGO-Virgo-Kagra collaboration (LVK) science runs. Four modelled search pipelines - SPIIR (Luan et al., 2012; Hooper et al., 2012; Chu et al., 2020), GstLAL (Messick et al., 2017; Sachdev et al., 2019), PyCBC (Nitz et al., 2018; Dal Canton et al., 2020) and MBTA (Adams et al., 2016; Aubin et al., 2021) - use known CBC waveforms to identify a signal within the detector data, while burst signals are recovered by the cWB (Klimenko et al., 2016) pipeline via a coherent analysis. SPIIR (Summed Parallel Infinite Impulse Response) uses a time-domain filtering method equivalent to matched filtering to detect GWs. The SPIIR pipeline uses GPU acceleration for parallel processing to reduce latency and improve computational efficiency (Liu et al., 2012; Guo et al., 2018). Out of the 38 detections reported by SPIIR through public alerts in O3 (Chu et al., 2020), of them were confirmed by the offline searches and later added to the GW catalogs (Abbott et al., 2021a, b, c). The overall latency for the SPIIR pipeline, defined as the time delay between a GW event merger and its detection, is ,111not encompassing latencies associated with data transfer from detectors and skymap/alert generation which corresponds to the H1L1 two detector analysis. This paper describes a new feature for the SPIIR search, targeting ’early warning’ to detect GWs and generate alerts before the merger or at negative latencies. Note that a binary coalescence involving at least one neutron star, tends to spend a few minutes of its time during the inspiral phase within the LIGO-Virgo sensitive frequency band .
Early warning alert systems associated with other matched filtering pipelines have been tested for their localization accuracy and detection efficiency1 (Sachdev et al., 2020; Nitz et al., 2020). In 2020, a mock data challenge (Magee et al., 2021) was conducted within the LVK to test the capability of the low-latency infrastructure to send EW alerts. SPIIR participated in this test sending out one of the five EW mock GCNs and successfully demonstrated the feasibility for it to send pre-merger alerts.222https://gcn.gsfc.nasa.gov/gcn3/27989.gcn3 This study also estimated the expected rate of BNS mergers and their localization areas using Bayestar rapid localization (Singer & Price, 2016), by simulating a four-detector network H1, L1, V1 and Kagra (K1, Akutsu et al. (2020)) in O4.
In this work, we analyse the performance of the SPIIR EW pipeline in a simulated O4 environment. We, in particular, study the performance of the two LIGO detector network (H1L1) which has the minimum expected overall latency caused by data transfer among all available detectors. The main motivation behind the choice of this network is to make detection as early as possible, thereby assisting EM telescopes to observe possible short transients right at the merger (Rezzolla et al., 2011). Since most follow-up telescopes need time to orient themselves to the source direction, saving an additional of the delay from Virgo is extremely useful. We wish to take advantage of this faster network even though it results in a possibly worse localization, which can still be beneficial to observatories with large fields of view (FOV). It should be noted that Virgo will be added to the full-bandwidth search which will produce an enhanced localization within tens of seconds. We then demonstrate the accuracy of parameters including signal-to-noise ratio (SNR) and the chirp mass, which are estimated internally and used to classify the source type via p_astro (Kapadia et al., 2020) and infer properties via hasNS (Foucart et al., 2018). We also ensure the reliability of localization areas at various latencies, which are published via SPIIR EW alerts.
This paper is organized as follows. In section 2, we show details about the SPIIR EW method, and provide information about the simulated O4 data and GW signal injections. Section 3 discusses the results of this simulation run. Finally, in section 4, we discuss the results in the context of EM follow-up by ground and space-based facilities.
2 Method
Early warning alerts are expected to be issued publicly for the first time by LVK in O4. Through this study we demonstrate the expected performance of the SPIIR online pipeline to deliver EW alerts. We only use the LIGO detectors in this work because this two detector network has a very high coincident duty-cycle time ( of total) reported in O3 (Davis et al., 2021), high sensitivity with nearly aligned antenna beam patterns, and most importantly, saves an additional four second data transfer latency caused by Virgo (Magee et al., 2021), making it the most viable combination to promptly report a pre-merger alert in O4, at the cost of a poorer localization for some of the bright events at early detections as compared to other combinations.
2.1 SPIIR Early Warning pipeline
Matched filtering is the optimal method used by CBC pipelines to detect the presence of a GW signal amidst noise. This method involves cross correlating known waveforms, also known as templates, with detector data to output SNR (Finn, 1992; Cutler & Flanagan, 1994). SPIIR filtering is a time-domain equivalent to matched filtering (Luan et al., 2012; Hooper et al., 2012) which uses first order IIR filters to approximate GW templates to a high accuracy, which are then used in a time-domain convolution with the detector data, constructing the SPIIR SNR. The best matched template would maximize the SNR in the presence of a signal, assuming that the noise is stationary Gaussian.
SPIIR pipeline has the capability to process GW data in extremely low latency. Since it is a time-domain convolution, it takes SPIIR theoretically close to to produce SNRs (Luan et al. (2012); Hooper et al. (2012)). However, in our actual implementation, the design costs SPIIR to compute the SNR and to identify candidates (Chu et al., 2020). A coherent network SNR across all active detectors is calculated for any single-detector event above a particular SNR threshold (set to for real-time searches). Trigger candidates are then ranked based on two quantities: (a) the reduced chi-square (), indicating a goodness-of-fit of the SNR time series against expectation and (b) the coherent network SNR (). A false alarm rate (FAR) is calculated based on the probability of an event associated with the background.
In this work, we use a template bank consisting of binary mass and projected spin pairs. These waveform templates have component masses ranging from 1.1 < < 3.0 , focusing on binaries with two neutron stars with promising opportunities to observe EM emissions (Rezzolla et al., 2011). Waveforms for these masses (based on the SpinTaylorT4 (Buonanno et al., 2009) time domain approximation) are truncated at specific time intervals before merger and used to construct the SPIIR EW filters. The SPIIR filters used in the work are set to have a high () overlap, which is the inner product of the original waveform and the approximant waveform.
We conduct parallel EW searches on the simulated data using the SPIIR pipeline, with the searches having their templates truncated between , at second intervals respectively. For simplicity, we label these configurations with their pre-merger truncation time. For example, the EW search with its templates truncated pre-merger is simply addressed as the run. It should be noted that this number only represents the pre-merger template truncation time and does not correspond to the overall detection latency, which will be addressed in section 3.3. The EW searches are processed at a sampling rate of in conjunction to a full-bandwidth simulation (non-truncated templates), which is processed at for comparison. This is because EW detections are recovered at a frequency Hz at before the merger and earlier, in the inspiral phase.333The downsampling also reduces the computational complexity of EW simulations, thereby decreasing the amount of resources used. We label the full-bandwidth simulation as the run to stay consistent across. For each of these searches, the FARs associated with candidate triggers are computed independent from one another.
2.2 Simulated data
We inject signals into stationary Gaussian noise simulating the strain data produced by the LIGO detectors in O4. The estimated power spectral density (PSD) of LIGO in O4 is given in Abbott et al. (2018), with an expected BNS range of . We used the gstlal_fake_frames package (Messick et al., 2017) to generate this strain data using the given PSD. Both LIGO-Hanford and LIGO-Livingston are expected to reach a similar sensitivity in O4 and hence the output strain is expected to be similar in both. The whole data segment spans three weeks and is generated in the gwf444https://dcc.ligo.org/LIGO-T970130/public format.
The injected signals used in this analysis are generated using the lalsuite package (LIGO Scientific Collaboration, 2018). The component masses of the injections are sampled between 1.0 < < 2.3 , with a uniform distribution. The spin is restricted to be below for both components and sampled with an isotropic distribution. The injected signals are distributed uniformly within a comoving volume of redshift . The final population set, using the constraints mentioned above, has () number of injections.
Expected SNRs for GW signals can be theoretically calculated using their mass, spin and distance parameters. By truncating the waveforms, we can also estimate the SNRs at different latencies before the merger. Fig. 1 shows the evolution of SNRs at different pre-merger latencies for a fiducial BNS reference source at in O4 sensitivity. We also show that the SPIIR SNRs at the truncated intervals indicate consistency with the expected SNRs. Similarly, expected SNRs at different pre-merger latencies are theoretically calculated for all the injected signals in our simulation.

3 Results
Recovered signals from the searches are considered to be a detection only if the FAR reported by the associated search is less than one per month (or ), which is also the threshold used for reporting EW candidates in the MDC (Magee et al., 2021). We find that % of all injected signals were detected by the run. Using as the local BNS merger rate, estimated in Abbott et al. (2021a), we expect a median detection rate of BNSs per year in O4 using the full-bandwidth configuration. It should be noted that our choice of the FAR threshold also includes sub-threshold events, when compared to the threshold of one per two months used to select the open public alerts during O3. In comparison, Magee et al. (2021) uses a threshold of and anticipate the detection rate to be BNSs per year for a H1L1V1K1 four detector network. If we apply the same criterion, we also see a similar rate but this is for the H1L1 two detector network. This is probably due to the fact that Magee et al. (2021) uses a Gaussian distribution for their mass model, while we use a uniform distribution, which leads to a larger detection range for our search and hence a comparatively larger rate.
3.1 Accuracy
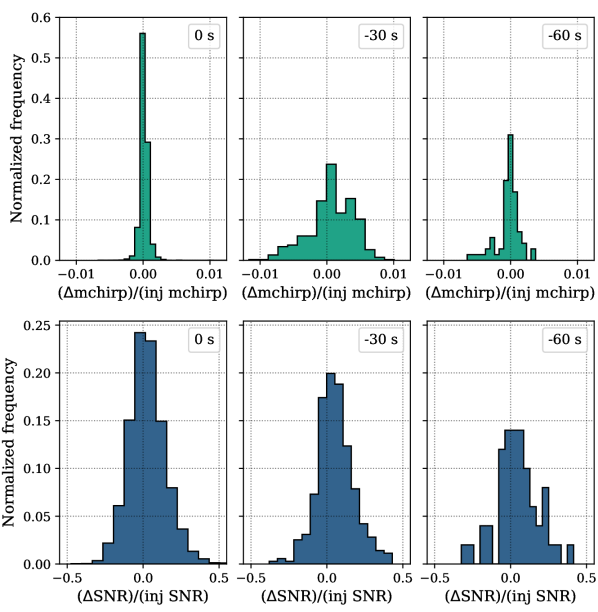
Online estimations of parameters like chirp mass and SNRs are calculated internally by the pipeline and not published directly to the public. However, these parameters are essential to compute the published values of FARs, p_astro (Kapadia et al., 2020) and hasNS (Foucart et al., 2018), which are used to infer source properties and classify detections. Thus, it is very important for pipelines to determine the accuracy of these parameters to ensure the reliability of the published alerts. Fig. 2 compares the SNRs and chirp masses recovered from the searches to the injection set. We demonstrate the performance of the SPIIR EW pipelines by first comparing the chirp mass of the recovered signals to the expected values (Fig. 2, upper panel). We find the fractional difference between the two to be less than for all runs, indicating an accurate recovery. We see that the chirp mass recovered from the run is within an error margin of , with subsequently wider margins for other EW configuration. Next we find that, at an average, the recovered SNRs are within an error margin of with the expected SNRs (Fig. 2, lower panel). It should be noted that a deviation is expected in SNRs because of the SPIIR waveform approximation. The rest of the discrepancy could be attributed to factors like the discreteness in template banks leading to a mismatch with injections, noise influences in low-SNR events and relatively minor PSD mismatches while calculating the SNRs using moving PSD estimations. The accuracy of chirp mass and SNR estimates for the full-bandwidth run has been well studied in Chu et al. (2020) with similar results reported. Fig. 2 shows a histogram of the fractional differences in injected and recovered parameters for , and runs.555 s simulation has a lower number of statistics as compared to others.
3.2 Localization
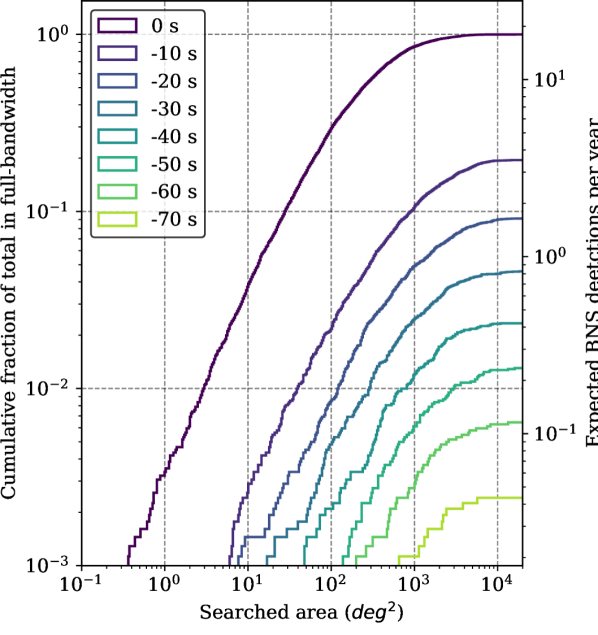
Accurate and rapid localization of GW signals is crucial to enable prompt followup observations. Providing source direction to EM observatories via pre-merger alerts would help enable a prompt follow-up observation. For this study, we use LVK’s rapid localization software, Bayestar (Singer & Price, 2016), to construct sky maps. As we go down in latency, EW simulations trigger at lower frequencies, so only a partial information of the detected signal is recovered. This lowers the estimated SNRs and also the accuracy with which the temporal and phase information is recovered, thus resulting in larger localization areas (Fairhurst, 2018). Fig. 3 shows the cumulative histogram of the searched areas (defined as the smallest area needed to be searched to encompass an event) normalized w.r.t. the total number of detection in the full-bandwidth run ().
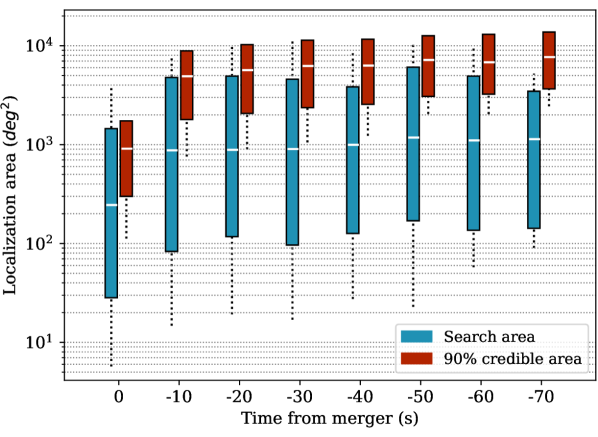
Based on our Gaussian noise simulation for O4, we expect to deliver pre-merger BNS alerts at a rate of per year in O4 with a searched area below using the LIGO network alone. We also expect to detect at least one pre-merger detection in two years localized within a searched area of in O4. However, the chance to have a sub-minute pre-merger detection is seen to be less than . We also compare the searched areas of the candidates with their credible region areas in Fig. 4. Table 1 shows the median values for the searched and credible areas, and also the expected detection rate at all EW latencies in O4. We find that the median values of searched areas are several times smaller than credible areas and the difference becomes more prominent as we go down in latency for the EW runs.
| s | ||||
| s | ||||
| s | ||||
| s | ||||
| s | ||||
| s | ||||
| s | ||||
| s |
3.3 Latency
The overall pipeline latency for each configuration is measured on an online data streaming platform and the median values are recorded in Table 1. These values correspond to the internal latency of the pipeline, which includes delays in the SPIIR filtering algorithm and calculating the FARs. We find that the full-bandwidth configuration has a median intrinsic latency of 666with the potential to go below . consistent with results from Chu et al. (2020). Additional latencies including data-transfer, localization and alert-generation depend on the online infrastructure, which are believed to be significantly lower in O4 as compared to O3 (Magee et al., 2021). The EW runs have a negative median latency indicating pre-merger detection.
4 Discussion
In this work, we investigated the prospects of using the SPIIR EW search, on the two-detector LIGO network, to detect GWs from binary neutron stars before their merger in O4. This configuration saves an additional of data transfer latency from Virgo making it the most probable combination to issue negative latency alerts in O4. However, the major drawback of using this network is that the source localization areas for bright events are poorer as compared to three or four detector networks. This is evident from the full-bandwidth detection of GW170817 during O2, where the localization area improved by a factor of with the inclusion of an additional detector (Abbott et al., 2017a). The main motivation behind our choice of a two detector network in O4 is to facilitate the rapid follow-up detection of short transient signals (only long) within seconds of a BNS merger (Rezzolla et al., 2011) that was not possible before. Given the following facts that: (a) most major follow-up telescopes require a response time of to reorient themselves to a particular sky direction, (b) the anticipated event rate is small for an early detection of BNS events in O4 (even just before their final merger), and (c) the latencies of the existing pipelines are larger than , it is extremely challenging to observe short transients right at the merger. Thus, saving a few seconds of latency might prove to be extremely useful to capture such events using instruments with larger viewing areas and fast response times. Configurations including other detectors can also be run in parallel for better localizations but with a slight delay.
Using a Gaussian noise simulation, we show that EW pipelines have an exceptional recovery of chirp mass, which is helpful in classifying the source properties such as p_astro and embright. We also compare the credible areas and the searched areas associated with the EW triggers, and demonstrate that the actual searched area for a detection is about one order of magnitude better. These areas are still a few times larger than the three and four detector network localizations reported in Magee et al. (2021); Sachdev et al. (2020); Nitz et al. (2020), but this trade-off to several to tens of seconds in latency is something we hope to take in O4. It is important to note that a more accurate three-detector and four-detector localization will be provided by the full-bandwidth SPIIR search.
We demonstrate the possibility of issuing alerts for atleast one BNS merger per year before the merger in table 1. Adding an additional for data transfer and localization, this would still be a prospect for a negative latency alert. The best localized EW alert is likely to be from the search, and we expect to deliver alerts localized within at a nominal rate of one detection per year from this search.
These alerts are especially useful for follow-up observatories which have a large FOVs. Radio telescopes like the Murchison Widefield Arrray (MWA, Tingay et al. (2013)) is one such benefactor, which has the capability of viewing a quarter of the sky. James et al. (2019) has investigated the response time of this MWA observational mode to be about . In the future, EW alerts produced by SPIIR can also be ingested by x-ray and gamma-ray missions with large FoVs. For example, the Neil Geherels Swift Observatory (FoV ) has developed a fully-autonomous, extremely low-latency on-board commanding pipeline (GUANO, Tohuvavohu et al. (2020)) capable of recovering sub-threshold Burst Alert Telescope (BAT) triggers. Similarly, the large fields of view of the FERMI gamma-ray telescope’s gamma-ray burst monitor (FoV , Meegan et al. (2009)) and INTEGRAL’s gamma-ray burst detection sub-systems (FoV all-sky for SPI-ACS, except for regions occulted by the Earth, Rau et al. (2005)) are also well suited to following up SPIIR triggers. Thus, the SPIIR EW pipeline will contribute significantly to the possibility for targeted followup of sGRB signals by the global astronomy community.
5 Acknowledgements
This research was supported by the University of Western Australia and funded by the Australian Research Council (ARC) Centre of Excellence for Gravitational Wave Discovery OzGrav under grant CE170100004. This work relied on the computational resources provided by the LIGO Laboratory at California Institute of Technology and the OzStar super-computing cluster at Swinburne University of Technology. The authors are grateful to them. The LIGO Laboratory cluster is funded by National Science Foundation Grants PHY-0757058 and PHY-0823459 and the OzStar program receives funding in part from the Astronomy National Collaborative Research Infrastructure Strategy (NCRIS) allocation provided by the Australian Government. We thank Jarrod Hurley and Stuart Anderson for the resources provided on the computing clusters and acknowledge the efforts by Alex Codoreanu and Patrick Clearwater in maintaining the SPIIR repository.
References
- Aasi et al. (2015) Aasi, J., et al. 2015, Class. Quant. Grav., 32, 074001, doi: 10.1088/0264-9381/32/7/074001
- Abbott et al. (2016) Abbott, B. P., et al. 2016, Phys. Rev. Lett., 116, 061102, doi: 10.1103/PhysRevLett.116.061102
- Abbott et al. (2017a) —. 2017a, Phys. Rev. Lett., 119, 161101, doi: 10.1103/PhysRevLett.119.161101
- Abbott et al. (2017b) —. 2017b, Astrophys. J. Lett., 848, L12, doi: 10.3847/2041-8213/aa91c9
- Abbott et al. (2017c) —. 2017c, Nature, 551, 85, doi: 10.1038/nature24471
- Abbott et al. (2018) —. 2018, Living Rev. Rel., 21, 3, doi: 10.1007/s41114-020-00026-9
- Abbott et al. (2019) —. 2019, Phys. Rev. X, 9, 011001, doi: 10.1103/PhysRevX.9.011001
- Abbott et al. (2021a) Abbott, R., et al. 2021a, Phys. Rev. X, 11, 021053, doi: 10.1103/PhysRevX.11.021053
- Abbott et al. (2021b) —. 2021b. https://arxiv.org/abs/2108.01045
- Abbott et al. (2021c) —. 2021c. https://arxiv.org/abs/2111.03606
- Acernese et al. (2015) Acernese, F., et al. 2015, Class. Quant. Grav., 32, 024001, doi: 10.1088/0264-9381/32/2/024001
- Acernese et al. (2019) —. 2019, Phys. Rev. Lett., 123, 231108, doi: 10.1103/PhysRevLett.123.231108
- Adams et al. (2016) Adams, T., Buskulic, D., Germain, V., et al. 2016, Class. Quant. Grav., 33, 175012, doi: 10.1088/0264-9381/33/17/175012
- Akutsu et al. (2020) Akutsu, T., et al. 2020. https://arxiv.org/abs/2005.05574
- Aubin et al. (2021) Aubin, F., et al. 2021, Class. Quant. Grav., 38, 095004, doi: 10.1088/1361-6382/abe913
- Buikema et al. (2020) Buikema, A., et al. 2020, Phys. Rev. D, 102, 062003, doi: 10.1103/PhysRevD.102.062003
- Buonanno et al. (2009) Buonanno, A., Iyer, B., Ochsner, E., Pan, Y., & Sathyaprakash, B. S. 2009, Phys. Rev. D, 80, 084043, doi: 10.1103/PhysRevD.80.084043
- Chu et al. (2020) Chu, Q., et al. 2020. https://arxiv.org/abs/2011.06787
- Cutler & Flanagan (1994) Cutler, C., & Flanagan, E. E. 1994, Phys. Rev. D, 49, 2658, doi: 10.1103/PhysRevD.49.2658
- Dal Canton et al. (2020) Dal Canton, T., Nitz, A. H., Gadre, B., et al. 2020. https://arxiv.org/abs/2008.07494
- Davis et al. (2021) Davis, D., et al. 2021, Class. Quant. Grav., 38, 135014, doi: 10.1088/1361-6382/abfd85
- Fairhurst (2018) Fairhurst, S. 2018, Class. Quant. Grav., 35, 105002, doi: 10.1088/1361-6382/aab675
- Finn (1992) Finn, L. S. 1992, Phys. Rev. D, 46, 5236, doi: 10.1103/PhysRevD.46.5236
- Foucart et al. (2018) Foucart, F., Hinderer, T., & Nissanke, S. 2018, Phys. Rev. D, 98, 081501, doi: 10.1103/PhysRevD.98.081501
- Guo et al. (2018) Guo, X., Chu, Q., Chung, S. K., et al. 2018, Comput. Phys. Commun., 231, 62, doi: 10.1016/j.cpc.2018.05.002
- Hooper et al. (2012) Hooper, S., Chung, S. K., Luan, J., et al. 2012, Phys. Rev. D, 86, 024012, doi: 10.1103/PhysRevD.86.024012
- James et al. (2019) James, C. W., Anderson, G. E., Wen, L., et al. 2019, Mon. Not. Roy. Astron. Soc., 489, L75, doi: 10.1093/mnrasl/slz129
- Kapadia et al. (2020) Kapadia, S. J., et al. 2020, Class. Quant. Grav., 37, 045007, doi: 10.1088/1361-6382/ab5f2d
- Klimenko et al. (2016) Klimenko, S., et al. 2016, Phys. Rev. D, 93, 042004, doi: 10.1103/PhysRevD.93.042004
- LIGO Scientific Collaboration (2018) LIGO Scientific Collaboration. 2018, LIGO Algorithm Library - LALSuite, free software (GPL), doi: 10.7935/GT1W-FZ16
- Liu et al. (2012) Liu, Y., Du, Z., Chung, S. K., et al. 2012, Class. Quant. Grav., 29, 235018, doi: 10.1088/0264-9381/29/23/235018
- Luan et al. (2012) Luan, J., Hooper, S., Wen, L., & Chen, Y. 2012, Phys. Rev. D, 85, 102002, doi: 10.1103/PhysRevD.85.102002
- Magee et al. (2021) Magee, R., et al. 2021, Astrophys. J. Lett., 910, L21, doi: 10.3847/2041-8213/abed54
- Meegan et al. (2009) Meegan, C., et al. 2009, Astrophys. J., 702, 791, doi: 10.1088/0004-637X/702/1/791
- Messick et al. (2017) Messick, C., et al. 2017, Phys. Rev. D, 95, 042001, doi: 10.1103/PhysRevD.95.042001
- Nitz et al. (2018) Nitz, A. H., Dal Canton, T., Davis, D., & Reyes, S. 2018, Phys. Rev. D, 98, 024050, doi: 10.1103/PhysRevD.98.024050
- Nitz et al. (2020) Nitz, A. H., Schäfer, M., & Dal Canton, T. 2020, Astrophys. J. Lett., 902, L29, doi: 10.3847/2041-8213/abbc10
- Rau et al. (2005) Rau, A., Kienlin, A. V., Hurley, K., & Lichti, G. G. 2005, A&A, 438, 1175, doi: 10.1051/0004-6361:20053159
- Rezzolla et al. (2011) Rezzolla, L., Giacomazzo, B., Baiotti, L., et al. 2011, Astrophys. J. Lett., 732, L6, doi: 10.1088/2041-8205/732/1/L6
- Sachdev et al. (2019) Sachdev, S., et al. 2019. https://arxiv.org/abs/1901.08580
- Sachdev et al. (2020) —. 2020, Astrophys. J. Lett., 905, L25, doi: 10.3847/2041-8213/abc753
- Singer & Price (2016) Singer, L. P., & Price, L. R. 2016, Phys. Rev. D, 93, 024013, doi: 10.1103/PhysRevD.93.024013
- Tingay et al. (2013) Tingay, S. J., et al. 2013, Publ. Astron. Soc. Austral., 30, 7, doi: 10.1017/pasa.2012.007
- Tohuvavohu et al. (2020) Tohuvavohu, A., Kennea, J. A., DeLaunay, J., et al. 2020, Astrophys. J., 900, 35, doi: 10.3847/1538-4357/aba94f