The mass and size of Herbig disks as seen by ALMA
Abstract
Context. Many population studies have been performed over the past decade with the Atacama Large millimeter/submillimeter Array (ALMA) to understand the bulk properties of protoplanetary disks around young stars. The studied populations have mostly consisted of late spectral type (i.e., G, K & M) stars, with relatively few more massive Herbig stars (spectral types B, A & F). With GAIA-updated distances, now is a good time to use ALMA archival data for a Herbig disk population study and take an important step forward in our understanding of planet formation.
Aims. The aim of this work is to determine the masses and sizes of all Herbig dust disks observed with ALMA to date in a volume-limited sample out to 450 pc. These masses and sizes are put in the context of the Lupus and Upper Sco T Tauri disk populations.
Methods. ALMA Band 6 and Band 7 archival data of 36 Herbig stars are used, making this work complete out to 225 pc, and 38% complete out to 450 pc also including Orion. Using stellar parameters and distances, the dust masses and sizes of the disks are determined via a curve-of-growth method. Survival analysis is used to obtain cumulative distributions of the dust masses and radii.
Results. Herbig disks have a higher dust mass than the T Tauri disk populations of Lupus and Upper Sco by factors of and respectively. In addition, Herbig disks are often larger than the typical T Tauri disk. Although the masses and sizes of Herbig disks extend over a similar range to those of T Tauri disks, the distributions of masses and sizes of Herbig disks are significantly skewed toward higher values. Lastly, group I disks are more massive than group II disks. An insufficient number of group II disks are observed at sufficient angular resolution to determine whether or not they are also small in size compared to group I disks.
Conclusions. Herbig disks are skewed towards more massive and larger dust disks compared to T Tauri disks. Based on this we speculate that these differences find their origin in an initial disk mass that scales with the stellar mass, and that subsequent disk evolution enlarges the observable differences, especially if (sub)millimeter continuum optical depth plays a role. Moreover, the larger disk masses and sizes of Herbig stars could be linked to the increasing prevalence of giant planets with host star mass.
Key Words.:
Protoplanetary disks – Stars: early-type – Stars:pre-main sequence – Stars: variables: T Tauri, Herbig Ae/Be – Submillimeter: planetary systems – Survey1 Introduction
Many population studies of protoplanetary disks in various star-forming regions have been carried out in recent years with the Atacama Large millimeter/submillimeter Array (ALMA). These demographic studies have led to new insights into disk evolution by finding relations between stellar mass and disk mass (e.g., Andrews et al., 2013; Barenfeld et al., 2016; Ansdell et al., 2016; Pascucci et al., 2016), and between disk radius and disk mass (Andrews et al., 2013, 2018b; Tripathi et al., 2017; Tazzari et al., 2021). On the other side of the planet formation process, exoplanet demographics show a trend where higher mass stars (1 M⊙ and higher) are more often associated with planets more massive than M⊕ than stars with lower stellar masses (e.g., Johnson et al., 2007, 2010; Wittenmyer et al., 2020; Fulton et al., 2021). The increasing number of observed exoplanets and disks allows for connections to be made between the beginning and ending stages of planet formation (e.g Mulders et al., 2021), improving our understanding of the relations found in both disk and exoplanet demographics.
The increase in occurrence rate of giant exoplanets around more massive main sequence stars coincides with the frequency of substructure in disks —as seen in the (sub)millimeter continuum emission— in the form of rings and gaps (van der Marel & Mulders, 2021), suggesting a connection between the two. One pathway for these structures to form is via planets forming inside these disks, creating pressure bumps preventing the radial drift of dust (e.g., Birnstiel et al., 2010) and influencing the overall evolution of a disk (Pinilla et al., 2020; Cieza et al., 2021). The relationships found between stellar mass, disk mass, and disk extent might explain the observed increase in occurrence rate of massive planets with stellar mass and orbital radius (Andrews et al., 2013). This introduces an enticing scenario in which the more massive disks produce gas giant planets at greater distances, creating structured disks, while the less massive disks shrink over time because of radial drift (Cieza et al., 2021; van der Marel & Mulders, 2021). Indeed, the more massive disks seem to retain their disk mass for longer, steepening the stellar mass–dust mass relation over time (Pascucci et al., 2016; Ansdell et al., 2017), while on the contrary, the dust radii in the 5–11 Myr-old Upper Sco star-forming region (SFR) were found to be significantly smaller than those in the younger 1–3 Myr-old Lupus region (Barenfeld et al., 2017; Ansdell et al., 2018), suggesting an evolution towards smaller disks.
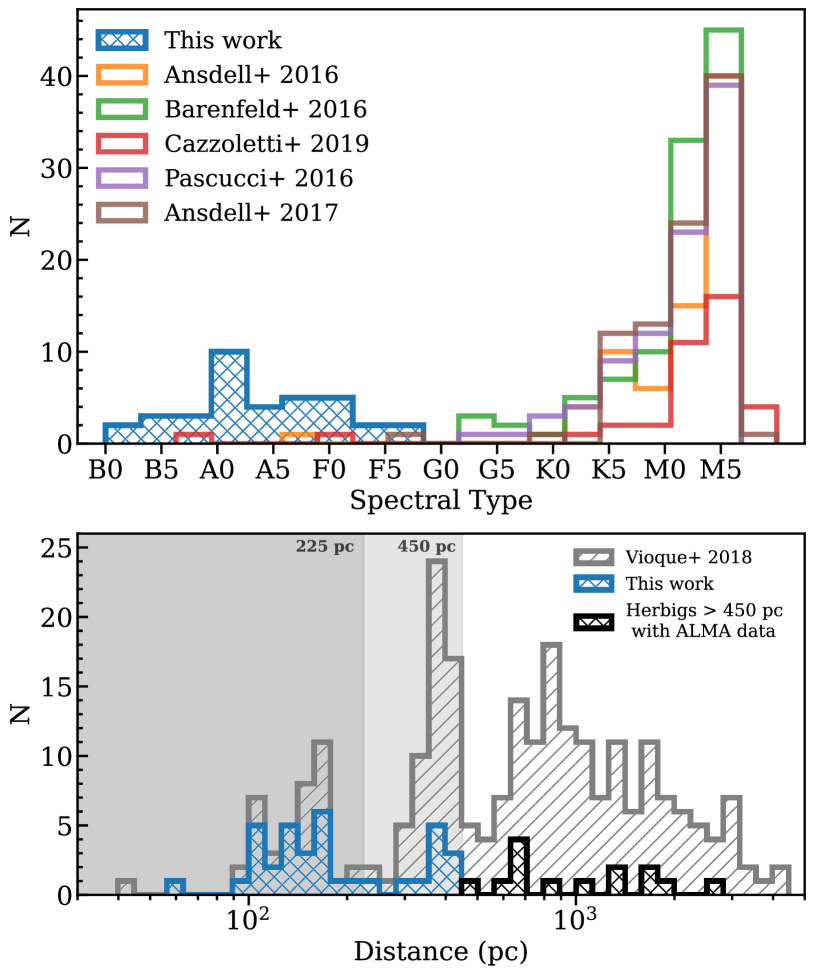
However, as expected from the initial mass function (e.g., Kroupa, 2001; Bastian et al., 2010), these disk population studies mainly consist of T Tauri stars and lack coverage of more massive pre-main sequence (PMS) stars (cf. top panel of Fig. 1 and Table 5). These more massive stars, known as Herbig Ae/Be stars (Herbig, 1960; Waters & Waelkens, 1998), typically have masses between M⊙ and M⊙, are optically visible and have, by definition, an excess in infrared (IR) light because of a disk surrounding them. Infrared excess is used to classify their spectral energy distributions (SED) into group I and group II disks (Meeus et al., 2001). This division was based on whether the SED could be described by a single power law at mid- to far-IR wavelengths or if an additional blackbody component was necessary. Lastly, due to the PMS evolutionary tracks being horizontal for early-spectral-type stars, stars which end up with a spectral type A will first be F- or even G-type stars. Therefore, Herbig Ae stars are relatively old. To counteract this, research into intermediate-mass T Tauri stars —which precede Herbig Ae stars— has been done (recently e.g., Valegård et al., 2021) and the definition of Herbig Ae/Be stars is often expanded to include F-type stars (e.g., Chen et al., 2016; Vioque et al., 2018).
While T Tauri stars are abundant throughout star-forming regions, less than 300 Herbig stars are known to date (The et al., 1994; Carmona et al., 2010; Chen et al., 2016; Vioque et al., 2018, 2020; Guzmán-Díaz et al., 2021), which include stars with spectral types ranging from B to F. Before ALMA, dust mass studies of disks around Herbig stars (hereafter: Herbig disks) have been done with other facilities such as the NRAO Very Large Array (VLA) and the IRAM Plateau de Bure (e.g., Alonso-Albi et al., 2009) and while recent work by van der Marel & Mulders (2021) does include all Herbig disks associated with nearby SFRs (but does not include isolated Herbig disks), there has not yet been a dedicated population study of Herbig disks observed with ALMA. Nevertheless, a significant portion of the nearby Herbig disks have been observed with ALMA over the years in a variety of programs and these data are used in the present work for a first systematic look at Herbig disks with ALMA.
In this study, we use a more complete sample of Herbig disks compared to any other survey done before. Distances from GAIA parallaxes and newly determined stellar properties (Vioque et al., 2018) allow for a well-defined sample. What is the typical extent and mass of a Herbig disk? Do the dust disk mass and extent follow the expected stellar mass–dust mass relationship? Do Herbig disks fall within the posed scenario in which larger disks form giant planets further out, while smaller disks decrease in size over time? Are there any differences between the dust mass and extent and the groups defined by Meeus et al. (2001) based on their SEDs? To answer these questions, we determine the dust mass and extent of Herbig disks with ALMA archival data in a volume-limited sample and compare these parameters with their T Tauri counterparts from previous population studies. Section 2 shows the selection process of the sample used in this work. Section 3 sets out how the data are retrieved and how the integrated (sub)millimeter flux and size was determined. Section 4 describes the results of the dust mass and extent measurements and compares these to the Lupus and Upper Sco SFRs. In Sect. 5 we discuss the implications on the stellar mass–dust mass and disk radius–dust mass relations and look at the Meeus et al. (2001) group dichotomy. Section 6 summarizes our conclusions.
| Name | R.A. (h:m:s) | Decl. (deg:m:s) | Sp.Tp. | Group | (mJy) | () | (au) | (au) | inc () | PA () | Ref. |
| AB Aurα | 04:55:45.9 | +30:33:04 | A0 | I | 192.8 | 11.8±1.2 | 186±15 | 225±34 | 23.2 | 99 | 1, i, |
| AK Sco | 16:54:44.9 | -36:53:19 | F5 | II | 26.1 | 6.1±0.6 | 42±3 | 53±15 | 71 | 39 | 2, ii, |
| BF Ori | 05:37:13.3 | -06:35:01 | A7 | II | 0.8 | 1.1±0.1 | ¡233 | ¡311 | – | – | 3, |
| CQ Tauα | 05:35:58.5 | +24:44:54 | F5 | I | 144.0 | 44.2±4.8 | 62±4 | 76±18 | 35 | 35 | 4, iii, |
| HD 100453 | 11:33:05.6 | -54:19:29 | A9 | I | 141.1 | 17.5±1.8 | 39±2 | 44±6 | 38 | 128 | 5, iv, |
| HD 100546 | 11:33:25.4 | -70:11:41 | A0 | I | 399.6 | 38.0±3.9 | 35±2 | 41±4 | 43 | 131 | 6, v, |
| HD 104237α | 12:00:05.1 | -78:11:35 | A0 | II | 88.9 | 10.5±1.1 | ¡59 | ¡98 | – | – | 5, |
| HD 135344B | 15:15:48.5 | -37:09:16 | F8 | I | 539.7 | 35.2±3.8 | 81±10 | 109±31 | 11 | 28 | 7,vi, |
| HD 139614 | 15:40:46.4 | -42:29:54 | A9 | I | 197.2 | 41.7±4.3 | ¡65 | ¡97 | – | – | 6, |
| HD 141569 | 15:49:57.8 | -03:55:16 | A2 | II | 3.4 | 0.36±0.04 | ¡139 | ¡232 | – | – | 6, |
| HD 142527 | 15:56:41.9 | -42:19:23 | F6 | I | 1048.1 | 214.9±22.1 | 208±9 | 236±33 | 27 | 71 | 8, vii, |
| HD 142666 | 15:56:40.0 | -22:01:40 | F0 | II | 118.6 | 25.1±2.6 | 40±3 | 52±11 | 60 | 109 | 6, viii, |
| HD 163296 | 17:56:21.3 | -21:57:22 | A1 | II | 541.3 | 46.7±5.0 | 71±6 | 101±16 | 45 | 137 | 4, ix, |
| HD 169142α | 18:24:29.8 | -29:46:49 | F1 | I | 203.7 | 22.9±2.4 | 71±7 | 140±77 | 13 | 5 | 6, x, |
| HD 176386α | 19:01:38.9 | -36:53:27 | B9 | II | ¡0.32 | ¡0.06 | – | – | – | – | 9, |
| HD 245185 | 05:35:09.6 | +10:01:52 | A0 | I | 34.6 | 41.5±7.6 | ¡76 | ¡126 | – | – | 10, |
| HD 290764 | 05:38:05.3 | -01:15:22 | F0 | I | 210.1 | 90.3±11.8 | 119±16 | 167±28 | 30 | 154.6 | 5, xi, |
| HD 31648α | 04:58:46.3 | +29:50:37 | A5 | II | 253.0 | 70.9±7.7 | 58±18 | 107±49 | 37 | 122 | 4, xii, |
| HD 34282 | 05:16:00.5 | -09:48:35 | B9.5 | I | 99.0 | 86.8±9.7 | 189±18 | 260±77 | 60 | 150 | 11, xiii, |
| HD 36112α | 05:30:27.5 | +25:19:57 | A8 | I | 70.7 | 18.8±2.0 | 90±17 | 123±50 | 21 | 65 | 5, xiv, |
| HD 37258α | 05:36:59.3 | -06:09:16 | A3 | II | 1.8 | 2.4±0.4 | ¡326 | ¡435 | – | – | 3, |
| HD 53367α | 07:04:25.5 | -10:27:16 | B0 | ? | ¡0.81 | ¡0.05 | – | – | – | – | 12 |
| HD 58647α | 07:25:56.1 | -14:10:44 | B9 | II | 1.9 | 1.0±0.1 | ¡75 | ¡126 | – | – | 13, |
| HD 9672α | 01:34:37.9 | -15:40:35 | A1 | II | 4.1 | 0.13±0.01 | 315±39 | 473±111 | 81 | 161 | 13, xv, |
| HD 97048 | 11:08:03.3 | -77:39:18 | A0 | I | 711.4 | 155.9±16.0 | 182±19 | 245±69 | 41 | 85 | 14, xvi, |
| HR 5999 | 16:08:34.3 | -39:06:18 | A7 | II | 26.5 | 4.0±0.4 | ¡48 | ¡81 | – | – | 15, |
| KK Ophα | 17:10:08.1 | -27:15:19 | A6 | II | 27.7 | 17.4±2.5 | ¡88 | ¡88 | – | – | 16, |
| MWC 297 | 18:27:39.5 | -03:49:52 | B1.5 | I | 288.7 | 65.7±9.6 | ¡169 | ¡253 | – | – | 17, |
| R CrAα | 19:01:53.7 | -36:57:09 | B5 | II | ¡65.8 | ¡13.2 | – | – | – | – | 18, |
| TY CrAα | 19:01:40.8 | -36:52:34 | B9 | I | 0.67 | 0.10±0.01 | ¡27 | ¡34 | – | – | 5, |
| V1787 Oriα | 05:38:09.3 | -06:49:17 | A5 | I | 14.8 | 24.2±2.9 | ¡313 | ¡391 | – | – | 5, |
| V599 Ori | 05:38:58.6 | -07:16:46 | A8.9 | I | 55.9 | 75.0±8.6 | ¡328 | ¡410 | – | – | 19, |
| V718 Sco | 16:13:11.6 | -22:29:07 | A5 | II | 49.5 | 11.9±1.3 | ¡69 | ¡114 | – | – | 20, |
| V892 Tauα | 04:18:40.6 | +28:19:15 | A0 | I | 285.4 | 76.1±8.3 | 40±4 | 52±13 | 54.5 | 52.1 | 21, xvii, |
| VV Ser | 18:28:47.9 | +00:08:40 | B5 | II | 2.3 | 2.3±0.3 | ¡239 | ¡399 | – | – | 22, |
| Z CMaα | 07:03:43.2 | -11:33:06 | B5 | I | 29.3 | 7.6±6.4 | ¡28 | ¡41 | – | – | 23, |
Notes: All distances are obtained from Vioque et al. (2018). The luminosities, stellar masses, and ages were obtained from Wichittanakom et al. (2020) except the objects marked with an of which these parameters were obtained from Vioque et al. (2018). The objects in italics are from the Vioque et al. (2018) low-quality parallax sample, and the others are from the high-quality sample. The error on the continuum flux is of the given value. Spectral type references: (1) Mooley et al. (2013), (2) Houk (1982), (3) Tisserand et al. (2013), (4) Mora et al. (2001), (5) Vieira et al. (2003), (6) Gray et al. (2017), (7) Coulson & Walther (1995), (8) Houk (1978), (9) Torres et al. (2006), (10) Gray & Corbally (1998), (11) Houk & Swift (1999), (12) Tjin A Djie et al. (2001), (13) Houk & Smith-Moore (1988), (14) Irvine & Houk (1977), (15) Bessell & Eggen (1972), (16) Carmona et al. (2007), (17) Drew et al. (1997), (18) Gray et al. (2006), (19) Hsu et al. (2013), (20) Carmona et al. (2010), (21) Skiff (2014), (22) Guzmán-Díaz et al. (2021), (23) Covino et al. (1984). Inclination and position angle references: (i) Tang et al. (2017), (ii) Czekala et al. (2015), (iii) Ubeira Gabellini et al. (2019), (iv) Benisty et al. (2017), (v) Pineda et al. (2019), (vi) Stolker et al. (2016), (vii) Kataoka et al. (2016), (viii) Rubinstein et al. (2018), (ix) de Gregorio-Monsalvo et al. (2013), (x) Fedele et al. (2017), (xi) Kraus et al. (2017), (xii) Liu et al. (2019), (xiii) van der Plas et al. (2017a), (xiv) Isella et al. (2010), (xv) Hughes et al. (2017), (xvi) van der Plas et al. (2017b), (xvii) Long et al. (2021). Meeus group references: () Guzmán-Díaz et al. (2021), () Boersma et al. (2009), () Juhász et al. (2010), () Acke & van den Ancker (2004), () Menu et al. (2015).
2 Sample selection
The sample in this work is based on the GAIA DR2 study of Herbig Ae/Be stars of Vioque et al. (2018) for which ALMA data are available. Previous population studies were limited to one SFR and consequently all stars have approximately the same distance, but the Herbig stars are distributed over the sky and therefore each has a different distance, which should be well determined. The newly determined GAIA distances and accurately derived stellar properties inspired us to do a population study on these objects.
Vioque et al. (2018) obtained a sample of 218 objects classified as Herbig stars with high-quality parallax measurements from GAIA DR2 (Gaia Collaboration et al., 2018). In addition, 34 Herbig stars were classified as belonging to a low-quality parallax measurement sample. We take the stellar properties (mass, age) from Vioque et al. (2018), who determine these from comparison to isochrones in the HR-diagram (see Table 1 of Vioque et al. (2018) for an overview of the values we adopted). The bottom panel of Fig. 1 shows the distribution of a total of 252 Herbig stars over distance. The first peak at a distance of pc consists of the nearby star-forming regions. The second peak at a distance of pc is the Orion star-forming complex, after which —at much larger distances— the distribution goes up again due to a fast increase in volume. Due to incompleteness, the number of sources decreases again at large distances. From this figure, two natural cutoff distances emerge to define our sample and a subsample of all Herbig disks. One cutoff distance is at 450 pc. This distance includes the Orion star-forming complex and has a relatively good sampling of Herbig disks observed with ALMA compared to the full sample of disks given by Vioque et al. (2018). After 450 pc, this sampling becomes quite sparse (see the bottom panel of Fig. 1). The other cutoff distance is at 225 pc, which excludes Orion, but includes the nearby star-forming regions, and has a more complete sampling. Using a limit of 450 pc (225 pc) leaves a total of 96 (39) Herbig stars as listed by Vioque et al. (2018) of which 42 (25) have ALMA archival data.
While classified as Herbig stars by Vioque et al. (2018), four objects with ALMA archival data are not included in our work: HD 143006 and BP Psc are left out because they have a G5 and G9 spectral type, respectively (Pecaut & Mamajek, 2016; Torres et al., 2006), HD 135344 was not included as it is often mistaken for the B component of the binary (Sitko et al., 2012), and DK Cha because it is in the Class I phase (van Kempen et al., 2010; Spezzi et al., 2008). In addition, the data of HD 36982 and HD 50138 do not satisfy the data selection criteria: for a proper comparison with other surveys, only ALMA Band 6 and 7 are used (see §3.1 for further details on the selection criteria). While being at the boundary of the definition of Herbig stars, we retained several objects in the interest of obtaining a sample that is as complete as possible: HD 9672, HD 9672, Z CMa, HD 58647, MWC 297, HD 53367, and R CrA. For more details on the individual motivations, see Appendix B. Lastly, this work contains a few disks that would be classified as more evolved debris disks, especially among the group II objects (e.g., HD 9672 and HD 141569). However, all objects in our work do meet the definition of Herbig stars and are therefore kept in the sample.
In summary, of the 42 objects from Vioque et al. (2018) within 450 pc that have ALMA archival data, 36 data sets were used in this research (see the blue distribution in the top panel of Fig. 1). This set of 36 Herbig disks is the full sample used in this work. The 25 out of 36 disks that are within 225 pc are referred to as the nearby sample. All 36 objects are listed in Table 1. The used data sets and their corresponding properties can be found in Table 6. Ultimately, the nearby sample (up to 225 pc) covers 64% (25/39 objects) of the total number of Herbig stars present within this distance, and 38% (36/96) of the full sample (up to 450 pc).
The distances of the full sample range from 57 pc to 429 pc with a median of 160 pc. The range in stellar mass is fairly narrow: 1.47 to 3.87 with MWC 297 being an outlier with 14.5 . The median stellar mass is . The age is fairly advanced, ranging from 0.04 Myr (MWC 297) to 18.5 Myr (KK Oph) with a median of 5.5 Myr. As HD 53367, R CrA, and V892 Tau belong to the low-quality sample of Vioque et al. (2018), their masses and ages were not determined. Although B stars are over-represented in the overall sample of Vioque et al. (2018), our volume-limited sample is likely complete with respect to these spectral types and contains more A and F stars than B stars (especially early B stars, because none of these bright stars are likely missed at the close distances we are considering). The full sample is divided into 9 B-type, 20 A-type, and 7 F-type spectral type stars (see Table 1 for references). As mentioned in §1, Herbig Ae stars have horizontal PMS evolutionary tracks. Therefore, it is plausible that the sample used in this work consists of stars with relatively old ages. However, these selection effects are likely to be minimal both because the nearby sample is well covered and F-type stars are included. Lastly, there are 19 group I and 16 group II sources following the Meeus et al. (2001) classification (see Table 1 for references). The Meeus group for HD 53367 is undetermined.
3 Data and their reduction
3.1 Data retrieval
Most of the data were obtained as product data from the ALMA archive111https://almascience.eso.org/asax/. For the retrieval of the data, a few criteria were taken into account. First, the data have to be in Band 6 or Band 7 to both cover a similar wavelength range as previously done for population studies and to be able to compare the dust radii between Herbig disks and T Tauri stars with data taken in different bands (dust radii in Band 6 and 7 are comparable in size Tazzari et al., 2021). In addition, this minimizes the effects of dust evolution (grain growth and radial drift) that impacts different grain sizes differently; by using the same bands, we sample the same grain sizes. Second, the data with the highest resolution were often chosen —except if the largest recoverable scale was too small— to minimize the chance of resolving out large-scale structures. Lastly, if the first two criteria left multiple data sets to choose from, the data set with the highest continuum sensitivity was chosen.
All ALMA product data are imaged and calibrated using the standard ALMA pipeline, ensuring uniform data for all objects and thus well-suited product data for use in this work. However, some of the data were not directly available as a product. We therefore reduced the data of HD 37258, HD 176386, and TY CrA ourselves. The reduction of all three data sets was done in the Common Astronomy Software Applications (CASA) application version 5.7.0 (McMullin et al., 2007). To increase the sensitivity of the continuum image and ultimately be able to adequately determine the dust mass of the disk, natural weighting was used for all three data sets. Because of a truncation error when setting the observation coordinates, the coordinates of HD 176386 and TY CrA are shifted resulting in an offset of the sources of up to east of the phase centre (Cazzoletti et al., 2019). The phase centre was therefore shifted to the correct source positions. For all three datasets, the signal-to-noise ratio (S/N) was deemed to be too low for self calibration to be applied. For the pipeline products, self calibration would likely have increased the S/N of the images, but would not significantly affect the total flux (which are all well above the S/N limit) and the inferred radii.
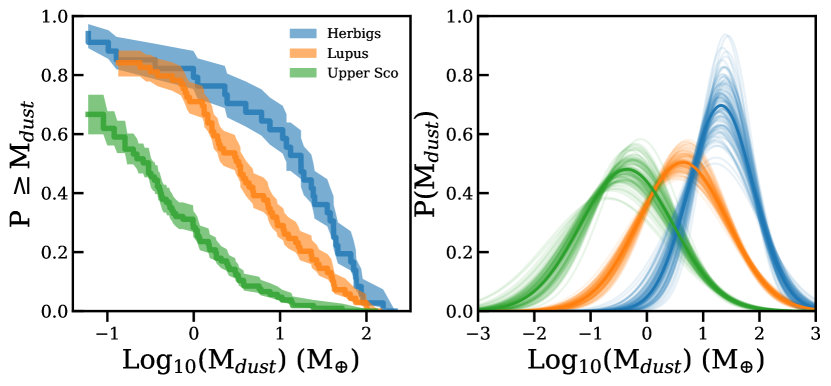
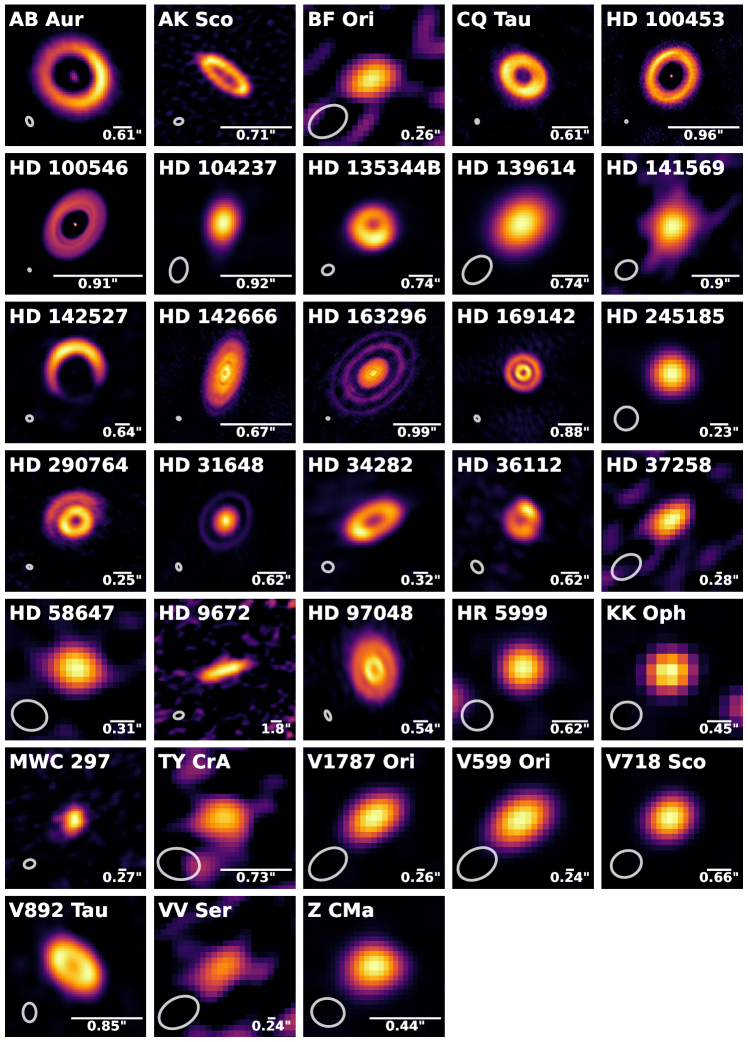
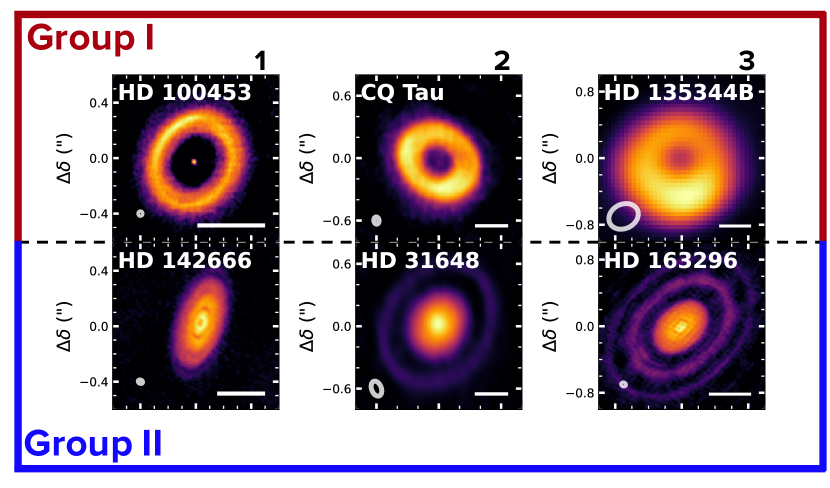
Figure 2 shows the images of all detected disks. In general, the obtained set of data products consists of a large range of spatial resolutions. All images in which substructure is visible are considered to be resolved; for the remaining disks a Gaussian was fitted using the CASA imfit task. For all of these disks, the FWHM major axis found deviated by up to a few percent from the beam major axis and was therefore considered to be unresolved. Consequently, out of the 36 data sets, 17 are resolved. The resolution of the resolved data ranges from to with a median of . The resolution of the unresolved data ranges from to with a median of . Three data sets are taken in Band 7 (275–373 GHz), while the other data sets are taken in Band 6 (211–275 GHz). The sensitivity ranges from an rms of 0.02 mJy beam-1 to 12.4 mJy beam-1 with a median of 0.31 mJy beam-1. See Appendix C for specific information for each data set. Lastly, the data of HD 53367 and HD 176386 are listed as non-detections, because continuum emission was only present at the and level respectively. For R CrA no emission is detected and is listed as an upper limit as well.
3.2 Determination of disk flux and size
The flux was measured using the same method as that adopted by Ansdell et al. (2016), who use aperture photometry where the radius of the aperture is determined by a curve-of-growth method. An aperture with a specific position angle and inclination was centered on the disk. For the resolved disks, these were retrieved from other works; see Table 1 for the values and references. For the unresolved disks, a circular aperture was used. The radius of this aperture was increased with a minimum step size set by the pixel size until the change in the total disk integrated flux by increasing the radius was smaller than five times the RMS noise. While the noise depends on the weighting scheme used, different robust parameters only minimally influenced the final found radius. This method gives the maximum disk-integrated flux emitted by the disk and in addition returns the radius of the disk. To facilitate comparison with the results of Ansdell et al. (2016), we report , the radius where 90% of the total flux is reached. We also report , where 68% of the flux is reached, in order to allow comparison with other studies that report this value. Table 1 lists the dust masses and the and radii.
For unresolved disks, we use the curve of growth method as well, as opposed to the Gaussian fitting method used by Ansdell et al. (2016), because the difference between the two methods was found to be within 1%. Considering that a standard 10% flux calibration error has to be taken into account as well, these differences are deemed negligible.
4 Results
4.1 Dust masses
The (sub)millimeter continuum flux can be directly related to the dust mass assuming optically thin emission (Hildebrand, 1983) using
| (1) |
where is the continuum (sub)millimeter flux as emitted by the dust in the disk and the distance to the object. is the value of the Planck function at a given dust temperature . In many population studies, the dust temperature is taken to be a single constant value across the disk with K (e.g., Ansdell et al., 2016; Cazzoletti et al., 2019) as found for the mean of the disks in the Taurus region (Andrews & Williams, 2005).
Given the high luminosity of the Herbig stars, we explicitly take the higher expected dust temperatures into account. We used the approach by Andrews et al. (2013) to estimate the dust temperatures, where the mean dust temperature of the disk scales with the stellar luminosity as
| (2) |
As shown by Ballering & Eisner (2019), taking K as well as assuming a luminosity-scaled dust temperature via Eq. (2) can lead to underestimation of the dust temperature by K. However, for Herbig disks, Eq. (2) leads to a less substantial underestimation of the temperature compared to the assumption of K.
Following previous studies (e.g., Ansdell et al., 2016; Cazzoletti et al., 2019), the dust opacity at a given frequency is given by a power law such that it equals 10 cm2g-1 at a frequency of 1000 GHz (Beckwith et al., 1990) which is scaled with an index of . While Tychoniec et al. (2020) found from combining VLA and ALMA data that the power-law index is , indicating growth of dust particles (e.g., Natta et al., 2004; Ricci et al., 2010; Testi et al., 2014), for the purpose of comparing with previous population studies, we use in this work.
Lastly, the errors on the dust masses as given in Table 1 are calculated by taking two sources of error into account. First, the 10% flux calibration and second, the error on the distance by averaging the upper and lower confidence intervals on the distance as given by Vioque et al. (2018). While previous studies did not take the error on the distance into account because all the stars reside in the same SFR, it is important in this study because the Herbig stars are distributed over a large range of distances.
4.2 The dust mass distribution
| () | ||||
| Herbigs | 2.44 | 2.24 | 1.32 | 0.57 |
| Lupus | 0.42 | 0.48 | 0.64 | 0.79 |
| Upper Sco | 0.43 | 0.37 | -0.36 | 0.83 |
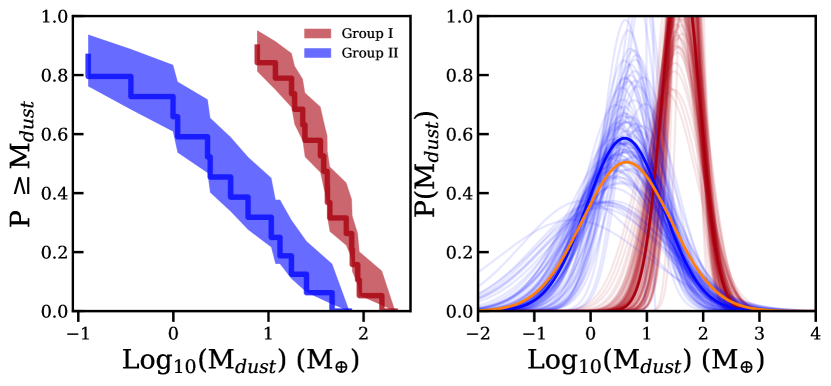
We derive the dust mass cumulative distribution function (CDF) using the lifelines Python package (Davidson-Pilon et al., 2021). Lifelines uses survival analysis to construct a cumulative distribution of the dust masses, as shown in the left panel of Fig. 3. The lifelines package can take left-censored data into account (i.e., upper limits on the dust mass). The confidence intervals are shown as the vertical spread in the distribution, reflecting the number of samples in each bin. For a discussion on the completeness of the sample, see Appendix D where three extra Herbig disks are added from JCMT/SCUBA (sub)millimeter observations.
To understand the differences as a function of stellar mass, the dust mass CDF of the Herbig disks is compared in the left panel of Fig. 3 with the dust mass CDFs of the young (1–3 Myr) Lupus (Ansdell et al., 2016) as well as with the older (5–11 Myr) Upper Sco (Barenfeld et al., 2016) star-forming regions obtained by assuming a dust temperature of 20 K.
In general, using a luminosity-dependent for the Lupus sample (with luminosities from Alcalá et al. 2014) marginally changes the distribution, with the mean mass increasing by only 4% and the median by 14%. We therefore retain the K derived masses for consistency. HR 5999 is the only object in Ansdell et al. (2016) for which a temperature of 20 K would not be appropriate. This Herbig disk is also in our sample and we infer a dust disk mass of 4.0 M⊕ instead of 23.3 M⊕ as reported by Ansdell et al. (2016), because our determination uses K which is more appropriate for an object of this luminosity (52 L⊙).
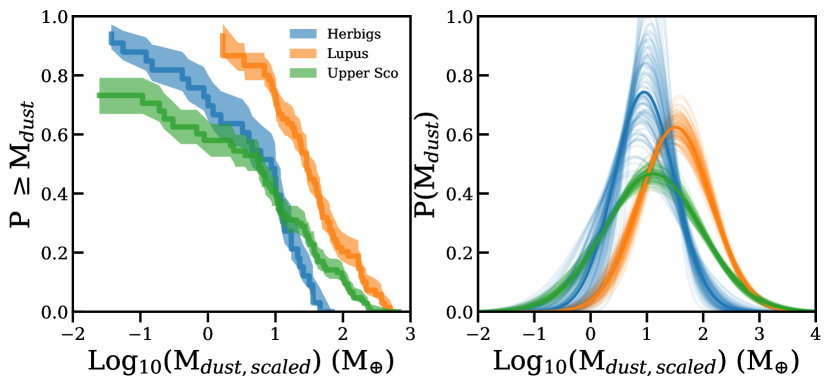
The mean dust mass of the Herbig sample is M⊕. This is a factor of about three higher than the amount of dust in the disks in the Lupus star-forming region ( M⊕) and a factor of about seven higher than the dust masses in the disks in Upper Sco ( M⊕). We note that while the assumption of optically thin emission may be valid for T Tauri disks, this might not be the case for massive Herbig disks. However, if the Herbig disks are partially optically thick, the inferred mass from Eq. (1) would underestimate the true mass; correcting for this would even further increase the differences in dust mass between the Herbig sample and the Lupus and Upper Sco star-forming regions. Our finding that Herbig disks have a higher mass is therefore robust. These higher dust masses are consistent with the well-known stellar mass ()–dust mass () relation (e.g., Andrews et al., 2013; Barenfeld et al., 2016; Ansdell et al., 2016; Pascucci et al., 2016, see §5.1 for further discussion on this). Following Williams et al. (2019), the right panel of Fig. 3 presents the result of fitting a log-normal distribution through the found cumulative distributions as shown in the left panel of Fig. 3 (for the best-fit parameters, see Table 2). The resulting distributions provide a more straightforward depiction of the means and standard deviations of the obtained CDFs. To account for the asymmetric errors on the CDFs obtained with the lifelines package, a bootstrapping method is used via sampling a split-normal distribution times, with the left and right standard deviation of the split-normal distribution given by the upper and lower errors on the CDF. The solid line in the right panel of Fig. 3 is the best-fit log-normal distribution, while the fainter lines show the spread in possible fits. From Fig. 3 it is clear that the Herbig disks indeed contain more dust mass than both Lupus and Upper Sco. At the same time, the distribution of the older Upper Sco region is lower (more than one standard deviation) than both the Lupus and Herbig disks, which is likely due to its advanced age (approximately one-third of the disks in Upper Sco are more evolved class III objects Michel et al. 2021).
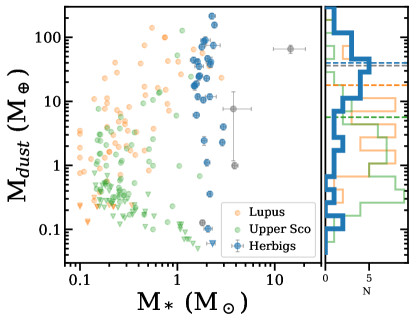
The now clearly identified relation between stellar mass () and dust mass () is consistent with this finding. Figure 4 plots the stellar mass against the dust mass for the Herbig, Lupus, and Upper Sco samples together with a histogram showing the distribution of the detected dust masses of each sample. While the mean dust mass of the Herbig disks is indeed higher than that of Lupus and Upper Sco, this figure shows that the range in dust mass is relatively similar in the two low-mass star-forming regions. The highest dust masses of Lupus and Upper Sco are M⊕ (Sz 82) and M⊕ (2MASS J16113134–1838259) respectively, while the highest mass in the Herbig sample is M⊕ (HD 142527), which is a factor of 1.5 higher. The biggest difference is in the distribution of the masses. The Herbig sample contains many more massive disks than the low-stellar-mass sources. Of the Herbig sample, % of the disks have a mass of more than M⊕. Compared to only % of Lupus and % of Upper Sco disks.
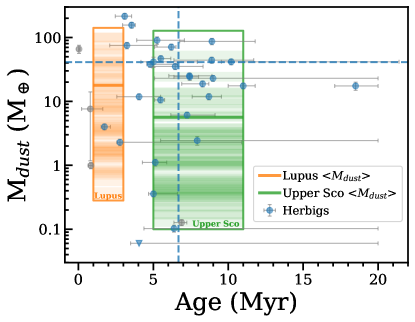
Figure 5 presents the age of the disks plotted against the dust mass. The ranges in detected dust masses and ages of the Lupus and Upper Sco SFRs are shown as well. The mean dust mass of the Herbig disks, shown by the horizontal dashed line, is higher than the mean dust masses of both Lupus and Upper-Sco, as shown by the solid horizontal lines. Additionally, this plot shows that the mean age of the Herbig sample mostly overlaps with the Upper Sco region. This suggests that Herbig disks either retain their disk mass for longer, and/or that they are initially formed with higher dust masses following the – relation and thus still have a large disk mass after a few million years. This is discussed further in §5.1. Additionally, when removing the six borderline objects from the sample, the distribution as shown in the left panel of Fig. 3 does not change significantly. It is therefore unlikely that these targets are much different from the other Herbig disks.
4.3 Herbig disk dust radii
We also determined the Herbig disk dust radii at 68% () and 90% () of the total flux (see Table 1). Based on these measurements, the majority of the Herbig disks seem to be large compared to T Tauri disks. For the resolved disks, R68% ranges from 35±2 au (HD 100546) to 315±39 au (HD 9672), with a median radius of 71±7 au (HD 169142). The minimum and maximum radius of R90% is slightly larger at 41±4 au and 473±112 au for the same disks, with a median radius of 109±31 au (HD 135344B). We should stress that this is the dust radius and the gas radius is most likely a factor of a few larger (e.g., Ansdell et al., 2018; Trapman et al., 2019; Sanchis et al., 2021). Also, it is possible that there is some tenuous dust emission at larger radii, which was for example found for HD 100546 (Walsh et al., 2014; Fedele et al., 2021). But this would not strongly influence .
The larger confidence intervals of R90% are due to the curve-of-growth levelling off, making the range in which the flux is within its 10% error rather large. The errors on R68% are on the other hand set by the discrete number of pixels in the image, where the pixel size is dictated by the resolution (synthesized beam). For the unresolved disks, the radius is constrained by the computed upper limits. The R68% upper limits range from 27 au (TY CrA) up to 328 au (V599 Ori) and have a median of 82 au. The R90% upper limits range from 34 au (TY CrA) up to 326 au (HD 37258) and have a median of 126 au (HD 245185).
For Lupus, 76% of all detected disks were unresolved (Ansdell et al., 2018). Using half of the FWHM beam size () and a mean distance of 160 pc (Manara et al., 2018), the upper limit on R90% for these unresolved disks is ¡20 au. Consequently, the mean R90% dust radius is at most 42 au and the median at most 20 au. This is a factor of about three smaller compared to the median radius of the Herbig disks. For Upper Sco, the same is found: Barenfeld et al. (2017) measured the dust radii of Upper Sco by fitting power-law models to the dust surface density. They do not report radii, and so we compare their radii that have a median of 14 au and a range of 5 au to 44 au with our median Herbig dust radii. The latter are found to be a factor of about five larger.
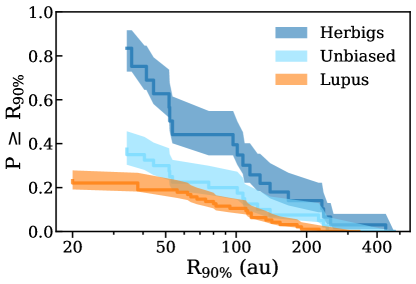
These low mean dust disk radii do not mean that no large T Tauri disks exist. Some T Tauri dust disks in Lupus do extend out to R au. This is clear in Fig. 6, which shows the cumulative distributions of the 90% flux cutoff radii of the Lupus and Herbig populations. For both distributions, the upper limits on the unresolved disks are taken into account. The range in dust radii is similar in both T Tauri (the Lupus sample) and Herbig disks, but the large number of small T Tauri disks skews the distribution to smaller radii compared to the Herbig sample. However, the distribution for the Herbig disks is an optimistic case because the unresolved disks are likely smaller than what is suggested by their upper limits, and therefore the distribution lies higher than it would if all disks were resolved. One can ‘unbias’ the distribution by assuming all unresolved and unobserved disks to have the same upper limit as the smallest disk. The 225 pc limited sample is used, as this one is the most complete. This unbiased distribution is shown in light blue. Using a two-sample Kolmogorov-Smirnov test from the Scipy package (Virtanen et al., 2020), we can reject the null hypothesis of the Lupus and Herbig dust radii to be drawn from the same underlying distribution based on a -value of . The unbiased distribution is found to be similar to the Lupus distribution because the same null hypothesis cannot formally be rejected based on a -value of . Changing to R68% (with the radii of Lupus from Sanchis et al. 2021), we obtain similar results. Hence, we conclude that the measured Herbig dust radii are significantly larger than those of Lupus. The Herbig disk size distribution only becomes comparable to that in Lupus if all unresolved and all unobserved disks turn out to be as small as (or smaller than) 27 au (although Lupus also has undetected disks, which might be small, which are not taken into account here); in all other cases, Herbig disks are significantly larger than the disks in Lupus.
5 Discussion
5.1 The – relation
The – relation is one of the important conclusions from population studies in the past decade. By now, this relation is well established across a large variety of star-forming regions mostly containing lower mass stars (e.g., Andrews et al., 2013; Ansdell et al., 2016, 2017; Pascucci et al., 2016; Barenfeld et al., 2016). Our observations are in line with the increase in dust mass for increasing stellar mass. The exact relation does however depend on the considered stellar mass range. For the full sample used in this work, the range in stellar masses is rather narrow: 1.5 M⊙ to 3.9 M⊙, excluding MWC 297 with a mass of 14.5 . As Fig. 4 shows, among this small range of stellar masses, there is a large spread in dust mass. This might be due to the diversity in age and birth environment present in the sample, which changes the amount of dust present in the disk and complicates the comparison in terms of dust mass between the different distributions; this is further addressed in §5.2. Both the narrow range in stellar mass and the diversity in age and birth environment hide any trend which could be present within the sample. However, a general trend is visible when considered in a wider stellar mass range (i.e., combined with Lupus and Upper Sco); see the histograms in Fig. 4. The Herbig disks are more massive compared to the disks in Lupus and Upper Sco.
The – relation has also been found to steepen over time, mainly based on low-mass stars (e.g., Pascucci et al., 2016; Ansdell et al., 2017). The fact that the more massive disks seem to retain their disk mass for longer has been hypothesized to originate from inner holes and/or structures, which tend to be larger in more massive disks. Guzmán-Díaz et al. (2021) found that of Herbig Ae/Be disks can be considered to be transitional based on their SED (though uncertain because it can be affected by for example inclination and extinction; half of transition disks in Lupus show no signature of a cavity in the SED van der Marel et al. 2018), which is more than the fraction of transitional disks in T Tauri stars as imaged with ALMA (van der Marel et al., 2018). Also, of Herbig Be stars tend to have larger inner disk holes, significantly higher compared to for Herbig Ae stars (Guzmán-Díaz et al., 2021, who estimated the inner disk hole sizes from the SED, i.e., sizes from 0.1 au out to 10 au, which samples smaller radii than the large cavities with ALMA at tens to hundreds of au). This is in accordance with an observed increase in structure with stellar mass (van der Marel & Mulders, 2021). In our work there are two B-type stars with disks that have a dust mass higher than 10 M⊕. HD 34282 has a visible ring structure present in its disk, while R CrA has been observed with the largest beam size of the data used in this work so that no structures are visible. For the later spectral types, all resolved disks indeed show disk structures.
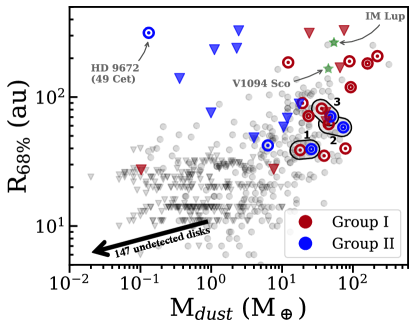
Figure 7 shows the dust masses and dust radii for all detected disks in this work and indicates whether the disk is unresolved or a ring () or multiple rings () are visible. This plot shows that in general, the disks with visible structure are more massive with a mean of M⊕ compared to the unresolved disks with a mean of M⊕, a factor of two lower. The unresolved disks mainly consist of the Herbig disks coming from population studies by for example Cazzoletti et al. (2019). These disks are expected to be the least biased towards large and bright disks. It is therefore not unlikely that the 17 resolved disks ( of the 36 disks) are more massive than the average Herbig disk. Still, the 225 pc limited sample contains 15 of the 17 resolved disks (HD 34282 and HD 290764 are at larger distances), all showing structure. This means that at least (15/25) of the disks likely contain structure. This is an important result, as van der Marel & Mulders (2021) show that there is a correlation between stellar mass and the presence of structure. These latter authors find that of disks around stars with masses are structured (i.e., transition and ringed disks), which agrees well with our findings. Additionally, the more massive disks (i.e., M⊕) seem to be more extended and show more structure than lower mass disks (van der Marel & Mulders, 2021). This also agrees with our findings here (which include a factor of about two more Herbig disks): the number of high-mass disks (64% (23/36) of the disks have 10 M⊕) does fall in line with the number of disks in which we see structure (15/25, ).
5.2 Scaling dust masses with
How does the Herbig disk mass distribution look if we remove the underlying – dependency calibrated primarily at lower ? To obtain an independent mass estimate, the dust masses are scaled with the – relation to the expected dust masses for a 1 star using
| (3) |
where is the slope of the power-law and is in solar masses. The resulting CDFs can be found in the left panel of Fig. 8. For both Lupus and Upper Sco, the relations found by Ansdell et al. (2017) are used (respectively and ). For the Herbig sample, the relation found by Andrews et al. (2013) is used () because this study includes more Herbig stars compared to other studies (see Table 5). Scaling the dust masses removes the effect that the stellar mass has on the dust mass and mostly leaves the effects of age considering that dust temperature was already accounted for with Eq. (2) for the Herbig disks and a temperature of 20 K for the low-mass star-forming regions. Again, following the same approach as Williams et al. (2019), a log-normal distribution is fitted through the found CDFs; the fitted parameters are shown in Table 3. The best-fit log-normal distribution is shown in the right panel of Fig. 8.
| () | ||||
| Herbigs | 2.44 | 2.24 | 0.95 | 0.54 |
| Lupus | 0.42 | 0.48 | 1.51 | 0.64 |
| Upper Sco | 0.43 | 0.37 | 1.11 | 0.86 |
For these scaled masses, the cumulative distribution of the Herbig disks moved towards lower dust masses because the stellar mass is above one solar mass. On the contrary, both Upper Sco and Lupus moved towards higher dust masses. The width of both the Upper Sco and Herbig disk distributions stayed similar (though the width of the Herbig disk distribution is not well constrained) because of the relatively narrow stellar mass distributions. Lupus has in contrast a broader stellar mass distribution, resulting in a narrower distribution after scaling the dust masses (see Table 2).
Applying the – relation unsurprisingly moves the mass distribution of the Herbig disks to the same values as found in Upper Sco and only slightly below the distribution found in Lupus. This scaling shows that the mass difference between the Herbig disks and the T Tauri disks can indeed be tied to a difference in stellar mass. Also, the larger disk sizes we find for the Herbig disks may hold further clues as to why this relation exists.
5.3 The – relation
Following van der Marel & Mulders (2021), we speculate that the larger disk masses and sizes found for Herbig disks as compared to their T Tauri counterparts reflect the combined effect of inheritance and evolution. Our ansatz is that these findings originate from an initial disk mass that increases with stellar mass, and that subsequent disk evolution enlarges the differences as explained below, especially as these are obtained via (sub)millimeter continuum flux observations. It is a reasonable assumption that more massive cloud cores form more massive stars that are surrounded by more massive disks, if a constant fraction of the accreting material ends up in the disk. Although object-to-object variations will undoubtedly introduce a scatter around this relation, an overall scaling between the mass of the cloud core, the final mass of the star, and the mass of the disk is plausible.
A higher mass disk contains more material available for planet formation, and such planets can grow out to larger masses (e.g., Mordasini et al., 2012). This matches the observed trend that higher mass stars (1 M⊙ and higher) are more often found to host planets more massive than M⊕ compared to stars with lower stellar masses (e.g., Johnson et al., 2007, 2010; Wittenmyer et al., 2020; Fulton et al., 2021). Such planets can also be formed on larger orbits, because the required surface density is present at larger radii in a higher mass disk. This matches the presence of wide-orbit gas-giants around stars like HR 8799 (Marois et al., 2008, 2010) and Pictoris (Lagrange et al., 2010), and (proto)planets in the disks like the ones around HD 100546 (Quanz et al., 2013, 2015) or HD 163296 (Isella et al., 2016; Zhang et al., 2018; Liu et al., 2018; Teague et al., 2018; Pinte et al., 2018). Once planets are formed of sufficient mass, gaps can open up, as is commonly observed in many disks, and inward transport of material, especially dust, is halted (e.g., Zhu et al., 2012). This has two observable effects. First, it traps a detectable mass reservoir outside the gaps that leads to larger dust continuum disk sizes. Second, by preventing the dust from flowing inward, a larger fraction of the dust remains in outer disk regions, thus allowing a larger continuum flux (because the more spread out material remains optically thin, and so all dust mass contributes, or because optically thick material subtends a larger region on the sky) and larger inferred disk dust mass (Ballering & Eisner, 2019). A relation has indeed been found between the continuum size and the luminosity in disks (Tripathi et al., 2017) and more recently, van der Marel & Mulders (2021) found a general increase in dust mass with dust extent. Figure 7 presents the R68% and M of the full sample of our work together with the 700 disks analyzed in van der Marel & Mulders (2021). The sample of van der Marel & Mulders (2021) mainly contains T Tauri disks, but does have of the Herbig disks which are in our work. Figure 7 clearly shows that in general the dust disk size and mass of Herbig disks are larger than those of the typical T Tauri disk, especially because of the T Tauri disks are not detected.
However, this does not mean that T Tauri stars cannot have disks that are large and massive: there are T Tauri disks that are as large and massive as a Herbig disk, but they make up a much smaller fraction of the total population. Figure 7 also shows the two largest disks in Lupus (V1094 Sco, K6-type, van Terwisga et al. 2018; IM Lup, M0-type, Cleeves et al. 2016), which are of similar size, but have a six times lower mass than the Herbig disks and are only 2% of the Lupus population. The mass difference may simply reflect the dust mass distribution of Herbig disks peaking at masses a factor of about 6 higher than the dust mass distribution for T Tauri stars.
HD 9672 (49 Ceti) is unusually large for its mass and a clear outlier in Fig. 7. Its close distance (57 pc) has helped in detecting this low-mass source and identifying it as an outlier. This raises the question of whether other undetected objects may be harboring extended, low-surface-brightness disks.
In contrast, if most or all of the dust has migrated radially inward to spatially unresolved disk regions, smaller disk sizes are inferred and, because inner disk regions will more easily become optically thick at (sub)millimeter wavelengths (for the same mass), lower continuum fluxes lead to lower inferred disk dust masses following Eq. (1). This is in line with the findings of Ballering & Eisner (2019), who show that the inferred disk mass from Eq. (1) of T Tauri disks in Taurus could underestimate the mass by a median factor of about two. Neglecting dust scattering on the other hand may lead to overestimation of the mass Zhu et al. 2019. Some of the Herbig disks in this sample might not have formed a gas giant planet at large separations, which would explain the lower dust masses of some of the disks. This illustrates that if higher mass stars are formed with on average higher mass disks, the change in observable consequences (i.e., continuum flux and therefore inferred mass) during the evolution of the disk is likely to amplify the original trend.
5.4 Group I and Group II
How do the dust mass and size correspond to other disk properties of our Herbig sample? One such property is the Meeus groups: group I and group II (Meeus et al., 2001). Different explanations for the origin of the two groups exist. Evolutionary arguments have been put forward, for example grain growth and/or settling causing group I to evolve into group II (Dullemond & Dominik, 2004a, b, 2005). However, the finding that many group I sources have disks with gaps (e.g., Honda et al., 2012) caused Maaskant et al. (2013) to propose an evolutionary scenario where both groups are preceded by a primordial flaring disk. Nonetheless, Menu et al. (2015) pointed out that there were group II sources with gaps as well (based on VLTI observations, referring to gaps on au scales, as opposed to tens of au for ALMA), giving rise to the idea that group I has an influx of evolving group II gapped disks.
Table 1 contains the groups in which each Herbig disk falls following the classification of Meeus et al. (2001). Figure 7 combines the dust mass and radius with the Herbig group classification and information on the structures visible in the disk. From this figure, it is apparent that the mean dust mass of the group I disks is larger than that of the group II disks. Using the same approach as before, the cumulative and fitted log-normal distributions of the group I and group II sources are shown in Fig. 9. The fitting results are listed in Table 4. While the number of disks for each distribution is small, this analysis clearly shows a higher mean dust mass for the group I objects compared to the group II objects. Moreover, the distribution of the group II objects is similar to the distribution of the disks in Lupus (see Fig. 9).
| () | ||||
| Group I | 2.73 | 2.99 | 1.57 | 0.34 |
| Group II | 2.13 | 0.65 | 0.61 | 0.68 |
As many as 13 out of 19 group I disks are resolved, and they all show structure. The resolved group II disks are smaller than the group I disks, but there are group I disks with sizes very similar to several group II disks, and in these cases both the group I and II disks show structure (for a comparison see Fig. 10). While there are large upper limits for both group I and group II disks, there are a few much smaller and thus more stringent dust radius upper limits for both groups, showing that there are a few much smaller disks in either group. Based on the grey region showing where most of the disks lie (as studied by van der Marel & Mulders 2021) we predict that the five unresolved group II disks at M⊕ (BF Ori, HD 37258, HD 58647, HD 141569 and VV Ser) are going to be 10–30 au in size when resolved. While for four of these disks the size is unknown, from visibility modeling HD 141569 is thought to have an outer disk component out to 300 au, though it is much fainter than an inner disk component with a radius of au (White & Boley, 2018). If these disks are indeed au in size, a resolution of at least is needed to resolve all five disks. This resolution is achievable with ALMA in the most extended array in Band 7.
In general, one ring is visible for most of the group I disks (9/12), while multiple rings are visible for most group II disks (3/5). Three of these resolved group II disks can be paired with group I disks of very similar size and mass (indicated by the numbered pairs 1-3 in Fig. 7). Figure 10 shows these six disks, three for each group, with similar sizes and masses for each pair. When putting these disks side-by-side, an intriguing trend appears. The group II disks are more compact, and the bulk of their mass is close to the star. This is in contrast to the group I disks, where mostly large rings are visible, with little mass close to the star. The same is found in scattered light images (Garufi et al., 2017).
As we hypothesized in §5.3, the larger disks could be connected to the formation of gas-giant planets at large separations, which can open up gaps and inward transport of material is halted. The difference between group I and group II disks could be caused by this as well: group I disks were able to form gas giants at large distances, while group II disks were not, only halting the radial drift at closer-in distances. The group I disks keep much of the dust mass at larger radii, while the inner part of the disk accretes onto the star, leaving a single large ring. This agrees well with the evolutionary scenario posed by Menu et al. (2015) and Garufi et al. (2017), who suggested that group II disks may evolve into group I disks. The group II disks might form (giant) planets closer-in or later on, eventually creating a gap and moving towards group I. This would also explain the two other resolved group II disks not yet mentioned: AK Sco and HD 9672, both of which show one ring and are rather old. Furthermore, Cieza et al. (2021) propose a similar evolutionary scenario based on the brightest disks from the DSHARP (Andrews et al., 2018a) and ODISEA programs. Cieza et al. (2021) propose that disks first form with shallow gaps, which become more pronounced once planets start to grow; the dust is trapped at the inner edges of the rings while the inner dust disk dissipates, creating a single-ringed disk. This matches well with what we see here.
Another possibility which should be mentioned is that close (sub)stellar binary companions would have a similar effect on the disk by creating an inner hole (van der Marel & Mulders, 2021). All three group I sources shown in Fig. 10 are known to be wide binaries (HD 100453 Chen et al. 2006; CQ Tau Thomas et al. 2007; HD 135344B Coulson & Walther 1995). While wide separation binaries are unlikely to affect disk structure (Harris et al. 2012, but see Rosotti et al. (2020) who suggest that the spirals in HD 100453 are caused by the companion), for HD 135344B and CQ Tau there is indirect evidence from spirals that there could be a massive companion carving the inner gap (van der Marel et al., 2016; Wölfer et al., 2021). A similar scenario has also been suggested for AB Aur (Poblete et al., 2020) . In HD 142527, an M-dwarf has been found to reside in the disk (e.g., Lacour et al., 2016; Claudi et al., 2019), giving rise to asymmetric structures in the disk (Garg et al., 2021). Hence, binarity at relatively close separations could also possibly explain the differences between the group I and group II sources.
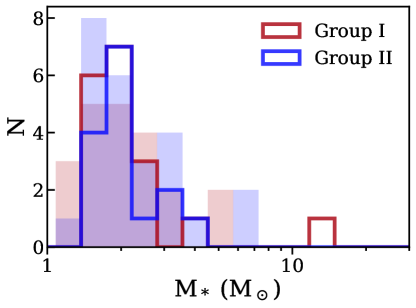
The fact that we detect more massive group I disks compared to group II could then be a consequence of the spatial distribution of the dust in the disk. As Fig. 11 shows, the distribution of stellar masses is the same in group I and group II objects and therefore, following the – relation, they should have a similar range in dust masses. Nevertheless, the group II disks are smaller and are therefore prone to being optically thick due to most mass being in the inner regions of the disk (which is indeed what Fig. 10 shows), reducing the inferred dust mass in the disk. Consequently, in disks without gaps, the stellar radiation is potentially ‘trapped’ close to the star because much more dust is present in these close-in regions, leaving most of the disk colder and flatter, resulting in a group II-type SED. As Fig. 9 shows, the distribution of the disks in Lupus overlaps well with the group II objects. This overlap could originate from group II Herbig disks being unable to form massive exoplanets at large distances, like T Tauri stars, reducing the inferred disk mass.
Lastly, in addition to the stellar masses being evenly distributed between the group I and II objects for both the observed and unobserved disks within 450 pc (see Fig. 11), of all Herbig disks within 450 pc belong to group I (Vioque et al., 2018) which is comparable to the of the Herbig disks in our work. We therefore do not expect a change in the distributions presented in Fig. 9 if all disks are included in the distribution.
6 Conclusion
We present a first look at the distribution of dust mass and the extent of disks around Herbig stars by collecting ALMA archival data for 36 Herbig disks within 450 pc. Of these, 17 disks are resolved. Two Herbig disks are undetected. Excluding the Orion star-forming region, the completeness rate is . We compare the results to previous population studies of Lupus (Ansdell et al., 2016, 2018) and Upper Sco (Barenfeld et al., 2016, 2017). Our results can be summarized as follows:
-
1.
The mean dust mass of the Herbig sample is a factor of about three higher than the dust masses in Lupus and a factor of about seven higher than the dust masses in Upper Sco. The Herbig disk masses are distributed over the same range as T Tauri disks, but are skewed towards higher masses.
-
2.
Herbig disks are generally larger than T Tauri disks, although the largest Herbig disks are of similar size to the largest T Tauri disks.
-
3.
The masses of the Herbig disks are as expected based on the – relation. After scaling the dust masses following this relation to a star of 1, the mean dust mass overlaps with the Upper Sco SFR, which has a similar age to the Herbig star sample used in this work.
-
4.
Based on both larger and more massive disks, we speculate that these massive and large disks find their origin in an initial disk mass that increases with stellar mass, and that subsequent disk evolution enlarges the (observable) differences with disks around lower mass stars.
-
5.
Group I objects are found to be both more massive and larger than group II objects. Additionally, the dust mass distribution of the group II disks is similar to that of the Lupus T Tauri disks. We argue that group II disks were unable to form massive companions or planets at (very) large radii and consequently much more dust is present at close-in regions compared to group I sources; this causes them to have masses and sizes similar to those of T Tauri disks, and they may trap stellar radiation at small radii, leaving most of the disk cold and flat, resulting in a group II-type SED.
This work shows that the evolution of Herbig disks may hold important clues about the formation of gas-giant planets. A complete ALMA study of a homogeneous sample of Herbig disks at similar resolutions and sensitivities is much needed in order to further investigate their formation.
Acknowledgements.
Astrochemistry in Leiden is supported by the Netherlands Research School for Astronomy (NOVA). This paper makes use of the following ALMA data: 2013.1.00498.S, 2015.1.00192.S, 2015.1.00889.S, 2015.1.01058.S, 2015.1.01301.S, 2015.1.01353.S, 2015.1.01600.S, 2016.1.00110.S, 2016.1.00204.S, 2016.1.00484.L, 2016.1.01164.S, 2017.1.00466.S, 2012.1.00870.S, 2017.1.01404.S, 2017.1.01545.S, 2017.1.01607.S, 2017.1.01678.S, 2018.A.00056.S, 2018.1.00814.S, 2018.1.01222.S, 2018.1.01309.S, 2019.1.00218.S, 2019.1.01813.S. ALMA is a partnership of ESO (representing its member states), NSF (USA) and NINS (Japan), together with NRC (Canada), MOST and ASIAA (Taiwan), and KASI (Republic of Korea), in cooperation with the Republic of Chile. The Joint ALMA Observatory is operated by ESO, AUI/NRAO and NAOJ. This work makes use of the following software: The Common Astronomy Software Applications (CASA) package (McMullin et al., 2007), Python version 3.9, astropy (Astropy Collaboration et al., 2013, 2018), lifelines (Davidson-Pilon et al., 2021), matplotlib (Hunter, 2007), numpy (Harris et al., 2020), scipy (Virtanen et al., 2020) and seaborn (Waskom, 2021). We thank the referee for their insightful comments which have improved this paper. Additionally, we would like to thank Rens Waters, Nienke van der Marel and Carsten Dominik for their comments as well. Lastly, our thanks goes to the European ARC node in the Netherlands (ALLEGRO), and in particular Aïda Ahmadi, for their help with the data calibration and imaging.References
- Acke & van den Ancker (2004) Acke, B. & van den Ancker, M. E. 2004, A&A, 426, 151
- Alcalá et al. (2014) Alcalá, J. M., Natta, A., Manara, C. F., et al. 2014, A&A, 561, A2
- Alonso-Albi et al. (2009) Alonso-Albi, T., Fuente, A., Bachiller, R., et al. 2009, A&A, 497, 117
- Andrews et al. (2018a) Andrews, S. M., Huang, J., Pérez, L. M., et al. 2018a, ApJ, 869, L41
- Andrews et al. (2013) Andrews, S. M., Rosenfeld, K. A., Kraus, A. L., & Wilner, D. J. 2013, ApJ, 771, 129
- Andrews et al. (2018b) Andrews, S. M., Terrell, M., Tripathi, A., et al. 2018b, ApJ, 865, 157
- Andrews & Williams (2005) Andrews, S. M. & Williams, J. P. 2005, ApJ, 631, 1134
- Ansdell et al. (2020) Ansdell, M., Haworth, T. J., Williams, J. P., et al. 2020, AJ, 160, 248
- Ansdell et al. (2017) Ansdell, M., Williams, J. P., Manara, C. F., et al. 2017, AJ, 153, 240
- Ansdell et al. (2018) Ansdell, M., Williams, J. P., Trapman, L., et al. 2018, ApJ, 859, 21
- Ansdell et al. (2016) Ansdell, M., Williams, J. P., van der Marel, N., et al. 2016, ApJ, 828, 46
- Astropy Collaboration et al. (2018) Astropy Collaboration, Price-Whelan, A. M., Sipőcz, B. M., et al. 2018, AJ, 156, 123
- Astropy Collaboration et al. (2013) Astropy Collaboration, Robitaille, T. P., Tollerud, E. J., et al. 2013, A&A, 558, A33
- Baines et al. (2006) Baines, D., Oudmaijer, R. D., Porter, J. M., & Pozzo, M. 2006, MNRAS, 367, 737
- Ballering & Eisner (2019) Ballering, N. P. & Eisner, J. A. 2019, AJ, 157, 144
- Barenfeld et al. (2016) Barenfeld, S. A., Carpenter, J. M., Ricci, L., & Isella, A. 2016, ApJ, 827, 142
- Barenfeld et al. (2017) Barenfeld, S. A., Carpenter, J. M., Sargent, A. I., Isella, A., & Ricci, L. 2017, ApJ, 851, 85
- Bastian et al. (2010) Bastian, N., Covey, K. R., & Meyer, M. R. 2010, ARA&A, 48, 339
- Beckwith et al. (1990) Beckwith, S. V. W., Sargent, A. I., Chini, R. S., & Guesten, R. 1990, AJ, 99, 924
- Benisty et al. (2017) Benisty, M., Stolker, T., Pohl, A., et al. 2017, A&A, 597, A42
- Bessell & Eggen (1972) Bessell, M. S. & Eggen, O. J. 1972, ApJ, 177, 209
- Birnstiel et al. (2010) Birnstiel, T., Dullemond, C. P., & Brauer, F. 2010, A&A, 513, A79
- Boersma et al. (2009) Boersma, C., Peeters, E., Martín-Hernández, N. L., et al. 2009, A&A, 502, 175
- Carmona et al. (2010) Carmona, A., van den Ancker, M. E., Audard, M., et al. 2010, A&A, 517, A67
- Carmona et al. (2007) Carmona, A., van den Ancker, M. E., & Henning, T. 2007, A&A, 464, 687
- Cazzoletti et al. (2019) Cazzoletti, P., Manara, C. F., Baobab Liu, H., et al. 2019, A&A, 626, A11
- Chen et al. (2016) Chen, P. S., Shan, H. G., & Zhang, P. 2016, New A, 44, 1
- Chen et al. (2006) Chen, X. P., Henning, T., van Boekel, R., & Grady, C. A. 2006, A&A, 445, 331
- Cieza et al. (2021) Cieza, L. A., González-Ruilova, C., Hales, A. S., et al. 2021, MNRAS, 501, 2934
- Cieza et al. (2019) Cieza, L. A., Ruíz-Rodríguez, D., Hales, A., et al. 2019, MNRAS, 482, 698
- Claudi et al. (2019) Claudi, R., Maire, A. L., Mesa, D., et al. 2019, A&A, 622, A96
- Cleeves et al. (2016) Cleeves, L. I., Öberg, K. I., Wilner, D. J., et al. 2016, ApJ, 832, 110
- Coulson & Walther (1995) Coulson, I. M. & Walther, D. M. 1995, MNRAS, 274, 977
- Covino et al. (1984) Covino, E., Terranegra, L., Vittone, A. A., & Russo, G. 1984, AJ, 89, 1868
- Czekala et al. (2015) Czekala, I., Andrews, S. M., Jensen, E. L. N., et al. 2015, ApJ, 806, 154
- Davidson-Pilon et al. (2021) Davidson-Pilon, C., Kalderstam, J., Jacobson, N., et al. 2021, CamDavidsonPilon/lifelines: 0.25.10
- de Gregorio-Monsalvo et al. (2013) de Gregorio-Monsalvo, I., Ménard, F., Dent, W., et al. 2013, A&A, 557, A133
- Doering et al. (2007) Doering, R. L., Meixner, M., Holfeltz, S. T., et al. 2007, AJ, 133, 2122
- Drew et al. (1997) Drew, J. E., Busfield, G., Hoare, M. G., et al. 1997, MNRAS, 286, 538
- Dullemond & Dominik (2004a) Dullemond, C. P. & Dominik, C. 2004a, A&A, 417, 159
- Dullemond & Dominik (2004b) Dullemond, C. P. & Dominik, C. 2004b, A&A, 421, 1075
- Dullemond & Dominik (2005) Dullemond, C. P. & Dominik, C. 2005, A&A, 434, 971
- Eisner et al. (2018) Eisner, J. A., Arce, H. G., Ballering, N. P., et al. 2018, ApJ, 860, 77
- Eisner et al. (2016) Eisner, J. A., Bally, J. M., Ginsburg, A., & Sheehan, P. D. 2016, ApJ, 826, 16
- Fedele et al. (2017) Fedele, D., Carney, M., Hogerheijde, M. R., et al. 2017, A&A, 600, A72
- Fedele et al. (2021) Fedele, D., Toci, C., Maud, L., & Lodato, G. 2021, A&A, 651, A90
- Fukagawa et al. (2004) Fukagawa, M., Hayashi, M., Tamura, M., et al. 2004, ApJ, 605, L53
- Fukagawa et al. (2006) Fukagawa, M., Tamura, M., Itoh, Y., et al. 2006, ApJ, 636, L153
- Fulton et al. (2021) Fulton, B. J., Rosenthal, L. J., Hirsch, L. A., et al. 2021, ApJS, 255, 14
- Gaia Collaboration et al. (2018) Gaia Collaboration, Brown, A. G. A., Vallenari, A., et al. 2018, A&A, 616, A1
- Garcia et al. (1999) Garcia, P. J. V., Thiébaut, E., & Bacon, R. 1999, A&A, 346, 892
- Garg et al. (2021) Garg, H., Pinte, C., Christiaens, V., et al. 2021, MNRAS, 504, 782
- Garufi et al. (2017) Garufi, A., Meeus, G., Benisty, M., et al. 2017, A&A, 603, A21
- Grant et al. (2021) Grant, S. L., Espaillat, C. C., Wendeborn, J., et al. 2021, ApJ, 913, 123
- Gray & Corbally (1998) Gray, R. O. & Corbally, C. J. 1998, AJ, 116, 2530
- Gray et al. (2006) Gray, R. O., Corbally, C. J., Garrison, R. F., et al. 2006, AJ, 132, 161
- Gray et al. (2017) Gray, R. O., Riggs, Q. S., Koen, C., et al. 2017, AJ, 154, 31
- Guzmán-Díaz et al. (2021) Guzmán-Díaz, J., Mendigutía, I., Montesinos, B., et al. 2021, A&A, 650, A182
- Harris et al. (2020) Harris, C. R., Millman, K. J., van der Walt, S. J., et al. 2020, Nature, 585, 585
- Harris et al. (2012) Harris, R. J., Andrews, S. M., Wilner, D. J., & Kraus, A. L. 2012, ApJ, 751, 115
- Hartmann et al. (1989) Hartmann, L., Kenyon, S. J., Hewett, R., et al. 1989, ApJ, 338, 1001
- Herbig (1960) Herbig, G. H. 1960, ApJS, 4, 337
- Hildebrand (1983) Hildebrand, R. H. 1983, QJRAS, 24, 267
- Honda et al. (2012) Honda, M., Maaskant, K., Okamoto, Y. K., et al. 2012, ApJ, 752, 143
- Houk (1978) Houk, N. 1978, Michigan catalogue of two-dimensional spectral types for the HD stars
- Houk (1982) Houk, N. 1982, Michigan Catalogue of Two-dimensional Spectral Types for the HD stars. Volume_3. Declinations -40_f0 to -26_f0.
- Houk & Smith-Moore (1988) Houk, N. & Smith-Moore, M. 1988, Michigan Catalogue of Two-dimensional Spectral Types for the HD Stars. Volume 4, Declinations -26°.0 to -12°.0., Vol. 4
- Houk & Swift (1999) Houk, N. & Swift, C. 1999, Michigan Spectral Survey, 5, 0
- Hsu et al. (2013) Hsu, W.-H., Hartmann, L., Allen, L., et al. 2013, ApJ, 764, 114
- Hughes et al. (2017) Hughes, A. M., Lieman-Sifry, J., Flaherty, K. M., et al. 2017, ApJ, 839, 86
- Hunter (2007) Hunter, J. D. 2007, Computing in Science & Engineering, 9, 9
- Irvine & Houk (1977) Irvine, N. J. & Houk, N. 1977, PASP, 89, 347
- Isella et al. (2016) Isella, A., Guidi, G., Testi, L., et al. 2016, Phys. Rev. Lett., 117, 251101
- Isella et al. (2010) Isella, A., Natta, A., Wilner, D., Carpenter, J. M., & Testi, L. 2010, ApJ, 725, 1735
- Jaschek et al. (1991) Jaschek, C., Jaschek, M., Andrillat, Y., & Egret, D. 1991, A&A, 252, 229
- Johnson et al. (2010) Johnson, J. A., Aller, K. M., Howard, A. W., & Crepp, J. R. 2010, PASP, 122, 905
- Johnson et al. (2007) Johnson, J. A., Butler, R. P., Marcy, G. W., et al. 2007, ApJ, 670, 833
- Juhász et al. (2010) Juhász, A., Bouwman, J., Henning, T., et al. 2010, ApJ, 721, 431
- Kataoka et al. (2016) Kataoka, A., Tsukagoshi, T., Momose, M., et al. 2016, ApJ, 831, L12
- Koresko et al. (1991) Koresko, C. D., Beckwith, S. V. W., Ghez, A. M., Matthews, K., & Neugebauer, G. 1991, AJ, 102, 2073
- Kraus et al. (2009) Kraus, S., Hofmann, K. H., Malbet, F., et al. 2009, A&A, 508, 787
- Kraus et al. (2017) Kraus, S., Kreplin, A., Fukugawa, M., et al. 2017, ApJ, 848, L11
- Kroupa (2001) Kroupa, P. 2001, MNRAS, 322, 231
- Kurosawa et al. (2016) Kurosawa, R., Kreplin, A., Weigelt, G., et al. 2016, MNRAS, 457, 2236
- Lacour et al. (2016) Lacour, S., Biller, B., Cheetham, A., et al. 2016, A&A, 590, A90
- Lagrange et al. (2010) Lagrange, A. M., Bonnefoy, M., Chauvin, G., et al. 2010, Science, 329, 57
- Levenhagen & Leister (2006) Levenhagen, R. S. & Leister, N. V. 2006, MNRAS, 371, 252
- Liu et al. (2018) Liu, S.-F., Jin, S., Li, S., Isella, A., & Li, H. 2018, ApJ, 857, 87
- Liu et al. (2019) Liu, Y., Dipierro, G., Ragusa, E., et al. 2019, A&A, 622, A75
- Long et al. (2021) Long, F., Andrews, S. M., Vega, J., et al. 2021, ApJ, 915, 131
- Maaskant et al. (2013) Maaskant, K. M., Honda, M., Waters, L. B. F. M., et al. 2013, A&A, 555, A64
- Malfait et al. (1998) Malfait, K., Bogaert, E., & Waelkens, C. 1998, A&A, 331, 211
- Manara et al. (2018) Manara, C. F., Morbidelli, A., & Guillot, T. 2018, A&A, 618, L3
- Manoj et al. (2006) Manoj, P., Bhatt, H. C., Maheswar, G., & Muneer, S. 2006, ApJ, 653, 657
- Manoj et al. (2007) Manoj, P., Ho, P. T. P., Ohashi, N., et al. 2007, ApJ, 667, L187
- Marois et al. (2008) Marois, C., Macintosh, B., Barman, T., et al. 2008, Science, 322, 1348
- Marois et al. (2010) Marois, C., Zuckerman, B., Konopacky, Q. M., Macintosh, B., & Barman, T. 2010, Nature, 468, 1080
- McMullin et al. (2007) McMullin, J. P., Waters, B., Schiebel, D., Young, W., & Golap, K. 2007, in Astronomical Society of the Pacific Conference Series, Vol. 376, Astronomical Data Analysis Software and Systems XVI, ed. R. A. Shaw, F. Hill, & D. J. Bell, 127
- Meeus et al. (2001) Meeus, G., Waters, L. B. F. M., Bouwman, J., et al. 2001, A&A, 365, 476
- Menu et al. (2015) Menu, J., van Boekel, R., Henning, T., et al. 2015, A&A, 581, A107
- Michel et al. (2021) Michel, A., van der Marel, N., & Matthews, B. 2021, arXiv e-prints, arXiv:2104.05894
- Mooley et al. (2013) Mooley, K., Hillenbrand, L., Rebull, L., Padgett, D., & Knapp, G. 2013, ApJ, 771, 110
- Moór et al. (2019) Moór, A., Kral, Q., Ábrahám, P., et al. 2019, ApJ, 884, 108
- Mora et al. (2001) Mora, A., Merín, B., Solano, E., et al. 2001, A&A, 378, 116
- Mordasini et al. (2012) Mordasini, C., Alibert, Y., Benz, W., Klahr, H., & Henning, T. 2012, A&A, 541, A97
- Mulders et al. (2021) Mulders, G. D., Pascucci, I., Ciesla, F. J., & Fernandes, R. B. 2021, ApJ, 920, 66
- Natta et al. (2004) Natta, A., Testi, L., Neri, R., Shepherd, D. S., & Wilner, D. J. 2004, A&A, 416, 179
- Pascucci et al. (2016) Pascucci, I., Testi, L., Herczeg, G. J., et al. 2016, ApJ, 831, 125
- Pecaut & Mamajek (2016) Pecaut, M. J. & Mamajek, E. E. 2016, MNRAS, 461, 794
- Pineda et al. (2019) Pineda, J. E., Szulágyi, J., Quanz, S. P., et al. 2019, ApJ, 871, 48
- Pinilla et al. (2020) Pinilla, P., Pascucci, I., & Marino, S. 2020, A&A, 635, A105
- Pinte et al. (2018) Pinte, C., Price, D. J., Ménard, F., et al. 2018, ApJ, 860, L13
- Poblete et al. (2020) Poblete, P. P., Calcino, J., Cuello, N., et al. 2020, MNRAS, 496, 2362
- Pogodin et al. (2006) Pogodin, M. A., Malanushenko, V. P., Kozlova, O. V., Tarasova, T. N., & Franco, G. A. P. 2006, A&A, 452, 551
- Quanz et al. (2015) Quanz, S. P., Amara, A., Meyer, M. R., et al. 2015, ApJ, 807, 64
- Quanz et al. (2013) Quanz, S. P., Avenhaus, H., Buenzli, E., et al. 2013, ApJ, 766, L2
- Ricci et al. (2010) Ricci, L., Testi, L., Natta, A., & Brooks, K. J. 2010, A&A, 521, A66
- Rigliaco et al. (2019) Rigliaco, E., Gratton, R., Mesa, D., et al. 2019, A&A, 632, A18
- Rosotti et al. (2020) Rosotti, G. P., Benisty, M., Juhász, A., et al. 2020, MNRAS, 491, 1335
- Rubinstein et al. (2018) Rubinstein, A. E., Macías, E., Espaillat, C. C., et al. 2018, ApJ, 860, 7
- Ruíz-Rodríguez et al. (2018) Ruíz-Rodríguez, D., Cieza, L. A., Williams, J. P., et al. 2018, MNRAS, 478, 3674
- Sanchis et al. (2021) Sanchis, E., Testi, L., Natta, A., et al. 2021, A&A, 649, A19
- Sitko et al. (2012) Sitko, M. L., Day, A. N., Kimes, R. L., et al. 2012, ApJ, 745, 29
- Skiff (2014) Skiff, B. A. 2014, VizieR Online Data Catalog, B/mk
- Spezzi et al. (2008) Spezzi, L., Alcalá, J. M., Covino, E., et al. 2008, ApJ, 680, 1295
- Stolker et al. (2016) Stolker, T., Dominik, C., Avenhaus, H., et al. 2016, A&A, 595, A113
- Tang et al. (2017) Tang, Y.-W., Guilloteau, S., Dutrey, A., et al. 2017, ApJ, 840, 32
- Tang et al. (2012) Tang, Y. W., Guilloteau, S., Piétu, V., et al. 2012, A&A, 547, A84
- Tazzari et al. (2021) Tazzari, M., Clarke, C. J., Testi, L., et al. 2021, MNRAS [arXiv:2010.02249]
- Teague et al. (2018) Teague, R., Bae, J., Bergin, E. A., Birnstiel, T., & Foreman-Mackey, D. 2018, ApJ, 860, L12
- Testi et al. (2014) Testi, L., Birnstiel, T., Ricci, L., et al. 2014, in Protostars and Planets VI, ed. H. Beuther, R. S. Klessen, C. P. Dullemond, & T. Henning, 339
- The et al. (1994) The, P. S., de Winter, D., & Perez, M. R. 1994, A&AS, 104, 315
- Thomas et al. (2007) Thomas, S. J., van der Bliek, N. S., Rodgers, B., Doppmann, G., & Bouvier, J. 2007, in Binary Stars as Critical Tools & Tests in Contemporary Astrophysics, ed. W. I. Hartkopf, P. Harmanec, & E. F. Guinan, Vol. 240, 250–253
- Tisserand et al. (2013) Tisserand, P., Clayton, G. C., Welch, D. L., et al. 2013, A&A, 551, A77
- Tjin A Djie et al. (2001) Tjin A Djie, H. R. E., van den Ancker, M. E., Blondel, P. F. C., et al. 2001, MNRAS, 325, 1441
- Torres et al. (2006) Torres, C. A. O., Quast, G. R., da Silva, L., et al. 2006, A&A, 460, 695
- Trapman et al. (2019) Trapman, L., Facchini, S., Hogerheijde, M. R., van Dishoeck, E. F., & Bruderer, S. 2019, A&A, 629, A79
- Tripathi et al. (2017) Tripathi, A., Andrews, S. M., Birnstiel, T., & Wilner, D. J. 2017, ApJ, 845, 44
- Tychoniec et al. (2020) Tychoniec, Ł., Manara, C. F., Rosotti, G. P., et al. 2020, A&A, 640, A19
- Ubeira Gabellini et al. (2019) Ubeira Gabellini, M. G., Miotello, A., Facchini, S., et al. 2019, MNRAS, 486, 4638
- Valegård et al. (2021) Valegård, P. G., Waters, L. B. F. M., & Dominik, C. 2021, A&A, 652, A133
- van den Ancker et al. (2004) van den Ancker, M. E., Blondel, P. F. C., Tjin A Djie, H. R. E., et al. 2004, MNRAS, 349, 1516
- van der Marel et al. (2016) van der Marel, N., Cazzoletti, P., Pinilla, P., & Garufi, A. 2016, ApJ, 832, 178
- van der Marel & Mulders (2021) van der Marel, N. & Mulders, G. D. 2021, AJ, 162, 28
- van der Marel et al. (2018) van der Marel, N., Williams, J. P., Ansdell, M., et al. 2018, ApJ, 854, 177
- van der Plas et al. (2017a) van der Plas, G., Ménard, F., Canovas, H., et al. 2017a, A&A, 607, A55
- van der Plas et al. (2017b) van der Plas, G., Wright, C. M., Ménard, F., et al. 2017b, A&A, 597, A32
- van Kempen et al. (2010) van Kempen, T. A., Green, J. D., Evans, N. J., et al. 2010, A&A, 518, L128
- van Terwisga et al. (2019) van Terwisga, S. E., Hacar, A., & van Dishoeck, E. F. 2019, A&A, 628, A85
- van Terwisga et al. (2018) van Terwisga, S. E., van Dishoeck, E. F., Ansdell, M., et al. 2018, A&A, 616, A88
- van Terwisga et al. (2020) van Terwisga, S. E., van Dishoeck, E. F., Mann, R. K., et al. 2020, A&A, 640, A27
- Vieira et al. (2003) Vieira, S. L. A., Corradi, W. J. B., Alencar, S. H. P., et al. 2003, AJ, 126, 2971
- Vioque et al. (2018) Vioque, M., Oudmaijer, R. D., Baines, D., Mendigutía, I., & Pérez-Martínez, R. 2018, A&A, 620, A128
- Vioque et al. (2020) Vioque, M., Oudmaijer, R. D., Schreiner, M., et al. 2020, A&A, 638, A21
- Virtanen et al. (2020) Virtanen, P., Gommers, R., Oliphant, T. E., et al. 2020, Nature Methods, 17, 261
- Walsh et al. (2014) Walsh, C., Juhász, A., Pinilla, P., et al. 2014, ApJ, 791, L6
- Waskom (2021) Waskom, M. L. 2021, Journal of Open Source Software, 6, 6
- Waters & Waelkens (1998) Waters, L. B. F. M. & Waelkens, C. 1998, ARA&A, 36, 233
- White & Boley (2018) White, J. A. & Boley, A. C. 2018, ApJ, 859, 103
- Whitney et al. (1993) Whitney, B. A., Clayton, G. C., Schulte-Ladbeck, R. E., et al. 1993, ApJ, 417, 687
- Wichittanakom et al. (2020) Wichittanakom, C., Oudmaijer, R. D., Fairlamb, J. R., et al. 2020, MNRAS, 493, 234
- Williams et al. (2019) Williams, J. P., Cieza, L., Hales, A., et al. 2019, ApJ, 875, L9
- Wittenmyer et al. (2020) Wittenmyer, R. A., Butler, R. P., Horner, J., et al. 2020, MNRAS, 491, 5248
- Wölfer et al. (2021) Wölfer, L., Facchini, S., Kurtovic, N. T., et al. 2021, A&A, 648, A19
- Zhang et al. (2018) Zhang, S., Zhu, Z., Huang, J., et al. 2018, ApJ, 869, L47
- Zhu et al. (2012) Zhu, Z., Nelson, R. P., Dong, R., Espaillat, C., & Hartmann, L. 2012, ApJ, 755, 6
- Zhu et al. (2019) Zhu, Z., Zhang, S., Jiang, Y.-F., et al. 2019, ApJ, 877, L18
- Zuckerman et al. (1995) Zuckerman, B., Forveille, T., & Kastner, J. H. 1995, Nature, 373, 494
- Zuckerman & Song (2012) Zuckerman, B. & Song, I. 2012, ApJ, 758, 77
Appendix A Previous disk population studies done with ALMA
Table 5 lists previous population studies done with ALMA and the number of Herbig stars (as listed in Vioque et al. 2018) present in each work.
| Region | Age (Myr) | Distance (pc) | N | Herbigs | Ref. |
| Taurus | 2 | 140 | 210 | 3 | 1 |
| Lupus | 1–3 | 150 | 93 | 1 | 2 |
| Orionis | 3–5 | 385 | 92 | 0 | 3 |
| Orionis | 5 | 400 | 44 | 1 | 4 |
| Upper Scorpius | 5–11 | 145 | 106 | 0 | 5 |
| Corona Australis | 1–3 | 154 | 41 | 2 | 6 |
| Ophiuchus | 1 | 140 | 147 | 0 | 7, 8 |
| OMC1 | 1 | 400 | 49 | 0 | 9 |
| ONC | 1 | 400 | 104 | 0 | 10 |
| Lynds 1641 | 1.5 | 428 | 101 | 0 | 11 |
| Chamaeleon I | 2 | 160 | 93 | 0 | 12 |
| IC 348 | 2–3 | 310 | 136 | 0 | 13 |
| OMC 2 | 1 | 414 | 132 | 0 | 14 |
| NGC 2024 | 0.5 | 414 | 179 | 0 | 15 |
| This work | 6.2±3.5 | 201±111 | 36 | 36 |
Notes: An object is counted as an Herbig star if listed by Vioque et al. (2018). The given age and distance for this work are the mean ± standard deviation of the values given by Vioque et al. (2018). References: (1) Andrews et al. (2013), (2) Ansdell et al. (2016), (3) Ansdell et al. (2017), (4) Ansdell et al. (2020), (5) Barenfeld et al. (2016), (6) Cazzoletti et al. (2019), (7) Cieza et al. (2019), (8) Williams et al. (2019), (9) Eisner et al. (2016), (10) Eisner et al. (2018), (11) Grant et al. (2021), (12) Pascucci et al. (2016), (13) Ruíz-Rodríguez et al. (2018), (14) van Terwisga et al. (2019), (15) van Terwisga et al. (2020).
Appendix B Details on individual boundary objects
B.1 HD 9672
HD 9672 (or better known as 49 Cet) has been classified both as an old debris disk and a Herbig star. Zuckerman & Song (2012) classified HD 9672 as a debris disk belonging to the 40 Myr old Argus association. However, the disk surrounding HD 9672 has been found to be relatively gas rich compared to other debris disks (Zuckerman et al. 1995; Moór et al. 2019). Moreover, the origin of both the dust and the gas is still unknown. It could be second-generation dust and gas generated by collisions between planetesimals, or inherited from the original cloud (Hughes et al. 2017). Because of this uncertainty, we decided to leave it in the sample.
B.2 Z CMa, HD 58647, MWC 297, and HD 53367
These four objects are quite massive, all belonging to the B spectral type which may be young massive objects instead of Herbig stars. Z CMa is a binary (Koresko et al. 1991) where the primary is a Herbig Be star (Whitney et al. 1993; van den Ancker et al. 2004) and the secondary is a FU Orionis variable (Hartmann et al. 1989). An asymmetric outflow is found in this system (Garcia et al. 1999; Baines et al. 2006). In HD 58647 outflows have been found as well (Kurosawa et al. 2016). MWC 297 has a large mass of M⊙ (Vioque et al. 2018). While Vioque et al. (2018) estimate its age to be 0.04 Myr, MWC 297 has been characterized as being a main sequence star (Drew et al. 1997) surrounded by an evolved disk (Manoj et al. 2007). Lastly, HD 53367 is a binary star consisting of a massive (M⊙) main sequence B0e star and a PMS secondary (M⊙) (Pogodin et al. 2006). While classified as a Herbig star, even one of the original classified by Herbig (1960), it could also instead be a classical Be star (Pogodin et al. 2006).
B.3 R CrA
R CrA is still embedded in a dust envelope (Kraus et al. 2009) and is likely in an early evolution phase (Malfait et al. 1998). It also has outflows and jets (Rigliaco et al. 2019). This case is on the boundary of being a Herbig star, because it may be in an earlier stage than Herbig stars, and therefore we keep it in the sample.
Appendix C ALMA archival data
In this work, a total of 36 ALMA archival datasets have been used. Their continuum observing frequencies and corresponding Project IDs can be found in Table 6.
| Name | (GHz) | Beam (′′) | RMS (mJy beam-1) | Project ID |
| AB Aur | 343.51 | 0.32 0.20 | 0.40 | 2015.1.00889.S |
| AK Sco | 233.00 | 0.09 0.06 | 0.17 | 2016.1.00204.S |
| BF Ori | 233.01 | 1.49 1.03 | 0.34 | 2019.1.01813.S |
| CQ Tau | 232.37 | 0.07 0.05 | 0.05 | 2017.1.01404.S |
| HD 100453 | 234.19 | 0.03 0.02 | 0.02 | 2017.1.01678.S |
| HD 100546 | 233.00 | 0.02 0.02 | 0.02 | 2018.1.01309.S |
| HD 104237 | 219.56 | 1.31 0.76 | 2.20 | 2015.1.01600.S |
| HD 135344B | 340.98 | 0.37 0.29 | 2.09 | 2012.1.00870.S |
| HD 139614 | 232.01 | 0.68 0.48 | 3.55 | 2015.1.01600.S |
| HD 141569 | 229.00 | 1.39 1.05 | 0.08 | 2017.1.01545.S |
| HD 142527 | 231.90 | 0.27 0.24 | 1.55 | 2015.1.01353.S |
| HD 142666 | 232.60 | 0.03 0.02 | 0.03 | 2016.1.00484.L |
| HD 163296 | 232.60 | 0.05 0.03 | 0.06 | 2016.1.00484.L |
| HD 169142 | 232.50 | 0.22 0.15 | 0.27 | 2015.1.01301.S |
| HD 176386 | 224.14 | 0.43 0.32 | 0.20 | 2015.1.01058.S |
| HD 245185 | 248.00 | 0.31 0.30 | 0.24 | 2017.1.00466.S |
| HD 290764 | 344.30 | 0.07 0.05 | 0.15 | 2017.1.01607.S |
| HD 31648 | 218.00 | 0.15 0.09 | 0.33 | 2016.1.01164.S |
| HD 34282 | 234.19 | 0.25 0.22 | 0.29 | 2015.1.00192.S |
| HD 36112 | 232.01 | 0.47 0.33 | 0.55 | 2015.1.01600.S |
| HD 37258 | 233.01 | 1.84 1.24 | 0.27 | 2019.1.01813.S |
| HD 53367 | 225.51 | 0.48 0.39 | 0.14 | 2018.1.00814.S |
| HD 58647 | 225.51 | 0.47 0.39 | 0.14 | 2018.1.00814.S |
| HD 9672 | 232.50 | 1.69 1.16 | 0.09 | 2018.1.01222.S |
| HD 97048 | 233.70 | 0.38 0.18 | 0.91 | 2015.1.00192.S |
| HR 5999 | 232.01 | 0.53 0.51 | 0.67 | 2015.1.01600.S |
| KK Oph | 232.01 | 0.58 0.51 | 0.66 | 2015.1.01600.S |
| MWC 297 | 217.51 | 0.42 0.31 | 3.81 | 2018.1.00814.S |
| R CrA | 231.32 | 7.48 4.68 | 11.3 | 2018.A.00056.S |
| TY CrA | 224.14 | 0.43 0.32 | 0.20 | 2015.1.01058.S |
| V1787 Ori | 233.02 | 1.48 0.99 | 0.53 | 2019.1.01813.S |
| V599 Ori | 233.02 | 1.42 1.00 | 1.54 | 2019.1.01813.S |
| V718 Sco | 232.01 | 0.87 0.72 | 0.92 | 2015.1.01600.S |
| V892 Tau | 242.68 | 0.23 0.16 | 1.28 | 2013.1.00498.S |
| VV Ser | 239.35 | 1.43 0.97 | 1.03 | 2019.1.00218.S |
| Z CMa | 224.26 | 0.20 0.17 | 0.22 | 2016.1.00110.S |
Appendix D Are there selection effects in our sample?
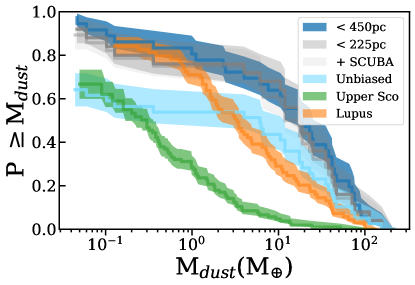
| Name | R.A. (h:m:s) | Decl. (deg:m:s) | Sp.Tp. | Ref. | (mJy) | () |
| HD 35187α | 05:24:01.2 | +24:57:37 | A2 | 1 | 100.2 | |
| HD 41511α | 06:04:59.1 | -16:29:04 | A3 | 2 | ¡0.91 | ¡0.044 |
| HD 150193 | 16:40:17.9 | -23:53:45 | B9.5 | 3 | 104.9 |
Notes: All distances are obtained from Vioque et al. (2018). The luminosities, stellar masses, and ages were obtained from Wichittanakom et al. (2020) except the objects marked with an of which these parameters were obtained from Vioque et al. (2018). Spectral type references: (1) Manoj et al. (2006), (2) Jaschek et al. (1991), (3) Levenhagen & Leister (2006).
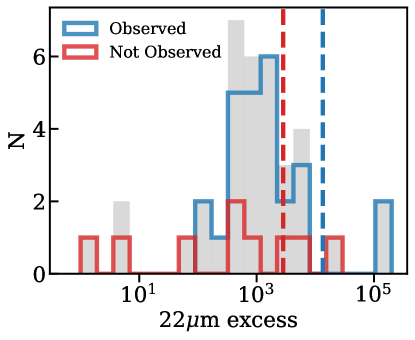
Section 4 found that Herbigs observed with ALMA are both larger and more massive than samples of disks in Lupus and Upper Sco. Are these Herbig disks in general indeed larger and more massive, or does the sample of Herbig disks observed with ALMA (i.e., the sample used in this work) mainly consist of more massive and larger disks?
| Name | (GHz) | Instrument | RMS (mJy beam-1) | Proposal ID |
| HD 35187 | 347.79 | SCUBA | 17.37 | m97bc36 |
| HD 41511 | 352.71 | SCUBA-2 | 0.36 | M17BL002 |
| HD 150193 | 347.38 | SCUBA | 16.23 | m01bi09 |
Observations of individual objects in our sample were likely spurred by their brightness or the presence of structure in the disk either seen in scattered light or (sub)millimeter observations (e.g., Fukagawa et al. 2004, 2006; Doering et al. 2007; Tang et al. 2012; Quanz et al. 2013). While this may have biased our ALMA sample, a sufficiently large fraction of all Herbig disks (at least out to 225 pc) have ALMA archival data, even if we consider the unobserved disks to be small and too low in mass (which future ALMA observations may determine). The sample up to 225 pc, which excludes Orion, is 64% covered with ALMA (25/39 objects) compared to 38% (36/96) for the 450 pc distance sample. Figure 12 shows that the cumulative distribution does not significantly change when only using the more complete nearby sample (i.e., all Herbig disks observed with ALMA within 225 pc) compared to the full sample (i.e., all Herbig disks observed with ALMA within 450 pc). Both the most and least massive disks are within 225 pc and hence the overall cumulative distribution does not change significantly. Therefore, the general trend that the dust masses are larger compared to those of T Tauri stars still holds. Of the 14 objects within 225 pc that have not been observed with ALMA, 3 have been observed with JCMT/SCUBA. For these three objects, SCUBA and SCUBA-2 data products222http://www.cadc-ccda.hia-iha.nrc-cnrc.gc.ca/en/jcmt/ were used to determine the dust masses; see Table 7. Their continuum observing frequencies and corresponding Project IDs can be found in Table 8. These three datasets increase the percentage of observed disks to within 225 pc. Because of the large beam of JCMT/SCUBA (), the dust radii were not determined. HD 41511 is observed with SCUBA-2 and is not detected, so only an upper limit is given. The found dust masses are low: HD 35187, HD 41511, and HD 150193 are M⊕, M and M⊕ respectively. These three extra masses do not change the overall distribution much, although they provide anecdotal evidence that unobserved disks may indeed be smaller and less massive, see Fig. 12.
Assuming that all unobserved disks (so the left over 29%) have an upper limit on the detected mass as low as the lowest upper limit in the sample, we can see what the least favorable distribution would be if the unobserved disks turned out to have low masses. This ‘unbiased’ distribution is shown in Fig. 12 in light blue. It shows that the tail end of the cumulative dust mass distribution would still lie above the Lupus distribution and far above the Upper Sco distribution which has a similar age to the Herbig disks. However, this is most likely a worst-case scenario, because in terms of 22 m emission tracing the warm inner disk, these objects do not stand out with respect to the detected sources. The m excess of the disks within 225 pc with and without ALMA data are shown in Fig. 13. These IR excesses were obtained by Vioque et al. (2018) from the Wide-field Infrared Survey Explorer (WISE) which is an infrared all-sky survey and therefore contains observations of most of the Herbig disks that were not observed with ALMA. A two-sided t-test using the SciPy package (Virtanen et al. 2020) shows that the null hypothesis of both distributions being the same cannot be rejected (-value=0.425). While the m excess originates from inner parts of the disk, and no clear connection is present between this excess and the amount of dust, it does indicate that a disk is present around the star. We therefore do not expect the distribution to change significantly when including all Herbig disks within 450 pc as listed by Vioque et al. (2018). We therefore conclude that the derived mass distribution of Herbig disks is unlikely to deviate significantly from the real one, and that the thus-far unobserved targets are likely to retain at least some disk material. Future observations will need to establish this firmly.