CaCu3Ru4O12: a high Kondo-temperature transition metal oxide
Abstract
We present a comprehensive study of CaCu3Ru4O12 using bulk sensitive hard and soft x-ray spectroscopy combined with local-density approximation (LDA) + dynamical mean-field theory (DMFT) calculations. Correlation effects on both the Cu and Ru ions can be observed. From the Cu core level spectra we deduce the presence of magnetic Cu2+ ions hybridized with a reservoir of itinerant electrons. The strong photon energy dependence of the valence band allows us to disentangle the Ru, Cu, and O contributions and thus to optimize the DMFT calculations. The calculated spin and charge susceptibilities show that the transition metal oxide CaCu3Ru4O12 must be classified as a Kondo system and that the Kondo temperature is in the range of 500-1000 K.
Transition metal oxides show a wide variety of spectacular physical properties such as superconductivity, metal-insulator and spin-state transitions, unusually large magneto-resistance, orbital ordering phenomena, and multiferroicity Cava (2000); Khomskii (2014); Keimer et al. (2015). Remarkably, heavy fermion or Kondo behavior is hardly encountered in oxides. While quite common in the rare-earth and actinide intermetallics Stewart (1984); Coleman (2006); Pfleiderer (2009); Wirth and Steglich (2016), one may find perhaps only in the oxide LiV2O4 Kondo et al. (1997); Urano et al. (2000); Shimoyamada et al. (2006) indications for heavy fermion physics.
The discovery of the transition metal oxide CaCu3Ru4O12 (CCRO) showing Kondo-like properties therefore created quite an excitement Kobayashi et al. (2004); Krimmel et al. (2008, 2009); Kao et al. (2017). The crystal structure of this A-site ordered perovskite is shown in the inset of Fig. 1. However, the Kondo interpretation has also met fierce reservations. It has been argued that the specific heat coefficient does not deviate much from the band structure value, suggesting a minor role of the electronic correlations Xiang et al. (2007). Other interpretations of the mass enhancement have been put forward Tanaka et al. (2009a, b). Electron spectroscopy studies have also not converged on the position or even the presence of the putative Kondo peak Sudayama et al. (2009); Hollmann et al. (2013); Liu et al. (2020).
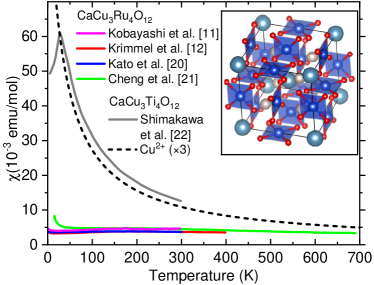
Here we address the CCRO problem from a different perspective. Figure 1 shows the magnetic susceptibility of CCRO together with that of CaCu3Ti4O12 (CCTO), as reproduced from Refs. Kobayashi et al. (2004); Krimmel et al. (2008); Kato et al. (2009); Cheng et al. (2013) and Ref. Shimakawa (2008), respectively. One can observe that CCTO follows, far above its 25 K Néel temperature, almost a text-book Curie-Weiss law that can be understood in terms of paramagnetic Cu2+ ions. By contrast, one can also see that CCRO shows a completely different behavior with a magnetic susceptibility that is an order of magnitude smaller. There are also no indications at all for magnetic order. If one believes that the system is non-magnetic and that Kondo physics does not take place in CCRO, then the Cu ions in CCRO have to be monovalent with the non-magnetic full-shell configuration or trivalent, which can be a nonmagnetic band insulator like NaCuO2.
We show here that the Cu ions are definitely divalent and thus have spin degree of freedom. We have carried out a detailed photoelectron spectroscopy study using a wide range of photon energies in order to establish the presence of correlation effects on both the Cu and Ru ions as well as to disentangle the Ru, Cu, and O contributions to the valence band. This allowed us to tune the double counting corrections in the LDA+DMFT calculations accordingly, making these calculations predictive for the low energy physics. We then were able to determine how the Cu2+ magnetic moments can be screened. In particular, we will show that, in going from high to low temperatures, this screening takes place already at 500-1000 K, and that we thus must classify CCRO as a Kondo system with a very high Kondo temperature.
Hard x-ray photoemission (HAXPES) measurements were carried out at the Max-Planck-NSRRC HAXPES end-station Weinen et al. (2015) at the Taiwan undulator beamline BL12XU of SPring-8 in Japan. The photon energy was set to keV and the overall energy resolution was 270 meV as determined from the Fermi cutoff of a gold reference sample. Soft x-ray (resonant) photoelectron (PES) and absorption (XAS) spectroscopy experiments were performed at the NSRRC-MPI TPS 45A Submicron Soft x-ray Spectroscopy beamline at the Taiwan Photon Source (TPS) in Taiwan. The overall energy resolution when using 1.2 keV, 931 eV, and 440 eV photons was 150 meV, 125 meV, and 60 meV, respectively. Photoemission measurements in the vicinity of the Ru Cooper minimum, i.e. at photon energies of eV, eV, and eV, were performed at the PLS-II 4A1 micro-ARPES beamline of the Pohang Light Source (PLS) in Korea. The overall energy resolution was 55 meV. Polycrystalline samples of CCRO were synthesized by solid-state reactions Ebbinghaus et al. (2002). Clean sample surfaces were obtained by cleaving sintered samples in situ in ultra-high vacuum preparation chambers with pressures in the low mbar range. The measurements at SPring-8 and TPS were carried out at K, and the measurements at PLS at K. We have used three different batches of CCRO samples for our spectroscopic measurements, all giving the same results, providing confidence in the reliability of the data, see Appendix A.
Our calculations employ the LDA+DMFT scheme Metzner and Vollhardt (1989); Georges et al. (1996); Kotliar et al. (2006). We start with density functional calculations for the experimental crystal structure Krimmel et al. (2008), see Fig. 1, using the Wien2k code Blaha et al. and construct the multi-band Hubbard model on the basis spanned by the Cu 3, Ru 4, and O 2 Wannier functions obtained with the wannier90 package Kuneš et al. (2010); Mostofi et al. (2014). The on-site Coulomb interactions on the Cu and Ru sites are approximated with the density-density form with parameters (, )=(8.5 eV, 0.98 eV) for Cu 3 electrons and (3.1 eV, 0.7 eV) for Ru 4 electrons, which are typical values for Cu and Ru systems Petukhov et al. (2003); Hollmann et al. (2013); Gorelov et al. (2010); Pchelkina et al. (2007). The continuous-time quantum Monte Carlo (CT-QMC) method with the hybridization expansion Werner et al. (2006); Boehnke et al. (2011); Hafermann et al. (2012) was used to solve the auxiliary Anderson impurity model (AIM). The double-counting corrections arising in LDA+X methods Karolak et al. (2010); Kotliar et al. (2006), which fix the charge transfer energies on the Cu and Ru sites, were treated as adjustable parameters and their values fixed by comparison to the present valence band and core-level photoemission data as well as previous angle-resolved PES (ARPES) data. The valence spectra were obtained by analytic continuation of self-energy using the maximum entropy method Wang et al. (2009); Jarrell and Gubernatis (1996). The Cu 2 and Ru core-level XPS were calculated using the method of Refs. Hariki et al., 2017a, 2020; Ghiasi et al., 2019.

We have carried out XAS and valence band resonant PES measurements in the vicinity of the Cu edge, see Fig. 2. The peak positions and line shape of the spectra are characteristic for divalent Cu Tjeng et al. (1991, 1992); Hollmann et al. (2013); Eskes et al. (1990). We can exclude that the Cu in CCRO is monovalent or trivalent since the spectral features of Cu1+/Cu3+ oxides are positioned at quite different energies Tjeng et al. (1992); Hollmann et al. (2013); Chin et al. (2021). We thus can conclude that the Cu ions in CCRO possess a spin degree of freedom and that some form of screening must take place as to make their magnetic susceptibility to deviate dramatically from the Curie-Weiss law.

Figure 3 shows the Cu core level HAXPES spectrum of CCRO together with that of Li2CuO2 as reproduced from Ref. Böske et al. (1998). Here we took Li2CuO2 as a reference system which contains CuO4 plaquettes that are weakly coupled Böske et al. (1998) and thus can serve for a comparison with CCRO which also contains rather isolated CuO4 plaquettes, see Fig. 1. The spectra share the gross features: the main peak (B) at around 932-933 eV binding energy and the satellite (C) at 942 eV for the Cu component. However, the fine structure differs considerably: the main peak of CCRO consists of two peaks (A and B) Tran et al. (2006); Sudayama et al. (2009) unlike the single peak (B) of Li2CuO2.
The Cu core level spectrum of Li2CuO2 is typical for a Cu2+ oxide Ghijsen et al. (1988). Thanks to the weak coupling between the CuO4 plaquettes, it can be explained accurately with a full multiplet single CuO4-cluster calculation Tanaka and Jo (1994); par , as shown in Fig. 3b. In contrast, the two-peak structure (A and B) of the CCRO main peak cannot be captured by the cluster model. This is indicative of a screening process Taguchi et al. (2005); Panaccione et al. (2008); Tran et al. (2006); Sudayama et al. (2009) which is present in CCRO but absent in Li2CuO2. Since the CuO4 plaquettes in CCRO are quite isolated from each other, a non-local screening mechanism due to inter-Cu-cluster hopping is not expected to play an important role. We rather relate the screening process to the metallic state of CCRO. The LDA+DMFT calculations shown in Fig. 3d, reproduce the fine structure of the main peak very well. We thus indeed can infer that CCRO contains correlated magnetic Cu2+ ions, which experience screening by conduction electrons. How strong or complete the screening is will be discussed below.
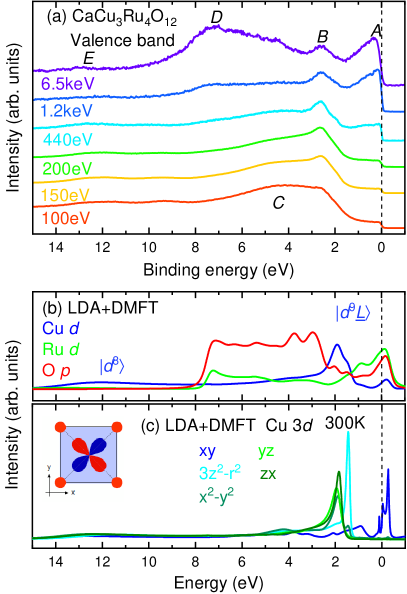
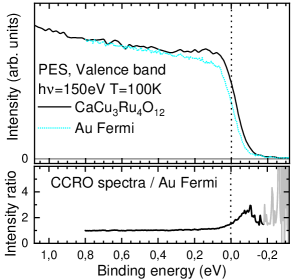
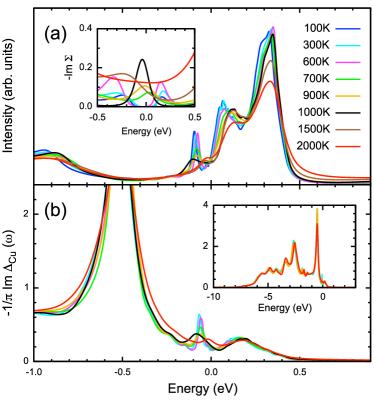
Figure 4a shows the experimental valence band spectra of CCRO in a broad energy range measured at various photon energies. Our motivation here is to make use of the different photon-energy dependence of the photoionization cross sections Trzhaskovskaya et al. (2001, 2006); Yeh and Lindau (1985) to distinguish the Ru , Cu , and O contributions to the spectra. The photon energy of 6.5 keV in HAXPES is much higher than the previously used photon energies of 1486.6 eV and 920 eV Tran et al. (2006); Sudayama et al. (2009); Hollmann et al. (2013) and makes Ru have the largest cross section relative to Cu and O . The low photon energies of 200, 150, and 100 eV are close to the Cooper minimum of the Ru cross section Yeh and Lindau (1985), so that with these photon energies the Ru signal gets maximally suppressed, enabling us to observe better the Cu contribution. The ratio between the O and Cu cross sections also becomes continuously larger with lowering the photon energy Yeh and Lindau (1985). See also Appendix B displaying the photon energy dependence of the cross sections in more detail.
In the set of valence band spectra, Fig. 4a, we can identify features labeled A, B, C, D, and E. Features A and D are very strong at 6.5 keV and diminish almost completely between 100-200 eV. This strongly suggests that A and D are derived from the Ru orbitals. Features B and E are visible throughout the set, while the intensity of C is enhanced at 100 eV, the lowest photon energy of the set. This observation indicates that the features B and E are related to the Cu while C is likely of O origin. We point out that the positions of these five features do not change with the photon energy and coincide with the previously reported soft x-ray studies Tran et al. (2006); Sudayama et al. (2009); Hollmann et al. (2013).
The LDA+DMFT results are presented in Fig. 4b. They corroborate the above assignment. The calculated Ru spectrum matches the experimental features A and D, while the theoretical Cu spectrum explains well the features B and E, the former being the Cu and the latter the Cu final state Tjeng et al. (1991, 1992); Hollmann et al. (2013); Eskes et al. (1990). The feature C is captured by the theoretical O spectra. The calculations reveal that the spectrum around the Fermi level is dominated by hybridized Ru and O bands. In Fig. 4c, the Cu spectrum is decomposed into , 3-, -, , and components. As shown in the inset, the Cu orbital points to the surrounding four oxygen sites. Therefore, the Cu orbital hybridize with the Ru orbitals (via the O orbitals) most strongly among the five Cu orbitals. The Cu spectral density near the Fermi level is quite low compared to the Ru and O one, see Fig. 4b, and most of its weight is above the Fermi level.
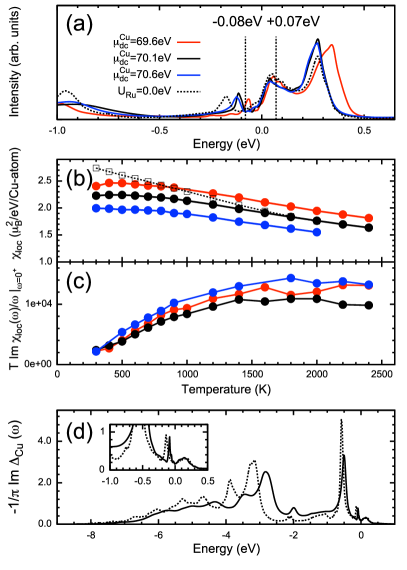
In order to experimentally detect the Cu contribution around the Fermi level, we focus on the larger peak at positive energies and the spectra taken at 150 eV which is almost the photon energy to minimize the Ru signal. The top panel of Fig. 5 displays a close-up of the spectra along with the corresponding gold reference spectrum taken under the same conditions. In order to look for the possible presence of states above the Fermi level, we divide the CCRO spectrum by the corresponding gold spectrum. The results are shown in the bottom panel of Fig. 5. We can identify clearly the presence of a sharp peak at about 0.07-0.08 eV above the Fermi level, very consistent with the results of the LDA+DMFT calculations.
Zooming to the vicinity of the Fermi level 111In order to reach lower temperatures we have used a model without the empty Ru states here. The equivalence of Cu spectra in the models with and without Ru states is established in Appendix D., the calculated Cu spectrum in Fig. 6a reveals sharp temperature-dependent peaks. To put the present results in the context of Anderson impurity and periodic Anderson models we show the Cu hybridization densities in Fig. 6b. The global view in the inset shows a strongly asymmetric situation with the Fermi energy located in the tail of the hybridization density. The hybridization density exhibits only a minor temperature dependence. A sharp hybridization peak below the Fermi level, responsible for the peak around eV in the Cu spectra also observed with angle-resolved PES (ARPES) around the point in the Brillouin zone Liu et al. (2020), is an exception. This explains the different temperature behavior of the peaks in Fig. 6a. Damping of the peaks above the Fermi level with increasing temperature is not accompanied by changes of the hybridization function and thus reflects the Anderson/Kondo impurity physics controlled by the Kondo temperature. Damping of the eV peak arises from temperature-induced changes of the hybridization function, i.e., involves the feedback from the Cu ions (the temperature dependence of Ru contribution is negligible in the studied range). It is therefore an Anderson/Kondo lattice effect related to somewhat lower coherence temperature Burdin et al. (2000); Pruschke et al. (2000). The inset of Fig. 6a shows the inverse quasi-particle lifetime. The region of long lifetime (dip in the inverse lifetime) between - eV and eV around the Fermi level found at lower temperatures, marks limits of the Fermi liquid theory. Between 600–700 K the scattering rate around Fermi level increases forming a peak in . Eventually (1500–2000 K) the scattering rate grows quasi-uniformly in entire low-energy regime (-0.5–0.5 eV) with increasing temperature.
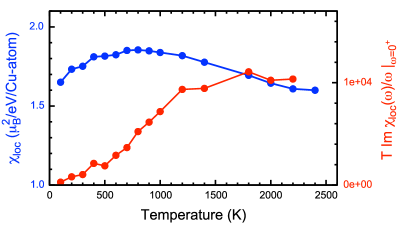
Next, we discuss the local spin susceptibility at the Cu site. The top panel of Fig. 7 displays the obtained with LDA+DMFT. It exhibits the Curie behavior at high temperatures, and turns into a broad maximum at lower temperatures which is characteristic for Kondo screening. The deviation from the Curie behavior starts around 1000 K, suggesting a relatively high Kondo scale . The calculated reproduces quite well the experimental susceptibility Kobayashi et al. (2004) although an exact match can not be expected between the local and the uniform spin susceptibility, due to the contribution of the itinerant Ru 4 - O states. The dynamical local susceptibility is, nevertheless, directly related to the spin-lattice relaxation rate measured in nuclear magnetic resonance (NMR) experiments Kato et al. (2009); Krimmel et al. (2008)
The calculated temperature dependence of is shown in Fig. 7. It shows an approximately linear increase at low-temperatures, which flattens into a constant behavior at around 1000 K. It is well-known that the former is characteristic of a Fermi liquid, while the latter of a fluctuating local moment. For CCRO, the NMR experiment was performed up to 700 K so far, where the absence of the constant behavior was brought up as an evidence against the Kondo physics in this compound. Our result however suggests that CCRO manifests its local moment signature in NMR above the reported temperature. The corresponding spin–spin correlation functions , see Appendix C, reflect the presence of an instantaneous Cu 3 moment at all temperatures, which rapidly disappears on a short-time scale at temperatures below . In contrast, the charge correlations are temperature independent. Rapid charge fluctuations present at all temperatures rather reflect the Cu-O bonding, not the hybridization with the states in the vicinity of the Fermi level.
The presence of magnetic Cu ions immersed in an itinerant band leads indeed to the emergence of Kondo physics, as demonstrated by our LDA+DMFT results. An important aspect for the long standing discussions about CCRO is our finding that the Kondo temperature is quite high, namely at around 700 K (between 500 and 1000 K). We would like to note that the parameters and double-counting corrections in our LDA+DMFT calculations have been tuned as to reproduce the available experimental (HAX)PES and the recent ARPES Liu et al. (2020) spectra, details can be found in Appendix D. In this respect it is worth mentioning that we have also included on-site Coulomb interactions at the Ru site. This was necessary to explain the presence of a satellite structure in the Ru core level PES spectrum, see Appendix D. It turned out that the inclusion of in the Ru shell has also a substantial influence on the low energy properties of CCRO. We have calculated the local spin susceptibility at the Cu site with eV and eV, see Appendix D, indicating that correlations on the Ru site influence the screening process on the Cu site. This can be traced back to the influence of the Ru on the shape of the Ru - O band. In Appendix D, we show the Cu spectral intensities calculated with eV on the Ru 4 shell, where the agreement to the available PES data is surrendered.
The high Kondo temperature we have found from our LDA+DMFT calculations implies that the contribution of the Kondo screening process to the low temperature specific heat is modest, thus explaining why band structure calculations can seemingly reproduce the experimentally observed value of the specific heat rather well since the main contribution comes from the uncorrelated Ru-O derived bands. The high Kondo temperature also implies that one needs to go to very high temperatures to see the appearance of local Cu moments, as demonstrated in Fig. 7. We can thus infer that upon going from high to low temperatures the Kondo screening process is practically completed already at 300 K, and that lowering the temperature further would not produce significant changes in the electronic and magnetic properties. It is understandable that there has been a controversy concerning Kondo physics in CaCu3Ru4O12 since its signatures in low temperature measurements are weak.
Nevertheless, Kondo physics is present, as evidenced by the low-temperature disappearance of the Cu2+ magnetic susceptibility for which we were able to provide a quantitatively explanation using our LDA+DMFT calculations that include fine tuning of the parameters from a detailed comparison to bulk sensitive photoemission data. Our findings indicate that the material class CaCu3M4O12 indeed provides a unique opportunity to explore Kondo phenomena in transition metal compounds, where one may achieve lower Kondo temperatures by suitably varying the M constituent.
The authors thank A. Sotnikov and J. Fernández Afonso, Mathias Winder for fruitful discussions. A.H. and J.K. are supported by the European Research Council (ERC) under the European Union’s Horizon 2020 research and innovation programme (grant agreement No. 646807-EXMAG). A.H. was supported by JSPS KAKENHI Grant Number 21K13884. The computations were performed at the Vienna Scientific Cluster (VSC). The research in Dresden is supported by the Deutsche Forschungsgemeinschaft (DFG) through Grant No. 320571839 and SFB 1143 (project-id 247310070). The experiments in Taiwan and Korea were facilitated by the Max Planck-POSTECH-Hsinchu Center for Complex Phase Materials. S.S. and Y.S. are supported by JSPS KAKENHI Grants-in-Aid for Scientific Research (No. 19H05823 and No. 20H00397) and by a JSPS Core-to-Core Program (A) Advanced Research Networks.
Appendix A Sample consistency
In order to ensure that the experimental spectra and their features are intrinsic to the material, we have utilized three different batches of samples synthesized by three different groups: A.C. Komarek’s group from Max Planck Institute for Chemical Physics of Solids, Dresden, A. Günther from the University of Augsburg, and Y. Shimakawa’s group from the Kyoto University. Figure 8 shows the comparison of the valence band PES and XAS spectra taken from these three batches of samples.
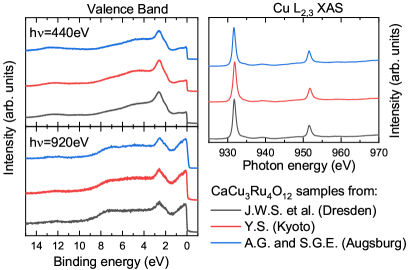
The results match perfectly, and thus confirm that the data presented in this paper are not sample specific or due to extrinsic contributions
Appendix B Photoionization cross sections
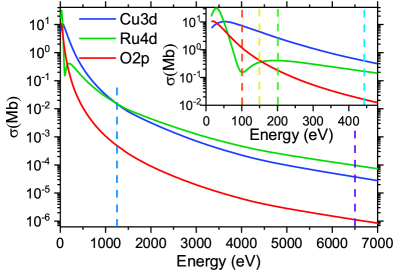
For the valence band of CaCu3Ru4O12 the most relevant contributions are Cu , Ru , and O . Figure 9 shows the photon energy dependence of the photoionization cross sections as interpolated from the data tabulated in Refs. Yeh and Lindau (1985); Trzhaskovskaya et al. (2001, 2006). The vertical lines highlight the photon energies used in this study. At high photon energies (HAXPES, 6.5 keV), the Ru provides a larger signal than the Cu and the O . Going to lower photon energies, the Cu becomes gradually stronger, and with a crossover at keV, it becomes the dominant contributor. At around eV, there is a minimum in the Ru cross section, also known as the Cooper minimum, which provides the ideal condition for studying the Cu contributions. At this photon energy, the Cu signal is enhanced by a factor 70 with respect to the Ru . For lower photon energies, the Ru quickly gains strength and becomes again the dominant contributor, making these low photon energies less useful when searching for the Cu signal close to the Fermi level. As for the O contribution, we observe that it is highly suppressed for high energies, but becomes only competitive with the Cu for energies below 50 eV.
Appendix C LDA+DMFT computational method
Below we describe the LDA+DMFT scheme Metzner and Vollhardt (1989); Georges et al. (1996); Kotliar et al. (2006) employed to analyze the experimental data. We start with density functional calculations for the experimental crystal structure of CCRO Krimmel et al. (2008) using the Wien2k code Blaha et al. . Then we construct the multi-band Hubbard model on the basis spanned by the Cu 3, Ru 4, and O 2 Wannier functions from the LDA bands using wien2wannier and wannier90 packages Kuneš et al. (2010); Mostofi et al. (2014). The multi-band Hubbard model is augmented with the local electron-electron interaction within the Cu 3 and Ru 4 shells giving the Hamiltonian,
Here, is an operator-valued vector whose elements are Fourier transforms of , that annihilate the Cu 3 electron in the orbital in the -th unit cell. Similarly and are those for Ru 4 and O 2 electrons. The on-site Coulomb interaction and on Cu and Ru sites is approximated with the density-density form with parameters (, )=(8.5 eV, 0.98 eV) for Cu 3 electrons and (3.1 eV, 0.7 eV) for Ru 4 electrons, which are typical values for Cu and Ru systems Petukhov et al. (2003); Hollmann et al. (2013); Gorelov et al. (2010); Pchelkina et al. (2007). The double-counting terms , , which correct for the – interaction present in the LDA step Karolak et al. (2010); Kotliar et al. (2006), renormalize the - splitting and thus the charge-transfer energy. We have fixed the double-counting values to eV and eV ( eV for the model without Ru states) by comparison to the photoemission spectroscopy data discussed in Appendix D. The CT-QMC method with the hybridization expansion Werner et al. (2006); Boehnke et al. (2011); Hafermann et al. (2012); Hariki et al. (2015) was used to solve the auxiliary Anderson impurity model (AIM) in the DMFT self-consistent calculation. The valence spectra were obtained by analytic continuation of self-energy using the maximum entropy method Wang et al. (2009); Jarrell and Gubernatis (1996). The hybridization function for the Cu 3 orbital () is given by Georges et al. (1996); Kotliar et al. (2006)
where and are the local Green’s function and the one-body part of the on-site Hamiltonian at the Cu site, respectively. does not depend on the spin, and small off-diagonal elements between different orbitals are neglected. The Cu 2 core-level spectrum was calculated using the method of Refs. Hariki et al., 2017a, 2020, where the AIM with the DMFT hybridization density is extended to include the Cu 2 core orbitals Hariki et al. (2017a); Ghiasi et al. (2019). The configuration interaction scheme with 25 bath states representing the DMFT hybridization density is employed to evaluate the 2 spectra.
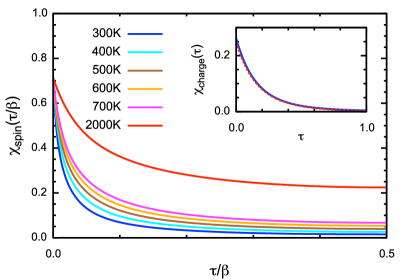
Figure 10 shows the local spin and charge correlation functions at the Cu site. is given as Křápek et al. (2012); Hariki et al. (2017b) and is given by Ylvisaker et al. (2009), where with the Cu -occupation number operator . These quantities are calculated by the impurity Anderson model with the DMFT hybridization using the CT-QMC method. The local susceptibility is obtained by integrating the at temperature with respect to the imaginary time ,
A rigid instantaneous Cu 3 spin moment is present for all temperatures, as imprinted in the temperature-independent value of , see Fig. 10. The spin moment survives on a long-time scale at high temperatures (see e.g. at 2000 K), giving the Curie behavior in shown in the main text, while it disappears on short timescales at low temperatures due to the Kondo screening by the Ru 4 - O bands, giving the Pauli-like behavior in . In contrast to the temperature dependence in , the local charge correlation function is substantially suppressed at all temperatures, see the inset of Fig. 10, indicating the frozen charge fluctuation of the Cu 3 electrons in CCRO, as expected in the Kondo regime. Thus the calculated spin and charge correlation functions support the Kondo behavior of Cu 3 electrons in the studied material. We point out that the value is reduced to 0.7 from 1.0 which corresponds to the Kondo limit. The reduction comes from the mixture of the configuration by the Cu-O hybridization, where represents an O 2 hole, but it does not show a temperature dependence. This behavior characterizes the effect of charge-transfer in the Cu-O subsystem. The energy scale of the Kondo physics therefore builds on the ligand-metal hybridization in addition to the Coulomb interaction at the Cu site.
Appendix D Parameters in the LDA+DMFT simulation
In the calculations we used two versions of the model described in Appendix C. First model contains all Ru states, while the second contains only the Ru states present at and below the Fermi level. The first model, which we consider as the primary one, is needed to capture the full spectrum, in particular the feature D of Fig. 4a. The second model is used for numerical convenience as it allows us to perform LDA+DMFT calculations at lower temperature (below 300 K). It is employed to compute the low-energy Cu spectral intensities (Fig. 6) and response functions (Fig. 7) including temperatures below 300 K. Its results are validated by comparison to the first model at the higher temperatures.
The parameters and of our theory (Appendix C) are fixed to reproduce (i) positions of the peaks A–E in the valence valence photoemission spectra of Fig. 4, (ii) positions of the low-energy peak at 0.07–0.08 eV above, Fig. 5, and around 0.08 eV below Liu et al. (2020) the Fermi energy, (iii) the splitting of the Cu 2 XPS main line, see Fig. 3, and (iv) observation of a shoulder in Ru 3 core-level XPS spectrum, see Fig. 12.
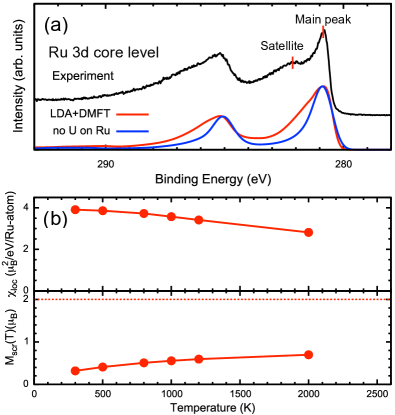
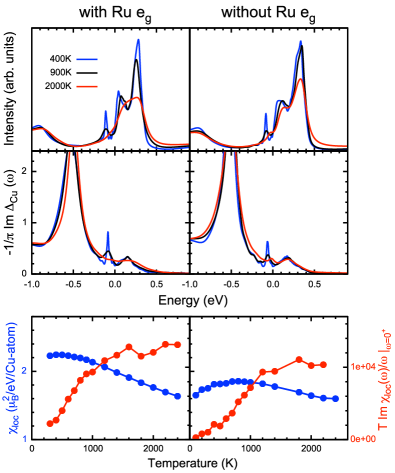
Before analysing and we briefly discuss why we need to include the electron-electron interaction on the Ru site Cao et al. (2008); Kikugawa et al. (2009); Liu et al. (2018). To this end we have compared calculations with eV from previous DFT studies for Ru oxides (with the same formal Ru valence as in CCRO) Gorelov et al. (2010); Pchelkina et al. (2007) and with eV. Fig. 12a shows that finite is needed to yield the shoulder/satellite feature (iv) in the Ru 3 core-level XPS spectra. However, finite affects also the behavior of the Cu state, see dashed lines in Figs. 11ab, through dynamical renormalization (band narrowing) of Ru bands, which modifies the environment (hybridization density) of Cu, see Fig. 11d. With eV we could not find to fulfill (i–iii). We would like to note that the Ru spin response is far from the Curie form despite the presence of correlations in the Ru shell, see Fig. 12b. Correspondingly, also the screened (effective) Ru moment is substantially smaller than the atomic value () for a Ru4+ ion.
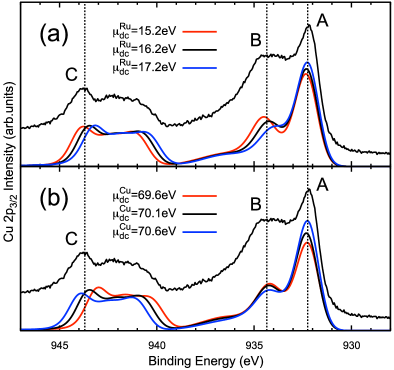
The value of affects the positions of the Cu satellite, feature , and feature B in Fig.4 as well as the low-energy peaks (ii). All of these are well reproduced by its chosen value of eV, see Fig. 11a and Fig. 4. The small screened spin susceptibility due to the Kondo screening is found around the optimal value, see Figs. 11bc. The also affects the Cu–O charge-transfer energy and thus the splitting between the main line and charge-transfer satellite in Cu 2 XPS, see Fig. 13b. On the other hand, the behavior of Cu, including variation of , has minor effect on its hybridization function, except for the peak just below Fermi energy. As a result the splitting of Cu 2 XPS main line (A,B) is independent of , see Fig. 13b.
The same is not true for . Affecting primarily the Ru–O charge-transfer energy, its variation modifies the Cu hybridization function around Fermi level, which has a sizable effect on the splitting in the Cu 2 XPS main line (A,B), see Fig. 13a. We can thus use (iii) together with the Ru features in the global spectrum (i) to establish eV.
Finally, we discuss the relationship of models with and without Ru states. While is the same for the two models, must be different since the models include interaction between all Ru orbitals in one case and between the only in the other one. The matching for the model without Ru states is 13.2 eV. Both models yield the very similar temperature dependencies of the Cu spectral functions as well as hybridization densities and local susceptibilities, as shown in Fig. 14.
References
- Cava (2000) R. J. Cava, J. Am. Ceram. Soc. 83, 5 (2000).
- Khomskii (2014) D. Khomskii, Transition Metal Compounds (Cambridge University Press, 2014).
- Keimer et al. (2015) B. Keimer, S. A. Kivelson, M. R. Norman, S. Uchida, and J. Zaanen, Nature 518, 179 (2015).
- Stewart (1984) G. R. Stewart, Rev. Mod. Phys. 56, 755 (1984).
- Coleman (2006) P. Coleman, arXiv:cond-mat/0612006 (2006).
- Pfleiderer (2009) C. Pfleiderer, Rev. Mod. Phys. 81, 1551 (2009).
- Wirth and Steglich (2016) S. Wirth and F. Steglich, Nat. Rev. Mater. 1, 16051 (2016).
- Kondo et al. (1997) S. Kondo, D. C. Johnston, C. A. Swenson, F. Borsa, A. V. Mahajan, L. L. Miller, T. Gu, A. I. Goldman, M. B. Maple, D. A. Gajewski, E. J. Freeman, N. R. Dilley, R. P. Dickey, J. Merrin, K. Kojima, G. M. Luke, Y. J. Uemura, O. Chmaissem, and J. D. Jorgensen, Phys. Rev. Lett. 78, 3729 (1997).
- Urano et al. (2000) C. Urano, M. Nohara, S. Kondo, F. Sakai, H. Takagi, T. Shiraki, and T. Okubo, Phys. Rev. Lett. 85, 1052 (2000).
- Shimoyamada et al. (2006) A. Shimoyamada, S. Tsuda, K. Ishizaka, T. Kiss, T. Shimojima, T. Togashi, S. Watanabe, C. Q. Zhang, C. T. Chen, Y. Matsushita, H. Ueda, Y. Ueda, and S. Shin, Phys. Rev. Lett. 96, 026403 (2006).
- Kobayashi et al. (2004) W. Kobayashi, I. Terasaki, J. ichi Takeya, I. Tsukada, and Y. Ando, J. Phys. Soc. Jpn. 73, 2373 (2004).
- Krimmel et al. (2008) A. Krimmel, A. Günther, W. Kraetschmer, H. Dekinger, N. Büttgen, A. Loidl, S. G. Ebbinghaus, E.-W. Scheidt, and W. Scherer, Phys. Rev. B 78, 165126 (2008).
- Krimmel et al. (2009) A. Krimmel, A. Günther, W. Kraetschmer, H. Dekinger, N. Büttgen, V. Eyert, A. Loidl, D. V. Sheptyakov, E.-W. Scheidt, and W. Scherer, Phys. Rev. B 80, 121101 (2009).
- Kao et al. (2017) T.-H. Kao, H. Sakurai, S. Yu, H. Kato, N. Tsujii, and H.-D. Yang, Phys. Rev. B 96, 024402 (2017).
- Xiang et al. (2007) H. Xiang, X. Liu, E. Zhao, J. Meng, and Z. Wu, Phys. Rev. B 76, 155103 (2007).
- Tanaka et al. (2009a) S. Tanaka, N. Shimazui, H. Takatsu, S. Yonezawa, and Y. Maeno, J. Phys. Soc. Jpn. 78, 024706 (2009a).
- Tanaka et al. (2009b) S. Tanaka, H. Takatsu, S. Yonezawa, and Y. Maeno, Phys. Rev. B 80, 035113 (2009b).
- Sudayama et al. (2009) T. Sudayama, Y. Wakisaka, K. Takubo, T. Mizokawa, W. Kobayashi, I. Terasaki, S. Tanaka, Y. Maeno, M. Arita, H. Namatame, and M. Taniguchi, Phys. Rev. B 80, 075113 (2009).
- Hollmann et al. (2013) N. Hollmann, Z. Hu, A. Maignan, A. Günther, L.-Y. Jang, A. Tanaka, H.-J. Lin, C. T. Chen, P. Thalmeier, and L. H. Tjeng, Phys. Rev. B 87, 155122 (2013).
- Liu et al. (2020) H. Liu, Y. Cao, Y. Xu, D. J. Gawryluk, E. Pomjakushina, S.-Y. Gao, P. Dudin, M. Shi, L. Yan, Y.-f. Yang, and H. Ding, Phys. Rev. B 102, 035111 (2020).
- Kato et al. (2009) H. Kato, T. Tsuruta, M. Matsumura, T. Nishioka, H. Sakai, Y. Tokunaga, S. Kambe, and R. E. Walstedt, J. Phys. Soc. Jpn. 78, 054707 (2009).
- Cheng et al. (2013) J.-G. Cheng, J.-S. Zhou, Y.-F. Yang, H. D. Zhou, K. Matsubayashi, Y. Uwatoko, A. MacDonald, and J. B. Goodenough, Phys. Rev. Lett. 111, 176403 (2013).
- Shimakawa (2008) Y. Shimakawa, Inorg. Chem. 47, 8562 (2008).
- Momma and Izumi (2011) K. Momma and F. Izumi, J. Appl. Crystallogr. 44, 1272 (2011).
- Weinen et al. (2015) J. Weinen, T. C. Koethe, C. F. Chang, S. Agrestini, D. Kasinathan, Y. Liao, H. Fujiwara, C. Schüßler-Langeheine, F. Strigari, T. Haupricht, G. Panaccione, F. Offi, G. Monaco, S. Huotari, K.-D. Tsuei, and L. H. Tjeng, J. Electron. Spectrosc. Relat. Phenom. 198, 6 (2015).
- Ebbinghaus et al. (2002) S. Ebbinghaus, A. Weidenkaff, and R. Cava, J. Solid State Chem. 167, 126 (2002).
- Metzner and Vollhardt (1989) W. Metzner and D. Vollhardt, Phys. Rev. Lett. 62, 324 (1989).
- Georges et al. (1996) A. Georges, G. Kotliar, W. Krauth, and M. J. Rozenberg, Rev. Mod. Phys. 68, 13 (1996).
- Kotliar et al. (2006) G. Kotliar, S. Y. Savrasov, K. Haule, V. S. Oudovenko, O. Parcollet, and C. A. Marianetti, Rev. Mod. Phys. 78, 865 (2006).
- (30) P. Blaha, K. Schwarz, G. Madsen, D. Kvasnicka, and J. Luitz, WIEN2k, An Augmented Plane Wave + Local Orbitals Program for Calculating Crystal Properties (Karlheinz Schwarz, Techn. Universitat Wien, Austria, 2001), ISBN 3-9501031-1-2.
- Kuneš et al. (2010) J. Kuneš, R. Arita, P. Wissgott, A. Toschi, H. Ikeda, and K. Held, Comput. Phys. Commun. 181, 1888 (2010).
- Mostofi et al. (2014) A. A. Mostofi, J. R. Yates, G. Pizzi, Y.-S. Lee, I. Souza, D. Vanderbilt, and N. Marzari, Comput. Phys. Commun. 185, 2309 (2014).
- Petukhov et al. (2003) A. G. Petukhov, I. I. Mazin, L. Chioncel, and A. I. Lichtenstein, Phys. Rev. B 67, 153106 (2003).
- Gorelov et al. (2010) E. Gorelov, M. Karolak, T. O. Wehling, F. Lechermann, A. I. Lichtenstein, and E. Pavarini, Phys. Rev. Lett. 104, 226401 (2010).
- Pchelkina et al. (2007) Z. V. Pchelkina, I. A. Nekrasov, T. Pruschke, A. Sekiyama, S. Suga, V. I. Anisimov, and D. Vollhardt, Phys. Rev. B 75, 035122 (2007).
- Werner et al. (2006) P. Werner, A. Comanac, L. de’ Medici, M. Troyer, and A. J. Millis, Phys. Rev. Lett. 97, 076405 (2006).
- Boehnke et al. (2011) L. Boehnke, H. Hafermann, M. Ferrero, F. Lechermann, and O. Parcollet, Phys. Rev. B 84, 075145 (2011).
- Hafermann et al. (2012) H. Hafermann, K. R. Patton, and P. Werner, Phys. Rev. B 85, 205106 (2012).
- Karolak et al. (2010) M. Karolak, G. Ulm, T. Wehling, V. Mazurenko, A. Poteryaev, and A. Lichtenstein, J. Electron. Spectrosc. Relat. Phenom. 181, 11 (2010), proceedings of International Workshop on Strong Correlations and Angle-Resolved Photoemission Spectroscopy 2009.
- Wang et al. (2009) X. Wang, E. Gull, L. de’ Medici, M. Capone, and A. J. Millis, Phys. Rev. B 80, 045101 (2009).
- Jarrell and Gubernatis (1996) M. Jarrell and J. Gubernatis, Phys. Rep. 269, 133 (1996).
- Hariki et al. (2017a) A. Hariki, T. Uozumi, and J. Kuneš, Phys. Rev. B 96, 045111 (2017a).
- Hariki et al. (2020) A. Hariki, M. Winder, T. Uozumi, and J. Kuneš, Phys. Rev. B 101, 115130 (2020).
- Ghiasi et al. (2019) M. Ghiasi, A. Hariki, M. Winder, J. Kuneš, A. Regoutz, T.-L. Lee, Y. Hu, J.-P. Rueff, and F. M. F. de Groot, Phys. Rev. B 100, 075146 (2019).
- Tjeng et al. (1991) L. H. Tjeng, C. T. Chen, J. Ghijsen, P. Rudolf, and F. Sette, Phys. Rev. Lett. 67, 501 (1991).
- Tjeng et al. (1992) L. H. Tjeng, C. T. Chen, and S.-W. Cheong, Phys. Rev. B 45, 8205 (1992).
- Eskes et al. (1990) H. Eskes, L. H. Tjeng, and G. A. Sawatzky, Phys. Rev. B 41, 288 (1990).
- Chin et al. (2021) Y.-Y. Chin, Z. Hu, Y. Shimakawa, J. Yang, Y. Long, A. Tanaka, L. H. Tjeng, H.-J. Lin, and C.-T. Chen, Phys. Rev. B 103, 115149 (2021).
- Böske et al. (1998) T. Böske, K. Maiti, O. Knauff, K. Ruck, M. S. Golden, G. Krabbes, J. Fink, T. Osafune, N. Motoyama, H. Eisaki, and S. Uchida, Phys. Rev. B 57, 138 (1998).
- Tran et al. (2006) T. T. Tran, K. Takubo, T. Mizokawa, W. Kobayashi, and I. Terasaki, Phys. Rev. B 73, 193105 (2006).
- Ghijsen et al. (1988) J. Ghijsen, L. H. Tjeng, J. van Elp, H. Eskes, J. Westerink, G. A. Sawatzky, and M. T. Czyzyk, Phys. Rev. B 38, 11322 (1988).
- Tanaka and Jo (1994) A. Tanaka and T. Jo, J. Phys. Soc. Jpn. 63, 2788 (1994).
- (53) The parameters for the CuO4 calculations have been tuned based on the values taken from ref. Eskes et al. (1990): , , , , , . Additionally, we have set the ionic crystal field paramaters to , , . All values are in eV.
- Taguchi et al. (2005) M. Taguchi, A. Chainani, K. Horiba, Y. Takata, M. Yabashi, K. Tamasaku, Y. Nishino, D. Miwa, T. Ishikawa, T. Takeuchi, K. Yamamoto, M. Matsunami, S. Shin, T. Yokoya, E. Ikenaga, K. Kobayashi, T. Mochiku, K. Hirata, J. Hori, K. Ishii, F. Nakamura, and T. Suzuki, Phys. Rev. Lett. 95, 177002 (2005).
- Panaccione et al. (2008) G. Panaccione, F. Offi, P. Torelli, G. Vanko, O. Tjernberg, P. Lacovig, A. Guarino, A. Fondacaro, A. Nigro, M. Sacchi, N. B. Brookes, and G. Monaco, Phys. Rev. B 77, 125133 (2008).
- Trzhaskovskaya et al. (2001) M. Trzhaskovskaya, V. Nefedov, and V. Yarzhemsky, At. Data Nucl. Data Tables 77, 97 (2001).
- Trzhaskovskaya et al. (2006) M. Trzhaskovskaya, V. Nikulin, V. Nefedov, and V. Yarzhemsky, At. Data Nucl. Data Tables 92, 245 (2006).
- Yeh and Lindau (1985) J. J. Yeh and I. Lindau, Atomic Data and Nuclear Data Tables 32, 1 (1985).
- Note (1) In order to reach lower temperatures we have used a model without the empty Ru states here. The equivalence of Cu spectra in the models with and without Ru states is established in Appendix D.
- Burdin et al. (2000) S. Burdin, A. Georges, and D. R. Grempel, Phys. Rev. Lett. 85, 1048 (2000).
- Pruschke et al. (2000) T. Pruschke, R. Bulla, and M. Jarrell, Phys. Rev. B 61, 12799 (2000).
- Hariki et al. (2015) A. Hariki, A. Yamanaka, and T. Uozumi, J. Phys. Soc. Jpn. 84, 073706 (2015).
- Křápek et al. (2012) V. Křápek, P. Novák, J. Kuneš, D. Novoselov, D. M. Korotin, and V. I. Anisimov, Phys. Rev. B 86, 195104 (2012).
- Hariki et al. (2017b) A. Hariki, A. Hausoel, G. Sangiovanni, and J. Kuneš, Phys. Rev. B 96, 155135 (2017b).
- Ylvisaker et al. (2009) E. R. Ylvisaker, J. Kuneš, A. K. McMahan, and W. E. Pickett, Phys. Rev. Lett. 102, 246401 (2009).
- Cao et al. (2008) G. Cao, O. Korneta, S. Chikara, L. DeLong, and P. Schlottmann, Solid State Communications 148, 305 (2008).
- Kikugawa et al. (2009) N. Kikugawa, L. Balicas, and A. Peter Mackenzie, Journal of the Physical Society of Japan 78, 014701 (2009).
- Liu et al. (2018) Y. Liu, H. P. Nair, J. P. Ruf, D. G. Schlom, and K. M. Shen, Phys. Rev. B 98, 041110 (2018).