Abstract
The issue of the difference between optical and UV properties of radio-quiet and radio-loud (relativistically "jetted") active galactic nuclei (AGN) is a long standing one, related to the fundamental question of why a minority of powerful AGN possess strong radio emission due to relativistic ejections. This paper examines a particular aspect: the singly-ionized iron emission in the spectral range 4400 — 5600 Å, where the prominent HI H and [Oiii]4959,5007 lines are also observed. We present a detailed comparison of the relative intensity of Feii multiplets in the spectral types of the quasar main sequence where most jetted sources are found, and afterwards discuss radio-loud narrow-line Seyfert 1 (NLSy1) nuclei with -ray detection and with prominent Feii emission. An Feii template based on I Zw 1 provides an accurate representation of the optical Feii emission for RQ and, with some caveats, also for RL sources. CLOUDY photoionization simulations indicate that the observed spectral energy distribution can account for the modest Feii emission observed in composite radio-loud spectra. However, spectral energy differences alone cannot account for the stronger Feii emission observed in radio-quiet sources, for similar physical parameters. As for RL NLSy1s, they do not seem to behave like other RL sources, likely because of their different physical properties, that could be ultimately associated with a higher Eddington ratio.
keywords:
active galactic nuclei; optical spectroscopy; ionized gas; broad line regionOptical singly-ionized iron emission in radio-quiet and relativistically jetted active galactic nuclei \AuthorPaola Marziani1\orcidA, Marco Berton2,3,4\orcidB111ESO fellow, Swayamtrupta Panda5,6,7\orcidC222CNPq fellow, and Edi Bon8\orcidD \AuthorNamesPaola Marziani \corresCorrespondence: paola.marziani@inaf.it; Tel.: +39-0498293415
1 Introduction
The wide majority of active galactic nuclei (AGN) are characterised by the presence of broad and narrow optical and UV lines emitted by ionic species over a wide range of ionization potential .333For an introduction to AGN spectra and the interpretation of their spectra in physical terms, see e.g., Netzer (1990); Peterson (1997); Osterbrock and Ferland (2006), and references therein. Restricting the attention to broad lines, type-1 AGN444 Type-2 AGN do not show broad permitted lines in natural light; they are believed to be mostly obscured type-1 and will not be further considered here because they lack the diagnostics offered by the broad lines measurements. spectra invariably show the same low ionization lines ( 20 eV) that include HI Balmer lines (H, H), Mgii2800, the CaII IR Triplet, and Feii features, in addition to higher ionization lines (with CIV1549 as prototypical representative in the rest-frame UV domain).
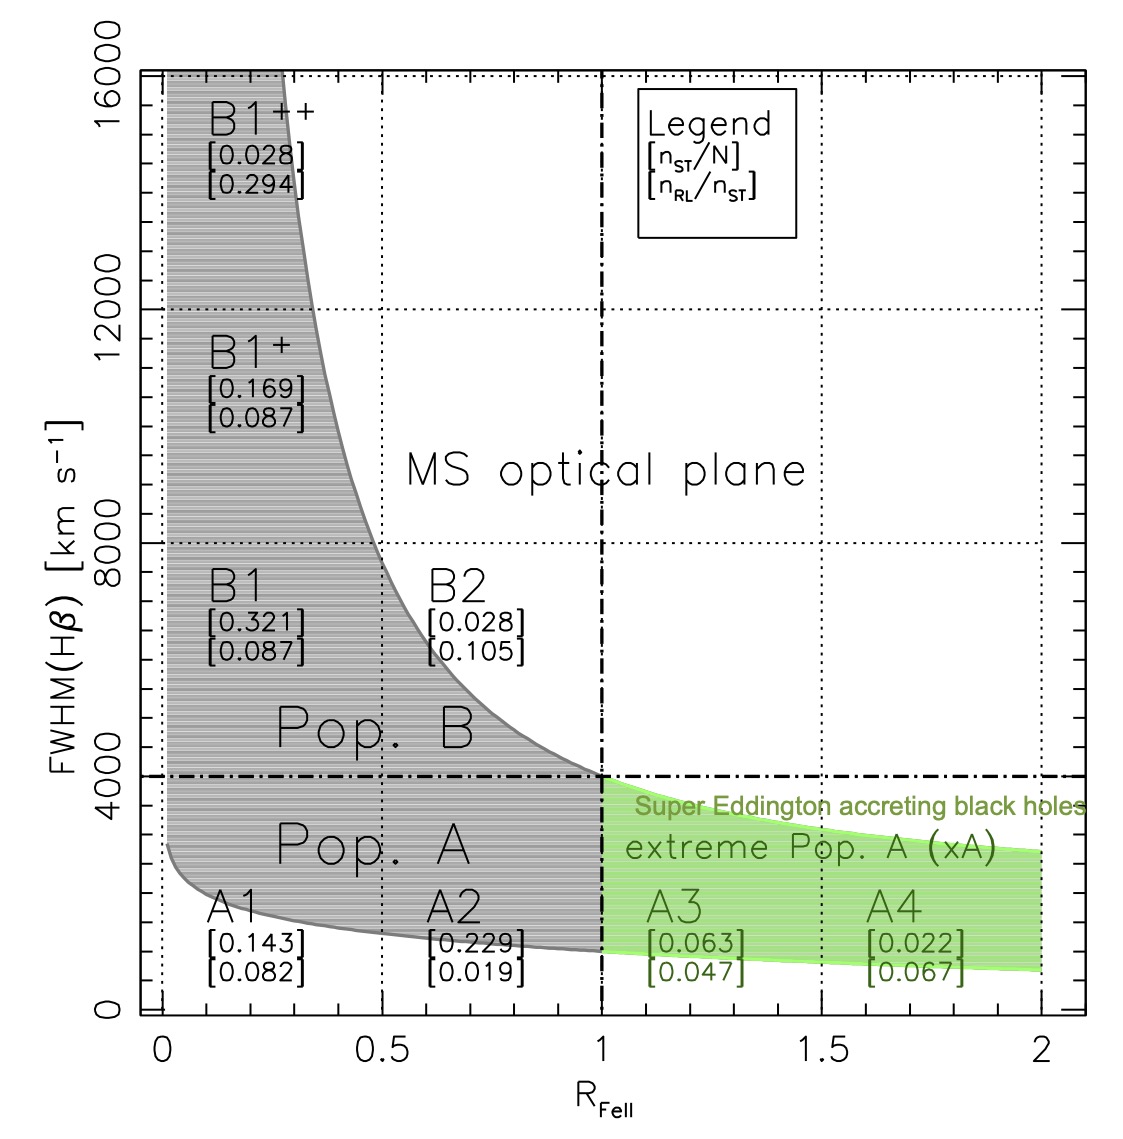
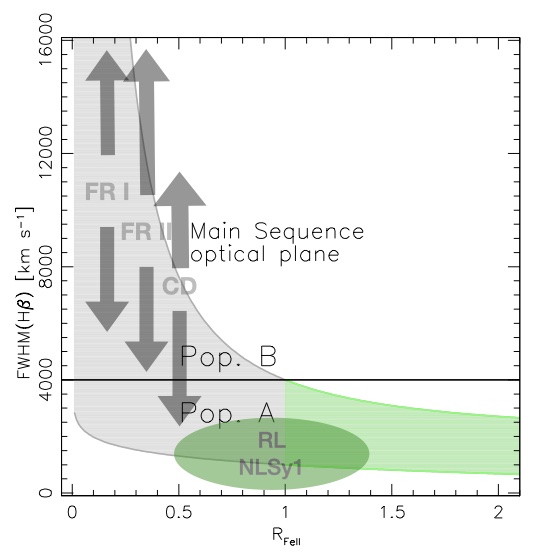
The relative intensities of the emission lines and their profiles do not scatter around an average, but instead change in a systematic way along the so-called quasar main sequence (MS, Boroson and Green (1992); Sulentic et al. (2000); Marziani et al. (2001); Shen and Ho (2014)). The MS can be represented in a plane where the full-width at half maximum (FWHM) of H is diagrammed against the parameter , defined as the intensity ratio between Feii4570 and the broad component of H i.e., = F(Feii4570)/F(H). Sketches or scatter plots of the occupation of the quasar MS in this parameter plane have been often shown in the literature (e.g., Gaskell, 1985; Boroson and Green, 1992; Shen and Ho, 2014; Sulentic and Marziani, 2015). Here we show a simple sketch of the quasar occupation in the optical parameter plane. Fig. 1 identifies several spectral bins in the plane (Sulentic et al., 2002), and the domain of two populations: Population A, with FWHM H km s-1, and a Population B of broader sources. The rationale for the subdivision in two Populations has been provided in several papers (Sulentic et al., 2000, 2008; Fraix-Burnet et al., 2017). Population A objects are predominantly sources with high Eddington ratio, with evidence of powerful winds originating from the accretion disk (Leighly and Moore, 2004; Richards et al., 2011; Coatman et al., 2016; Marziani et al., 2016; Sulentic et al., 2017; Vietri, 2017). Conversely, Population B sources have lower Eddington ratio, and their line asymmetries are predominantly toward the red (Marziani et al., 2003, 2009). The origin of the asymmetry is a topic of current debate: partial obscuration and infall (Wang et al., 2017), and gravitational redshift (Corbin, 1995; Popovic et al., 1995; Zheng and Sulentic, 1990; Bon et al., 2015; Punsly et al., 2020) are two processes that have been proposed.
The importance of the parameter stems from the fact that the Feii emission extends from UV to the IR and can dominate the thermal balance of the low-ionization broad-line region (BLR) (Marinello et al., 2016). Feii emission is self-similar in type-1 AGN but the relative intensity to H (parameterized by ) can vary from undetectable to , with values larger than 2 being rare (less than 1% in optically selected samples, (Marziani et al., 2013)). The trend of the MS in turn provides systematic constraints on the physical conditions of the line emitting gas (Marziani et al., 2010; Panda et al., 2018, 2019), and is related to several multi-frequency properties as well. For instance, Feii emission is also correlated with narrow-line properties such as weak Feii implies strong [Oiii]4959,5007. Boroson and Green (1992) formulated this and the FWHM H– correlation in the context of the Eigenvector 1 in a principal component analysis, the main forerunner of the quasar MS, although this result was known since much earlier time (see for instance Ref. (Steiner, 1981)). Furthermore, strong Feii is associated with a high value of the soft-X ray photon index (Boller et al., 1996; Wang et al., 1996; Sulentic et al., 2000; Grupe et al., 2001), a tenet of the 4D Eigenvector 1 introduced by Sulentic et al. (2000). Nonetheless, a full understanding of the Feii emission remains a daunting task (Panda et al., 2018, 2021, 2020, 2021). Even the main ionization mechanism is not fully clear. Early suggestions of a contribution of collisional ionization (e.g., Joly et al., 2008, and references therein) have fallen into disfavor following the extensive monitoring of several objects (Barth et al., 2013; Du et al., 2018): the Fe iiopt emission responds to observed continuum variations with a delay larger than the one of H, but still fairly well defined.
The MS has been instrumental to the establishment of a second major result, in addition to the realisation of the importance of Feii emission. RL sources are not uniformly distributed along the main sequence (Sulentic et al., 2003; Zamfir et al., 2008). In low- samples, they occupy the region of low and predominantly broad or very broad H. The numbers in square brackets in Fig. 1 report the fraction of sources along the sequence, and the fraction of core-dominated (CD) and Fanaroff-Riley II (FR-II) sources in each spectral bin555We consider here as radio loud (RL) only powerful jetted radio sources with radio-to-optical specific flux ratio .. This excludes a population of radio-detected sources that are likely associated with star formation, and are confined at the high- end of the main sequence (Bonzini et al., 2015; Caccianiga et al., 2015; Ganci et al., 2019). CD and FR-II sources show systematic differences, in the sense that CD sources show stronger Feii emission and narrower Balmer line (Osterbrock, 1977; Miley and Miller, 1979; Zamfir et al., 2008).
In this small contribution we focus the attention on the Feii optical spectrum of type 1 AGN, and we first provide a summary description of the optical Feii emission in the spectral region of H sample (Sect. 2). The aim is not to solve the still-open problem of the Feii emission in type-1 AGN (Panda et al., 2018, 2019), but rather to establish whether the optical Feii emission might be different in radio-quiet (RQ) and RL AGN. We then present an overview of the sample used for the analysis of the differences between RQ and RL sources, keeping the distinction between CD and FR-II among jetted sources. The comparison is carried out within the MS context, namely comparing sources that are RQ and RL belonging to the same spectral type (§3), considering a “solid” Feii template (i.e, a template with fixed relative line intensities), and a template in which the relative multiplet strengths are free to vary (§4). The results (§5) confirm a substantial equality for the Feii emission, within the non-trivial constraints imposed by signal-to-noise ratio (S/N) and resolution. Possible implications for the line emitting region structure in RQ and RL are briefly discussed, also with the help of photoionization computations (§6).
2 The Feii emission lines
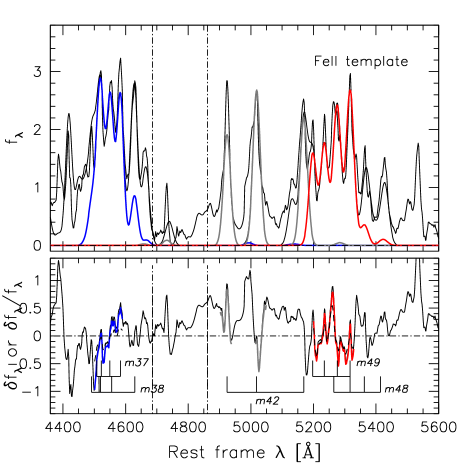
The main Feii optical lines in the spectral region between 4400 Å and 5600 Å are associated with 5 main multiplets. It is expedient to distinguish 3 main features:
-
•
the blend on the blue side of H, made up of lines from the m37 and m38, and usually referred to as Feii4570, whose intensity is the Feii measure that enters in the definition of and applied in most papers following Boroson and Green (1992).
-
•
m42, with two lines appearing as satellite lines of [Oiii]4959,5007. The line at 5018 might be affected by contamination from He i, and is strongly affected also by the red wing of [Oiii]5007. Given these difficulties the m42 lines were included in the fits but no result concerning this multiplet is considered;
-
•
the lines of multiplets m48 and m49 that provide the bulk of the emission of the Feii blend on the red side of H (referred to as Feii5270 or as the Feii red blend).
The transitions giving rise to these lines are schematically shown in the highly-simplified Grotrian diagram of Fig. 2 (Phillips, 1978; Osterbrock and Ferland, 2006; Pradhan and Nahar, 2015).
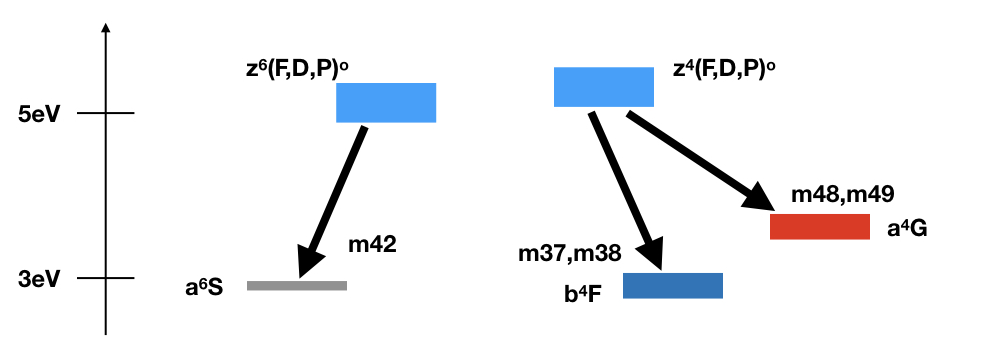
The observed Fe iiopt emission is produced by a combination of collisional and resonance-fluorescence processes (Verner et al., 1999, 2004; Sigut and Pradhan, 1998, 2003; Pradhan and Nahar, 2015). Collisional excitation, resonance fluorescence, in which a line or continuum photon is absorbed in a line transition, both play an important role. Ly fluorescence can populate the upper levels of Fig. 2 via population of much higher energy level at eV, producing a cascade with two branches leading to the ,,,, , and terms between 4.8 and 5.6 eV responsible for the optical emission between 4500 and 5600 Å. Collisional excitation, albeit significant (Phillips, 1978), alone cannot explain the emission of the stronger Feii emitters.
3 Sample
This paper considers two samples of broad-line, type-1 sources:
-
•
a sample of bright quasars from the Sloan Digital Sky Survey (SDSS) database in the redshift range (Marziani et al., 2013, 2013). Composite median spectra were extracted for the RQ, CD and FR-II radio classes. A significant number of RL sources ( out of the 680 quasars of the original sample) is found only in the spectral bins A1, B1, B1+: 8, 16, 9 CDs and 10, 23, 11 FR-IIs in each bin, respectively. All sources (save a borderline one) in the sample that are RL with extended emission satisfy the power criterion at 1.5 GHz erg s-1 Hz-1 that separate FR-II sources from the lower luminosity FR-I (de Young, 2002; Kembhavi and Narlikar, 1999).666Both FR-I and FR-II sources are characterized by extended radio emission. FR-Is however show lower radio surface brightness toward the outer extremities of the lobes, at variance with FR-II sources that are often described as “edge brightened.” According to the unification schemes (Urry and Padovani, 1995), both classes are observed at relatively high inclination. Their optical spectra can be of both type 1 and type 2 AGN. In the last bin, however, the Feii intensity is consistent with 0, so that only sources in bin A1 and B1 are considered. In addition, in A1 FR-II the Fe iiopt emission is too weak for a meaningful analysis.In conclusion, our bright quasar sample belongs in the following composite spectra: A1 RQ, A1 CD, B1 RQ, B1 CD, B1 FR-II;
-
•
three individual relativistically jetted NLSy1s with -ray detections, that show more prominent Feii emission than the composites. The -ray detection supports the presence of a relativistic jet as the origin of the radio power for these sources (Komossa et al., 2006). They were selected because high-quality optical spectra were available for the three of them.
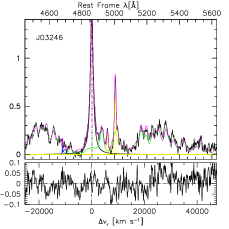
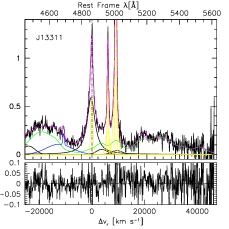
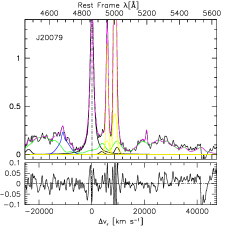
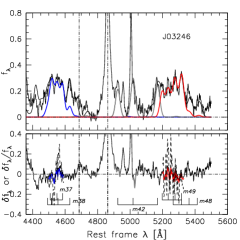
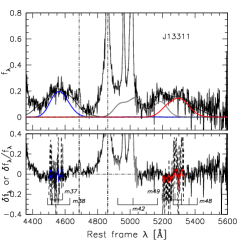
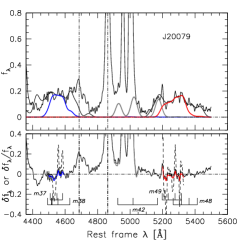
The three -ray sources are 1H 0323+342 ( B2 0321+33 1H 0323+342 J03246+341), 3C 286 (J13311+305), and PKS 2004-447 (J20079–445). J03246 is the closest -ray NLSy1 (), hosted either by a spiral or an interacting late-type galaxy (Zhou et al., 2006; Antón et al., 2008), and it is the only known -NLSy1 showing a Fe K emission line in X-rays (Kynoch et al., 2018). This object was detected by the Fermi Gamma-ray Space Telescope soon after its launch (Abdo et al., 2009). J13311 is a rather high redshift () object, identified as a -ray source in all Fermi catalogs (e.g., (Ackermann et al., 2015)). Originally it was classified as a compact steep-spectrum (CSS) source based on its radio morphology (Peacock and Wall, 1982), and later as a NLSy1 from optical spectroscopy (Berton et al., 2017; Yao and Komossa, 2021). Also J20079 () is classified as both a CSS and a NLSy1 (Oshlack et al., 2001; Gallo et al., 2006; Berton et al., 2021) and, as J03246, it belongs to the first batch of NLSy1s detected by Fermi (Abdo et al., 2009). The spectra of these three sources were obtained using the Asiago 1.22m Telescope for J03246 (full description of the data reduction in Foschini et al. (2015)), the SDSS archive for J13311, and the FORS2 instrument on the Very Large Telescope for J20079–445 (Berton et al., 2021).
4 Analysis
The analysis is mainly empirical and, as mentioned, there is no pretension to solve the problem of the optical Feii emission in AGN. Two approaches are followed in the measurement of the relative intensity of the multiplets:
-
•
the modeling of the spectrum using a "solid" Feii template, scaled and broadened to minimize the in a multi-component fit. It is basically the one of Boroson and Green (1992) actualized with a higher resolution spectrum and a model of the Feii emission underlying H (Marziani et al., 2009). In this case, a multi-component fit was carried out including all known emission components, as detailed in several recent works (Sulentic et al., 2015; Negrete et al., 2018; Marziani et al., 2019). Specifically, the redward asymmetric H has been modeled by the use of three components - a narrow, a broad and a very broad component (Wolf et al., 2020, and references therein). After verification that the host galaxy spectral emission is not contributing significantly, the local continuum was fit with a power law;
-
•
the use of a "liquid" template that permits to change the relative intensity of the multiplets in the optical spectral range (Kovačević et al., 2010; Kovačević-Dojčinović and Popović, 2015) 777http://servo.aob.rs/FeII_AGN/. In this case, the continuum subtracted spectrum was fit to a set of variable multiplets and to H and [Oiii]5007 profiles that were approximated as Gaussians.
5 Results
5.1 Feii emission comparison between RQ and RL
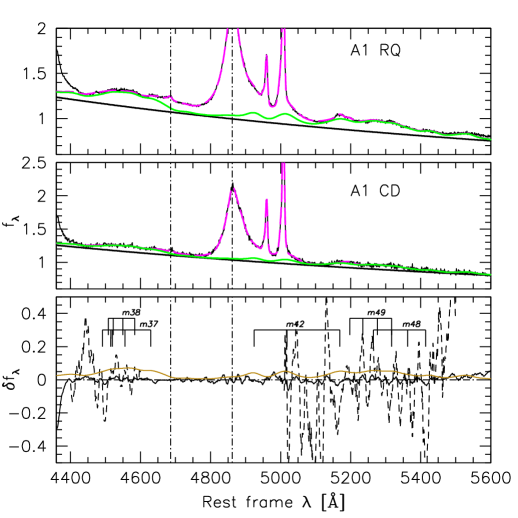
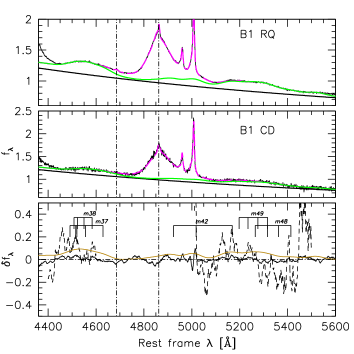
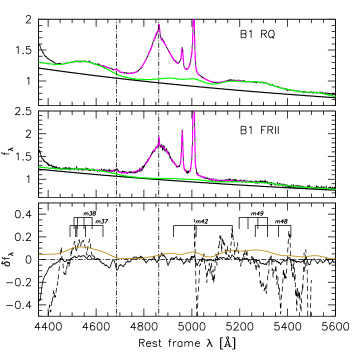
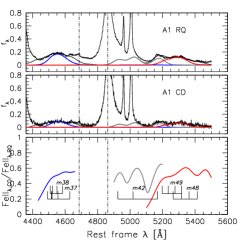
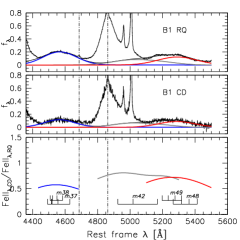
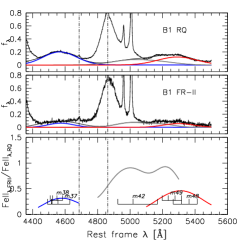
The results of the application of the multi-component fit with the solid Feii template are shown in Figs. 3 and 4 for the spectral types A1 and B1, respectively. In Fig. 3, the only comparison we show is between A1 RQ and A1 CD sources, as there is no A1 FR-II composite. In Fig. 4, the left panel shows the comparison between B1 RQ and B1 CD composites, while on the right the B1 RQ composites are compared to B1 FR-II. The immediate result is that RL (CD and FR-II) composites show weaker Feii emission (Zamfir et al., 2008). The second immediate result (already reported in Marziani et al., 2003) is the similar appearance of the H profiles. The H profiles of Figs. 3 and 4 confirm that the prominent redward asymmetry is not a prerogative of RL sources, but is a common feature in both RQ and RL sources, provided that they belong to Population B (Marziani et al., 1996; Sulentic et al., 2008; Punsly, 2010).
The bottom panels of Figs. 3 and 4 provide constraints on the nature of the difference between Feii emissions in the RQ and RL composite spectra. The brown line traces the difference in the templates, which is positive since Feii is stronger in RQ than in CD and FR-II as well. The black filled lines traces the difference between the observed Feii emission after rescaling of the RL Feii emission by a factor to obtain an average of 0. The difference is computed between the observed Feii spectra, as follows:
| (1) |
| (2) |
where the index refers to CD or FR-II, the to the observed flux as a function of wavelength, and the calligraphic symbols refer to model spectrum () and model Feii ( via the scaled and broadened template. Model parameters were obtained with a multi-component, non-linear minimum technique, as implemented in IRAF (Kriss, 1994).
The basic results of the spectral fits are reported in Table 1. The Table columns list, in the following order, the spectrum identification, the rest-frame equivalent width in Å for Feii4570, , FWHM H, the spectral type defined on the basis of the reported and FWHM H, and the rescaling factor .
Table 2 lists the average of the absolute difference between the observed iron blends and the solid Feii template. The averages are computed over the full ranges 4434 Å – 4684 Å (hereafter indicated as B blend or Feii4570), and 5100 Å – 5600 Å (hereafter R blend) also used for the CLOUDY photoionization simulations (Sect. 6.1). The next columns yield the average and relative absolute differences between RL and RQ after rescaling, for the restricted spectral region between 4500 and 4590 Å (roughly corresponding to multiplets 38 and 39) and (between 5200 and 5330 Å, with the strongest features of m48 and m49). The reason of this restriction is to avoid the contamination by Heii on the blue side of H. The Heii4686 line can have a significant effect and its estimation is based only from fit.
| Spectrum | W(Feii4570) | FWHM H | ST | ||
| Composite spectra | |||||
| A1 RQ | 31.6 | 0.291 | 3230 | A1 | … |
| A1 CD | 16.2 | 0.397 | 3290 | A1 | 1.815 |
| B1 RQ | 44.1 | 0.414 | 6940 | B1 | … |
| B1 CD | 26.0 | 0.281 | 7060 | B1 | 1.657 |
| B1 FR-II | 21.5 | 0.184 | 6790 | B1 | 1.900 |
| Feii template | … | … | 990 | A | … |
| RL NLSy1s | |||||
| 1H 0323+342 | 50.1 | 1.03 | 1280 | A3 | … |
| 3C 286 | 33.5 | 0.792 | 3170 | A2 | … |
| PKS 2004-447 | 36.7 | 0.5455 | 1470 | A2 | … |
| Spectrum | |||||||
|---|---|---|---|---|---|---|---|
| Composite spectra | |||||||
| A1 RQ | 0.00146 0.00942 | 0.00257 0.01333 | … | … | … | … | |
| A1 CD | 0.00014 0.01265 | -0.00117 0.01671 | 0.00244 | -9.986E-05 | 0.0146 | -0.00354 | |
| B1 RQ | 0.00149 0.00665 | 0.00277 0.00982 | … | … | … | … | |
| B1 CD | -0.00188 0.01698 | 9.44E-05 0.01745 | 0.01420 | 0.07467 | -0.00403 | -0.02626 | |
| B1 FR-II | 0.00297 0.01554 | 0.0047 0.01574 | 0.03138 | 0.15740 | -0.00294 | -0.01834 | |
| RL NLSy1s | |||||||
| 1H 0323+342 | 0.00509 0.05126 | 0.00949 0.04280 | -0.00598 | -0.0388 | 0.02072 | 0.1297 | |
| 3C 286 | -0.00262 0.03654 | 0.005087 0.05126 | -0.00304 | -0.0254 | 0.00516 | 0.0475 | |
| PKS 2004-447 | -0.00145 0.02275 | 0.005514 0.02115 | -0.0008 | -0.0149 | 0.00866 | 0.1117 | |
In the case of spectral type A1, the comparison between RQ and CD relative intensities of the multiplets is shown in the panels of Fig. 3. On the blue side, the is consistent with 0 over the range where most of the emission due to multiplets 37 and 38 is expected. Similar considerations apply to the red side emission; the main fluctuations according to Eq. 2 occur when Feii emission is weak.
The comparison for the composite spectra of bin B1 is shown in Fig. 4. On the blue side of H in correspondence of the m37 and m38 emission there could be a slight excess for the CD composite, accompanied by a deficit on the red side of H where emission is associated with multiplets m48 and m49. The average relative difference is a few positive and negative percents for the B and R regions, respectively (Table 2). Accepted as real the absolute difference is constrained within %, and the relative difference is contained within 20 %. The % average excess translates into an error in terms of , and in Feii4570 the difference is also 3 Å implying that there is no effect on the placement in the MS optical plane. To estimate the measurement errors on for the same S/N, equivalent width and FWHM of the lines, we used the quality parameter defined in an unrelated investigation, and derived from Monte Carlo simulations estimates of the errors for H and . The errors on Feii are the dominant one, and are 0.05 for the RQ composites and 0.10 for the radio-loud ones.
5.2 -ray detected RL NLSy1s
We apply the same fitting techniques to three relativistically jetted NLSy1s with -ray detection. Fig. 5 shows that the solid template used for the fitting of the composites is providing a good agreement, in a case with higher values of and much narrower lines that is better posed to appreciate possible differences. The fits are successful, and the residuals consistent with 0, with average systematic differences are 1 %, and the rms scatter is % of the normalized continuum value at 5100 Å.
| Spectrum | B/Ra | ||||||
|---|---|---|---|---|---|---|---|
| Composite spectra | |||||||
| A1 RQ | 0.993 | 0.994 | 0.82 | 0.974 | 0.00447 | -0.0182 | |
| A1 CD | 1.141 | 1.045 | 0.72 | 0.942 | 0.0117 | 0.0075 | |
| B1 RQ | 0.884 | 0.891 | 0.97 | 0.899 | 0.00934 | 0.00419 | |
| B1 CD | 0.666 | 0.698 | 0.79 | 0.699 | -0.0375 | -0.0198 | |
| B1 FR-II | 0.685 | 0.726 | 0.65 | 0.890 | -0.051 | -0.0169 | |
| Feii template | 0.792 | 0.979 | 0.65 | 0.967 | 0.00264 | 0.00813 | |
| RL NLSy1s | |||||||
| 1H 0323+342 | 0.743 | 0.780 | 0.59 | 0.765 | 0.0048 | -0.00020 | |
| 3C 286 | 0.821 | 0.905 | 0.78 | 0.867 | 0.00591 | -0.00218 | |
| PKS 2004-447 | 0.980 | 0.882 | 0.62 | 0.882 | 0.00093 | -0.0000466 | |
a: B/R ratio measured on the observed spectrum; b: same as in the previous column, but in the restricted range; c: ratio between the sum of m37+m38 and m48+m49 intensity obtained with the fits following Kovačević et al. (2010). Note that the ratio includes only the sums of these four multiplets, while both the standard and the restricted range include additional Feii emission as well as a possible residual contribution of Hei and Heii lines. d: ratio between the Feii emission of the B and R restricted range computed with the simulations of Kovačević et al. (2010). e: absolute average difference for the restricted B and R ranges, respectively, using the total Feii emission following Kovačević et al. (2010).
5.3 Models with relative intensity of the multiplets free to vary
We considered first the measurements based on the continuum-subtracted spectra in the full and restricted ranges (second and third columns of Table 3), and we utilized the web-based fitting tool888http://servo.aob.rs/FeIIAGN/uploads.php for implementing the scheme of Kovačević et al. (2010) for the optical Feii emission. The measurement of the ratio between the sum of the m37+m38, and m48+m49 blends is reported in the fourth column of Table 3. The fifth column reports the ratio measured on the full spectral model of Kovačević et al. (2010). The last two columns report the average differences between the observed and the Kovačević et al. (2010) modelling for the restricted ranges and , respectively, and are meant to provide an estimate of how well the model Feii reproduces the actual observations. The agreement is very good with all cases having the average difference less than 0.05, and most less than 0.01. The same procedure was also applied to the solid Feii template used in the previous analysis (Fig. 6). The values reported in Table 3 explain why the solid Feii template provides satisfactory results in all cases, and especially in the RQ cases.
We stress three main results:
-
•
There is a significant difference (by a factor 2) between RQ and RL sources in the same spectral types (meaning similar mass, Eddington ratio 0.1, and luminosity).
- •
-
•
The various measurements of the blue and red blend ratios suggest a somewhat higher values for the A1 and B1 RQ than for the RL sources (). The effect is not strong: yet, it is apparent especially in Fig. 7.
It is advisable to consider that there could be effects not related to the estimation of the Feii intensity. The main reason could be a difference in the intensity of Heii4686, even if Heii4686 is included in the fit. Other possibilities involve internal extinction (Gaskell, 2017; Baskin and Laor, 2018) affecting the Feii emitting region, limb-darkening (Marziani et al., 2001), incorrect continuum placement, contamination by lines other than Heii, and blueshifted H emission. To overcome at least the problem of the Heii4686 uncertain contribution, and of the contribution of the H wings, we defined a restricted range for B and R, and . The effect is however not significantly reduced (Table 2).
If we apply the same technique to the detected sources, the intensity ratio between B and R is closer to the value of the template (Fig. 8 and Table 3) but not for 1H 0323+342. The values reported in Table 3 confirm that the template is providing a good approximation for the RQ sources in bin A1 and B1. This is likely true also for spectral bins with higher (A2 and A3), as the template is based on the spectrum of I Zw 1, a NLSy1 accreting at a high rate and especially emitting strong Feii, with slightly larger than 1, and so of spectral type A3999I Zw 1 is however not a very extreme object: the most extreme accretors show spectra similar to the one of PHL 1092 (Marinello et al., 2020).. At the other end of the MS, Feii emission is faint and systematic differences might be not appreciable. So the issue of a possible, significant disagreement concerns only % of all type 1 AGN.
In summary, the use of a solid Feii template appears fully justified in this work. There could be a genuine effect associated with radio-loudness, in the sense of a less prominent blue blend with respect to the red one.
6 Discussion
The composites that we have considered in the present work all show modest Feii emission and satisfy the condition that . In principle, on the context of photoionization, they do not pose a serious challenge to the conventional view of the of the BLR as a system of emitting clouds characterized by typical densities cm-3, and column density [cm-2] (Davidson and Netzer, 1979). Indeed, physical parameters similar to these cm-3, along with metallicity solar or slightly sub-solar, and a flattish spectral energy distribution (SED) (Laor et al., 1997; Korista et al., 1997), can account for the emission in the range of spectral bins A1 and B1, at BLR distances from the continuum sources consistent with their luminosity (Panda et al., 2019).
Thanks especially to the results of reverberation mapping and Marinello et al. (2016), the emitting region radius was found to be a factor of 10 smaller than previously thought Peterson et al. (2004); Peterson (2017). The conventional view outlined in the previous paragraph may be only partially valid in Population A sources, as it is unable to account for the strong Feii emission in quasars Collin-Souffrin and Dumont (1989); Collin and Joly (2000). Different physical conditions are required for sources with stronger Feii emission: higher densities are needed to maintain the ionization parameter within reasonable limits. In spectral type A3, cm-3 (strong Feii emission appears possible only if cm-3, (Matsuoka et al., 2008; Martínez-Aldama et al., 2015; Panda et al., 2018)). High column density and super-solar metallicity provide a further boost to the Feii intensity and to the strength of the metal lines in the UV (Panda et al., 2018; Śniegowska et al., 2021).
6.1 Photoionization computations
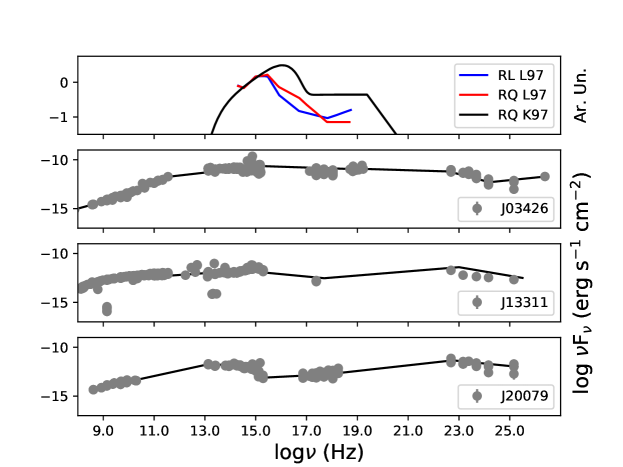
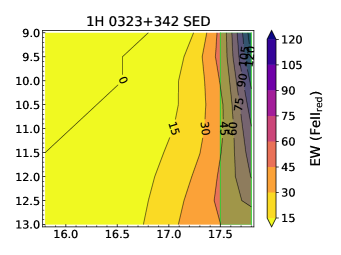
To ascertain the role of the SED in the strength of Feii we performed exploratory calculations of the RQ and RL differences, as well as for the -detected NLSy1s. As a first attempt, we assumed a column density cm-2, solar metallicity, and 0 micro-turbulence. We focused on the exploration of the parameter ranges of the density ( cm-3), and of BLR radius within the range expected from the Bentz et al. (2013) scaling law, corrected for high-accretion rates ((Martínez-Aldama et al., 2019; Du and Wang, 2019); see also (D’Onofrio et al., 2021)). We utilized the SEDs from Laor et al. (1997) and Korista et al. (1997), which are most appropriate for bins A1 and B1, for RQ and RL separately (top panel of Fig. 9). The two RQ SEDs most likely bracket the distribution of SEDs in the two bins, as also assumed in previous work (Panda et al., 2019). For the composites, we consider a fixed luminosity Å) erg s-1, consistent with the values derived for the original sample (Marziani et al., 2013). For RL NLSy1s, we built a specific SED for each one of them by using the multi-frequency data of the SED builder available at the Space Science Data Center of the Italian Space Agency101010https://tools.ssdc.asi.it/SED/. The results are shown in the second, third, and fourth panel of Fig. 9.
6.2 Composites RL and RQ
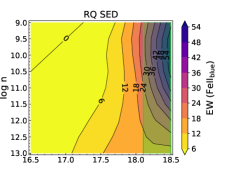
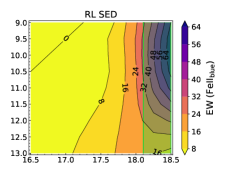
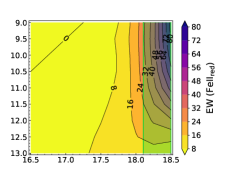
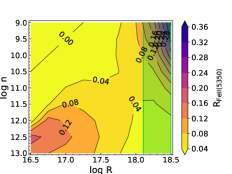
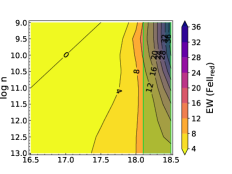
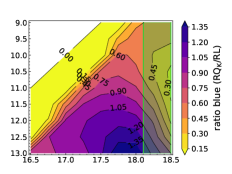
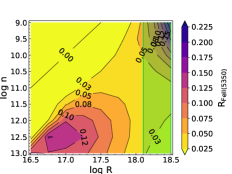
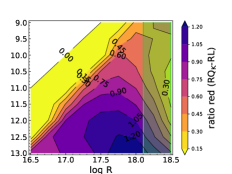
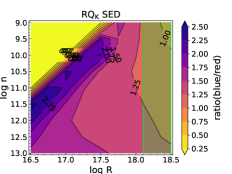
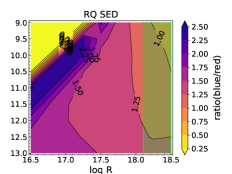
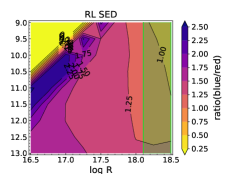
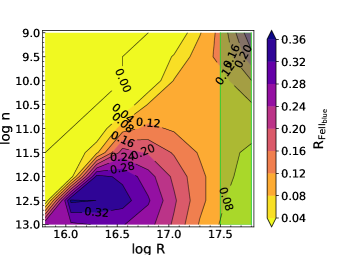
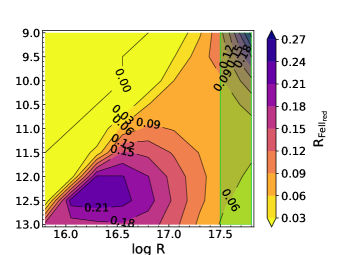
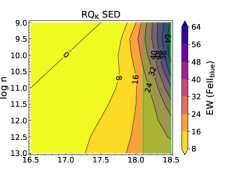
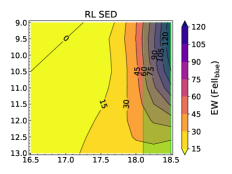
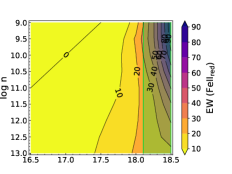
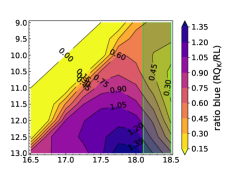
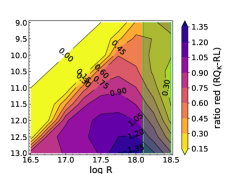
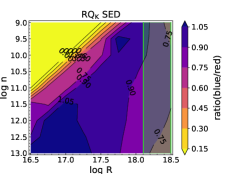
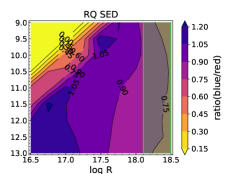
Fig. 10 shows the expected , the ratio between the red blend R and H, and the ratio B/R for the RQ and RL SEDs, as a function of and . As mentioned above, the range in has been centered on the value expected from the correlation - by Bentz et al. (2013). The density range includes the most likely values for the BLR along the MS. Typical values are lower for Population B, and much higher for Population A. (Marziani et al., 2001, 2018).
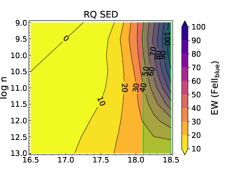

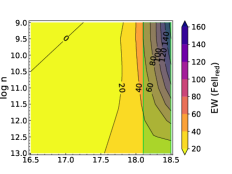

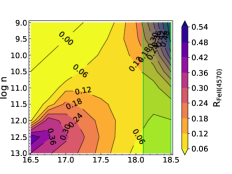

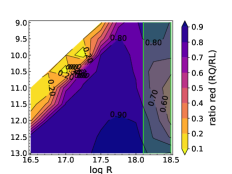
The most important result is that the SED for RL sources is able to account for the modest and W(Feii4570) reported in Table 1. The observed equivalent width Å and 0.15 are explained at the expected from the – relation, and by the moderate density cm-3. The result seems to be especially robust against changes in and (Fig. 10, middle column). Restricting the ranges to and confirms this conclusion (Fig. 1; the result of the analysis for the restricted range are shown in Appendix A).
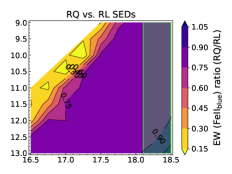
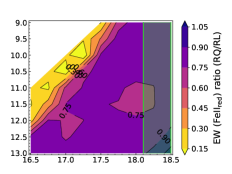
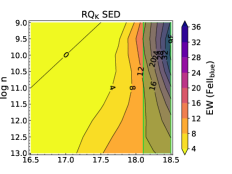
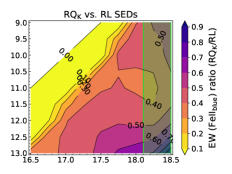
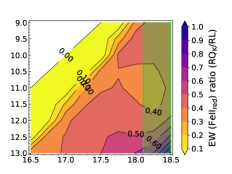
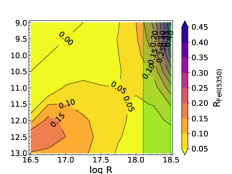
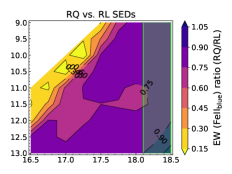
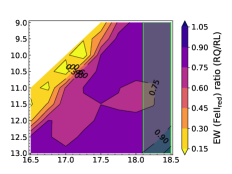
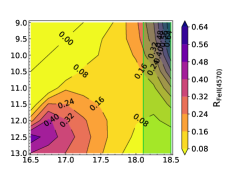
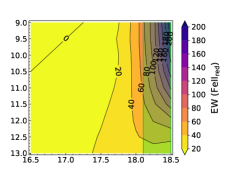
Regarding the interpretation of the composite spectra, a second important issue is whether the difference in RQ and RL SED can explain the differences in their Feii strength. We stress that the comparison is being carried out between sources that are in the same spectral types, meaning that they have similar , , and Eddington ratio. The computed over a large area of the parameter plane – shows differences that are at most 0.05, i.e., less than % (Fig. 10). This has the important implication that the parameter , i.e., twice as strong in RQ than in RL AGNs, cannot be explained on the basis of the SED only. However, the RQ SED that we adopt is not necessarily equivalent to the one of the sources used to construct the Population A and B. Using the SED from Korista et al. (1997) that has a stronger big blue bump (implying for fixed and an increase in ionization parameter by a factor 3) cannot lead to a higher (Fig. 11 and Fig. 2).
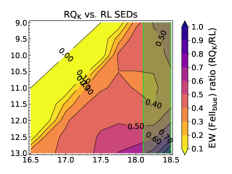
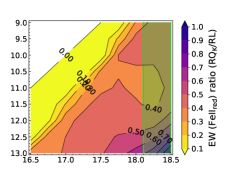

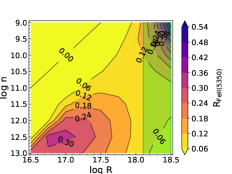
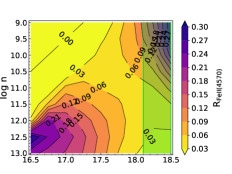
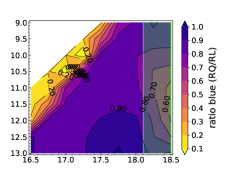
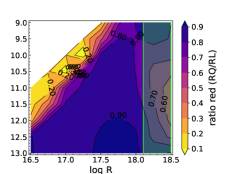
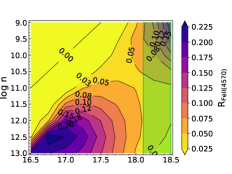
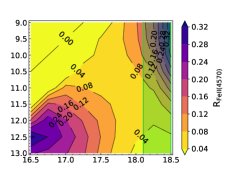
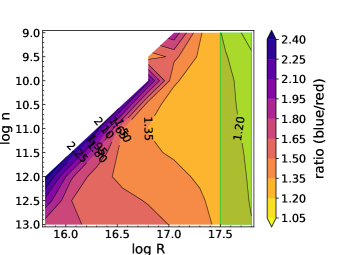
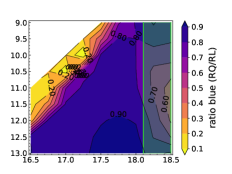
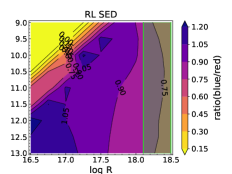
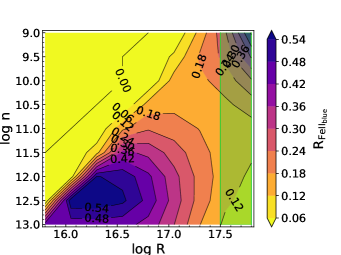
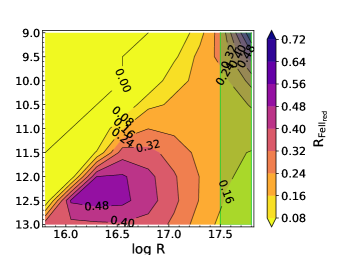
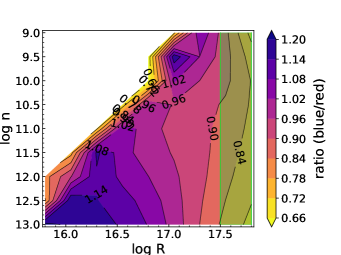
The second issue investigated in the present paper is the possibility of a systematic difference in the B/R Feii ratio. This result should be viewed with care, and confirmatory data are needed, also considering that we are dealing mainly with weak Feii emitters. The agreement between the observed and photoionization-predicted B/R is good, and in most cases the B/R 1, with little dependence on the and parameters. Fig. 12 (Fig. 3 for the restricted ranges) shows that there is a possible lowering of the B/R ratio in the B1 RL (both CD and FR-II) with respect to the RQ. Accepted at face value, it might imply a lower density, and a higher ionization parameter for the RL sources (Fig. 12), although Figs. 10 and 11 show that this implies fainter Feii emission than what is expected for the typical values of .
Sulentic et al. (2016) speculated that the cocoon associated with the shock wave due to the expansion of the jet could push outward the line emitting regions. It is known that the Civ high-ionization line reaches lower blueshift amplitudes in RL than in RQ sources (Sulentic et al., 2007; Richards et al., 2011). The present paper confirms that an effect on the low-ionization lines is minor. Considering the layout of the atomic levels in the Grotrian diagram of Fig. 2, the lower B in radio loud sources could be due a lower electron in RL than in RQ, which could be, according to Fig. 12, in turn associated with a lower and a larger distance.
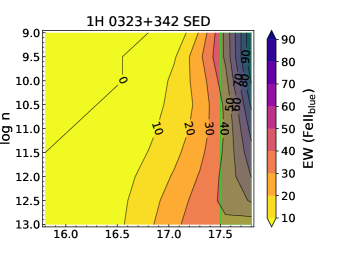
6.3 -detected NLSy1s
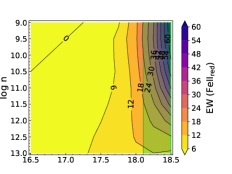
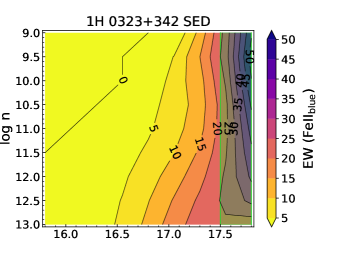
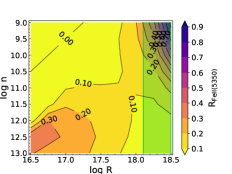
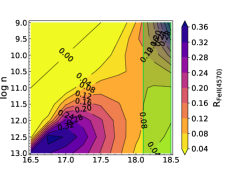
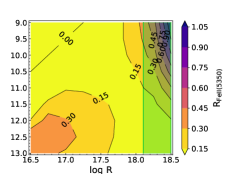
The photoionization calculations performed with the parameters appropriate to model 1H 0323+342 (Fig. 13, repeated in Appendix A for the restricted range as Fig. 4) reveal that is not possible to achieve with the SED shown in Fig. 9. This raises an important issue about the Feii emission in these jetted sources. A change in SED within the limit of Population B, such as the one provided by Korista et al. (1997) is likely not enough to explain the increase in Feii. This leaves several other possibilities to account for this intrinsic difference between jetted and non-jetted sources. They can be loosely grouped in "evolutionary" (chemical evolution of the host and of the circumnuclear regions, in turn related to the host morphology), and "intrinsic" (density, column density, ionization degree, covering fraction of the line emitting gas). The host morphologies of RL and RQ are systematically different, and recent work has validated the long-held paradigm that RL are hosted in earlier morphological types than RQ (Kozie-Wierzbowska et al., 2017a, b). This result might not be applicable to NLSy1s, and especially to the ones that are moderate-to-strong Feii emitters. Basically all of the recent studies on the host of jetted RL NLSy1s (Järvelä et al., 2018; Berton et al., 2019; Olguín-Iglesias et al., 2020) showed that they are in late-type hosts. Merging is instead rather common, and it may constitute the biggest difference with respect to RQ NLSy1. In particular, Olguín-Iglesias et al. (2020) clearly pointed out on a rather large sample that disk galaxies dominate among jetted NLSy1s.
The visual inspection of almost all known RL NLSy1s suggests that they never reach the extreme value obtained by RQ sources. This impression – even if consistent with the difference found for weak Feii emitters – should be validated by a systematic study that goes beyond the scope of the present paper. Enrichment in chemical composition appears a likely possibility, as the strongest Feii emitters are also believed to have the highest metal content (Shin et al., 2013; Sulentic et al., 2014; Nagao et al., 2006; Śniegowska et al., 2021). Photoionization analyses indicate that significant Feii emission is associated with super-solar metallicity, in addition to high density and high column density (Panda et al., 2018, 2019), although a complete observational analysis with matching and UV line diagnostics for metallicity and physical parameters estimates along the main sequence is still lacking.
7 Summary and conclusion
This work presented an analysis of the Feii emission in the spectral bins along the main sequence where both RQ and RL coexist (A1, B1) with measurable Feii strength, and a comparison between the emission of RQ and RL composite template, along with the analysis of 3 RL sources found to have a stronger Feii emission. The main results can be summarized as follows:
-
•
the template based on the I Zw 1 spectrum works equally well for RQ and RL objects. Deviation in and equivalent width measurements due to differences between the template and the observed spectra have been found to be 0.03, and a few Å. In particular, no correction is needed for the placement of RL in the MS built from RQ-dominated samples.
- •
-
•
Somewhat surprisingly, SED differences between RQ and RL cannot account for the stronger Feii emission in RQ111111Note that the equivalent width is increased, as shown in Fig. 11 and Fig. 2 but, since there is a corresponding increase in H, the is left unaffected.. We suggest that other factors related to the evolutionary pattern of the circumnuclear regions of the active nucleus should be investigated.
-
•
Last, the SED shape does not seem so important in determining the optical Feii prominence with respect to H for such sources with intermediate Eddington ratios (0.1), as the change from the Laor et al. (1997) to the Korista et al. (1997) SED produces no significant change in , even if the number of ionizing photons is increased by a factor . We remark that, for sources at higher Eddington ratios, this might be different, as has been tested and shown in Panda et al. (2019). Those authors found that the SED shape matters for pushing the higher, especially when the contribution from a soft-X-ray excess is accounted for.
-
•
The ratio between the B and the R blend is found to be 0.9 – 1.0 and to be consistent with the predictions of the photoionization computation. A slightly lower value () might be possible for the B1 RL composites. However, the measurement is excruciatingly difficult, considering the uncertain influence of the Heii4686 emission that is known to be very strong in cases where Feii is negligible (e.g., Marziani and Sulentic, 1993), and of several other factors that should play a lesser role. More importantly, the B/R value around 1 is found also in higher Eddington ratio sources which are stronger Feii emitters such as the 3 -detected NLSy1s considered in this study, all with Eddington ratio 0.5, typical of Population A quasars. Since is correlated with Eddington ratio (Sun and Shen, 2015; Du et al., 2016), and the B/R is apparently independent from , a lower B/R might be a genuine radio loudness effect or, perhaps more likely, an effect dependent on other RQ/RL sample differences.
In summary, we find that the Feii emission is stable, and we confirm that a solid template based on I Zw 1 provides an accurate representation of the optical Feii emission in the spectral region of H within the limit of precision allowed by moderate dispersion spectroscopy.
All authors contributed equally to this paper.
Acknowledgements.
SP would like to acknowledge the financial support by the Polish Funding Agency National Science Centre, project 2017/26/A/ST9/00756 (MAESTRO 9), and from CNPq Fellowship (164753/2020-6). EB acknowledge the support of Serbian Ministry of Education, Science and Technological Development, through the contract number 451-03-68/2020-14/200002. Based on observations made with ESO Telescopes at the La Silla Paranal Observatory under program ID 096.B-0256. This work is partially based on observations made with the Galileo 1.22 m telescope of the Asiago Astrophysical Observatory operated by the Department of Physics and Astronomy “G. Galilei” of the University of Padova. Funding for the Sloan Digital Sky Survey has been provided by the Alfred P. Sloan Foundation, and the U.S. Department of Energy Office of Science. The SDSS web site is http://www.sdss.org. SDSS-III is managed by the Astrophysical Research Consortium for the Participating Institutions of the SDSS-III Collaboration including the University of Arizona, the Brazilian Participation Group, Brookhaven National Laboratory, Carnegie Mellon University, University of Florida, the French Participation Group, the German Participation Group, Harvard University, the Instituto de Astrofisica de Canarias, the Michigan State/Notre Dame/JINA Participation Group, Johns Hopkins University, Lawrence Berkeley National Laboratory, Max Planck Institute for Astrophysics, Max Planck Institute for Extraterrestrial Physics, New Mexico State University, University of Portsmouth, Princeton University, the Spanish Participation Group, University of Tokyo, University of Utah, Vanderbilt University, University of Virginia, University of Washington, and Yale University. \conflictsofinterestThe authors declare no conflict of interest. \abbreviationsThe following abbreviations are used in this manuscript:| AGN | Active Galactic Nucleus |
| BLR | Broad Line Region |
| CD | Core dominated |
| FR-I | Fanaroff-Riley I |
| FR-II | Fanaroff-Riley II |
| FWHM | Full Width Half-Maximum |
| MS | Main Sequence |
| NLSy1 | Narrow-Line Seyfert 1 |
| RL | Radio loud |
| RQ | Radio quiet |
| SDSS | Sloan Digital Sky Survey |
| SED | Spectral energy distribution |
| S/N | Signal-to-noise ratio |
References
- Netzer (1990) Netzer, H. AGN emission lines. Active Galactic Nuclei; R. D. Blandford, H. Netzer, L. Woltjer, T. J.-L. Courvoisier, & M. Mayor., Ed., 1990, pp. 57–160.
- Peterson (1997) Peterson, B.M. An Introduction to Active Galactic Nuclei; Cambridge University Press, 1997.
- Osterbrock and Ferland (2006) Osterbrock, D.E.; Ferland, G.J. Astrophysics of gaseous nebulae and active galactic nuclei; University Science Books: Mill Valley, CA, 2006.
- Boroson and Green (1992) Boroson, T.A.; Green, R.F. The Emission-Line Properties of Low-Redshift Quasi-stellar Objects. ApJS 1992, 80, 109. doi:\changeurlcolorblack10.1086/191661.
- Sulentic et al. (2000) Sulentic, J.W.; Marziani, P.; Dultzin-Hacyan, D. Phenomenology of Broad Emission Lines in Active Galactic Nuclei. ARA&A 2000, 38, 521–571. doi:\changeurlcolorblack10.1146/annurev.astro.38.1.521.
- Marziani et al. (2001) Marziani, P.; Sulentic, J.W.; Zwitter, T.; Dultzin-Hacyan, D.; Calvani, M. Searching for the Physical Drivers of the Eigenvector 1 Correlation Space. ApJ 2001, 558, 553–560, [arXiv:astro-ph/0105343]. doi:\changeurlcolorblack10.1086/322286.
- Shen and Ho (2014) Shen, Y.; Ho, L.C. The diversity of quasars unified by accretion and orientation. Nat 2014, 513, 210–213, [1409.2887]. doi:\changeurlcolorblack10.1038/nature13712.
- Gaskell (1985) Gaskell, C.M. Galactic mergers, starburst galaxies, quasar activity and massive binary black holes. Nat 1985, 315, 386–+. doi:\changeurlcolorblack10.1038/315386a0.
- Sulentic and Marziani (2015) Sulentic, J.; Marziani, P. Quasars in the 4D Eigenvector 1 Context: a stroll down memory lane. Frontiers in Astronomy and Space Sciences 2015, 2, 6, [1506.01276]. doi:\changeurlcolorblack10.3389/fspas.2015.00006.
- Sulentic et al. (2002) Sulentic, J.W.; Marziani, P.; Zamanov, R.; Bachev, R.; Calvani, M.; Dultzin-Hacyan, D. Average Quasar Spectra in the Context of Eigenvector 1. ApJL 2002, 566, L71–L75, [arXiv:astro-ph/0201362]. doi:\changeurlcolorblack10.1086/339594.
- Sulentic et al. (2008) Sulentic, J.W.; Zamfir, S.; Marziani, P.; Dultzin, D. Our Search for an H-R Diagram of Quasars. Revista Mexicana de Astronomia y Astrofisica Conference Series, 2008, Vol. 32, pp. 51–58.
- Fraix-Burnet et al. (2017) Fraix-Burnet, D.; Marziani, P.; D’Onofrio, M.; Dultzin, D. The Phylogeny of Quasars and the Ontogeny of Their Central Black Holes. Frontiers in Astronomy and Space Sciences 2017, 4, 1. doi:\changeurlcolorblack10.3389/fspas.2017.00001.
- Leighly and Moore (2004) Leighly, K.M.; Moore, J.R. Hubble Space Telescope STIS Ultraviolet Spectral Evidence of Outflow in Extreme Narrow-Line Seyfert 1 Galaxies. I. Data and Analysis. ApJ 2004, 611, 107–124, [arXiv:astro-ph/0402453]. doi:\changeurlcolorblack10.1086/422088.
- Richards et al. (2011) Richards, G.T.; Kruczek, N.E.; Gallagher, S.C.; Hall, P.B.; Hewett, P.C.; Leighly, K.M.; Deo, R.P.; Kratzer, R.M.; Shen, Y. Unification of Luminous Type 1 Quasars through C IV Emission. AJ 2011, 141, 167–+, [arXiv:astro-ph.GA/1011.2282]. doi:\changeurlcolorblack10.1088/0004-6256/141/5/167.
- Coatman et al. (2016) Coatman, L.; Hewett, P.C.; Banerji, M.; Richards, G.T. C iv emission-line properties and systematic trends in quasar black hole mass estimates. MNRAS 2016, 461, 647–665, [1606.02726]. doi:\changeurlcolorblack10.1093/mnras/stw1360.
- Marziani et al. (2016) Marziani, P.; Martínez Carballo, M.A.; Sulentic, J.W.; Del Olmo, A.; Stirpe, G.M.; Dultzin, D. The most powerful quasar outflows as revealed by the Civ 1549 resonance line. ApSS 2016, 361, 29, [1512.00381]. doi:\changeurlcolorblack10.1007/s10509-015-2611-1.
- Sulentic et al. (2017) Sulentic, J.W.; del Olmo, A.; Marziani, P.; Martínez-Carballo, M.A.; D’Onofrio, M.; Dultzin, D.; Perea, J.; Martínez-Aldama, M.L.; Negrete, C.A.; Stirpe, G.M.; Zamfir, S. What does CIV1549 tell us about the physical driver of the Eigenvector quasar sequence? A&A 2017, 608, A122, [1708.03187]. doi:\changeurlcolorblack10.1051/0004-6361/201630309.
- Vietri (2017) Vietri, G. The LBT/WISSH quasar survey: revealing powerful winds in the most luminous AGN. American Astronomical Society Meeting Abstracts, 2017, Vol. 229, American Astronomical Society Meeting Abstracts, p. 302.06.
- Marziani et al. (2003) Marziani, P.; Zamanov, R.K.; Sulentic, J.W.; Calvani, M. Searching for the physical drivers of eigenvector 1: influence of black hole mass and Eddington ratio. MNRAS 2003, 345, 1133–1144, [arXiv:astro-ph/0307367]. doi:\changeurlcolorblack10.1046/j.1365-2966.2003.07033.x.
- Marziani et al. (2009) Marziani, P.; Sulentic, J.W.; Stirpe, G.M.; Zamfir, S.; Calvani, M. VLT/ISAAC spectra of the H region in intermediate-redshift quasars. III. H broad-line profile analysis and inferences about BLR structure. A&Ap 2009, 495, 83–112, [0812.0251]. doi:\changeurlcolorblack10.1051/0004-6361:200810764.
- Wang et al. (2017) Wang, J.M.; Du, P.; Brotherton, M.S.; Hu, C.; Songsheng, Y.Y.; Li, Y.R.; Shi, Y.; Zhang, Z.X. Tidally disrupted dusty clumps as the origin of broad emission lines in active galactic nuclei. Nature Astronomy 2017, 1, 775–783, [1710.03419]. doi:\changeurlcolorblack10.1038/s41550-017-0264-4.
- Corbin (1995) Corbin, M.R. QSO Broad Emission Line Asymmetries: Evidence of Gravitational Redshift? ApJ 1995, 447, 496–+. doi:\changeurlcolorblack10.1086/175894.
- Popovic et al. (1995) Popovic, L.C.; Vince, I.; Atanackovic-Vukmanovic, O.; Kubicela, A. Contribution of gravitational redshift to spectral line profiles of Seyfert galaxies and quasars. A&A 1995, 293, 309–314.
- Zheng and Sulentic (1990) Zheng, W.; Sulentic, J.W. Internal Redshift Difference and Central Mass in QSOs. ApJ 1990, 350, 512. doi:\changeurlcolorblack10.1086/168407.
- Bon et al. (2015) Bon, N.; Bon, E.; Marziani, P.; Jovanović, P. Gravitational redshift of emission lines in the AGN spectra. ApSS 2015, 360, 7, [1602.03688]. doi:\changeurlcolorblack10.1007/s10509-015-2555-5.
- Punsly et al. (2020) Punsly, B.; Marziani, P.; Berton, M.; Kharb, P. The Extreme Red Excess in Blazar Ultraviolet Broad Emission Lines. ApJ 2020, 903, 44, [arXiv:astro-ph.GA/2009.05082]. doi:\changeurlcolorblack10.3847/1538-4357/abb950.
- Marinello et al. (2016) Marinello, A.O.M.; Rodriguez-Ardila, A.; Garcia-Rissmann, A.; Sigut, T.A.A.; Pradhan, A.K. The FeII emission in active galactic nuclei: excitation mechanisms and location of the emitting region. ApJ 2016, 820, 116, [1602.05159].
- Marziani et al. (2013) Marziani, P.; Sulentic, J.W.; Plauchu-Frayn, I.; del Olmo, A. Is Mg II 2800 a Reliable Virial Broadening Estimator for Quasars? AAp 2013, 555, 89, 16pp, [arXiv:astro-ph.CO/1305.1096].
- Marziani et al. (2010) Marziani, P.; Sulentic, J.W.; Negrete, C.A.; Dultzin, D.; Zamfir, S.; Bachev, R. Broad-line region physical conditions along the quasar eigenvector 1 sequence. MNRAS 2010, 409, 1033–1048, [arXiv:astro-ph.CO/1007.3187]. doi:\changeurlcolorblack10.1111/j.1365-2966.2010.17357.x.
- Panda et al. (2018) Panda, S.; Czerny, B.; Adhikari, T.P.; Hryniewicz, K.; Wildy, C.; Kuraszkiewicz, J.; Śniegowska, M. Modeling of the Quasar Main Sequence in the Optical Plane. The Astrophysical Journal 2018, 866, 115. doi:\changeurlcolorblack10.3847/1538-4357/aae209.
- Panda et al. (2019) Panda, S.; Marziani, P.; Czerny, B. The Quasar Main Sequence Explained by the Combination of Eddington Ratio, Metallicity, and Orientation. ApJ 2019, 882, 79, [arXiv:astro-ph.HE/1905.01729]. doi:\changeurlcolorblack10.3847/1538-4357/ab3292.
- Steiner (1981) Steiner, J.E. A spectrophotometric classification of low-redshift quasars and active galactic nuclei. ApJ 1981, 250, 469–477. doi:\changeurlcolorblack10.1086/159394.
- Boller et al. (1996) Boller, T.; Brandt, W.N.; Fink, H. Soft X-ray properties of narrow-line Seyfert 1 galaxies. A&A 1996, 305, 53, [arXiv:astro-ph/9504093].
- Wang et al. (1996) Wang, T.; Brinkmann, W.; Bergeron, J. X-ray properties of active galactic nuclei with optical FeII emission. A&Ap 1996, 309, 81–96.
- Sulentic et al. (2000) Sulentic, J.W.; Marziani, P.; Zwitter, T.; Dultzin-Hacyan, D.; Calvani, M. The Demise of the Classical Broad-Line Region in the Luminous Quasar PG 1416-129. ApJL 2000, 545, L15–L18, [arXiv:astro-ph/0009326]. doi:\changeurlcolorblack10.1086/317330.
- Grupe et al. (2001) Grupe, D.; Thomas, H.C.; Beuermann, K. X-ray variability in a complete sample of Soft X-ray selected AGN. A&A 2001, 367, 470–486, [arXiv:astro-ph/0012100]. doi:\changeurlcolorblack10.1051/0004-6361:20000429.
- Panda et al. (2021) Panda, S.; Marziani, P.; Czerny, B. FeII emission in NLS1s - originating from denser regions with higher abundances? IAU Symposium 2021, 356, 77–81, [arXiv:astro-ph.HE/1912.03119]. doi:\changeurlcolorblack10.1017/S1743921320002616.
- Panda et al. (2020) Panda, S.; Maek, K.; Śniegowska, M.; Czerny, B. Strong FeII emission in NLS1s: An unsolved mystery. Panchromatic Modelling with Next Generation Facilities; Boquien, M.; Lusso, E.; Gruppioni, C.; Tissera, P., Eds., 2020, Vol. 341, pp. 297–298, [arXiv:astro-ph.HE/1811.12132]. doi:\changeurlcolorblack10.1017/S174392131900187X.
- Panda et al. (2021) Panda, S.; Marziani, P.; Czerny, B. FeII strength in NLS1s - dependence on the viewing angle and FWHM(H). IAU Symposium 2021, 356, 332–334, [arXiv:astro-ph.HE/1912.03118]. doi:\changeurlcolorblack10.1017/S1743921320003269.
- Joly et al. (2008) Joly, M.; Véron-Cetty, M.; Véron, P. Fe II emission in AGN. Revista Mexicana de Astronomia y Astrofisica Conference Series, 2008, Vol. 32, pp. 59–61.
- Barth et al. (2013) Barth, A.J.; Pancoast, A.; Bennert, V.N.; Brewer, B.J.; Canalizo, G.; Filippenko, A.V.; Gates, E.L.; Greene, J.E.; Li, W.; Malkan, M.A.; Sand, D.J.; Stern, D.; Treu, T.; Woo, J.H.; Assef, R.J.; Bae, H.J.; Buehler, T.; Cenko, S.B.; Clubb, K.I.; Cooper, M.C.; Diamond-Stanic, A.M.; Hönig, S.F.; Joner, M.D.; Laney, C.D.; Lazarova, M.S.; Nierenberg, A.M.; Silverman, J.M.; Tollerud, E.J.; Walsh, J.L. The Lick AGN Monitoring Project 2011: Fe II Reverberation from the Outer Broad-line Region. ApJ 2013, 769, 128, [arXiv:astro-ph.CO/1304.4643]. doi:\changeurlcolorblack10.1088/0004-637X/769/2/128.
- Du et al. (2018) Du, P.; Zhang, Z.X.; Wang, K.; Huang, Y.K.; Zhang, Y.; Lu, K.X.; Hu, C.; Li, Y.R.; Bai, J.M.; Bian, W.H.; Yuan, Y.F.; Ho, L.C.; Wang, J.M.; SEAMBH Collaboration. Supermassive Black Holes with High Accretion Rates in Active Galactic Nuclei. IX. 10 New Observations of Reverberation Mapping and Shortened H Lags. ApJ 2018, 856, 6, [1802.03022]. doi:\changeurlcolorblack10.3847/1538-4357/aaae6b.
- Sulentic et al. (2003) Sulentic, J.W.; Zamfir, S.; Marziani, P.; Bachev, R.; Calvani, M.; Dultzin-Hacyan, D. Radio-loud Active Galactic Nuclei in the Context of the Eigenvector 1 Parameter Space. ApJL 2003, 597, L17–L20, [arXiv:astro-ph/0309469]. doi:\changeurlcolorblack10.1086/379754.
- Zamfir et al. (2008) Zamfir, S.; Sulentic, J.W.; Marziani, P. New insights on the QSO radio-loud/radio-quiet dichotomy: SDSS spectra in the context of the 4D eigenvector1 parameter space. MNRAS 2008, 387, 856–870, [0804.0788]. doi:\changeurlcolorblack10.1111/j.1365-2966.2008.13290.x.
- Bonzini et al. (2015) Bonzini, M.; Mainieri, V.; Padovani, P.; Andreani, P.; Berta, S.; Bethermin, M.; Lutz, D.; Rodighiero, G.; Rosario, D.; Tozzi, P.; Vattakunnel, S. Star formation properties of sub-mJy radio sources. MNRAS 2015, 453, 1079–1094, [1508.01905]. doi:\changeurlcolorblack10.1093/mnras/stv1675.
- Caccianiga et al. (2015) Caccianiga, A.; Antón, S.; Ballo, L.; Foschini, L.; Maccacaro, T.; Della Ceca, R.; Severgnini, P.; Marchã, M.J.; Mateos, S.; Sani, E. WISE colours and star formation in the host galaxies of radio-loud narrow-line Seyfert 1. MNRAS 2015, 451, 1795–1805, [arXiv:astro-ph.GA/1504.07068]. doi:\changeurlcolorblack10.1093/mnras/stv939.
- Ganci et al. (2019) Ganci, V.; Marziani, P.; D’Onofrio, M.; del Olmo, A.; Bon, E.; Bon, N.; Negrete, C.A. Radio loudness along the quasar main sequence. A&A 2019, 630, A110, [arXiv:astro-ph.GA/1908.07308]. doi:\changeurlcolorblack10.1051/0004-6361/201936270.
- Osterbrock (1977) Osterbrock, D.E. Spectrophotometry of Seyfert 1 galaxies. ApJ 1977, 215, 733–745. doi:\changeurlcolorblack10.1086/155407.
- Miley and Miller (1979) Miley, G.K.; Miller, J.S. Relations between the emission spectra and radio structures of quasars. ApJL 1979, 228, L55–L58. doi:\changeurlcolorblack10.1086/182902.
- Phillips (1978) Phillips, M.M. Permitted fe II Emission in Seyfert 1 Galaxies and QSOs I. Observations. ApJS 1978, 38, 187–+. doi:\changeurlcolorblack10.1086/190553.
- Pradhan and Nahar (2015) Pradhan, A.K.; Nahar, S.N. Atomic Astrophysics and Spectroscopy; Cambridge University Press, 2015.
- Verner et al. (1999) Verner, E.M.; Verner, D.A.; Korista, K.T.; Ferguson, J.W.; Hamann, F.; Ferland, G.J. Numerical Simulations of Fe II Emission Spectra. ApJS 1999, 120, 101–112. doi:\changeurlcolorblack10.1086/313171.
- Verner et al. (2004) Verner, E.; Bruhweiler, F.; Verner, D.; Johansson, S.; Kallman, T.; Gull, T. Fe II Diagnostic Tools for Quasars. ApJ 2004, 611, 780–785, [arXiv:astro-ph/0404593]. doi:\changeurlcolorblack10.1086/422303.
- Sigut and Pradhan (1998) Sigut, T.A.A.; Pradhan, A.K. Ly alpha Flourescent Excitation of Fe II in Active Galactic Nuclei. ApJL 1998, 499, L139, [arXiv:astro-ph/9804183]. doi:\changeurlcolorblack10.1086/311369.
- Sigut and Pradhan (2003) Sigut, T.A.A.; Pradhan, A.K. Predicted Fe II Emission-Line Strengths from Active Galactic Nuclei. ApJS 2003, 145, 15–37, [arXiv:astro-ph/0206096]. doi:\changeurlcolorblack10.1086/345498.
- Phillips (1978) Phillips, M.M. Permitted Fe II emission in Seyfert 1 galaxies and QSOs. II - The excitation mechanism. ApJ 1978, 226, 736–752. doi:\changeurlcolorblack10.1086/156656.
- Marziani et al. (2013) Marziani, P.; Sulentic, J.W.; Plauchu-Frayn, I.; del Olmo, A. Low-Ionization Outflows in High Eddington Ratio Quasars. ApJ 2013, 764, [arXiv:astro-ph.CO/1301.0520].
- de Young (2002) de Young, D.S. The physics of extragalactic radio sources; University of Chicago Press, 2002.
- Kembhavi and Narlikar (1999) Kembhavi, A.K.; Narlikar, J.V. Quasars and active galactic nuclei : an introduction; Cambridge University Press, 1999.
- Urry and Padovani (1995) Urry, C.M.; Padovani, P. Unified Schemes for Radio-Loud Active Galactic Nuclei. PASP 1995, 107, 803, [arXiv:astro-ph/9506063]. doi:\changeurlcolorblack10.1086/133630.
- Komossa et al. (2006) Komossa, S.; Voges, W.; Xu, D.; Mathur, S.; Adorf, H.M.; Lemson, G.; Duschl, W.J.; Grupe, D. Radio-loud Narrow-Line Type 1 Quasars. AJ 2006, 132, 531–545, [astro-ph/0603680]. doi:\changeurlcolorblack10.1086/505043.
- Zhou et al. (2006) Zhou, H.; Wang, T.; Yuan, W.; Lu, H.; Dong, X.; Wang, J.; Lu, Y. A Comprehensive Study of 2000 Narrow Line Seyfert 1 Galaxies from the Sloan Digital Sky Survey. I. The Sample. ApJS 2006, 166, 128–153, [arXiv:astro-ph/0603759]. doi:\changeurlcolorblack10.1086/504869.
- Antón et al. (2008) Antón, S.; Browne, I.W.A.; Marchã, M.J. The colour of the narrow line Sy1-blazar 0324+3410. A&A 2008, 490, 583–587, [arXiv:astro-ph.GA/0907.2400]. doi:\changeurlcolorblack10.1051/0004-6361:20078926.
- Kynoch et al. (2018) Kynoch, D.; Landt, H.; Ward, M.J.; Done, C.; Gardner, E.; Boisson, C.; Arrieta-Lobo, M.; Zech, A.; Steenbrugge, K.; Pereira Santaella, M. The relativistic jet of the -ray emitting narrow-line Seyfert 1 galaxy 1H 0323+342. MNRAS 2018, 475, 404–423, [arXiv:astro-ph.GA/1712.01799]. doi:\changeurlcolorblack10.1093/mnras/stx3161.
- Abdo et al. (2009) Abdo, A.A.; Ackermann, M.; Ajello, M.; Atwood, W.B.; Axelsson, M.; Baldini, L.; Ballet, J.; Band, D.L.; Barbiellini, G.; Bastieri, D.; Battelino, M.; Baughman, B.M.; Bechtol, K.; Bellazzini, R.; Berenji, B.; Bignami, G.F.; Blandford, R.D.; Bloom, E.D.; Bonamente, E.; Borgland, A.W.; Bouvier, A.; Bregeon, J.; Brez, A.; Brigida, M.; Bruel, P.; Burnett, T.H.; Caliandro, G.A.; Cameron, R.A.; Caraveo, P.A.; Casandjian, J.M.; Cavazzuti, E.; Cecchi, C.; Charles, E.; Chekhtman, A.; Cheung, C.C.; Chiang, J.; Ciprini, S.; Claus, R.; Cohen-Tanugi, J.; Cominsky, L.R.; Conrad, J.; Corbet, R.; Costamante, L.; Cutini, S.; Davis, D.S.; Dermer, C.D.; de Angelis, A.; de Luca, A.; de Palma, F.; Digel, S.W.; Dormody, M.; do Couto e Silva, E.; Drell, P.S.; Dubois, R.; Dumora, D.; Farnier, C.; Favuzzi, C.; Fegan, S.J.; Ferrara, E.C.; Focke, W.B.; Frailis, M.; Fukazawa, Y.; Funk, S.; Fusco, P.; Gargano, F.; Gasparrini, D.; Gehrels, N.; Germani, S.; Giebels, B.; Giglietto, N.; Giommi, P.; Giordano, F.; Glanzman, T.; Godfrey, G.; Grenier, I.A.; Grondin, M.H.; Grove, J.E.; Guillemot, L.; Guiriec, S.; Hanabata, Y.; Harding, A.K.; Hartman, R.C.; Hayashida, M.; Hays, E.; Healey, S.E.; Horan, D.; Hughes, R.E.; Jóhannesson, G.; Johnson, A.S.; Johnson, R.P.; Johnson, T.J.; Johnson, W.N.; Kamae, T.; Katagiri, H.; Kataoka, J.; Kawai, N.; Kerr, M.; Knödlseder, J.; Kocevski, D.; Kocian, M.L.; Komin, N.; Kuehn, F.; Kuss, M.; Lande, J.; Latronico, L.; Lee, S.H.; Lemoine-Goumard, M.; Longo, F.; Loparco, F.; Lott, B.; Lovellette, M.N.; Lubrano, P.; Madejski, G.M.; Makeev, A.; Marelli, M.; Mazziotta, M.N.; McConville, W.; McEnery, J.E.; McGlynn, S.; Meurer, C.; Michelson, P.F.; Mitthumsiri, W.; Mizuno, T.; Moiseev, A.A.; Monte, C.; Monzani, M.E.; Moretti, E.; Morselli, A.; Moskalenko, I.V.; Murgia, S.; Nakamori, T.; Nolan, P.L.; Norris, J.P.; Nuss, E.; Ohno, M.; Ohsugi, T.; Omodei, N.; Orlando, E.; Ormes, J.F.; Ozaki, M.; Paneque, D.; Panetta, J.H.; Parent, D.; Pelassa, V.; Pepe, M.; Pesce-Rollins, M.; Piron, F.; Porter, T.A.; Poupard, L.; Rainò, S.; Rando, R.; Ray, P.S.; Razzano, M.; Rea, N.; Reimer, A.; Reimer, O.; Reposeur, T.; Ritz, S.; Rochester, L.S.; Rodriguez, A.Y.; Romani, R.W.; Roth, M.; Ryde, F.; Sadrozinski, H.F.W.; Sanchez, D.; Sander, A.; Saz Parkinson, P.M.; Scargle, J.D.; Schalk, T.L.; Sellerholm, A.; Sgrò, C.; Shaw, M.S.; Shrader, C.; Sierpowska-Bartosik, A.; Siskind, E.J.; Smith, D.A.; Smith, P.D.; Spandre, G.; Spinelli, P.; Starck, J.L.; Stephens, T.E.; Strickman, M.S.; Strong, A.W.; Suson, D.J.; Tajima, H.; Takahashi, H.; Takahashi, T.; Tanaka, T.; Thayer, J.B.; Thayer, J.G.; Thompson, D.J.; Tibaldo, L.; Tibolla, O.; Torres, D.F.; Tosti, G.; Tramacere, A.; Uchiyama, Y.; Usher, T.L.; Van Etten, A.; Vilchez, N.; Vitale, V.; Waite, A.P.; Wallace, E.; Wang, P.; Watters, K.; Winer, B.L.; Wood, K.S.; Ylinen, T.; Ziegler, M.; Fermi/LAT Collaboration. Fermi/Large Area Telescope Bright Gamma-Ray Source List. ApJS 2009, 183, 46–66, [arXiv:astro-ph.HE/0902.1340]. doi:\changeurlcolorblack10.1088/0067-0049/183/1/46.
- Ackermann et al. (2015) Ackermann, M.; Ajello, M.; Atwood, W.B.; Baldini, L.; Ballet, J.; Barbiellini, G.; Bastieri, D.; Becerra Gonzalez, J.; Bellazzini, R.; Bissaldi, E.; Blandford, R.D.; Bloom, E.D.; Bonino, R.; Bottacini, E.; Brandt, T.J.; Bregeon, J.; Britto, R.J.; Bruel, P.; Buehler, R.; Buson, S.; Caliandro, G.A.; Cameron, R.A.; Caragiulo, M.; Caraveo, P.A.; Carpenter, B.; Casandjian, J.M.; Cavazzuti, E.; Cecchi, C.; Charles, E.; Chekhtman, A.; Cheung, C.C.; Chiang, J.; Chiaro, G.; Ciprini, S.; Claus, R.; Cohen-Tanugi, J.; Cominsky, L.R.; Conrad, J.; Cutini, S.; D’Abrusco, R.; D’Ammando, F.; de Angelis, A.; Desiante, R.; Digel, S.W.; Di Venere, L.; Drell, P.S.; Favuzzi, C.; Fegan, S.J.; Ferrara, E.C.; Finke, J.; Focke, W.B.; Franckowiak, A.; Fuhrmann, L.; Fukazawa, Y.; Furniss, A.K.; Fusco, P.; Gargano, F.; Gasparrini, D.; Giglietto, N.; Giommi, P.; Giordano, F.; Giroletti, M.; Glanzman, T.; Godfrey, G.; Grenier, I.A.; Grove, J.E.; Guiriec, S.; Hewitt, J.W.; Hill, A.B.; Horan, D.; Itoh, R.; Jóhannesson, G.; Johnson, A.S.; Johnson, W.N.; Kataoka, J.; Kawano, T.; Krauss, F.; Kuss, M.; La Mura, G.; Larsson, S.; Latronico, L.; Leto, C.; Li, J.; Li, L.; Longo, F.; Loparco, F.; Lott, B.; Lovellette, M.N.; Lubrano, P.; Madejski, G.M.; Mayer, M.; Mazziotta, M.N.; McEnery, J.E.; Michelson, P.F.; Mizuno, T.; Moiseev, A.A.; Monzani, M.E.; Morselli, A.; Moskalenko, I.V.; Murgia, S.; Nuss, E.; Ohno, M.; Ohsugi, T.; Ojha, R.; Omodei, N.; Orienti, M.; Orlando, E.; Paggi, A.; Paneque, D.; Perkins, J.S.; Pesce-Rollins, M.; Piron, F.; Pivato, G.; Porter, T.A.; Rainò, S.; Rando, R.; Razzano, M.; Razzaque, S.; Reimer, A.; Reimer, O.; Romani, R.W.; Salvetti, D.; Schaal, M.; Schinzel, F.K.; Schulz, A.; Sgrò, C.; Siskind, E.J.; Sokolovsky, K.V.; Spada, F.; Spandre, G.; Spinelli, P.; Stawarz, L.; Suson, D.J.; Takahashi, H.; Takahashi, T.; Tanaka, Y.; Thayer, J.G.; Thayer, J.B.; Tibaldo, L.; Torres, D.F.; Torresi, E.; Tosti, G.; Troja, E.; Uchiyama, Y.; Vianello, G.; Winer, B.L.; Wood, K.S.; Zimmer, S. The Third Catalog of Active Galactic Nuclei Detected by the Fermi Large Area Telescope. ApJ 2015, 810, 14, [arXiv:astro-ph.HE/1501.06054]. doi:\changeurlcolorblack10.1088/0004-637X/810/1/14.
- Peacock and Wall (1982) Peacock, J.A.; Wall, J.V. Bright extragalactic radio sources at 2.7 GHz- II. Observations with the Cambridge 5-km telescope. MNRAS 1982, 198, 843–860. doi:\changeurlcolorblack10.1093/mnras/198.3.843.
- Berton et al. (2017) Berton, M.; Foschini, L.; Caccianiga, A.; Ciroi, S.; Congiu, E.; Cracco, V.; Frezzato, M.; La Mura, G.; Rafanelli, P. An orientation-based unification of young jetted active galactic nuclei: the case of 3C 286. Frontiers in Astronomy and Space Sciences 2017, 4, 8, [arXiv:astro-ph.GA/1705.07905]. doi:\changeurlcolorblack10.3389/fspas.2017.00008.
- Yao and Komossa (2021) Yao, S.; Komossa, S. Spectroscopic classification, variability, and SED of the Fermi-detected CSS 3C 286: the radio-loudest NLS1 galaxy? MNRAS 2021, 501, 1384–1393, [arXiv:astro-ph.HE/2012.01785]. doi:\changeurlcolorblack10.1093/mnras/staa3708.
- Oshlack et al. (2001) Oshlack, A.Y.K.N.; Webster, R.L.; Whiting, M.T. A Very Radio Loud Narrow-Line Seyfert 1: PKS 2004-447. ApJ 2001, 558, 578–582, [arXiv:astro-ph/astro-ph/0105213]. doi:\changeurlcolorblack10.1086/322299.
- Gallo et al. (2006) Gallo, L.C.; Edwards, P.G.; Ferrero, E.; Kataoka, J.; Lewis, D.R.; Ellingsen, S.P.; Misanovic, Z.; Welsh, W.F.; Whiting, M.; Boller, T.; Brinkmann, W.; Greenhill, J.; Oshlack, A. The spectral energy distribution of PKS 2004-447: a compact steep-spectrum source and possible radio-loud narrow-line Seyfert 1 galaxy. MNRAS 2006, 370, 245–254, [arXiv:astro-ph/astro-ph/0604480]. doi:\changeurlcolorblack10.1111/j.1365-2966.2006.10482.x.
- Berton et al. (2021) Berton, M.; Peluso, G.; Marziani, P.; Komossa, S.; Foschini, L.; Ciroi, S.; Chen, S.; Congiu, E.; Gallo, L.C.; Björklund, I.; Crepaldi, L.; Di Mille, F.; Järvelä, E.; Kotilainen, J.; Kreikenbohm, A.; Morrell, N.; Romano, P.; Sani, E.; Terreran, G.; Tornikoski, M.; Vercellone, S.; Vietri, A. Hunting for the nature of the enigmatic narrow-line Seyfert 1 galaxy PKS 2004-447. arXiv e-prints 2021, p. arXiv:2106.12536, [arXiv:astro-ph.HE/2106.12536].
- Foschini et al. (2015) Foschini, L.; Berton, M.; Caccianiga, A.; Ciroi, S.; Cracco, V.; Peterson, B.M.; Angelakis, E.; Braito, V.; Fuhrmann, L.; Gallo, L.; Grupe, D.; Järvelä, E.; Kaufmann, S.; Komossa, S.; Kovalev, Y.Y.; Lähteenmäki, A.; Lisakov, M.M.; Lister, M.L.; Mathur, S.; Richards, J.L.; Romano, P.; Sievers, A.; Tagliaferri, G.; Tammi, J.; Tibolla, O.; Tornikoski, M.; Vercellone, S.; La Mura, G.; Maraschi, L.; Rafanelli, P. Properties of flat-spectrum radio-loud narrow-line Seyfert 1 galaxies. A&A 2015, 575, A13. doi:\changeurlcolorblack10.1051/0004-6361/201424972.
- Sulentic et al. (2015) Sulentic, J.W.; Martínez-Carballo, M.A.; Marziani, P.; del Olmo, A.; Stirpe, G.M.; Zamfir, S.; Plauchu-Frayn, I. 3C 57 as an atypical radio-loud quasar: implications for the radio-loud/radio-quiet dichotomy. MNRAS 2015, 450, 1916–1925, [1503.08295]. doi:\changeurlcolorblack10.1093/mnras/stv710.
- Negrete et al. (2018) Negrete, C.A.; Dultzin, D.; Marziani, P.; Esparza, D.; Sulentic, J.W.; del Olmo, A.; Martínez-Aldama, M.L.; García López, A.; D’Onofrio, M.; Bon, N.; Bon, E. Highly accreting quasars: The SDSS low-redshift catalog. A&A 2018, 620, A118, [arXiv:astro-ph.GA/1809.08310]. doi:\changeurlcolorblack10.1051/0004-6361/201833285.
- Marziani et al. (2019) Marziani, P.; del Olmo, A.; Martinez-Carballo, M.A.; Martinez-Aldama, M.L.; Stirpe, G.M.; Negrete, C.A.; Dultzin, D.; D’ Onofrio, M.; Bon, E.; Bon, N. Black hole mass estimates in quasars - A comparative analysis of high- and low-ionization lines. arXiv e-prints 2019, p. arXiv:1905.00617, [arXiv:astro-ph.GA/1905.00617].
- Wolf et al. (2020) Wolf, J.; Salvato, M.; Coffey, D.; Merloni, A.; Buchner, J.; Arcodia, R.; Baron, D.; Carrera, F.J.; Comparat, J.; Schneider, D.P.; Nandra, K. Exploring the diversity of Type 1 active galactic nuclei identified in SDSS-IV/SPIDERS. MNRAS 2020, 492, 3580–3601, [arXiv:astro-ph.HE/1911.01947]. doi:\changeurlcolorblack10.1093/mnras/staa018.
- Kovačević et al. (2010) Kovačević, J.; Popović, L.Č.; Dimitrijević, M.S. Analysis of Optical Fe II Emission in a Sample of Active Galactic Nucleus Spectra. ApJS 2010, 189, 15–36, [arXiv:astro-ph.CO/1004.2212]. doi:\changeurlcolorblack10.1088/0067-0049/189/1/15.
- Kovačević-Dojčinović and Popović (2015) Kovačević-Dojčinović, J.; Popović, L.Č. The Connections Between the UV and Optical Fe ii Emission Lines in Type 1 AGNs. ApJS 2015, 221, 35, [1509.03679]. doi:\changeurlcolorblack10.1088/0067-0049/221/2/35.
- Moore (1945) Moore, C.E. A Multiplet Table of Astrophysical Interest. Revised Edition. Part I - Table of Multiplets. Contributions from the Princeton University Observatory 1945, 20, 1–110.
- Marziani et al. (1996) Marziani, P.; Sulentic, J.W.; Dultzin-Hacyan, D.; Calvani, M.; Moles, M. Comparative Analysis of the High- and Low-Ionization Lines in the Broad-Line Region of Active Galactic Nuclei. ApJS 1996, 104, 37–+. doi:\changeurlcolorblack10.1086/192291.
- Punsly (2010) Punsly, B. The Redshifted Excess in Quasar C IV Broad Emission Lines. ApJ 2010, 713, 232–238, [1002.4681]. doi:\changeurlcolorblack10.1088/0004-637X/713/1/232.
- Kriss (1994) Kriss, G. Fitting Models to UV and Optical Spectral Data. Astronomical Data Analysis Software and Systems III, A.S.P. Conference Series 1994, 61, 437.
- Gaskell (2017) Gaskell, C.M. The case for cases B and C: intrinsic hydrogen line ratios of the broad-line region of active galactic nuclei, reddenings, and accretion disc sizes. MNRAS 2017, 467, 226–238, [arXiv:astro-ph.GA/1512.09291]. doi:\changeurlcolorblack10.1093/mnras/stx094.
- Baskin and Laor (2018) Baskin, A.; Laor, A. Dust inflated accretion disc as the origin of the broad line region in active galactic nuclei. MNRAS 2018, 474, 1970–1994, [arXiv:astro-ph.GA/1711.00025]. doi:\changeurlcolorblack10.1093/mnras/stx2850.
- Marinello et al. (2020) Marinello, M.; Overzier, R.A.; Röttgering, H.J.A.; Kurk, J.D.; De Breuck, C.; Vernet, J.; Wylezalek, D.; Stern, D.; Duncan, K.J.; Hatch, N.; Kashikawa, N.; Lin, Y.T.; Nemmen, R.S.; Saxena, A. VLT/SINFONI study of black hole growth in high-redshift radio-loud quasars from the CARLA survey. MNRAS 2020, 492, 1991–2016, [arXiv:astro-ph.GA/1911.08273]. doi:\changeurlcolorblack10.1093/mnras/stz3333.
- Davidson and Netzer (1979) Davidson, K.; Netzer, H. The emission lines of quasars and similar objects. Reviews of Modern Physics 1979, 51, 715–766. doi:\changeurlcolorblack10.1103/RevModPhys.51.715.
- Laor et al. (1997) Laor, A.; Fiore, F.; Elvis, M.; Wilkes, B.J.; McDowell, J.C. The Soft X-Ray Properties of a Complete Sample of Optically Selected Quasars. II. Final Results. ApJ 1997, 477, 93–+, [arXiv:astro-ph/9609164]. doi:\changeurlcolorblack10.1086/303696.
- Korista et al. (1997) Korista, K.; Baldwin, J.; Ferland, G.; Verner, D. An Atlas of Computed Equivalent Widths of Quasar Broad Emission Lines. ApJS 1997, 108, 401–+, [arXiv:astro-ph/9611220]. doi:\changeurlcolorblack10.1086/312966.
- Peterson et al. (2004) Peterson, B.M.; Ferrarese, L.; Gilbert, K.M.; Kaspi, S.; Malkan, M.A.; Maoz, D.; Merritt, D.; Netzer, H.; Onken, C.A.; Pogge, R.W.; Vestergaard, M.; Wandel, A. Central Masses and Broad-Line Region Sizes of Active Galactic Nuclei. II. A Homogeneous Analysis of a Large Reverberation-Mapping Database. ApJ 2004, 613, 682–699, [arXiv:astro-ph/0407299]. doi:\changeurlcolorblack10.1086/423269.
- Peterson (2017) Peterson, B.M. Space Telescope and Optical Reverberation Mapping Project: A Leap Forward in Reverberation Mapping. IAU Symposium, 2017, Vol. 324, IAU Symposium, pp. 215–218. doi:\changeurlcolorblack10.1017/S1743921316012680.
- Collin-Souffrin and Dumont (1989) Collin-Souffrin, S.; Dumont, A.M. Emission spectra of weakly photoionized media in active nuclei of galaxies. A&Ap 1989, 213, 29–48.
- Collin and Joly (2000) Collin, S.; Joly, M. The Fe II problem in NLS1s. NAR 2000, 44, 531–537, [arXiv:astro-ph/0005153]. doi:\changeurlcolorblack10.1016/S1387-6473(00)00093-2.
- Matsuoka et al. (2008) Matsuoka, Y.; Kawara, K.; Oyabu, S. Low-Ionization Emission Regions in Quasars: Gas Properties Probed with Broad O I and Ca II Lines. ApJ 2008, 673, 62–68, [0710.2954]. doi:\changeurlcolorblack10.1086/524193.
- Martínez-Aldama et al. (2015) Martínez-Aldama, M.L.; Dultzin, D.; Marziani, P.; Sulentic, J.W.; Bressan, A.; Chen, Y.; Stirpe, G.M. O I and Ca II Observations in Intermediate Redshift Quasars. ApJS 2015, 217, 3, [1501.04718]. doi:\changeurlcolorblack10.1088/0067-0049/217/1/3.
- Śniegowska et al. (2021) Śniegowska, M.; Marziani, P.; Czerny, B.; Panda, S.; Martínez-Aldama, M.L.; del Olmo, A.; D’Onofrio, M. High Metal Content of Highly Accreting Quasars. ApJ 2021, 910, 115, [arXiv:astro-ph.HE/2009.14177]. doi:\changeurlcolorblack10.3847/1538-4357/abe1c8.
- Bentz et al. (2013) Bentz, M.C.; Denney, K.D.; Grier, C.J.; Barth, A.J.; Peterson, B.M.; Vestergaard, M.; Bennert, V.N.; Canalizo, G.; De Rosa, G.; Filippenko, A.V.; Gates, E.L.; Greene, J.E.; Li, W.; Malkan, M.A.; Pogge, R.W.; Stern, D.; Treu, T.; Woo, J.H. The Low-luminosity End of the Radius-Luminosity Relationship for Active Galactic Nuclei. ApJ 2013, 767, 149, [arXiv:astro-ph.CO/1303.1742]. doi:\changeurlcolorblack10.1088/0004-637X/767/2/149.
- Martínez-Aldama et al. (2019) Martínez-Aldama, M.L.; Czerny, B.; Kawka, D.; Karas, V.; Panda, S.; Zajaček, M.; Życki, P.T. Can Reverberation-measured Quasars Be Used for Cosmology? ApJ 2019, 883, 170, [arXiv:astro-ph.CO/1903.09687]. doi:\changeurlcolorblack10.3847/1538-4357/ab3728.
- Du and Wang (2019) Du, P.; Wang, J.M. The Radius-Luminosity Relationship Depends on Optical Spectra in Active Galactic Nuclei. ApJ 2019, 886, 42, [arXiv:astro-ph.GA/1909.06735]. doi:\changeurlcolorblack10.3847/1538-4357/ab4908.
- D’Onofrio et al. (2021) D’Onofrio, M.; Marziani, P.; Chiosi, C. Past, present and Future of the Scaling Relations of Galaxies and Active Galactic Nuclei. arXiv e-prints 2021, p. arXiv:2109.06301, [arXiv:astro-ph.GA/2109.06301].
- Marziani et al. (2018) Marziani, P.; Dultzin, D.; Sulentic, J.W.; Del Olmo, A.; Negrete, C.A.; Martinez-Aldama, M.L.; D’Onofrio, M.; Bon, E.; Bon, N.; Stirpe, G.M. A main sequence for quasars. ArXiv e-prints 2018, arXiv180205575M, [1802.05575].
- Sulentic et al. (2016) Sulentic, J.W.; Marziani, P.; Del Olmo, A.; Zamfir, S. Balmer line shifts in quasars. ApSS 2016, 361, 55, [1512.06224]. doi:\changeurlcolorblack10.1007/s10509-015-2637-4.
- Sulentic et al. (2007) Sulentic, J.W.; Bachev, R.; Marziani, P.; Negrete, C.A.; Dultzin, D. C IV 1549 as an Eigenvector 1 Parameter for Active Galactic Nuclei. ApJ 2007, 666, 757–777, [arXiv:astro-ph/0705.1895]. doi:\changeurlcolorblack10.1086/519916.
- Laor et al. (1997) Laor, A.; Jannuzi, B.T.; Green, R.F.; Boroson, T.A. The Ultraviolet Properties of the Narrow-Line Quasar I ZW 1. ApJ 1997, 489, 656–+, [arXiv:astro-ph/9706264]. doi:\changeurlcolorblack10.1086/304816.
- Kozie-Wierzbowska et al. (2017a) Kozie-Wierzbowska, D.; Vale Asari, N.; Stasińska, G.; Sikora, M.; Goettems, E.I.; Wójtowicz, A. What Distinguishes the Host Galaxies of Radio-loud and Radio-quiet AGNs? ApJ 2017, 846, 42, [arXiv:astro-ph.GA/1709.09912]. doi:\changeurlcolorblack10.3847/1538-4357/aa8326.
- Kozie-Wierzbowska et al. (2017b) Kozie-Wierzbowska, D.; Stasińska, G.; Vale Asari, N.; Sikora, M.; Goettems, E.; Wójtowicz, A. Pair-matching of radio-loud and radio-quiet AGNs. Frontiers in Astronomy and Space Sciences 2017, 4, 39, [arXiv:astro-ph.GA/1711.00085]. doi:\changeurlcolorblack10.3389/fspas.2017.00039.
- Järvelä et al. (2018) Järvelä, E.; Lähteenmäki, A.; Berton, M. Near-infrared morphologies of the host galaxies of narrow-line Seyfert 1 galaxies. A&A 2018, 619, A69, [arXiv:astro-ph.GA/1807.02970]. doi:\changeurlcolorblack10.1051/0004-6361/201832876.
- Berton et al. (2019) Berton, M.; Congiu, E.; Ciroi, S.; Komossa, S.; Frezzato, M.; Di Mille, F.; Antón, S.; Antonucci, R.; Caccianiga, A.; Coppi, P.; Järvelä, E.; Kotilainen, J.; Lähteenmäki, A.; Mathur, S.; Chen, S.; Cracco, V.; La Mura, G.; Rafanelli, P. The Interacting Late-type Host Galaxy of the Radio-loud Narrow-line Seyfert 1 IRAS 20181-2244. AJ 2019, 157, 48, [arXiv:astro-ph.GA/1807.08953]. doi:\changeurlcolorblack10.3847/1538-3881/aaf5ca.
- Olguín-Iglesias et al. (2020) Olguín-Iglesias, A.; Kotilainen, J.; Chavushyan, V. The disc-like host galaxies of radio-loud narrow-line Seyfert 1s. MNRAS 2020, 492, 1450–1464, [arXiv:astro-ph.GA/1912.02746]. doi:\changeurlcolorblack10.1093/mnras/stz3549.
- Shin et al. (2013) Shin, J.; Woo, J.H.; Nagao, T.; Kim, S.C. The Chemical Properties of Low-redshift QSOs. ApJ 2013, 763, 58, [arXiv:astro-ph.CO/1211.6749]. doi:\changeurlcolorblack10.1088/0004-637X/763/1/58.
- Sulentic et al. (2014) Sulentic, J.W.; Marziani, P.; del Olmo, A.; Dultzin, D.; Perea, J.; Alenka Negrete, C. GTC spectra of z 2.3 quasars: comparison with local luminosity analogs. A&A 2014, 570, A96, [1406.5920]. doi:\changeurlcolorblack10.1051/0004-6361/201423975.
- Nagao et al. (2006) Nagao, T.; Maiolino, R.; Marconi, A. Gas metallicity in the narrow-line regions of high-redshift active galactic nuclei. A&A 2006, 447, 863–876, [arXiv:astro-ph/0508652]. doi:\changeurlcolorblack10.1051/00\- 04-63\- 61\- :20\- 054127.
- Marziani and Sulentic (1993) Marziani, P.; Sulentic, J.W. Evidence for a very broad line region in PG 1138+222. ApJ 1993, 409, 612–616, [arXiv:astro-ph/9210005]. doi:\changeurlcolorblack10.1086/172692.
- Sun and Shen (2015) Sun, J.; Shen, Y. Dissecting the Quasar Main Sequence: Insight from Host Galaxy Properties. ApJL 2015, 804, L15, [1503.08364]. doi:\changeurlcolorblack10.1088/2041-8205/804/1/L15.
- Du et al. (2016) Du, P.; Wang, J.M.; Hu, C.; Ho, L.C.; Li, Y.R.; Bai, J.M. The Fundamental Plane of the Broad-line Region in Active Galactic Nuclei. ApJL 2016, 818, L14, [1601.01391]. doi:\changeurlcolorblack10.3847/2041-8205/818/1/L14.
The Appendix shows the results of the CLOUDY simulations in the case of the restricted ranges 4500 – 4590 Å and 5200 – 5300 Å ( and through the paper).
Appendix A Restricted range