Scanpath Prediction on Information Visualisations
Abstract
We propose Unified Model of Saliency and Scanpaths (UMSS)– a model that learns to predict multi-duration saliency and scanpaths (i.e. sequences of eye fixations) on information visualisations. Although scanpaths provide rich information about the importance of different visualisation elements during the visual exploration process, prior work has been limited to predicting aggregated attention statistics, such as visual saliency. We present in-depth analyses of gaze behaviour for different information visualisation elements (e.g. Title, Label, Data) on the popular MASSVIS dataset. We show that while, overall, gaze patterns are surprisingly consistent across visualisations and viewers, there are also structural differences in gaze dynamics for different elements. Informed by our analyses, UMSS first predicts multi-duration element-level saliency maps, then probabilistically samples scanpaths from them. Extensive experiments on MASSVIS show that our method consistently outperforms state-of-the-art methods with respect to several, widely used scanpath and saliency evaluation metrics. Our method achieves a relative improvement in sequence score of 11.5 % for scanpath prediction, and a relative improvement in Pearson correlation coefficient of up to 23.6 % for saliency prediction. These results are auspicious and point towards richer user models and simulations of visual attention on visualisations without the need for any eye tracking equipment.
Index Terms:
Scanpath Prediction, Visual Saliency, Visual Attention, MASSVIS, Gaze Behaviour Analysis.1 Introduction
Despite the importance of human gaze in information visualisation, for example to study media quality [4] or visual decision-making [5], existing approaches to quantify users’ visual attention require special-purpose eye tracking equipment [6]. However, eye trackers may not always be available. They have to be calibrated to each user prior to first use [7], and accurate gaze estimation is limited to confined areas in front of the display [8]. A popular approach to overcome these limitations is to instead use computational models of visual attention that can predict attention distributions over an image, such as saliency maps, without the need for any eye tracking equipment [9]. Saliency modelling has been widely studied in computer vision [10, 11, 3, 12], but has also found applications in human-computer interaction (HCI), such as for visual analytics [6], optimising webpage designs [13], and re-targeting and thumbnailing on graphic designs [4].
Information visualisations are fundamentally different from natural images: they usually contain more text (e.g. titles, axis labels or legends) as well as larger areas with uniform colour and little to no texture (e.g. in bar plots or pie charts) [14]. These differences have triggered research into saliency models that are specifically geared to information visualisations, such as element-level saliency prediction [15]. However, saliency models are fundamentally limited in that they cannot predict the temporal dynamics of gaze behaviour.
Scanpath prediction is the task of predicting the sequence of fixations on an image [16, 14]. In contrast to saliency modelling, scanpath prediction inherently captures the stochastic and dynamic characteristics of visual attention over time. Due to the large variability of human gaze, accurately predicting scanpaths is profoundly challenging [9]. Prior methods for scanpath prediction have focused on natural scenes consisting of people and objects [17, 18], on webpages [13] or on graphical user interfaces [19]. To the best of our knowledge, scanpath prediction on information visualisations has not yet been explored. Modelling scanpaths on information visualisations can provide insights into both the rich spatial and temporal dynamics of human attention over time. As such, in contrast to saliency modelling, scanpath prediction can therefore help us better understand human visual behaviour while observing and visually processing information visualisations. Moreover, future work will be able to use our spatio-temporal models of attention for visualisation quality evaluation [20] or visualisation optimisation [21] without the need for any tedious and time-consuming eye tracking studies. Scanpath prediction methods on information visualisations can be utilised as a tool to simulate human attention, which allow user models and simulations of visual attention on visualisations without the need for eye tracking equipment.
Since there is currently limited work understanding gaze behaviour on visualisations, we fill this gap and lay the foundations for a new line of research on scanpath prediction on information visualisations. Inspired by similar investigations on natural images [22], we first conduct a systematic analysis of human gaze on visualisations from the widely used Massachusetts Massive Visualization Dataset (MASSVIS) [23]. Specifically, we analyse static and dynamic fixation density both across different visualisation elements – such as title, data, axes, or labels – as well as across viewers. We find that title and graphical elements receive a significant amount of attention, particularly at the onset of the visual inspection process. Afterwards, attention shifts to other textual elements, such as labels, followed by data-related components, such as annotations, legends or axes. Moreover, attention towards objects and data elements is stable across time.
Informed by these findings, we propose Unified Model of Saliency and Scanpaths (UMSS) – a method to predict saliency and scanpaths on information visualisations. The first stage of our method is the Multi-Duration Element Attention Model (MD-EAM), which is a novel approach to predict multi-duration element-level human attention maps under multiple viewing durations. The second stage of our method samples scanpaths from the multi-duration element-level human attention maps in a probabilistic way. Through extensive evaluations on MASSVIS, we show that the novel element-wise attention maps and the data-driven sampling strategy allow our method to generate scanpaths of significantly better quality than previous methods. Moreover, they consistently outperform state-of-the-art methods with respect to several widely-used scanpath evaluation metrics. Our method achieves a relative improvement of 11.5 % in the Sequence Score [18], and is best for the direction and position dimensions of MultiMatch [24]. In addition, our method establishes a new state-of-the-art performance on the closely linked saliency prediction task on MASSVIS. For example, it reaches a relative improvement of 23.6 % in the Pearson correlation coefficient under a 3-second viewing duration.
The contributions of our work are twofold. First, we present a systematic analysis of gaze dynamics on visualisation elements and reveal both consistencies across visualisations and viewers as well as structural differences between different visualisation elements. Second, we propose Unified Model of Saliency and Scanpaths (UMSS), the first unified method for predicting multi-duration visual saliency and scanpaths on information visualisations. Through extensive evaluations and a user study, we validate the effectiveness of our method, and report several fundamental findings of current scanpath metrics.
2 Related Work
Our work is related to previous works on (1) eye tracking for information visualisations, as well as to computational models for (2) visual saliency and (3) scanpath prediction.
2.1 Eye Tracking for Information Visualisations
Eye tracking is widely used in information visualisations and visual analytics [6, 25], given that eye gaze provides rich information about visual search and visual decision-making. For instance, Borkin et al. [23] assessed the key characteristics necessary to make visualisations recognisable. Some other literature have proposed eye-tracking based visual analytics approaches, such as word-sized visualisations [26] and under interactive visualisations [27]. These works demonstrated the importance of eye tracking as a means to better understand gaze behaviour while viewing static as well as a component of visual analytics tools for dynamic information visualisations. However, while eye trackers have become cheaper and more readily available, they are still far from being pervasive, and have to be calibrated to each user before first use [7], and often suffer from inaccuracies in everyday settings [28].
2.2 Computational Modelling of Visual Attention
Another line of work have addressed the limitation of eye-tracking equipment by proposing computational attention models. Visual attention modelling, also known as saliency modelling, is a highly active research area in computer vision. Itti et al. [10] proposed one of the first bottom-up-models, that is, models that only consider visual features from a scene or image. Since then, with large-scale annotated data from natural scenes becoming more easily available [29, 30], several works have shown significant improvements in visual attention modelling [30, 31, 32]. Multi-Duration Saliency Excited Model (MD-SEM), a method to capture attention at multiple viewing durations [22], is the first method to provide insights into how human attention changes over time. It bridges statistical-level saliency and individual-level scanpath. However, MD-SEM was proposed for natural images. Therefore, we first have to test the performance of it on information visualisations.
Saliency models are not only useful to model human visual attention on natural scenes but also more broadly applicable, such as to information visualisations [14], web pages [33, 5], mobile user interfaces [15, 34], or graphical user interfaces [19]. An increasing number of works have explored attention models in the context of information visualisations [35, 14]. Matzen et al. [14] proposed the data visualisation saliency (DVS) model that integrates bottom-up saliency maps of the Itti-Koch [10] model with text-region maps. In follow-up work, the same authors showed that attention towards outliers in data visualisations is heavily influenced by the task [36]. Complementing the notion of saliency, others have proposed visual importance as a concept to model the level of importance of different visualisation elements [37, 4]. Fosco et al. [21] proposed the Unified Model of Saliency and Importance (UMSI) – a method to predict importance maps across five types of graphic designs, including infographics, movie posters, mobile user interfaces, advertisements and webpages.
2.3 Scanpath Prediction
Models of visual attention only provide aggregated statistics, which has triggered research into the complementary task of scanpath prediction, that is, the task of predicting a sequence of fixations over a visual stimulus [10]. Scanpath prediction has been studied on different types of visual stimuli such as natural scenes [38, 39, 40, 18], virtual reality environments [41, 42], and graphical layouts [43]. Scanpath prediction is even more challenging given that fixation locations vary a lot across viewers [1]. Early work on scanpath prediction has typically used bottom-up saliency maps to predict gaze shifts [44, 45]. Other models have incorporated cognitively plausible mechanisms, such as inhibition of return [10, 46, 47] or foveal-peripheral saliency [16, 48, 3]. Boccignone et al. [9] have created a three-stage processing model with a centre-bias, a context/layout and an object-based model to predict scanpaths on natural scenes. Scanpath prediction under object detection [49, 17], visual search [18], or visual question-answering [50] is solved by reinforcement learning. Islam et al. [51] have proposed a multitask-learning framework for segmentation and scanpath prediction and showed that this approach can take advantage of a segmentation task. HMM-based scanpath prediction methods either split an image into several grids and regard each grid as a single state of observation [39], or classify the fixations into several states [38].
Large-scale datasets [29, 30] have paved the way for the use of deep learning methods for scanpath prediction on natural images. Saltinet [1] has extended saliency maps to saliency volumes, from which sample scanpaths were created. Kümmerer et al. [52] proposed the DeepGaze III model that allowed them to predict next fixations from saliency maps and previous scanpaths. PathGAN [2] was the first end-to-end model that relied on a generative adversarial network (GAN) for scanpath prediction. It combined a VGG network [53] to encode the image with an LSTM-based generator to predict scanpaths as well as a discriminator to distinguish the generated scanpaths from the real ones. Since insufficient gaze data are collected on visualisations, not surprisingly, no deep learning-based scanpath prediction model is designed for information visualisations. Therefore, it is essential to understand gaze behaviour on information visualisations and apply key findings to our model to alleviate the data scarcity problem.
3 Analysing Gaze Behaviour on Information Visualisations
Although eye tracking has been widely used in information visualisation research, the ways in which viewers look at visualisations remain under-explored. While several works have investigated eye movements on visualisations [23, 54], they have been limited to statistical results, rather far from revealing gaze dynamics. To shed more light on gaze dynamics while viewing information visualisations and to inform the design of our method for scanpath prediction, we conducted fundamental analyses on the Massachusetts Massive Visualization Dataset (MASSVIS).
3.1 The MASSVIS Dataset
MASSVIS [55, 23] consists of more than 5,000 static information visualisations and, as such, is one of the largest and most widely used datasets. It covers various types of visualisations, such as government reports, infographic blogs, news media websites, and scientific journals, and provides detailed annotations of visual elements, such as titles, data, axes and legends. The dataset also provides gaze data recorded from human viewers for a subset of 393 visualisations. Gaze data was collected during a memorability task that involved two phases: in the encoding phase, viewers were given 10 seconds to memorise each visualisation. In the following recognition phase, viewers were asked to recognise the visualisation within two seconds. Given that the visualisations were shown only 2 seconds for the recognition stage, we only analysed visualisations and gaze data in the encoding stage. The gaze data from the encoding stage were collected from 33 viewers and 16.7 viewers per visualisation. The mean scanpath length on this data was 37.4 fixations ( = 6.64) with a maximum of 55 fixations and the mean duration of 219.17 ms (see Figure 1 in supplementary material for fixation duration distribution). The element taxonomy and annotations were derived from MASSVIS [23]. The first fixations were discarded in every scanpath due to the experimental setting, where a fixation cross showed up right before the image appeared on the screen [23] (see Figure 2 in supplementary material). Regarding fixations that landed on white spaces, we followed a similar procedure to prior work [56] and removed 12.2% of total fixations that did not land on any visual elements.
3.2 Fixation Density on Visual Elements
Compared to natural images, information visualisations often contain larger areas with uniform colours as well as small, yet important, areas such as text [14]. It is therefore conceivable that, in addition to their information content, the relative saliency of individual visual elements influences if and when they are being looked at during the execution of a scanpath. It currently remains unclear, however, how salient different elements are overall as well as relative to each other. Furthermore, it is also unknown whether human attention is evenly distributed over a particular element over time or whether it changes as a function of when the visualisation element is more attractive. In the theory of visual world paradigm [57, 58], the proportion of fixations on each target is plotted over time to show how visual attention shifts to different items in a scene during the comprehension of spoken language. However, it requires each target to have a similar size, making it not applicable in information visualisations.
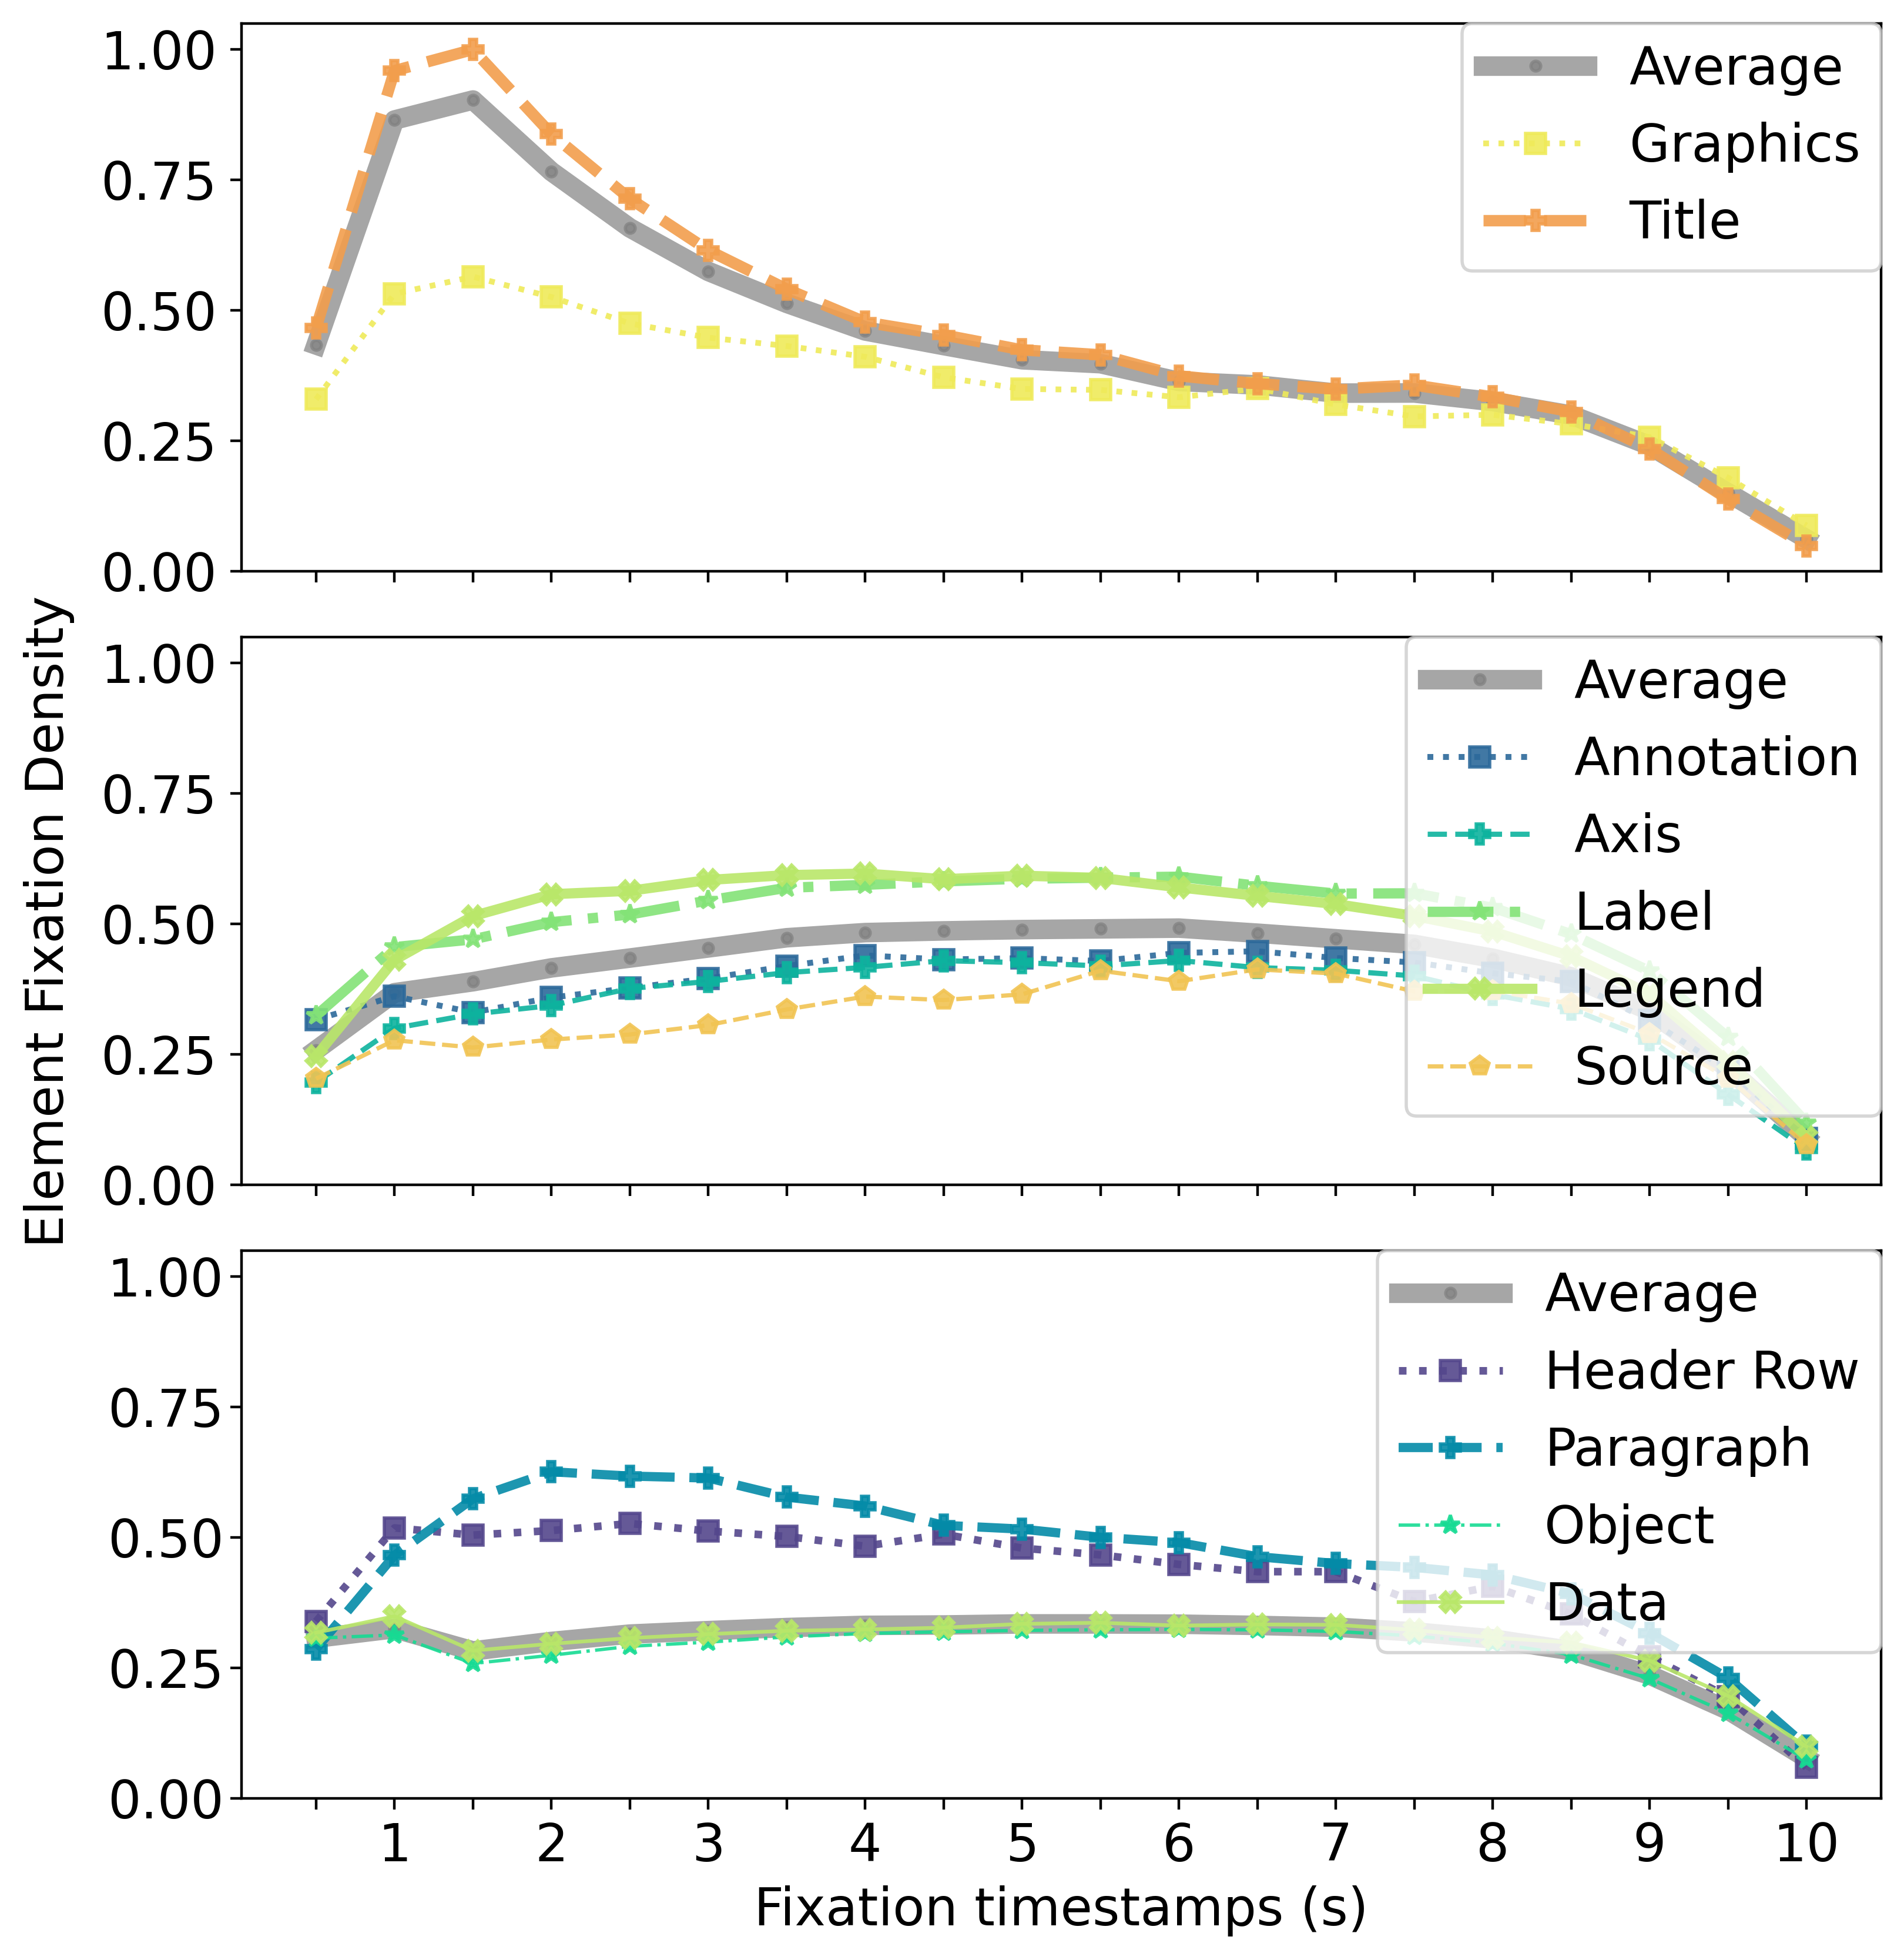
Inspired by this, we propose the Element Fixation Density (EFD) measure to quantify how visual attention evolves in arbitrary size of visual elements. EFD is defined as the accumulated number of gaze fixations divided by the covering area of fixation targets [59]. Derived from the term “Fixation Density” introduced by [59], the fixation target in EFD is set to the sum area of one kind of visualisation element, such as title, data, and legend. Inspired by previous attention dynamics analysis [22], we used k-means to cluster the elements that have similar attention dynamics. The distance of two elements and is calculated as , for every 0.5 seconds. Figure 2 shows the EFD of visual elements over time in a 0.5-second bin (-axis, 0 – 10 s), clustered into three groups by the k-means algorithm. As can be seen from the figure, Title and Graphics draw a substantial amount of attention in the beginning, then attention shifts to other textual elements (Label and Source etc.), and Data-related elements (Annotation, Legend and Axis). Meanwhile, attention towards Object and Data is consistent across time. See Figure 4 in supplementary material for example visualisations with annotated semantic regions. In the following paragraphs, we discuss when an element attracts attention in visualisations in detail.
Text (Title, Source etc., Paragraph, and Label). Previous work reported the bias of human attention towards text regions [14] but did not reveal the temporal preference of text elements. Figure 2 shows that most text elements (Title, Paragraph, Label) receive a large EFD. For text categories that are not directly related to data, such as Title and Paragraph, the attention first increases but then reaches a peak at 0.5 – 2.5 s. This suggests that viewers tend to examine these regions at the very beginning of observation, which is in line with previous analyses on the time to first fixation of different elements [60]. Then, the interest in these elements decreases afterwards, especially for Title. Data-related text elements such as Label and Source etc. reach the peak around 5.5 – 7s. The highest EFD across all elements appears in Label.
Data and Data-related Elements. Figure 2 shows that data-related elements (Legend, Annotation and Axis) have lower EFD than Legend, while the interest towards Legend is as great as for Title after 4 s. Data areas cover more than half of all pixels in visualisations [23] but their EFDs are the lowest among all elements. The attention towards Data decreases over 1 – 2 s, then gradually increases. This pattern also appears in data-related elements, and we notice the interest stays undiminished for an extended period. Legend reaches its peak around 2.5 s, and it stays at a high level of EFD until 6 s. Attention towards Annotation and Axis starts to grow at 4 s, and remains at a high level until 7 s. We find the peak of Data occurs around 6 s, which agrees with the trend of data-related elements. These findings suggest that viewers usually examine the Title in first glances, then pay attention to data-related elements. Around 5 – 7 s, viewers tend to observe visualisations by alternating between Data and descriptive elements.
Object. Objects are “either realistic photographs or abstract drawings or pictograms that can be recognised by human” [23]. Object persistence is a well-known recognition process [61]. We find that attention density within Object is comparatively low in memorability tasks. Even though Object takes 7.67 % of image space pixel-wise, the fixations make up only 2.16 %. The attention pattern towards Object is very similar to Data, which reaches the lowest EFD at 1 – 1.5 s and then peaks at 5 –7 s. We suggest this pattern may be caused by the well-known Inhibition of Return (IOR) [10]. Since Object contains relatively limited information compared to textual elements, viewers tend to postpone their attention towards the entire Object regions for a later time. After the effective period of IOR, the interest towards Object increases again.
3.3 Attention Dynamics for Individual Viewers
Our analyses so far focused on the temporal dynamics of gaze on visualisations across all viewers. However, it is well-known that, in general, gaze behaviour contains not only person-independent but also person-specific information [62]. We therefore analysed the individual scanpath trends of 10 viewers in MASSVIS, where all viewers observed at least 75% of all 393 visualisations. In subsection 3.2, we reported attention dynamics patterns for every kind of element. For a better understanding of attention dynamics, we merged the four text elements that have the same dynamic patterns into one. The final eight types of visual elements are A: Annotation, X: Axis, G: Graphics, L: Legend, O: Object, T: Title, S: Source, paragraph, label, and header row text, denoted as Source etc., D: Data.
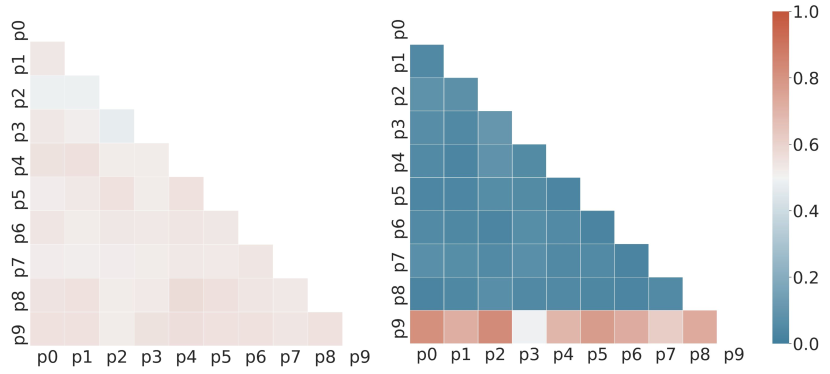
Sequence Score. We reported that attention dynamics towards elements are consistent across visualisations and viewers, but the individual-level analysis is the key to understanding scanpaths. Therefore, we converted a scanpath to a sequence of letters by assigning each fixation to a unique letter based on the element at which it was drawn. We used the Sequence Score [18] to quantitatively examine how similar scanpaths are within viewers. To compute the Sequence Score, the Needleman-Wunsch algorithm [63] was used to calculate the minimum number of operations needed to change one string into another. Each mismatch or gap between two strings penalises the final score. We observed a low similarity of Sequence Score within viewers in Figure 4, left, which means different viewers observe the same visualisation in quite different ways. Moreover, the Sequence Score within the first 5 seconds was also calculated. However, to our surprise, the Sequence Score within the first 5 seconds was even slightly lower than for the entire 10 seconds. This may suggest that the attention dynamics in the early observation period are more unstable than in the late observation period.
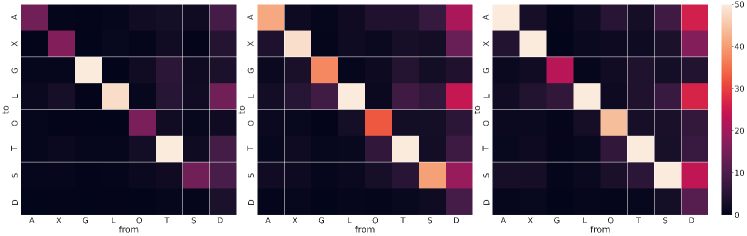
Transition Matrix. To give a panoptic view of individual attention dynamics on visualisations across images, we adopted the concept of transition matrix from Hidden Markov Models to describe gaze shifts. We computed the transition matrix of fixations in scanpath strings. Each letter in scanpaths was considered a hidden state, and changes between neighbour letters were state transitions. The average transition matrices across all viewers within three different durations are demonstrated in Figure 3, that is, before 3 s, 3 s to 5 s and from 5 s to 10 s. The diagonal values of the transition matrices stand for self-transition, which means the next fixation stays in the same kind of element as the previous fixation. The highest self-transition appeared in Legend (L), while Title (T) comes second. It indicates that people tend to keep reading legends and titles before jumping to other regions. The lowest self-transition appears in Objects (O) and Data (D). It indicates that people alternately read these regions or only glance at these regions rather than focus on them. We also found some consistent attention dynamics for elements. The gaze shifts from the Data are more likely shifting to Annotation (A), Axis (X), Legend (L) and Source etc. (S). The transitions from X to L, from T to G, and T to L are also relatively high. We also observe consistent attention dynamics across viewers under transition matrices. To quantify the similarity of individual dynamics, we computed the Kullback-Leibler divergence (KL) within ten viewers (see Figure 4, right). The lowest KL of 0.023 and the highest KL of 0.827 demonstrated substantial similarities of attention dynamics across individuals. It suggests that the individual-level attention dynamics of viewing information visualisations are consistent with those on the element level.
4 Unified Model of Saliency and Scanpaths (UMSS)
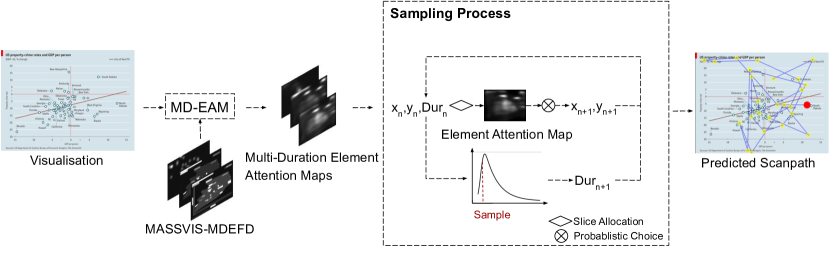
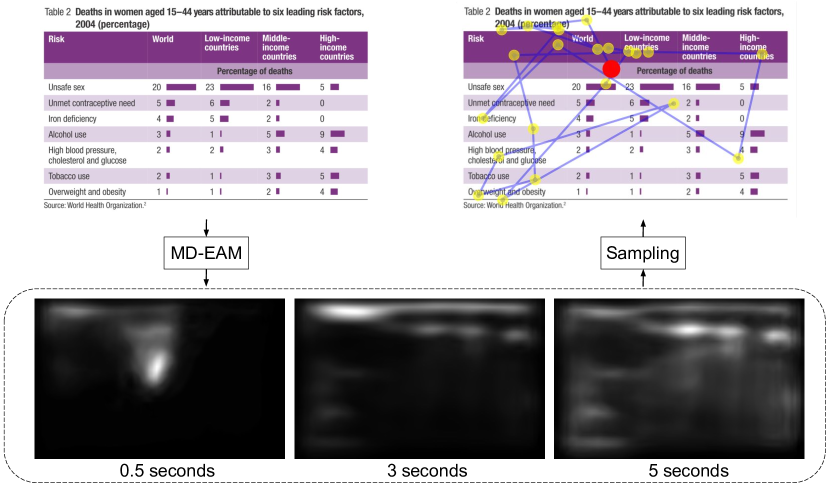
Our analyses yielded several insights that are important when designing a method for predicting scanpaths on information visualisations. We found that Title and Graphics receive a significant amount of attention, particularly at the onset of the visual inspection process. Afterwards, attention shifts to other textual elements (Label and Source), followed by data-related components (Annotation, Legend and Axis). Moreover, attention towards Object and Data is consistent at a stable level across time. Specifically, we found that though gaze patterns across viewers are highly consistent, individual scanpaths show significant variability. Taken together, these characteristics render the task of scanpath prediction particularly challenging. We therefore designed our Unified Model of Saliency and Scanpaths (UMSS) with the specific goal of preserving this stochastic nature of fixations within a scanpath. Our method combines two original contributions towards this goal: a Multi-Duration Element Attention Model (MD-EAM) that builds on the architecture of MD-SEM [22] but better preserves element-level spatial information, as well as a probabilistic approach to sample scanpaths from these attention maps. Figure 5 gives an overview of our method.
4.1 Multi-Duration Element Attention Model (MD-EAM)
Our analyses showed that attention dynamics on visualisation elements are large, which indicated that different elements are salient under different durations. From our analysis, we found out that where viewers tend to focus on a visualisation depends on how long they have been observing it (see Figure 2). Thus, a single saliency map is not representative enough to describe the gaze dynamic over time. MD-SEM [22] is the first and currently state-of-the-art method to model multi-duration saliency, that is, a model that can predict saliency maps for different viewing durations. The model learns temporal attention dynamics using a three-branch weight-sharing network, and predicts the attention distribution for a certain duration in each branch. From our perspective, there are two main drawbacks of MD-SEM: 1) Saliency dispersion to white spaces; and 2) lack of spatial information, such as element bounding boxes.
Thus, we leverage the above drawbacks by fine-tuning MD-SEM on element fixation density maps. As subsection 3.2 defines, the EFD of an element is calculated by the accumulated fixations divided by the element area. We assign the element EFD as the uniform value to all pixels in that element, and truncate fixations to three continuous observation periods (e.g. 0 – 0.5 s, 0.5 – 3 s, and 3 – 5 s). We denote these EFD maps as MASSVIS Multi-Duration Element Fixation Density (MASSVIS-MDEFD), and the fine-tuned MD-SEM model as MD-EAM. Thus, we leverage the above drawbacks by fine-tuning MD-SEM on the MASSVIS-MDEFD dataset. MD-EAM shows better capacity in preserving element-level attention distribution (see Figure 5 in supplementary material).
4.2 Probabilistic Scanpath Sampling
Previous work has reported that recurrent layer-based networks regressed to the image centre in scanpath prediction [1], which also occurred on information visualisations. To tackle the centre-regress problem, we propose a probabilistic sampling method to generate realistic scanpaths.
Duration Prediction. Previous literature [64] reported that the fixation duration is stimuli-dependent, and is close to the exponentially modified normal distribution (ex-Gaussian). In our method, we first estimate the ex-Gaussian parameters from training data, and sample durations from the distribution. We follow this strategy to estimate the three parameters, , , and for the ex-Gaussian distribution.
Slice Allocation. The scanpath length and durations were sampled from the distribution of the training data [1], while the number of fixations in each slice of the attention map of MD-EAM is based on fixation timestamps. As shown in Figure 5, the probability-based algorithm randomly samples fixations from multi-duration element attention maps. With prior knowledge of the length and duration of the scanpath, we can easily decide how many fixations are in each slice of the attention map. Inspired by Saltinet [1], each slice of attention maps is regarded as a probability distribution, and the first position in each slice is randomly sampled from the attention map.
To mimic gaze shift, we create a foveal mask by multiplying the allocated slice of the attention map with a Gaussian kernel centred at the fixation position . Then, the next fixation position stays in the foveal region of (see Algorithm 1). This process will continue multiple times in each slice of the attention map. The final scanpath is generated by concatenating fixations from all slices of attention maps.
5 Experiments
We carried out a series of experiments to compare the performance of UMSS with state-of-the-art saliency and scanpath prediction methods. Different ablated versions of the method itself were also evaluated.
| Methods | SS | ScanMatch | sTDE | DTW (2D) | MultiMatch | ||||||||
| mean | best | mean | best | mean | best | mean | best | shp | dir | len | pos | dur | |
| Human | 0.584 | 0.651† | 0.532 | 0.645† | 0.924 | 0.943† | 5311.23 | 3433.68† | 0.958 | 0.800 | 0.952 | 0.818 | 0.730 |
| PathGAN [2] | 0.390 | 0.503 | 0.232 | 0.255 | 0.910 | 0.937 | 6840.86 | 4495.89 | 0.974 | 0.671 | 0.964 | 0.767 | 0.691 |
| DCSM [3] | 0.400 | 0.580 | 0.328 | 0.458 | 0.879 | 0.908 | 6395.57 | 4292.44 | 0.924 | 0.724 | 0.902 | 0.756 | 0.755 |
| Saltinet [1] | 0.388 | 0.676 | 0.331 | 0.451 | 0.875 | 0.876 | 12758.51 | 10546.33 | 0.887 | 0.689 | 0.842 | 0.684 | 0.708 |
| UMSS (ours) | 0.446∗∗∗ | 0.724∗∗ | 0.387∗∗∗ | 0.503∗∗∗ | 0.906 | 0.925 | 6529.11 | 4683.44 | 0.943 | 0.728 | 0.935 | 0.771 | 0.712 |
† Scanpaths are not compared with themselves
5.1 Dataset
Since the provided fixations in the SALICON dataset [30] lacked timestamps, we retrieved fixation duration by applying the IDT (Identification by Dispersion Threshold) algorithm [65] on raw gaze data to prepare the SALICON-MD (Multi-Duration) dataset. We truncated fixations in MASSVIS [55, 23] to the first 5 seconds to make fair comparisons with baseline methods. MASSVIS-MD (Multi-Duration) is a dataset created according to the following gaze timestamps: 0 – 0.5 s, 0.5 – 3 s, and 3 – 5 s. We used this dataset to fine-tune MD-SEM [22] on information visualisations as a baseline. Then, we prepared MASSVIS-MDEFD from the element annotations of MASSVIS [23] with the same durations as MASSVIS-MD for training MD-EAM. To validate the generalisability of our model, we wanted to created train and evaluation sets that are balanced w.r.t. the source and visualisation type. Based on the naming convention of each sample from the MASSVIS dataset, we sorted all the files by name and selected every sixth file for the evaluation set. This assures the evaluation set is balanced by both source and visualisation type. More details are available in Table 2 in supplementary material. All evaluations on MASSVIS followed the same split policy.
5.2 Implementation Details & Model Training
The MD-EAM model was fine-tuned on MASSVIS-MDEFD for 6 epochs starting from the official CodeCharts1K weights of MD-SEM [22]. We preserved the original saliency maps at 0.5 s duration to supervise the MD-EAM branch to align to the centre bias phenomenon that appeared in the first fixations of human gaze data (see Figure 2 in supplementary material). For the other two branches of MD-EAM, we employed the MASSVIS Multi-Duration Element dataset at 3 s and 5 s. For duration estimation, the parameters of the ex-Gaussian distribution were computed as = 124.06, = 17.49, and = 89.37. All experiments were conducted on a single NVIDIA Tesla V100 GPU with 32 GB VRAM. See supplementary material for the training details.
For saliency prediction, we fine-tuned the MD-SEM model on MASSVIS-MD for six epochs starting from the official CodeCharts1K [22] weights. DVS [14] was used as-is to predict saliency maps on MASSVIS. For scanpath prediction, we trained PathGAN [2] on SALICON [30] and fine-tuned it on the MASSVIS dataset [23]. We used the official implementation of Saltinet [1] as-is to predict scanpaths on MASSVIS. For DCSM [3], we were in contact with the corresponding author who sent us all the predicted saliency maps and scanpaths – their codebase is not available publicly.
5.3 Scanpath Prediction
Since there is currently no scanpath prediction method for information visualisations, we compare our method to three state-of-the-art methods for natural scenes: DCSM [3], PathGAN [2] and Saltinet [1].
Metrics. Generated scanpaths were compared to human scanpaths using several evaluation metrics. We chose the five most currently used metrics to quantify the scanpath performance: Sequence Score [18], Dynamic Time Warping (DTW) [66], scaled Time-Delayed Embedding (sTDE) [67, 68], ScanMatch [69] and MultiMatch [24]. For Sequence Score, ScanMatch, DTW and sTDE, the mean and best evaluation scores were reported. While the mean evaluation scores are the averages of all human and predicted scanpath pairs, the best evaluation scores are the maximum of all pairs for each prediction [70, 50].
-
•
Dynamic Time Warping (DTW). DTW calculates an optimal match between two given sequences with specific rules, with smaller values indicating better performance [71]. In this paper, we computed DTW in two-dimensional position coordinates.
-
•
Scaled Time-Delay Embedding (sTDE). Time-delay embedding similarity refers to the inclusion of historical information in dynamic system models [72]. It is a value between 0 (worse) and 1 (better).
- •
-
•
Sequence Score (SS). The Sequence Score is normalized between 0 and 1. A detailed definition of Sequence Score can be found in subsection 3.3.
-
•
MultiMatch. MultiMatch [24] is a multidimensional vector-based approach. After the alignment of vector shapes, the length, position, direction, and duration of fixations are computed. All the obtained values are normalised between 0 (worse) and 1 (better).
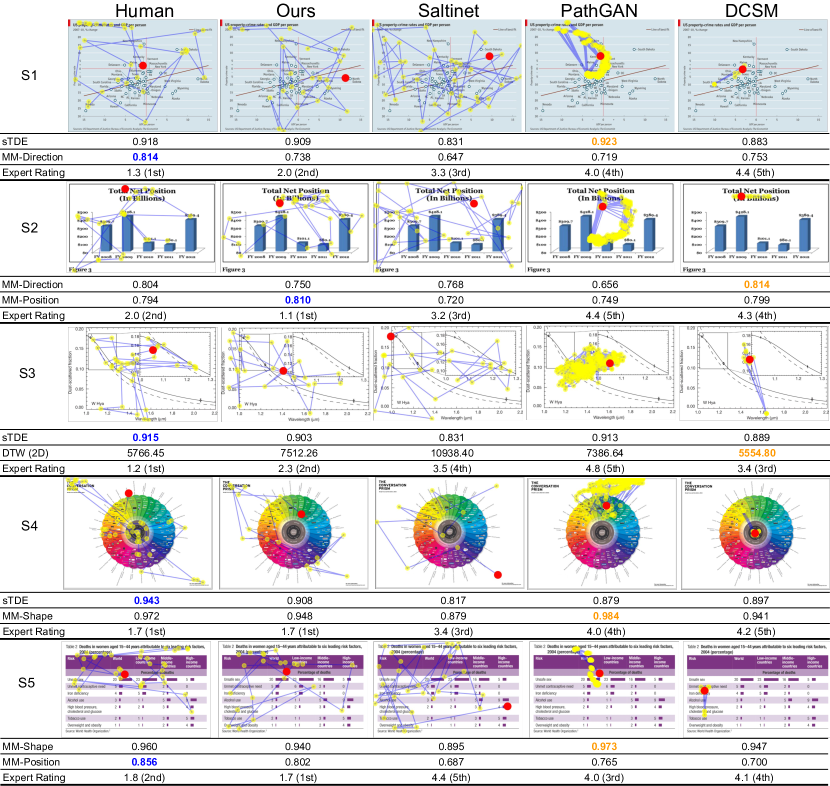
Results. Table I summarizes quantitative results on scanpath prediction for a 5-second ground truth. Metrics between real viewers on the same images are used as a golden standard of scanpath quantification, which is denoted as Human in Table I. Our method ranks first in Sequence Score, ScanMatch, MultiMatch-direction, and MultiMatch-position, and second in MultiMatch-shape, MultiMatch-length, and sTDE. For DCSM, only one prediction for each visualisation is generated. For PathGAN, Saltinet and UMSS, we generate the same number of predictions as human scanpaths for each visualisation (16.7 per visualisation). PathGAN and Saltinet are evaluated by conducting the Hungarian Algorithm [73] with original setting, while our UMSS is evaluated by averaging exhaustive matches between the generated scanpaths with human scanpaths. Quantitative results on scanpath prediction for the full 10-second ground truth can be found in supplementary material. Qualitative results are illustrated in Figure 6.
5.4 Saliency Prediction
We compare our saliency prediction results against the state-of-the-art DVS [14] model on visualisations, and two on natural scenes (MD-SEM [22] and DCSM [3]). The MASSVIS-MDEFD that we created for training MD-EAM is also evaluated as a baseline.
| Duration | Methods | NSS | CC | KL | SIM |
|---|---|---|---|---|---|
| 3 s | DCSM [3] | 0.678 | 0.293 | 1.228 | 0.409 |
| MD-SEM [22] | 1.086 | 0.474 | 0.840 | 0.485 | |
| DVS [14] | 1.106 | 0.456 | 0.933 | 0.449 | |
| MASSVIS-MDEFD | 1.208 | 0.502 | 1.250 | 0.476 | |
| MD-EAM (Ours) | 1.406∗∗∗ | 0.586∗∗∗ | 0.754∗∗∗ | 0.516∗∗∗ | |
| 5 s | DCSM [3] | 0.721 | 0.371 | 0.900 | 0.492 |
| MD-SEM [22] | 0.908 | 0.479 | 0.709 | 0.527 | |
| DVS [14] | 1.031 | 0.510 | 0.681 | 0.531 | |
| MASSVIS-MDEFD | 0.932 | 0.448 | 1.119 | 0.491 | |
| MD-EAM (Ours) | 1.024 | 0.514 | 0.689 | 0.530 |
Metrics. We use four popular metrics for evaluating performance: Normalized Scanpath Saliency (NSS), Pearson’s Correlation Coefficient (CC), Kullback-Leibler divergence (KL), and Similarity or histogram intersection (SIM). NSS is calculated on fixation maps, while CC, KL and SIM are calculated on saliency maps.
5.5 Ablation Studies
We further carried out two ablation studies to evaluate the effectiveness of our model. First, we replaced our MD-EAM with several saliency methods to see the influence of the saliency model on scanpaths. Then, we remove components in our scanpath sampling strategy to analyse how each component contributes to the final model.
| Methods | SS | SM | DTW (2D) | sTDE |
|---|---|---|---|---|
| Saltinet [1] | 0.388 | 0.331 | 12758.51 | 0.875 |
| DVS [14] + Saltinet | 0.398 | 0.381 | 7762.77 | 0.881 |
| MD-SEM [22] + Saltinet | 0.396 | 0.325 | 7932.85 | 0.897 |
| MD-EAM + Saltinet | 0.436 | 0.330 | 7286.56 | 0.903 |
| w/o Slice Allocation | 0.437 | 0.332 | 7213.87 | 0.903 |
| w/o Duration Prediction | 0.445 | 0.367 | 6570.35 | 0.905 |
| Full Model | 0.446∗∗∗ | 0.387∗∗∗ | 6529.11∗∗∗ | 0.906 |
5.5.1 Saliency Model
We compared the performance of our MD-EAM with two saliency models, that is, DVS [14] and MD-SEM [22], by plugging in the post-processing algorithm of Saltinet to each of the saliency models. Table III shows the effectiveness of our MD-EAM, which outperforms all the other methods in all scanpath metrics.
5.5.2 Scanpath Sampling Strategy
We evaluated the scanpath sampling strategy by removing its components. We replaced the fixation assigning strategy by evenly sampling fixations for each slice of multi-duration attention maps [1], and removed our Slice Allocation strategy. Table III shows that all metrics improved by adding Slice Allocation to the full model.
5.6 User Study
To gain further insights, we designed a study in which participants had to qualitatively compare human, ground-truth scanpaths from the MASSVIS dataset to predictions from Saltinet, DCSM, PathGAN, and UMSS (ours). Additionally, we included a second, randomly selected ground-truth scanpath as a Human baseline. For each trial in the evaluation, we randomly selected one human scanpath from the same visualisation as the Target. We randomly sampled scanpaths for the three baselines where multiple scanpaths are existed (Saltinet, UMSS, and Human), while PathGAN and DSCM produced only a single scanpath. Study participants were asked to compare the five baselines to the human Target by ranking the generated scanpaths from 1 to 5, where 1 = most similar and 5 = most dissimilar (see Figure 10 in supplementary material). The presentation order of the five baselines was counterbalanced using a latin-square study design. The study contained 40 trials, i.e. 40 visualisations from the MASSVIS evaluation set. The duration of the entire study was around 30 minutes and participants were compensated € 10 for participation.
We recruited ten researchers from our university who were familiar with gaze data and had experience in eye-tracking studies. Results showed that the Human baseline had the highest mean ranking of 1.53 ( = 0.81). The second mean ranking was achieved by UMSS (ours) with 1.98 ( = 0.96). Saltinet, DCSM, and PathGAN had a mean ranking of 3.58 ( = 0.97), 3.73 ( = 1.01), and 4.18 ( = 1.01). The highest mean expert rating of the three scanpath prediction baselines is only 3.66 ( = 0.99), which is significantly lower than UMSS (t (638) = 21.89, p < 0.001). Five examples from our study are illustrated in Figure 6. Upon completing all trials, we asked participants to provide qualitative feedback on the most important characteristics they used in their subjective evaluation. From the subjective feedback that justified similarity of scanpaths, participants often mentioned “Text labels in the Visualization”, “the movement of the path and the area it covered”. Some frequently mentioned characteristics that made scanpaths dissimilar were “Too crowded scan paths, too widespread scanpaths” and “Frequent and fast changes in direction”.
6 Discussion
Experiment Results. To the best of our knowledge, our method is the first to predict human scanpaths on information visualisations. We first compared UMSS to three state-of-the-art methods (PathGAN [2], DCSM [3], and Saltinet [1]) using five popular evaluation metrics: the Sequence Score [18], DTW [66], sTDE [67, 68], ScanMatch [69], and MultiMatch [24] (see Table I). In terms of the Sequence Score, which converts fixations to characters that represent semantic regions, our method outperformed the others with a relative improvement of 11.5 % by mean and 10.33 % by best. Our method also achieved the best performance for ScanMatch and for two dimensions of MultiMatch (direction and position). As for the remaining evaluation metrics, our method generally ranked second place, and there was no single method that outperformed all others for all metrics. For predicting fixation durations, our method ranks second. To our surprise, DCSM [3] exceeds the human baseline (0.755 vs 0.730), which indicates that the variance of fixation duration across human viewers is rather large. However, it is important to note that current scanpath evaluation metrics have been developed for natural scenes. Therefore, it is possible that some metrics do not work as well for quantifying scanpath quality on information visualisations. This naturally leads to the question of Which method is better on information visualisations?, and more fundamentally, Which evaluation metrics are suited for scanpath prediction on information visualisations?
Scanpath Metrics. As discussed above, current scanpath metrics are devised for natural scenes and have not been tested on information visualisations. Moreover, the quantitative rankings (Table I) and human ratings (Figure 6) disagree with which method can produce human-like scanpaths better. Therefore, it is necessary to take a deep look into how well current scanpath metrics work on information visualisations. Our user study gave a clear answer to which method predicts scanpaths that are perceived as most natural or human-like, and which metrics are closer to human ratings on information visualisations. Our method is the second most comparable ( = 1.98, = 0.96), directly following the human baseline ( = 1.54, = 0.80), and is significantly closer to human scanpaths than any existing scanpath prediction baselines. The scanpaths predicted by UMSS are visually more similar to human scanpaths, which is in agreement with expert ratings from our user study. Saltinet [1] is the next preferred method, but closer visual inspection of the scanpaths reveals that many fixations are scattered throughout the image, including also in white spaces (see Figure 6). The scanpaths produced by DCSM [3] that achieved the highest score in terms of DTW, as well as PathGAN [2] that achieved the highest score for sDTE and two dimensions of MultiMatch, are very different from a qualitative point of view: Fixations predicted by DCSM are clustered in several smaller regions, while those predicted by PathGAN are clustered in the centre of the visualisation (see Figure 6). This shows that DCSM and PathGAN fail to predict scanpaths that are rated as human-like, although they rank first in some scanpath metrics.
After comparing the quantitative results and our user study (see Figure 6 and Figure 6 in supplementary material), we noticed that the sTDE, DTW, and MultiMatch metrics are often in contradiction with the expert ratings from our user study. These metrics can achieve the highest scores even if expert ratings are low. This phenomenon explains why our method achieved promising results in ScanMatch and Sequence Score, but didn’t outperform the other methods in sTDE, DTW, and MultiMatch (see Table I). Taking these quantitative and qualitative findings together, only a few of existing metrics (Sequence Score and ScanMatch) agree with expert ratings when evaluating predicted scanpaths on information visualisations. Metrics that evaluate pixel-wise distances between scanpaths, such as MultiMatch, DTW and sTDE, do not fully capture the quality of human scanpaths. This is, in part, due to the nature of the visual stimuli. For natural images, information is often less structured and fixations can be found anywhere. In contrast to natural images, the semantic regions in information visualisations are separated by the white spaces, and fixations are much more likely to be inside these semantic regions, rather than white spaces. In contrast, metrics that take the semantic regions of fixations into account, such as the Sequence Score, are more consistent with expert ratings. The auspicious results of our user study suggest that – despite the fact that some existing metrics seem to show that our method does not outperform others – UMSS is a significant step towards predicting scanpaths on information visualisations that are more natural and human-like.
Scanpaths and Saliency. Table II shows that MD-EAM achieves the highest saliency metrics for the 3-second ground truth, and shares the first place with DVS [14] for the 5-second ground truth. Multi-duration saliency methods have an advantage in flexibility, that is, MD-EAM is competitive for every duration. Furthermore, Table III shows that MD-EAM outperforms the remaining Saltinet-based methods in Sequence Score, DTW, and sTDE. This indicates that for those methods that sampled from saliency maps, the better the saliency maps, the better scanpaths can be predicted. In summary, this work predicts human-like scanpaths on information visualisations and shows powerful performance in multi-duration saliency prediction.
Gaze Behaviour on Information Visualisations. In Section 3, we analysed gaze behaviour on the MASSVIS dataset and concluded that viewers tend to focus on a visualisation differently depending on how long they have been observing it. We found that the Sequence Scores across viewers was only 0.4 – 0.6 (see Figure 4). This suggests that viewers’ gaze behaviour on information visualisations is subject to a considerable amount of variability. Another finding specific to information visualisations is that different visualisation elements are salient under different viewing durations. This explains why our method reaches state-of-the-art performance. MD-EAM learns the dynamics of gaze behaviour on information visualisations, and minimises the information loss when generating scanpaths from the saliency maps.
6.1 Limitations
Due to the data scarcity problem of gaze data under free-viewing condition on information visualisations, we only analysed and trained our scanpath prediction model for memorability tasks. Since viewers were asked to memorise as much information as possible, attention towards textual regions such as titles might be preferable than free-viewing conditions. Given that top-down attention plays an important role in visualisations, it is crucial to understand top-down attention behaviours.
We also assumed that all elements in information visualisations are known as prior knowledge. This is a reasonable assumption on visualisations, since they are artificial and contain well-structured data. However, incorrect annotations or detection of its constituting elements will decrease the performance of our scanpath sampling strategy. Element information from MASSVIS is manually annotated, but, in practice, a good object detection model to automatically retrieve annotations is necessary to visually parse and decode information visualisation that do no have these annotations.
7 Conclusion
In this work, we proposed Unified Model of Saliency and Scanpaths (UMSS), the first method designed to predict realistic scanpaths on information visualisations. We systematically analysed the element-level attention dynamics on information visualisations, and revealed consistencies across visualisations and viewers. Our novel multi-duration element attention maps and data-driven sampling strategy allowed our model to generate scanpaths of significantly better quality than previous methods. Our method reached the state of the art on both saliency and scanpath prediction tasks on MASSVIS. In conclusion, our work provided a new perspective towards scanpath prediction on information visualisations and points towards novel computational methods to better predict human scanpaths without the need for eye tracking equipment.
Acknowledgments
Y. Wang was funded by the Deutsche Forschungsgemeinschaft (DFG, German Research Foundation) - Project-ID 251654672 - TRR 161. M. Bâce was funded by a Swiss National Science Foundation (SNSF) Early Postdoc. Mobility Fellowship (grant number 199991). A. Bulling was funded by the European Research Council (ERC; grant agreement 801708).
The authors would like to thank Anelise Newman for providing training and evaluation details about MDSEM, Wentao Bao for providing DCSM predictions on MASSVIS, Dominike Thomas for paper editing support, Sruthi Radhakrishnan and Saiteja Malyala for developing a scanpath visualisation toolbox for MASSVIS, Lei Shi for assistance in the review process, as well as Zhiming Hu and Nils Rodrigues for helpful comments on an earlier paper draft.
References
- Assens Reina et al. [2017] M. Assens Reina, X. Giro-i Nieto, K. McGuinness, and N. E. O’Connor, “Saltinet: Scan-path prediction on 360 degree images using saliency volumes,” in Proceedings of the IEEE International Conference on Computer Vision Workshops, 2017, pp. 2331–2338.
- Assens et al. [2018] M. Assens, X. Giro-i Nieto, K. McGuinness, and N. E. O’Connor, “Pathgan: visual scanpath prediction with generative adversarial networks,” in Proceedings of the European Conference on Computer Vision (ECCV), 2018, pp. 406–422.
- Bao and Chen [2020] W. Bao and Z. Chen, “Human scanpath prediction based on deep convolutional saccadic model,” Neurocomputing, vol. 404, pp. 154–164, 2020.
- Bylinskii et al. [2017] Z. Bylinskii, N. W. Kim, P. O’Donovan, S. Alsheikh, S. Madan, H. Pfister, F. Durand, B. Russell, and A. Hertzmann, “Learning visual importance for graphic designs and data visualizations,” in Proceedings of the 30th Annual ACM symposium on user interface software and technology, 2017, pp. 57–69.
- Feit et al. [2020] A. M. Feit, L. Vordemann, S. Park, C. Berube, and O. Hilliges, “Detecting relevance during decision-making from eye movements for ui adaptation,” in ACM Symposium on Eye Tracking Research and Applications, 2020, pp. 1–11.
- Kurzhals et al. [2014] K. Kurzhals, B. Fisher, M. Burch, and D. Weiskopf, “Evaluating visual analytics with eye tracking,” in Proceedings of the Fifth Workshop on Beyond Time and Errors: Novel Evaluation Methods for Visualization, 2014, pp. 61–69.
- Harezlak et al. [2014] K. Harezlak, P. Kasprowski, and M. Stasch, “Towards accurate eye tracker calibration - methods and procedures,” in KES, 2014.
- Feit et al. [2017] A. Feit, S. Williams, A. Toledo, A. Paradiso, H. Kulkarni, S. K. Kane, and M. Morris, “Toward everyday gaze input: Accuracy and precision of eye tracking and implications for design,” Proceedings of the 2017 CHI Conference on Human Factors in Computing Systems, 2017.
- Boccignone et al. [2019] G. Boccignone, V. Cuculo, and A. D’Amelio, “How to look next? a data-driven approach for scanpath prediction,” in International Symposium on Formal Methods. Springer, 2019, pp. 131–145.
- Itti et al. [1998] L. Itti, C. Koch, and E. Niebur, “A model of saliency-based visual attention for rapid scene analysis,” IEEE Transactions on pattern analysis and machine intelligence, vol. 20, no. 11, pp. 1254–1259, 1998.
- Cornia et al. [2016] M. Cornia, L. Baraldi, G. Serra, and R. Cucchiara, “Multi-level net: A visual saliency prediction model,” in European Conference on Computer Vision. Springer, 2016, pp. 302–315.
- Droste et al. [2020] R. Droste, J. Jiao, and J. A. Noble, “Unified image and video saliency modeling,” arXiv preprint arXiv:2003.05477, 2020.
- Pang et al. [2016] X. Pang, Y. Cao, R. W. Lau, and A. B. Chan, “Directing user attention via visual flow on web designs,” ACM Transactions on Graphics (TOG), vol. 35, no. 6, pp. 1–11, 2016.
- Matzen et al. [2017a] L. E. Matzen, M. J. Haass, K. M. Divis, Z. Wang, and A. T. Wilson, “Data visualization saliency model: A tool for evaluating abstract data visualizations,” IEEE transactions on visualization and computer graphics, vol. 24, no. 1, pp. 563–573, 2017.
- Gupta et al. [2018] P. Gupta, S. Gupta, A. Jayagopal, S. Pal, and R. Sinha, “Saliency prediction for mobile user interfaces,” in 2018 IEEE Winter Conference on Applications of Computer Vision (WACV). IEEE, 2018, pp. 1529–1538.
- Wang et al. [2017] Y. Wang, B. Wang, X. Wu, and L. Zhang, “Scanpath estimation based on foveated image saliency,” Cognitive processing, vol. 18, no. 1, pp. 87–95, 2017.
- Pirinen and Sminchisescu [2018] A. Pirinen and C. Sminchisescu, “Deep reinforcement learning of region proposal networks for object detection,” in Proceedings of the IEEE Conference on Computer Vision and Pattern Recognition, 2018, pp. 6945–6954.
- Yang et al. [2020] Z. Yang, L. Huang, Y. Chen, Z. Wei, S. Ahn, G. Zelinsky, D. Samaras, and M. Hoai, “Predicting goal-directed human attention using inverse reinforcement learning,” in Proceedings of the IEEE/CVF Conference on Computer Vision and Pattern Recognition, 2020, pp. 193–202.
- Xu et al. [2016] P. Xu, Y. Sugano, and A. Bulling, “Spatio-temporal modeling and prediction of visual attention in graphical user interfaces,” in Proc. ACM SIGCHI Conference on Human Factors in Computing Systems (CHI), 2016, pp. 3299–3310.
- Behrisch et al. [2018] M. Behrisch, M. Blumenschein, N. W. Kim, L. Shao, M. El-Assady, J. Fuchs, D. Seebacher, A. Diehl, U. Brandes, H. Pfister et al., “Quality metrics for information visualization,” in Computer Graphics Forum, vol. 37, no. 3. Wiley Online Library, 2018, pp. 625–662.
- Fosco et al. [2020a] C. Fosco, V. Casser, A. K. Bedi, P. O’Donovan, A. Hertzmann, and Z. Bylinskii, “Predicting visual importance across graphic design types,” in Proceedings of the 33rd Annual ACM Symposium on User Interface Software and Technology, 2020, pp. 249–260.
- Fosco et al. [2020b] C. Fosco, A. Newman, P. Sukhum, Y. B. Zhang, N. Zhao, A. Oliva, and Z. Bylinskii, “How much time do you have? modeling multi-duration saliency,” in Proceedings of the IEEE/CVF Conference on Computer Vision and Pattern Recognition, 2020, pp. 4473–4482.
- Borkin et al. [2015] M. A. Borkin, Z. Bylinskii, N. W. Kim, C. M. Bainbridge, C. S. Yeh, D. Borkin, H. Pfister, and A. Oliva, “Beyond memorability: Visualization recognition and recall,” IEEE transactions on visualization and computer graphics, vol. 22, no. 1, pp. 519–528, 2015.
- Jarodzka et al. [2010] H. Jarodzka, K. Holmqvist, and M. Nyström, “A vector-based, multidimensional scanpath similarity measure,” in Proceedings of the 2010 symposium on eye-tracking research & applications, 2010, pp. 211–218.
- Burch et al. [2017] M. Burch, L. Chuang, B. Fisher, A. Schmidt, and D. Weiskopf, Eye tracking and visualization: Foundations, Techniques, and applications. etvis 2015. Springer, 2017.
- Beck et al. [2015] F. Beck, T. Blascheck, T. Ertl, and D. Weiskopf, “Word-sized eye-tracking visualizations,” in Workshop on Eye Tracking and Visualization. Springer, 2015, pp. 113–128.
- Nguyen et al. [2015] T.-H. D. Nguyen, M. S. El-Nasr, and D. M. Isaacowitz, “Interactive visualization for understanding of attention patterns,” in Workshop on Eye Tracking and Visualization. Springer, 2015, pp. 23–39.
- Li et al. [2019] W. Li, Q. Dong, H. Jia, S. Zhao, Y. Wang, L. Xie, Q. Pan, F. Duan, and T. Liu, “Training a camera to perform long-distance eye tracking by another eye-tracker,” IEEE Access, vol. 7, pp. 155 313–155 324, 2019.
- Xu et al. [2015] P. Xu, K. A. Ehinger, Y. Zhang, A. Finkelstein, S. R. Kulkarni, and J. Xiao, “Turkergaze: Crowdsourcing saliency with webcam based eye tracking,” arXiv preprint arXiv:1504.06755, 2015.
- Jiang et al. [2015] M. Jiang, S. Huang, J. Duan, and Q. Zhao, “Salicon: Saliency in context,” in Proceedings of the IEEE conference on computer vision and pattern recognition, 2015, pp. 1072–1080.
- Kümmerer et al. [2017] M. Kümmerer, T. Wallis, and M. Bethge, “Deepgaze ii: Predicting fixations from deep features over time and tasks,” Journal of Vision, vol. 17, no. 10, pp. 1147–1147, 2017.
- Cornia et al. [2018] M. Cornia, L. Baraldi, G. Serra, and R. Cucchiara, “Predicting human eye fixations via an lstm-based saliency attentive model,” IEEE Transactions on Image Processing, vol. 27, no. 10, pp. 5142–5154, 2018.
- Shen and Zhao [2014] C. Shen and Q. Zhao, “Webpage saliency,” in European conference on computer vision. Springer, 2014, pp. 33–46.
- Leiva et al. [2020] L. A. Leiva, Y. Xue, A. Bansal, H. R. Tavakoli, T. Köroðlu, J. Du, N. R. Dayama, and A. Oulasvirta, “Understanding visual saliency in mobile user interfaces,” in 22nd International Conference on Human-Computer Interaction with Mobile Devices and Services, 2020, pp. 1–12.
- Micallef et al. [2017] L. Micallef, G. Palmas, A. Oulasvirta, and T. Weinkauf, “Towards perceptual optimization of the visual design of scatterplots,” IEEE Transactions on Visualization and Computer Graphics, vol. 23, no. 6, pp. 1588–1599, 2017.
- Matzen et al. [2020] L. Matzen, K. Divis, D. Cronin, and M. Haass, “Task matters when scanning data visualizations,” arXiv preprint arXiv:2009.14465, 2020.
- O’Donovan et al. [2014] P. O’Donovan, A. Agarwala, and A. Hertzmann, “Learning layouts for single-pagegraphic designs,” IEEE transactions on visualization and computer graphics, vol. 20, no. 8, pp. 1200–1213, 2014.
- Coutrot et al. [2018] A. Coutrot, J. H. Hsiao, and A. B. Chan, “Scanpath modeling and classification with hidden markov models,” Behavior research methods, vol. 50, no. 1, pp. 362–379, 2018.
- Verma and Sen [2019] A. Verma and D. Sen, “Hmm-based convolutional lstm for visual scanpath prediction,” in 2019 27th European Signal Processing Conference (EUSIPCO). IEEE, 2019, pp. 1–5.
- Xia et al. [2019] C. Xia, J. Han, F. Qi, and G. Shi, “Predicting human saccadic scanpaths based on iterative representation learning,” IEEE Transactions on Image Processing, vol. 28, no. 7, pp. 3502–3515, 2019.
- Hu et al. [2020] Z. Hu, S. Li, C. Zhang, K. Yi, G. Wang, and D. Manocha, “Dgaze: Cnn-based gaze prediction in dynamic scenes,” IEEE Transactions on Visualization and Computer Graphics (TVCG), vol. 26, no. 5, pp. 1902–1911, 2020.
- Hu et al. [2021] Z. Hu, A. Bulling, S. Li, and G. Wang, “FixationNet: Forecasting eye fixations in task-oriented virtual environments,” IEEE Transactions on Visualization and Computer Graphics (TVCG), vol. 27, no. 5, pp. 2681–2690, 2021.
- Jokinen et al. [2020] J. P. Jokinen, Z. Wang, S. Sarcar, A. Oulasvirta, and X. Ren, “Adaptive feature guidance: Modelling visual search with graphical layouts,” International Journal of Human-Computer Studies, vol. 136, p. 102376, 2020.
- Brockmann and Geisel [2000] D. Brockmann and T. Geisel, “The ecology of gaze shifts,” Neurocomputing, vol. 32, pp. 643–650, 2000.
- Boccignone and Ferraro [2010] G. Boccignone and M. Ferraro, “Gaze shifts as dynamical random sampling,” in 2010 2nd European Workshop on Visual Information Processing (EUVIP). IEEE, 2010, pp. 29–34.
- Zanca et al. [2019] D. Zanca, S. Melacci, and M. Gori, “Gravitational laws of focus of attention,” IEEE transactions on pattern analysis and machine intelligence, vol. 42, no. 12, pp. 2983–2995, 2019.
- Sun et al. [2019] W. Sun, Z. Chen, and F. Wu, “Visual scanpath prediction using ior-roi recurrent mixture density network,” IEEE Transactions on Pattern Analysis and Machine Intelligence, vol. 43, no. 6, pp. 2101–2118, 2019.
- Wloka et al. [2018] C. Wloka, I. Kotseruba, and J. K. Tsotsos, “Active fixation control to predict saccade sequences,” in Proceedings of the IEEE Conference on Computer Vision and Pattern Recognition, 2018, pp. 3184–3193.
- Mathe et al. [2016] S. Mathe, A. Pirinen, and C. Sminchisescu, “Reinforcement learning for visual object detection,” in Proceedings of the IEEE Conference on Computer Vision and Pattern Recognition, 2016, pp. 2894–2902.
- Chen et al. [2021] X. Chen, M. Jiang, and Q. Zhao, “Predicting human scanpaths in visual question answering,” in Proceedings of the IEEE/CVF Conference on Computer Vision and Pattern Recognition, 2021, pp. 10 876–10 885.
- Islam et al. [2020] M. Islam, V. Vibashan, C. M. Lim, and H. Ren, “St-mtl: Spatio-temporal multitask learning model to predict scanpath while tracking instruments in robotic surgery,” Medical Image Analysis, vol. 67, p. 101837, 2020.
- Kümmerer et al. [2022] M. Kümmerer, M. Bethge, and T. S. Wallis, “Deepgaze iii: Modeling free-viewing human scanpaths with deep learning,” Journal of Vision, vol. 22, no. 5, pp. 7–7, 2022.
- Simonyan and Zisserman [2015] K. Simonyan and A. Zisserman, “Very deep convolutional networks for large-scale image recognition,” in International Conference on Learning Representations (ICLR), 2015.
- Matzen et al. [2017b] L. E. Matzen, M. J. Haass, K. M. Divis, and M. C. Stites, “Patterns of attention: How data visualizations are read,” in International Conference on Augmented Cognition. Springer, 2017, pp. 176–191.
- Borkin et al. [2013] M. A. Borkin, A. A. Vo, Z. Bylinskii, P. Isola, S. Sunkavalli, A. Oliva, and H. Pfister, “What makes a visualization memorable?” IEEE transactions on visualization and computer graphics, vol. 19, no. 12, pp. 2306–2315, 2013.
- Wang et al. [2022] Y. Wang, M. Koch, M. Bâce, D. Weiskopf, and A. Bulling, “Impact of gaze uncertainty on aois in information visualisations,” in 2022 Symposium on Eye Tracking Research and Applications, 2022, pp. 1–6.
- Huettig and Altmann [2005] F. Huettig and G. T. Altmann, “Word meaning and the control of eye fixation: Semantic competitor effects and the visual world paradigm,” Cognition, vol. 96, no. 1, pp. B23–B32, 2005.
- Salverda and Tanenhaus [2017] A. P. Salverda and M. K. Tanenhaus, “The visual world paradigm,” Research methods in psycholinguistics and the neurobiology of language: A practical guide, vol. 9, pp. 89–110, 2017.
- Shojaeizadeh et al. [2016] M. Shojaeizadeh, S. Djamasbi, and A. C. Trapp, “Density of gaze points within a fixation and information processing behavior,” in International Conference on Universal Access in Human-Computer Interaction. Springer, 2016, pp. 465–471.
- Bylinskii et al. [2015] Z. Bylinskii, M. A. Borkin, N. W. Kim, H. Pfister, and A. Oliva, “Eye fixation metrics for large scale evaluation and comparison of information visualizations,” in Workshop on Eye Tracking and Visualization. Springer, 2015, pp. 235–255.
- Scholl [2007] B. J. Scholl, “Object persistence in philosophy and psychology,” Mind & Language, vol. 22, no. 5, pp. 563–591, 2007.
- Zhang et al. [2018] X. Zhang, M. X. Huang, Y. Sugano, and A. Bulling, “Training person-specific gaze estimators from user interactions with multiple devices,” in Proceedings of the 2018 CHI Conference on Human Factors in Computing Systems, 2018, pp. 1–12.
- Needleman and Wunsch [1970] S. B. Needleman and C. D. Wunsch, “A general method applicable to the search for similarities in the amino acid sequence of two proteins,” Journal of molecular biology, vol. 48, no. 3, pp. 443–453, 1970.
- Staub and Benatar [2013] A. Staub and A. Benatar, “Individual differences in fixation duration distributions in reading,” Psychonomic Bulletin & Review, vol. 20, no. 6, pp. 1304–1311, 2013.
- Komogortsev et al. [2010] O. V. Komogortsev, D. V. Gobert, S. Jayarathna, S. M. Gowda et al., “Standardization of automated analyses of oculomotor fixation and saccadic behaviors,” IEEE Transactions on biomedical engineering, vol. 57, no. 11, pp. 2635–2645, 2010.
- Müller [2007] M. Müller, “Dynamic time warping,” Information retrieval for music and motion, pp. 69–84, 2007.
- Zanca et al. [2018] D. Zanca, V. Serchi, P. Piu, F. Rosini, and A. Rufa, “Fixatons: A collection of human fixations datasets and metrics for scanpath similarity,” arXiv preprint arXiv:1802.02534, 2018.
- Wang et al. [2011] W. Wang, C. Chen, Y. Wang, T. Jiang, F. Fang, and Y. Yao, “Simulating human saccadic scanpaths on natural images,” in CVPR 2011. IEEE, 2011, pp. 441–448.
- Cristino et al. [2010] F. Cristino, S. Mathôt, J. Theeuwes, and I. D. Gilchrist, “Scanmatch: A novel method for comparing fixation sequences,” Behavior research methods, vol. 42, no. 3, pp. 692–700, 2010.
- Faggi et al. [2020] L. Faggi, A. Betti, D. Zanca, S. Melacci, and M. Gori, “Wave propagation of visual stimuli in focus of attention,” arXiv preprint arXiv:2006.11035, 2020.
- Berndt and Clifford [1994] D. J. Berndt and J. Clifford, “Using dynamic time warping to find patterns in time series.” in KDD workshop, vol. 10, no. 16. Seattle, WA, USA:, 1994, pp. 359–370.
- Pan and Duraisamy [2020] S. Pan and K. Duraisamy, “On the structure of time-delay embedding in linear models of non-linear dynamical systems,” Chaos: An Interdisciplinary Journal of Nonlinear Science, vol. 30, no. 7, p. 073135, 2020.
- Kuhn [1955] H. W. Kuhn, “The hungarian method for the assignment problem,” Naval research logistics quarterly, vol. 2, no. 1-2, pp. 83–97, 1955.
![[Uncaptioned image]](/html/2112.02340/assets/fig/Yao.png) |
Yao Wang is a PhD student at the University of Stuttgart, Germany. He received the BSc degree in Intelligence Science and Technology and MSc degree in Computer Software and Theory both from Peking University, China, in 2017 and 2020, respectively. His research interests include computer vision and human-computer interaction, with a focus on visual attention modelling on information visualizations. |
![[Uncaptioned image]](/html/2112.02340/assets/fig/bace.jpg) |
Mihai Bâce is a post-doctoral researcher in the Perceptual User Interfaces group at the University of Stuttgart, Germany. He did the PhD at ETH Zurich, Switzerland, at the Institute for Intelligent Interactive Systems. He received the MSc degree in Computer Science from École Polytechnique Fédérale de Lausanne, Switzerland, and the BSc degree in Computer Science from the Technical University of Cluj-Napoca, Romania. His research interests include computational Human-Computer Interaction with a focus on sensing and modelling user attention. |
![[Uncaptioned image]](/html/2112.02340/assets/fig/abulling.png) |
Andreas Bulling is Full Professor of Computer Science at the University of Stuttgart, Germany, where he directs the research group "Human-Computer Interaction and Cognitive Systems". He received the MSc degree in Computer Science from the Karlsruhe Institute of Technology, Germany, in 2006 and the PhD degree in Information Technology and Electrical Engineering from ETH Zurich, Switzerland, in 2010. Before, Andreas Bulling was a Feodor Lynen and Marie Curie Research Fellow at the University of Cambridge, UK, and a Senior Researcher at the Max Planck Institute for Informatics, Germany. His research interests include computer vision, machine learning, and human-computer interaction. |