“Stop Asian Hate!”: Refining Detection of Anti-Asian Hate Speech during the COVID-19 Pandemic
Abstract
Content warning: This work displays examples of explicit and/or strongly offensive language. Fueled by a surge of anti-Asian xenophobia and prejudice during the COVID-19 pandemic, many have taken to social media to express these negative sentiments. Identifying these posts is crucial for moderation and understanding the nature of hate in online spaces. In this paper, we create and annotate a corpus of tweets to explore anti-Asian hate speech with a finer level of granularity. Our analysis reveals that this emergent form of hate speech often eludes established approaches. To address this challenge, we develop a model and an accompanied efficient training regimen that incorporates agreement between annotators. Our approach produces up to 8.8% improvement in macro F1 scores over a strong established baseline, indicating its effectiveness even in settings where consensus among annotators is low. We demonstrate that we are able to identify hate speech that is systematically missed by established hate speech detectors.
Index Terms:
covid, pandemic, social media, hate speech, deep learningI Introduction
Since its first reported incident at the end of 2019, the coronavirus (COVID-19) pandemic has had tremendous global economic impact and led to an unprecedented disruption in the daily lives of billions [1]. Historically, outbreaks of this nature have been associated with xenophobia and othering of certain groups [2]. That the virus first emerged from Wuhan, China, along with allegations of its chiropteran origins have only served to fuel xenophobic attitude against Asians in Western countries [3, 4]. In the United States (US), Asians and Asian Americans not only have to contend with the risk of infection, but also the target of prejudice and discrimination against their ethnicity [5]. According to reports by the Federal Bureau of Investigations (FBI), hate crimes against Asians Americans increased by 77% from 2019 to 2020 [6]. Asian groups have been reported to experience higher level of mental heath disorders since the onset of the pandemic than other races [7].
Anti-Asian xenophobia not only manifests in physical settings, but also on social media. Tahmasbi et al. [8] also discovered a significant rise of old and new Sinophobic slurs on Twitter induced by the coronavirus pandemic. A study on Twitter [9] finds that tweets that contain the hashtag “#chinesevirus” are more than twice as likely than those with “#covid19” to contain anti-Asian sentiments. That even prominent political figures adopted these terms further encouraged their usage and incited discriminatory associations [10]. Zhong, Huang and Liu [11] found an association between an increased mental health toll and social media usage of residents of Wuhan, China – the first epicenter of the outbreak.
Detection of hate speech has received increased attention due to the prevalence in social media. In spite of the new anti-Asian varieties of hate speech born from this pandemic, there are comparatively much fewer Asian-focused literature in this area [12, 13]. In this paper, we attempt to address this gap in research. Our contributions to hate speech literature are as follows:
-
•
Creation of an Asian-focused, COVID-oriented Twitter corpus with annotation on multiple dimensions of abusive and hate speech.
-
•
Proposal of deep learning models that leverage individual annotations to enhance text classification amidst low agreement.
-
•
Analysis of efficient multitask training regimens to harness the benefits of these architectures.
II Related Work
II-A Hate Speech Detection
Hate speech detection is complex and challenging. A set of unifying standard definitions is yet to exist, leaving much room for subjectivity for discerning what constitutes hate and abusive speech. There are also overlapping – and at times competing – definitions from related works on offensive, toxic, hostile or prejudice speech that present added difficulty for generalizability [14]. In this work, we use the following definitions put forth by [15]:
-
•
Abusive Speech : “Any strongly impolite, rude or hurtful language using profanity, that can show a debasement of someone or something, or show intense emotion.”
-
•
Hate Speech: “Language used to express hatred towards a targeted individual or group, or is intended to be derogatory, to humiliate, or to insult the members of the group, on the basis of attributes such as race, religion, ethnic origin, sexual orientation, disability, or gender.”
Literature on hate speech often focuses on manifestations of racism, sexism and discrimination against minority groups [16]. Models on hate speech detection have also grown in diversity and complexity, ranging from Logistic Regression and Bayesian Networks to Genetic Algorithm and Deep Neural Networks, from singular to ensemble classifiers [12, 16].
II-B Annotation Strategies and Label Usage
Hate speech and related textual corpora are often constructed by filtering from a larger source (usually some social media platforms) using predetermined keywords [17, 14]. Twitter is the most common platform where researchers extract their original content [18]. Labels for these corpora are often solicited from experts and trained workers, who are often more costly due to their training, or crowdsourcing, which is relatively cheaper and easier, or a mixture of both of these approaches [18]. Earlier efforts on hate speech often focused on binary annotation schemes (e.g.: hate vs. not) whereas more recent works explored multi-level and/or multi-class schemes with higher levels of granularity [17, 18].
Due to the inherent ambiguity of language and the subjectivity of hate speech, disagreement among annotators for the same inputs occurs naturally. Researchers have noted that reported inter-rater agreement metrics [17, 19] , such as Cohen’s , Fleiss’ , Krippendorf’s , are often low. While earlier works often treated samples with low annotation agreement as noise, recent trends have found that such disagreements exemplify real difficult scenarios that should be represented rather than forcibly adjudicated or discarded [20].
Majority voting and averaging are typical approaches to derive the final label when disagreement among annotators is present. However, emergent research [20, 21, 22] has pointed out the shortcomings of using only these hard labels, such as biasing against minority voices and yielding internally inconsistent labels, which may in turn negatively impact models’ performance. Fornaciari et al. [23] proposed a multitask model that incorporated probability distributions over the annotator labels to more accurately predict gold labels in Part-of-Speech tagging and morphological stemming tasks. For hate speech, Davani, Diaz and Prabhakaran [24] demonstrated that predicting each individual annotator’s label separately using a shared architecture also resulted in improved performance over predicting only aggregate labels.
III Data Methodology
III-A Data Acquisition
We construct our corpus from the Public Coronavirus Twitter Dataset [25]. Starting on January 28, 2020, the collectors leveraged Twitter’s API to collect tweets that contain relevant keywords. This repository is updated on a weekly basis111Available at https://github.com/echen102/COVID-19-TweetIDs, and contains over 150 million Tweet IDs (proprietary unique identifier of each tweet) as of December 2021. As hate speech occurrences are proportionately rare on Twitter, we utilize a boosting approach proposed by [15] that involves sampling using targeted keywords. First, we collect a set of anti-Asian phrases that include both existing (e.g.: ch*nk, g*ok) and emergent, COVID-related (e.g.: china lied people die, chinavirus) from Hatebase.org and relevant literature [8, 26, 27]. We also collect a similar set for anti-Black phrases out of an interest in interracial interaction during COVID. After inspection, the final collection contains 49 anti-Asian phrases, 56 anti-Black phrases (detailed in the Appendix. To the best of our knowledge, this list – while non-exhaustive – consists of the most representative phrases targeted towards Asian and Black demographics in hate speech literature.
Each candidate tweet is tentatively categorized as either anti-Asian or anti-Black if it contains a phrase of the corresponding set, Interracial if phrases from both sets are present, and Normal if none applies. We restrict our sampling pool to only original tweets written in English from the general corpus. To compensate for the natural imbalance of hateful tweets (the positive classes), we sequentially select at random a tweet from each of the 4 classes until we reach 500 tweets for each month from July to December 2020. The final corpus has 3000 tweets, which are selected for annotation.
III-B Data Annotation
Fig. 1 illustrates the general template for annotation. At the top is a collapsible instructional pane, followed by the tweet’s content and then prompts to identify the following attributes:
-
•
(Level of) Aggression: Not Aggressive, Somewhat Aggressive, Very Aggressive
-
•
Target: Not Applicable (N/A), anti-Asian, anti-Black, Both anti-Asian and anti-Black
-
•
(Speech) Type: Abusive, Hate, Normal
While Type (or its equivalent) is a standard attribute appearing in other works on hate speech, we include the other 2 attributes in an effort to examine the direction and strength of the expressed negative sentiments.
Inspired by [28], we prime annotators at the beginning of the instructions to consider contextual clues: “Note on Dialect and Context: Some words may be considered offensive generally, but not in specific contexts, especially when used in certain dialects or by minority groups. Please consider the context of the tweet while selecting the options below.” We then provide definitions and an example for each option. In an effort to enhance consistency in the field, we decide to use verbatim the definitions as provided by [15] and [29] for the questions on Type and Level of Aggression, respectively.Following examples in [30, 31], we present our questions in a hierarchical fashion to direct annotators’ consideration on different aspects laid out in the preceding definitions. We first inquire annotators about the Level of Aggression communicated by the tweet. Only if a choice other than Not Aggressive is selected then subsequent questions are displayed. Otherwise, subsequent questions would return default neutral options upon submission.
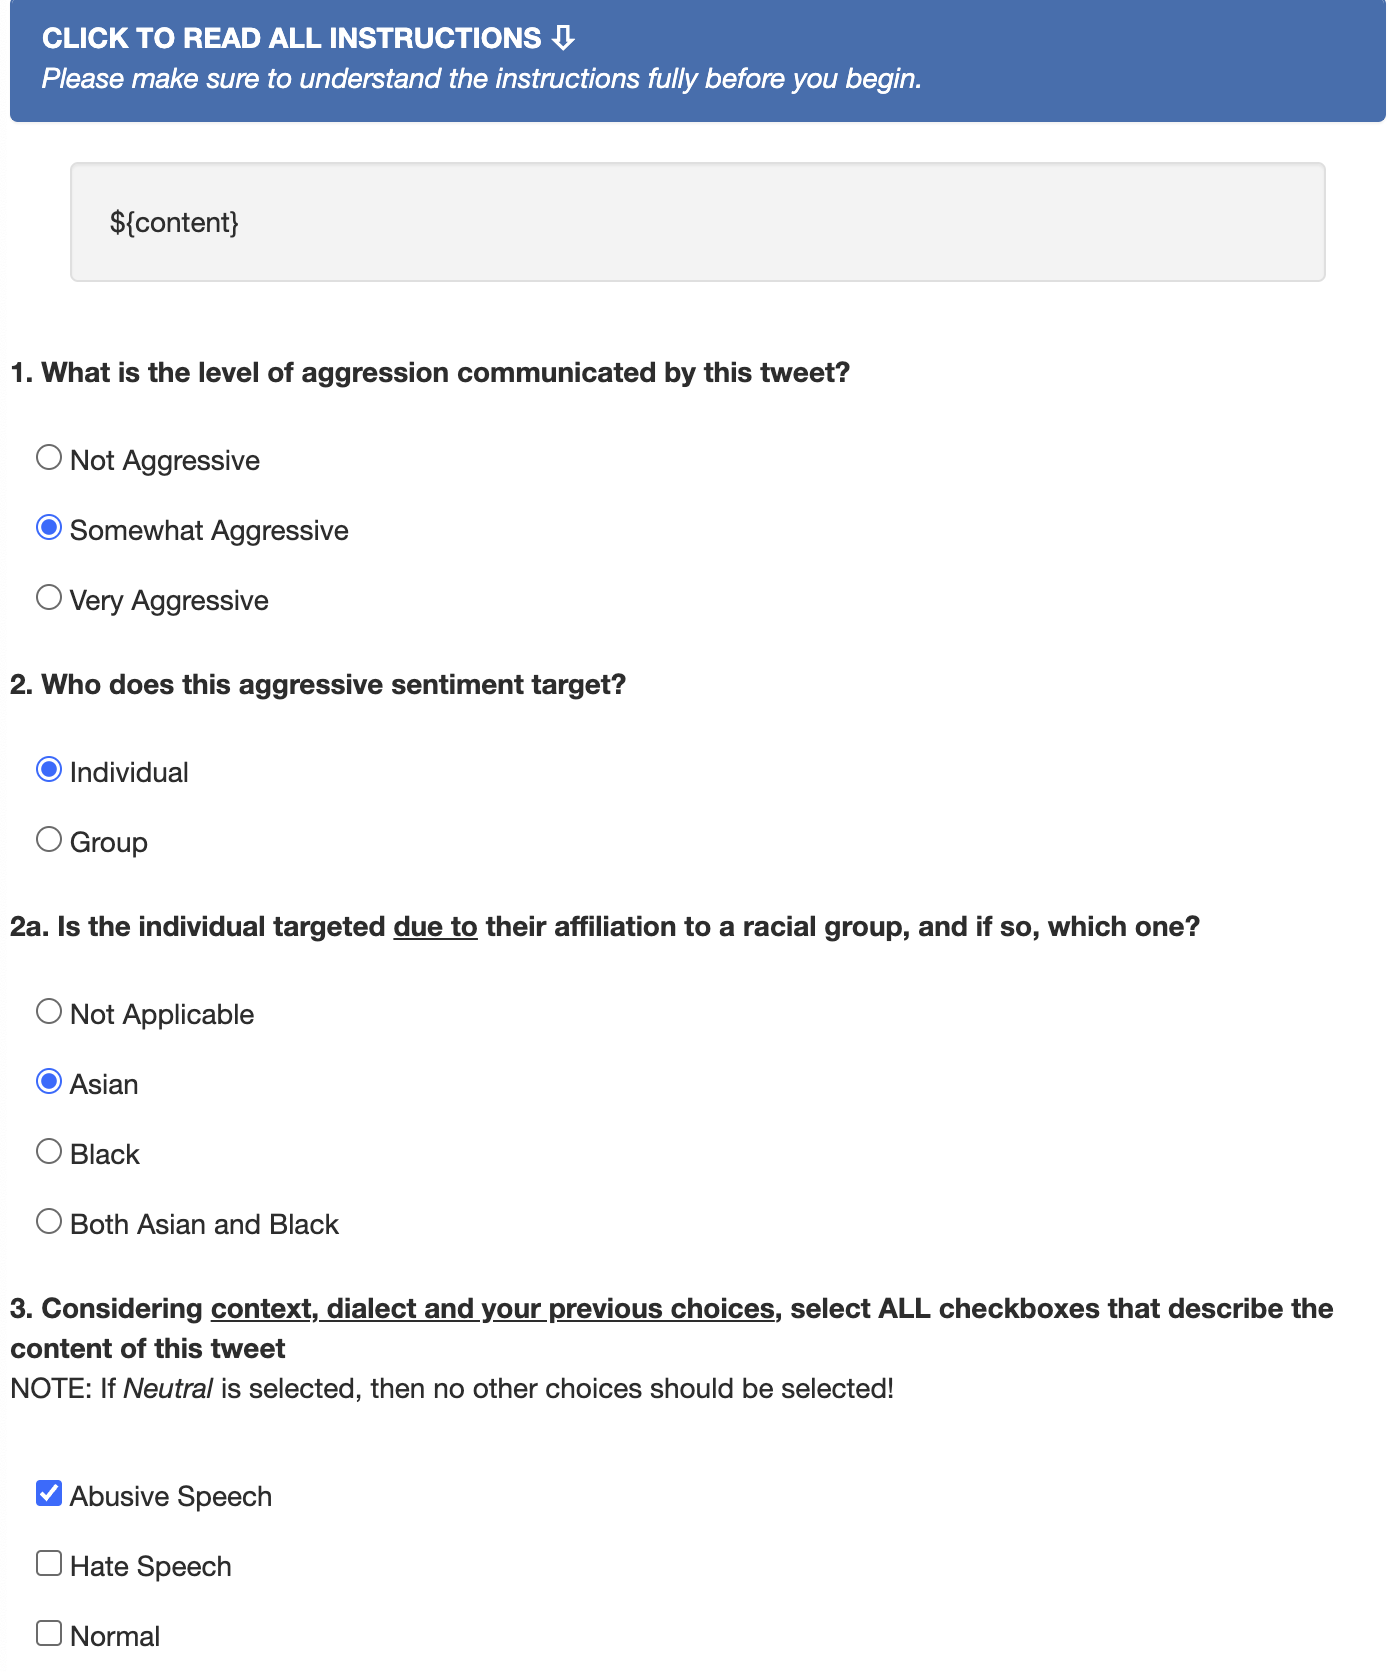
The task of identifying the target of aggression is split into two parts: first to identify whether the target is an Individual or Group. If the former, we inquire about the target’s racial affiliation as shown in Fig.1. If the latter, we urge the annotators to consider context and dialect of the tweet again as they identify the target’s race . Finally, we ask annotators to identify the tweet’s Type. This question allows selection of both Abusive and Hate options, and only Normal otherwise. We present this question last to allow annotators the opportunity to deliberate based on their preceding options.
III-C Crowdsourcing
We solicited the templates to workers on Amazon Mechanical Turk (AMT), a popular crowdsourcing platform for this type of task. A Human Intelligence Task (HIT) consists of a single set of responses on a template attached to a tweet drawn from our corpus. Each HIT requires 3 sets of annotation from workers to be considered completed. We required workers to possess the following qualifications: HITs approval rate at least 95%, locations in either Canada or the U.S, and consenting to viewing adult themes. In addition, we asked annotators to complete a pre-screen survey on their demographic backgrounds, including Age Group, Gender, Ethnicity and Level of Education . Workers received $.06 for successful submission of a HIT and was capped at approximately 300 HITs to ensure diversity of opinions. The discussion of our annotation’s background is out of the scope of this paper. However, this information will be made available along with our data for interested researchers.
III-D Annotation Results and Analysis
Table I reports the results of our annotation tasks. For inter-annotator agreement, we observe Fleiss’ values in the range of 0.41 to 0.49. We use majority voting to derive the singular labels for each tweet’s respective attribute, whose aggregates are reported in . When ties happen for Aggression, the final label is defaulted to Somewhat Aggressive. For Type, is the default choice when votes tie. We observe that the number of non-neutral labels all belong to the minority of classes.
| Attribute | Category | Count | A. Count | |
|---|---|---|---|---|
| Aggression | Not Aggressive | 0.42 | 2187 | 2187 |
| Somewhat Aggressive | 725 | 691 | ||
| Very Aggressive | 88 | 81 | ||
| Target | Not Applicable (N/A) | 0.49 | 2505 | 2505 |
| anti-Asian | 454 | 454 | ||
| anti-Black | 35 | N/A | ||
| Both | 6 | N/A | ||
| Type | Normal | 0.41 | 2379 | 2373 |
| Abusive | 382 | 354 | ||
| Hate | 239 | 232 |
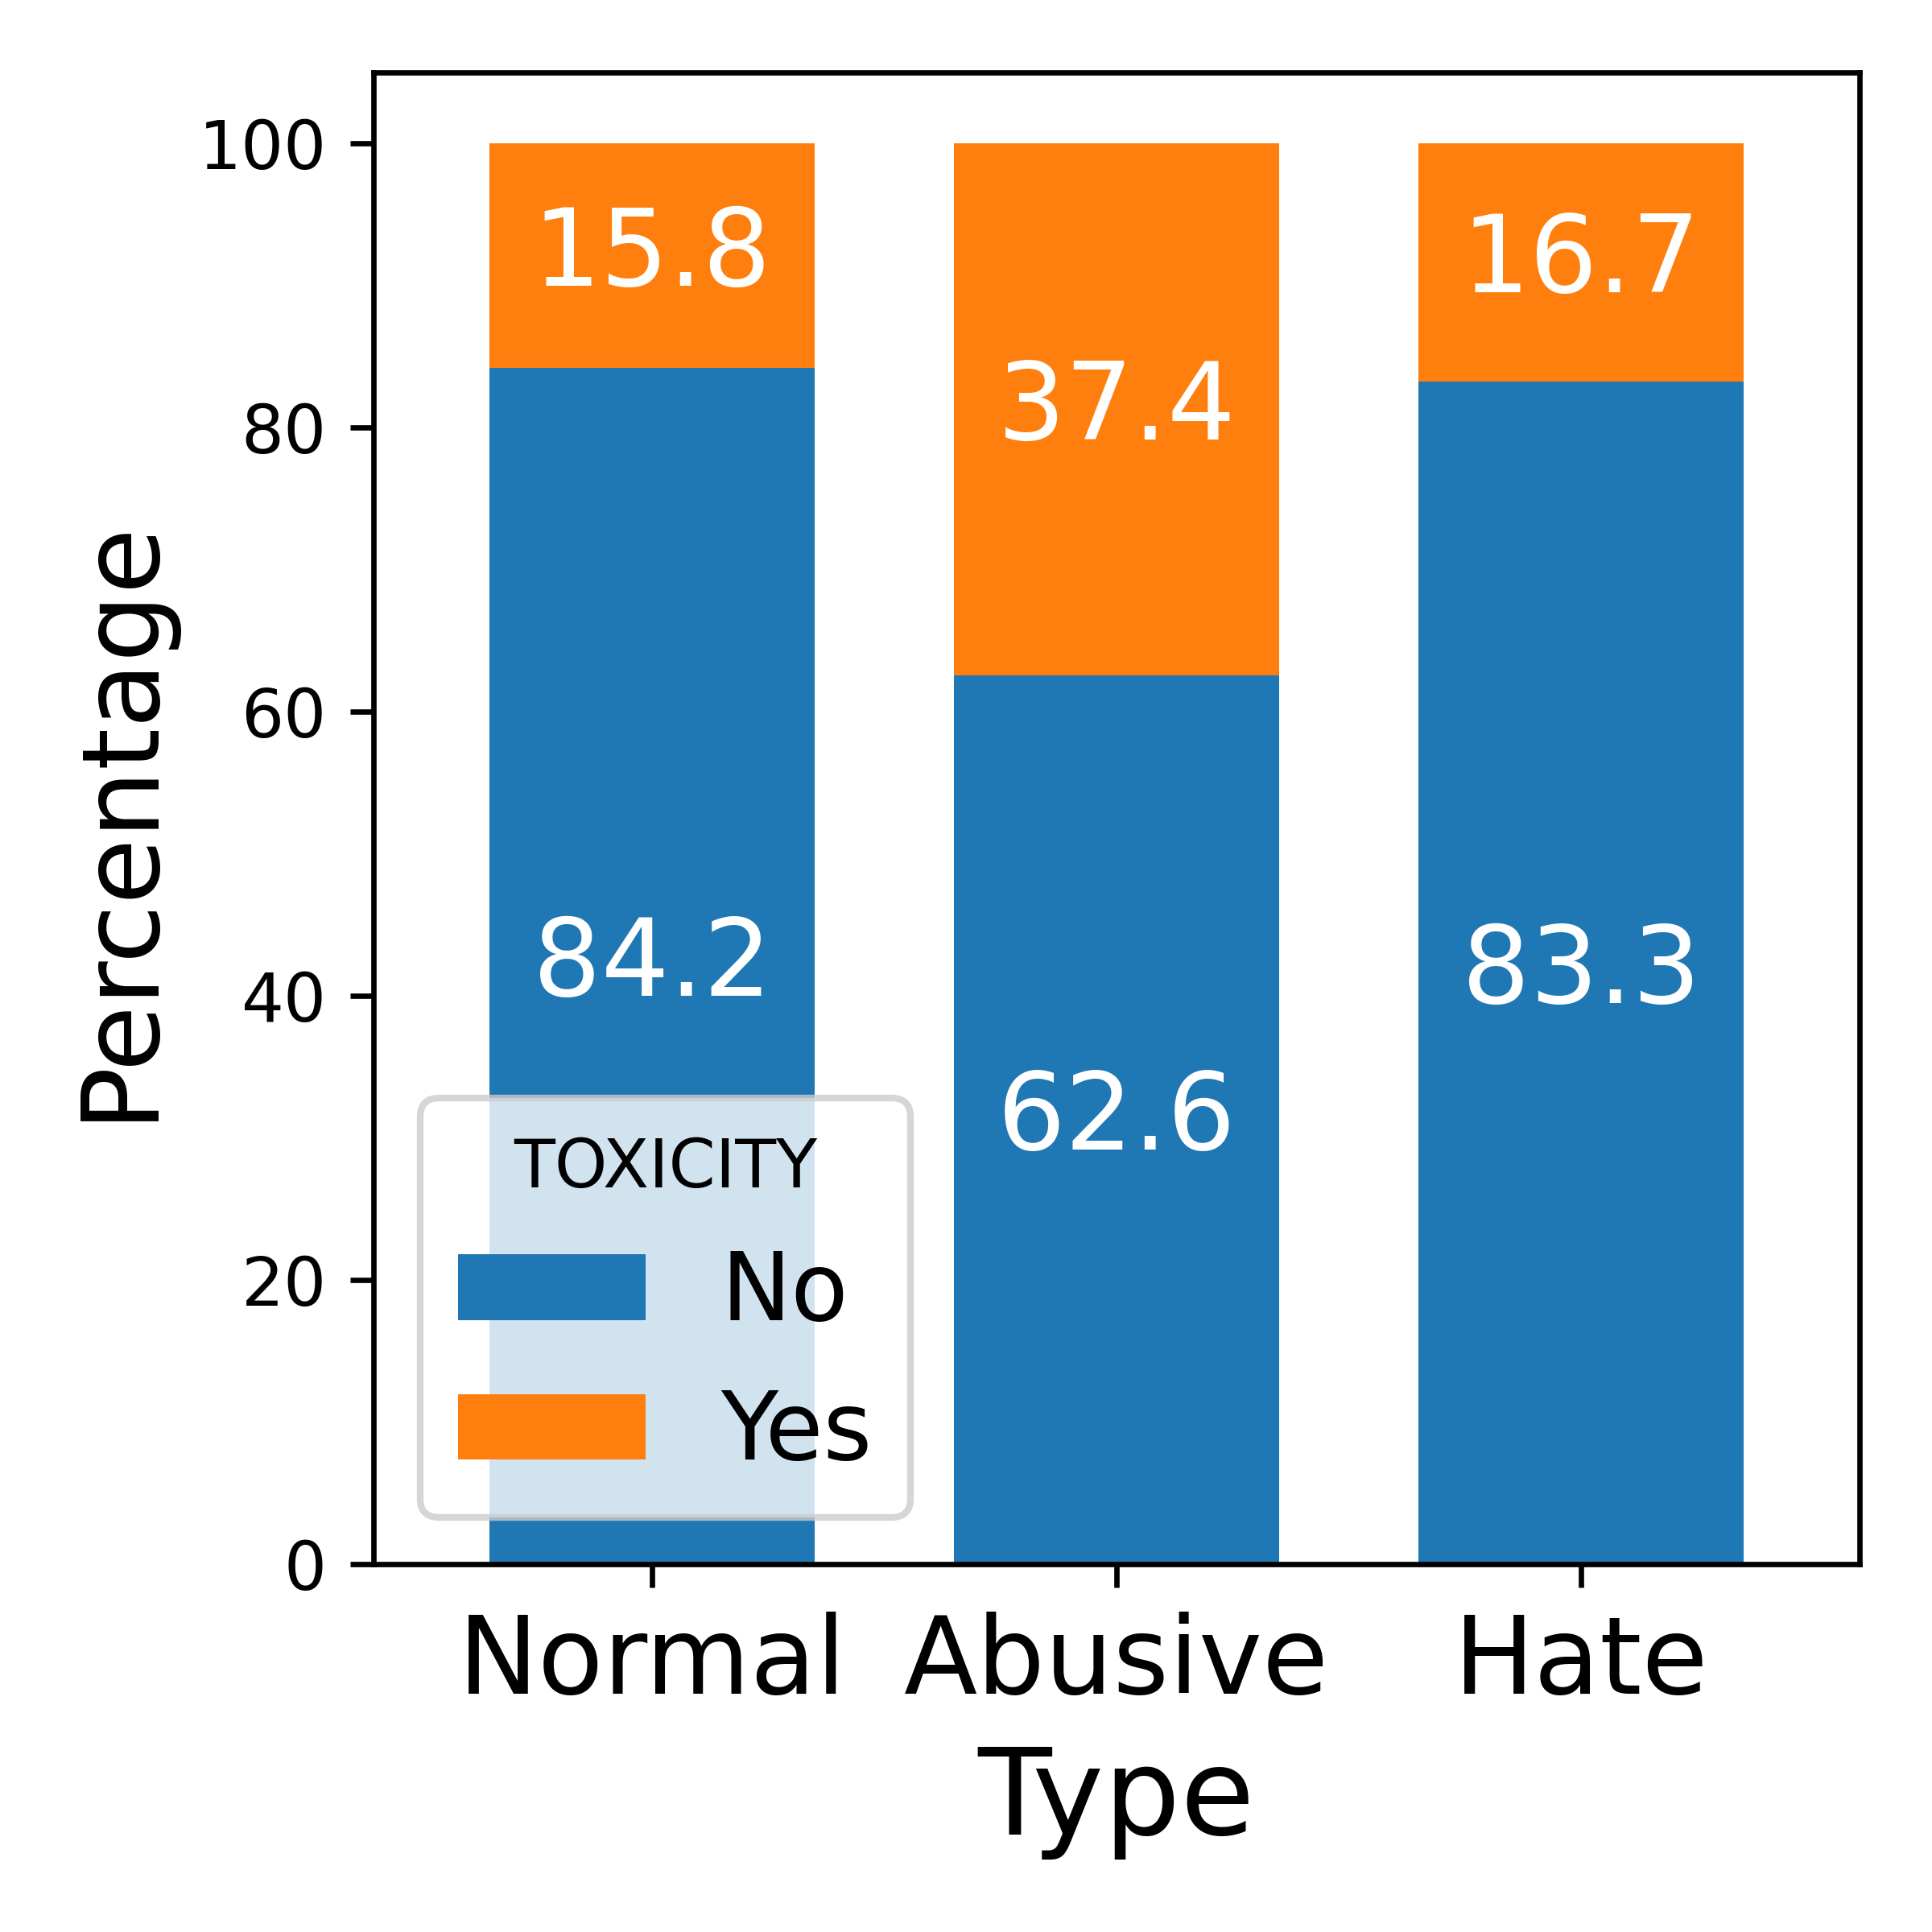
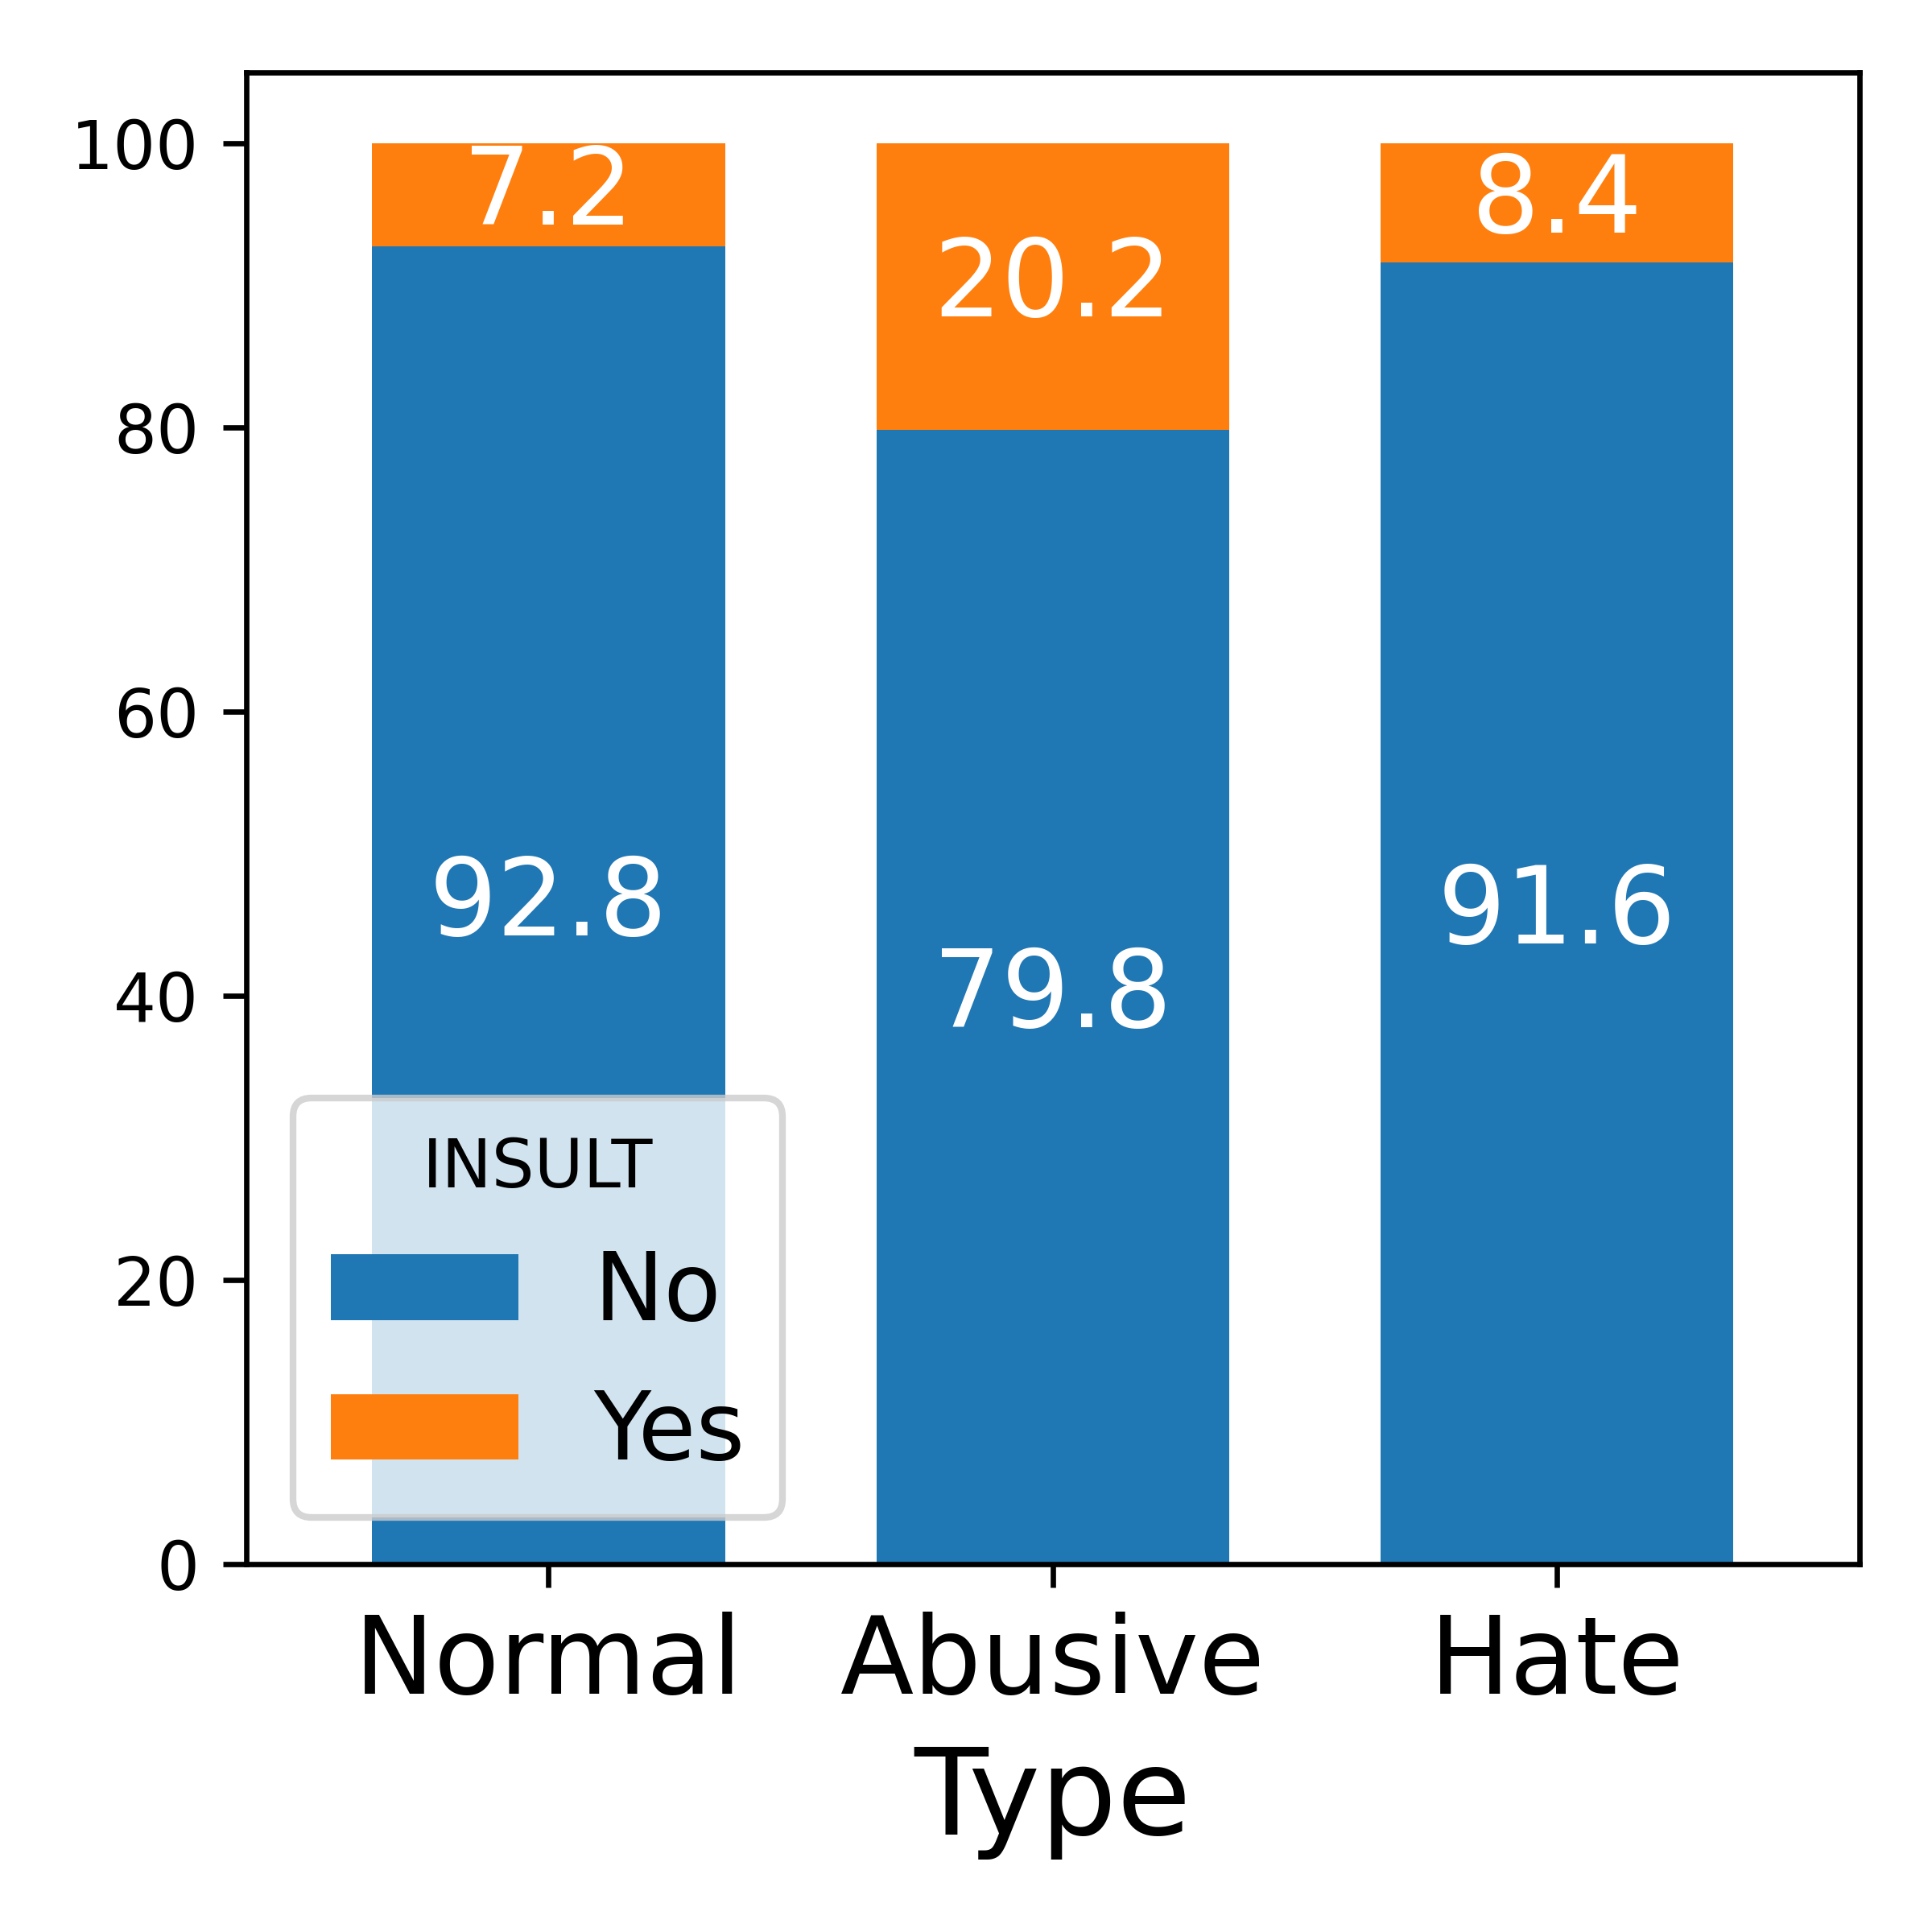
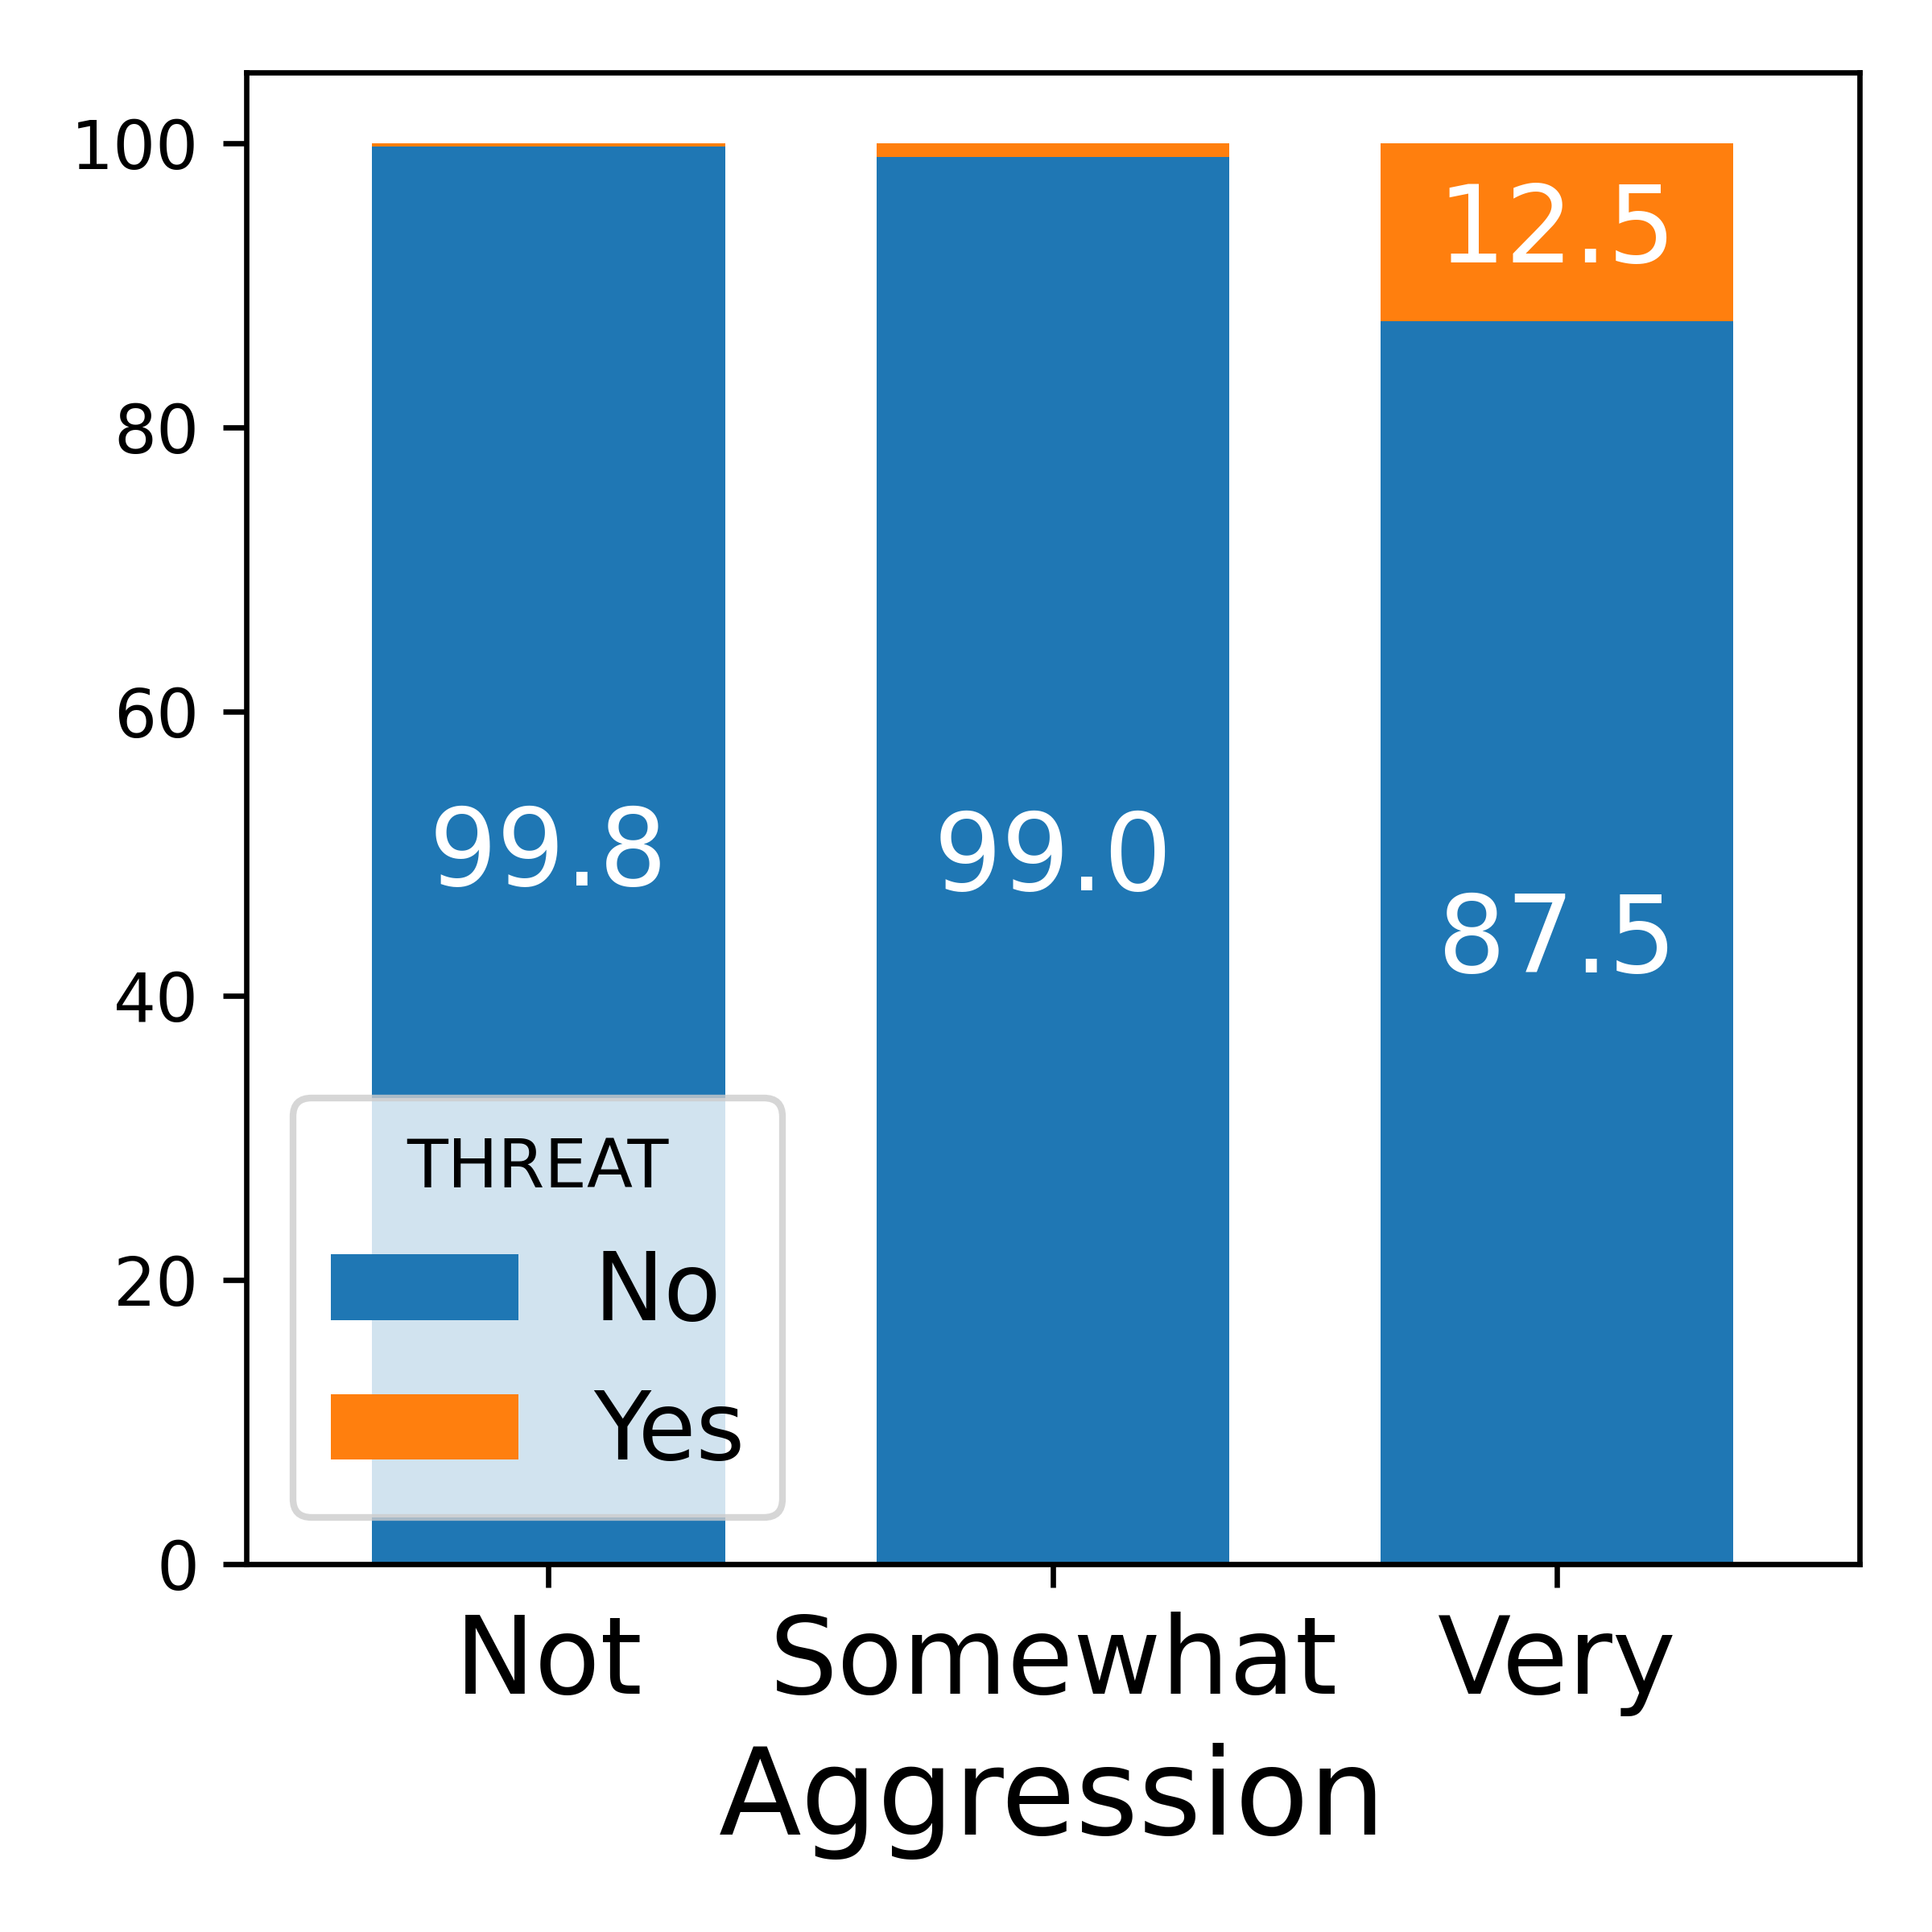
Perspective API We use Perspective API 222Details on the following descriptions can be found at https://developers.perspectiveapi.com, developed by the Google Counter Abusive Technology and Jigsaw team, to investigate this commercial tool’s behaviors on our dataset. Trained on millions of comments from various forums, the API produces a probability score for certain attributes of abusive language, which represents the fraction of raters who find the corresponding attribute present in the input [32].
We request the scores for the attributes Toxicity, Insult and Threat from the API based on their definitions and relevance to this study. Using the cutoff probability 0.5 (Perspective suggests 0.7 [32]), tweets with score greater than this threshold are assigned a value of Yes for that attribute, otherwise No. The stacked bar charts in Fig. 2 shows the breakdown of percentages of Perspective’s predictions for our annotated Type and Aggression attributes. The discrepancy is apparent: Perspective significantly predicts our non-neutral categories to not contain their negative attributes. More interestingly, tweets that our annotators considered Abusive are more frequently considered positive for Toxicity and Insult by the API compared to their Hate counterpart. Furthermore, % and 7% of our Normal tweets are considered toxic. Perspective also only label about 12% of Very Aggressive tweets to be Threat while only 1% of Somewhat Aggressive is considered so. Though sophisticated and heavily trained, Perspective may not yet capture COVID-related societal and linguistic concepts.
Towards Asian Focus Forty-one tweets whose Target are anti-Black and Both account for only 1.4% of our corpus. We decide to remove those tweets from our final pool to focus on Asian groups in our subsequent analyses. For the remaining tweets, we convert the leftover individual labels for the Target attribute from anti-Black to Not Applicable and from Both to anti-Asian. Final results are shown in the Adjusted Count (A. Count) column in Table I.
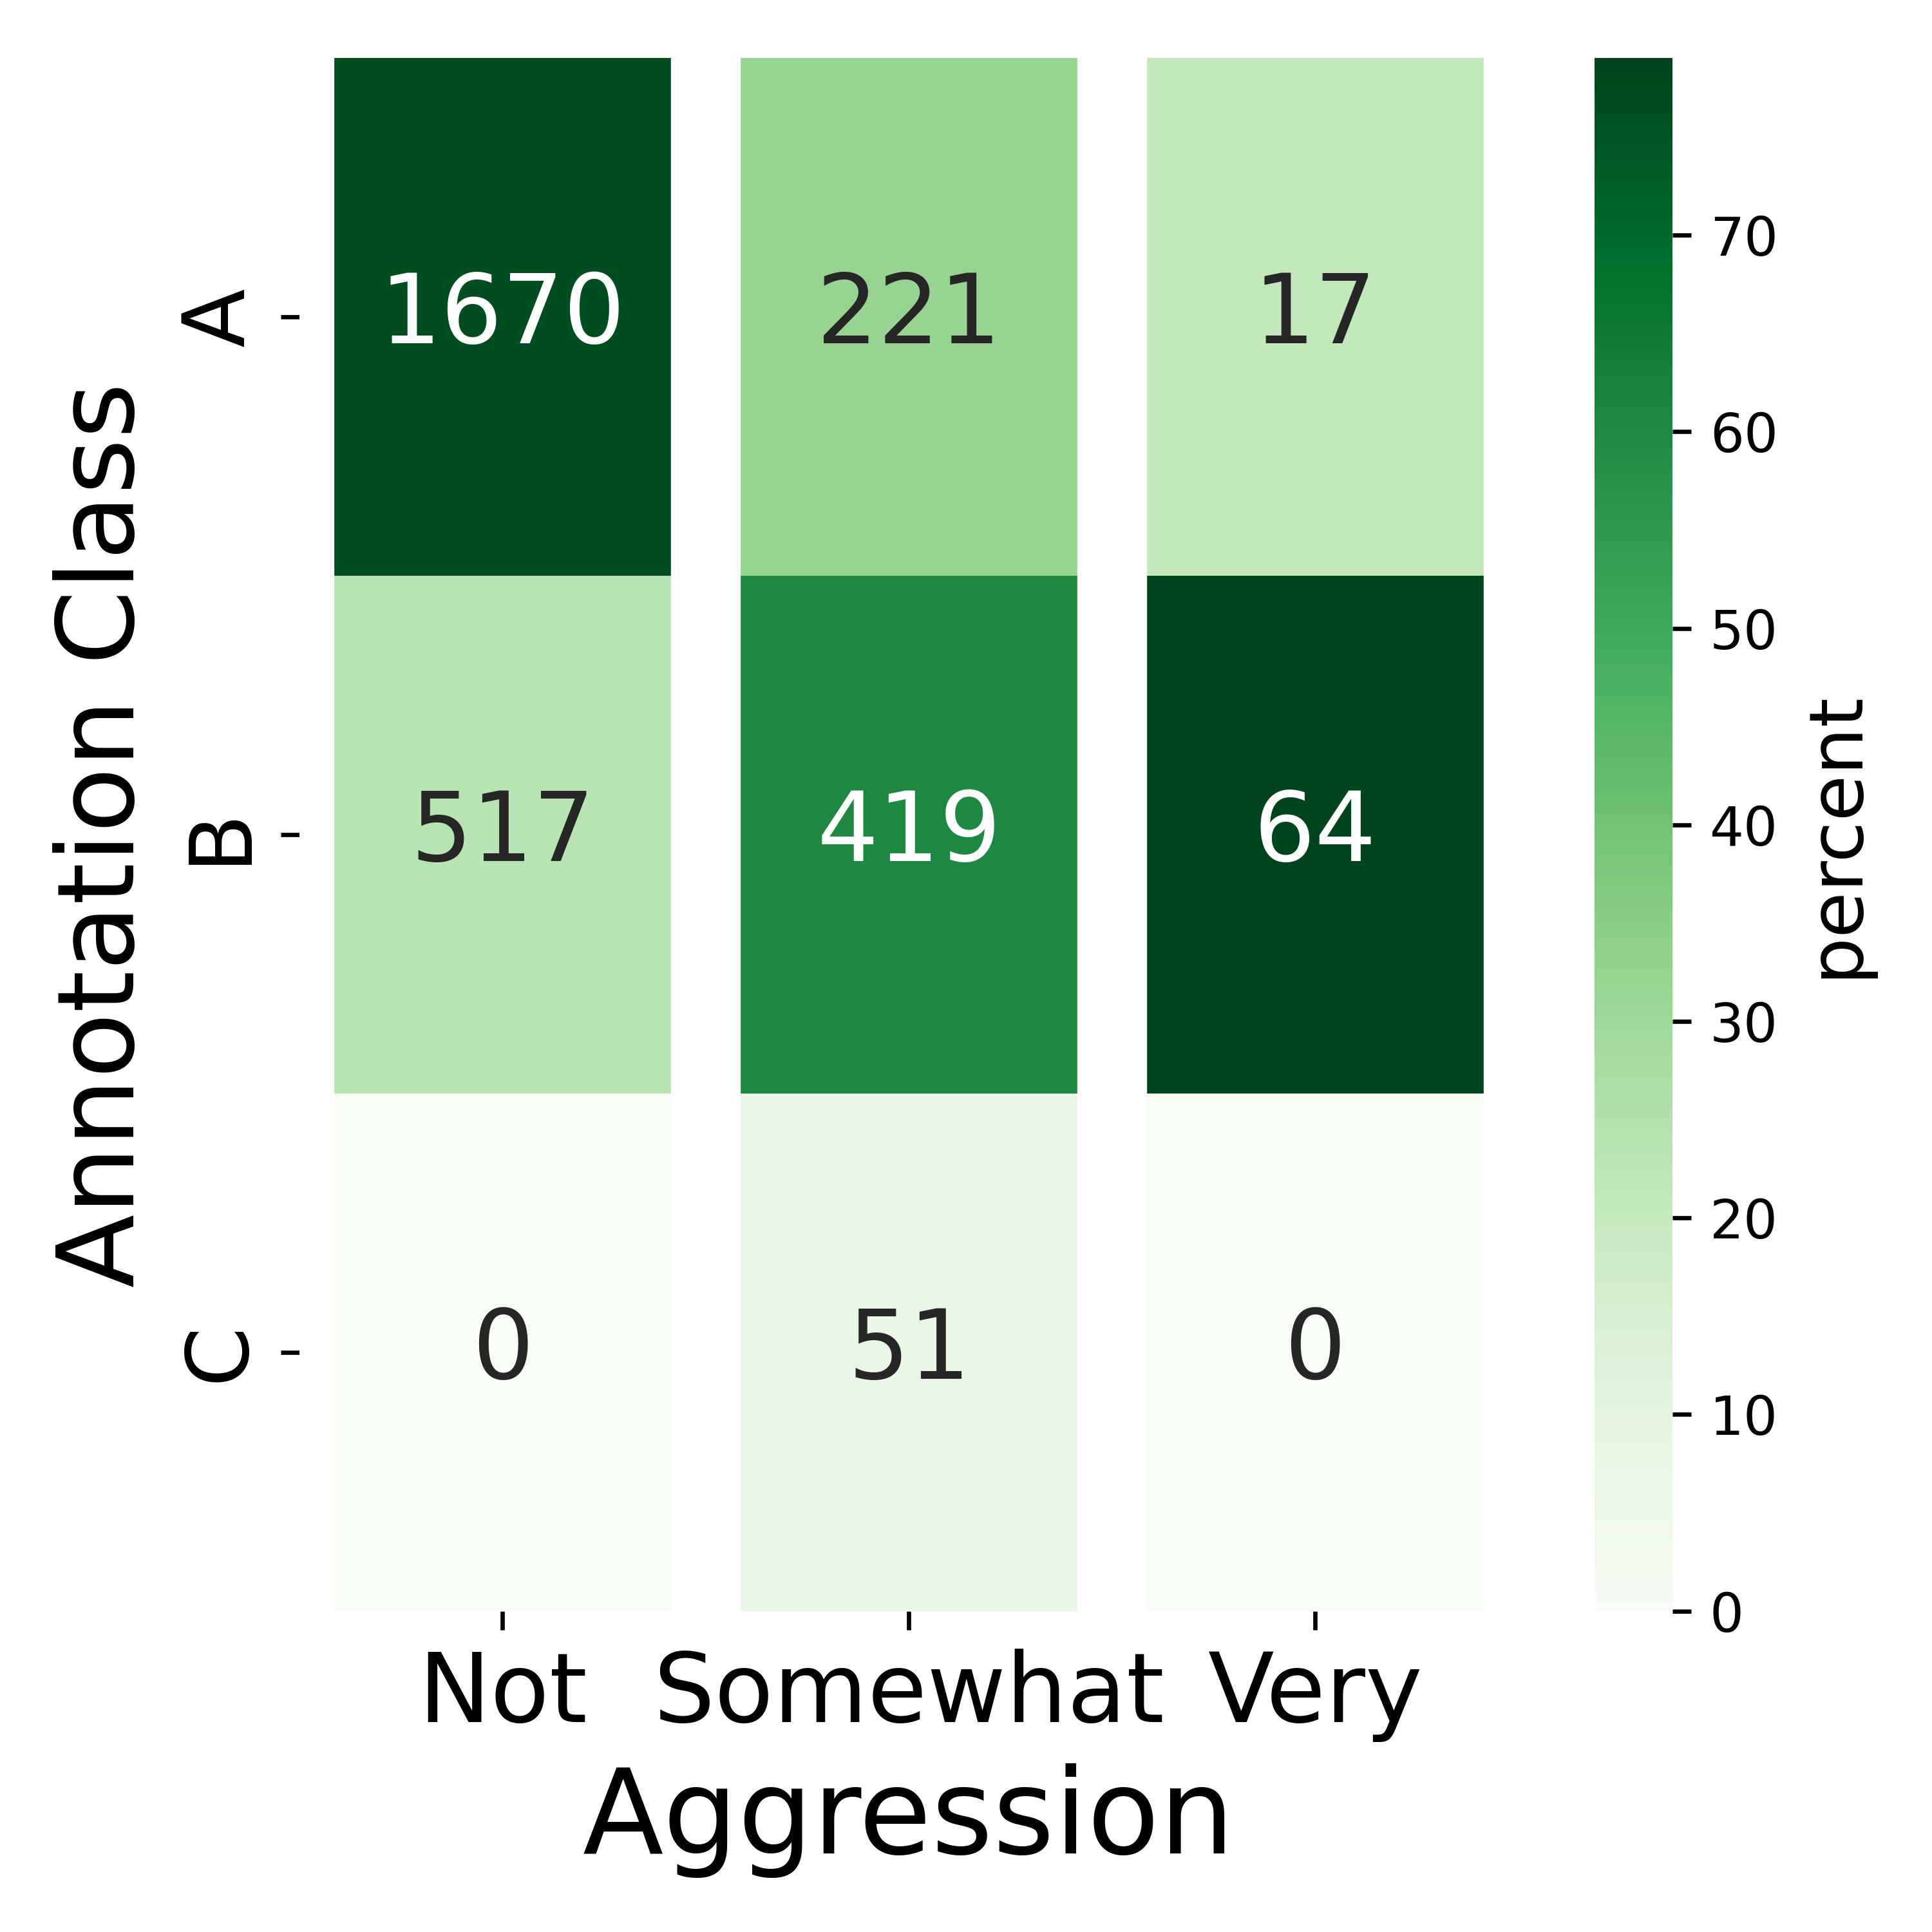
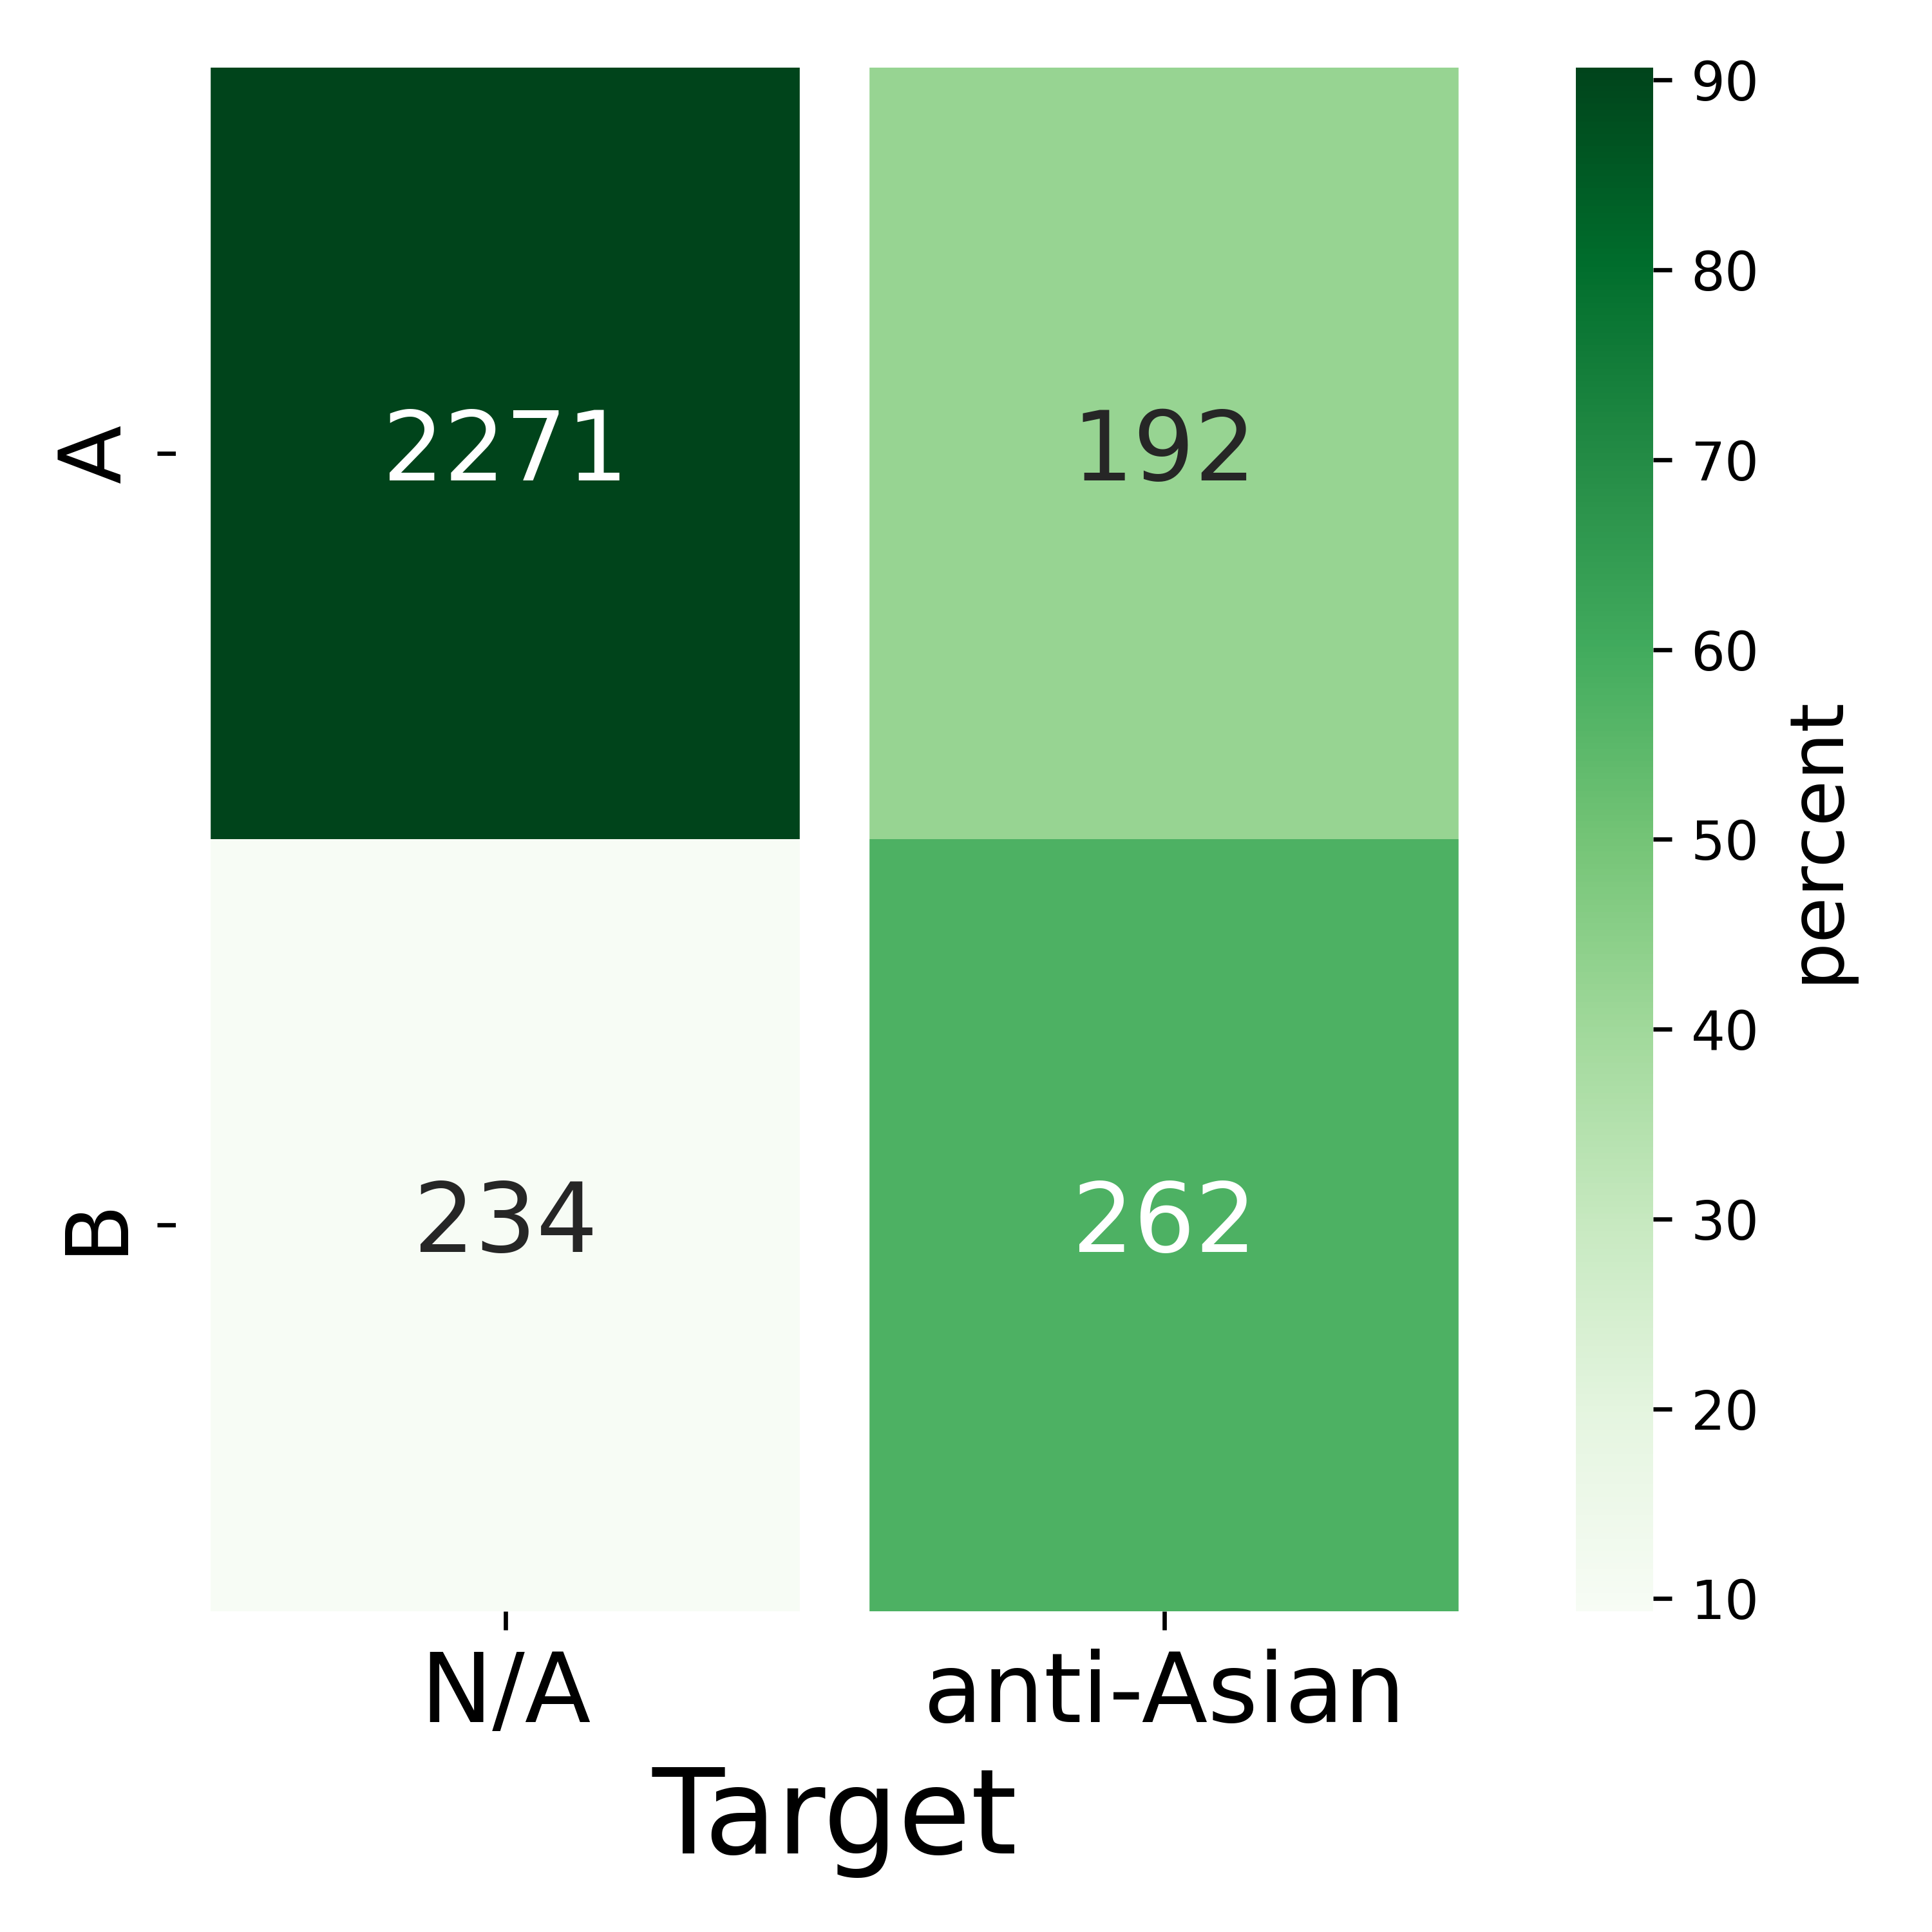
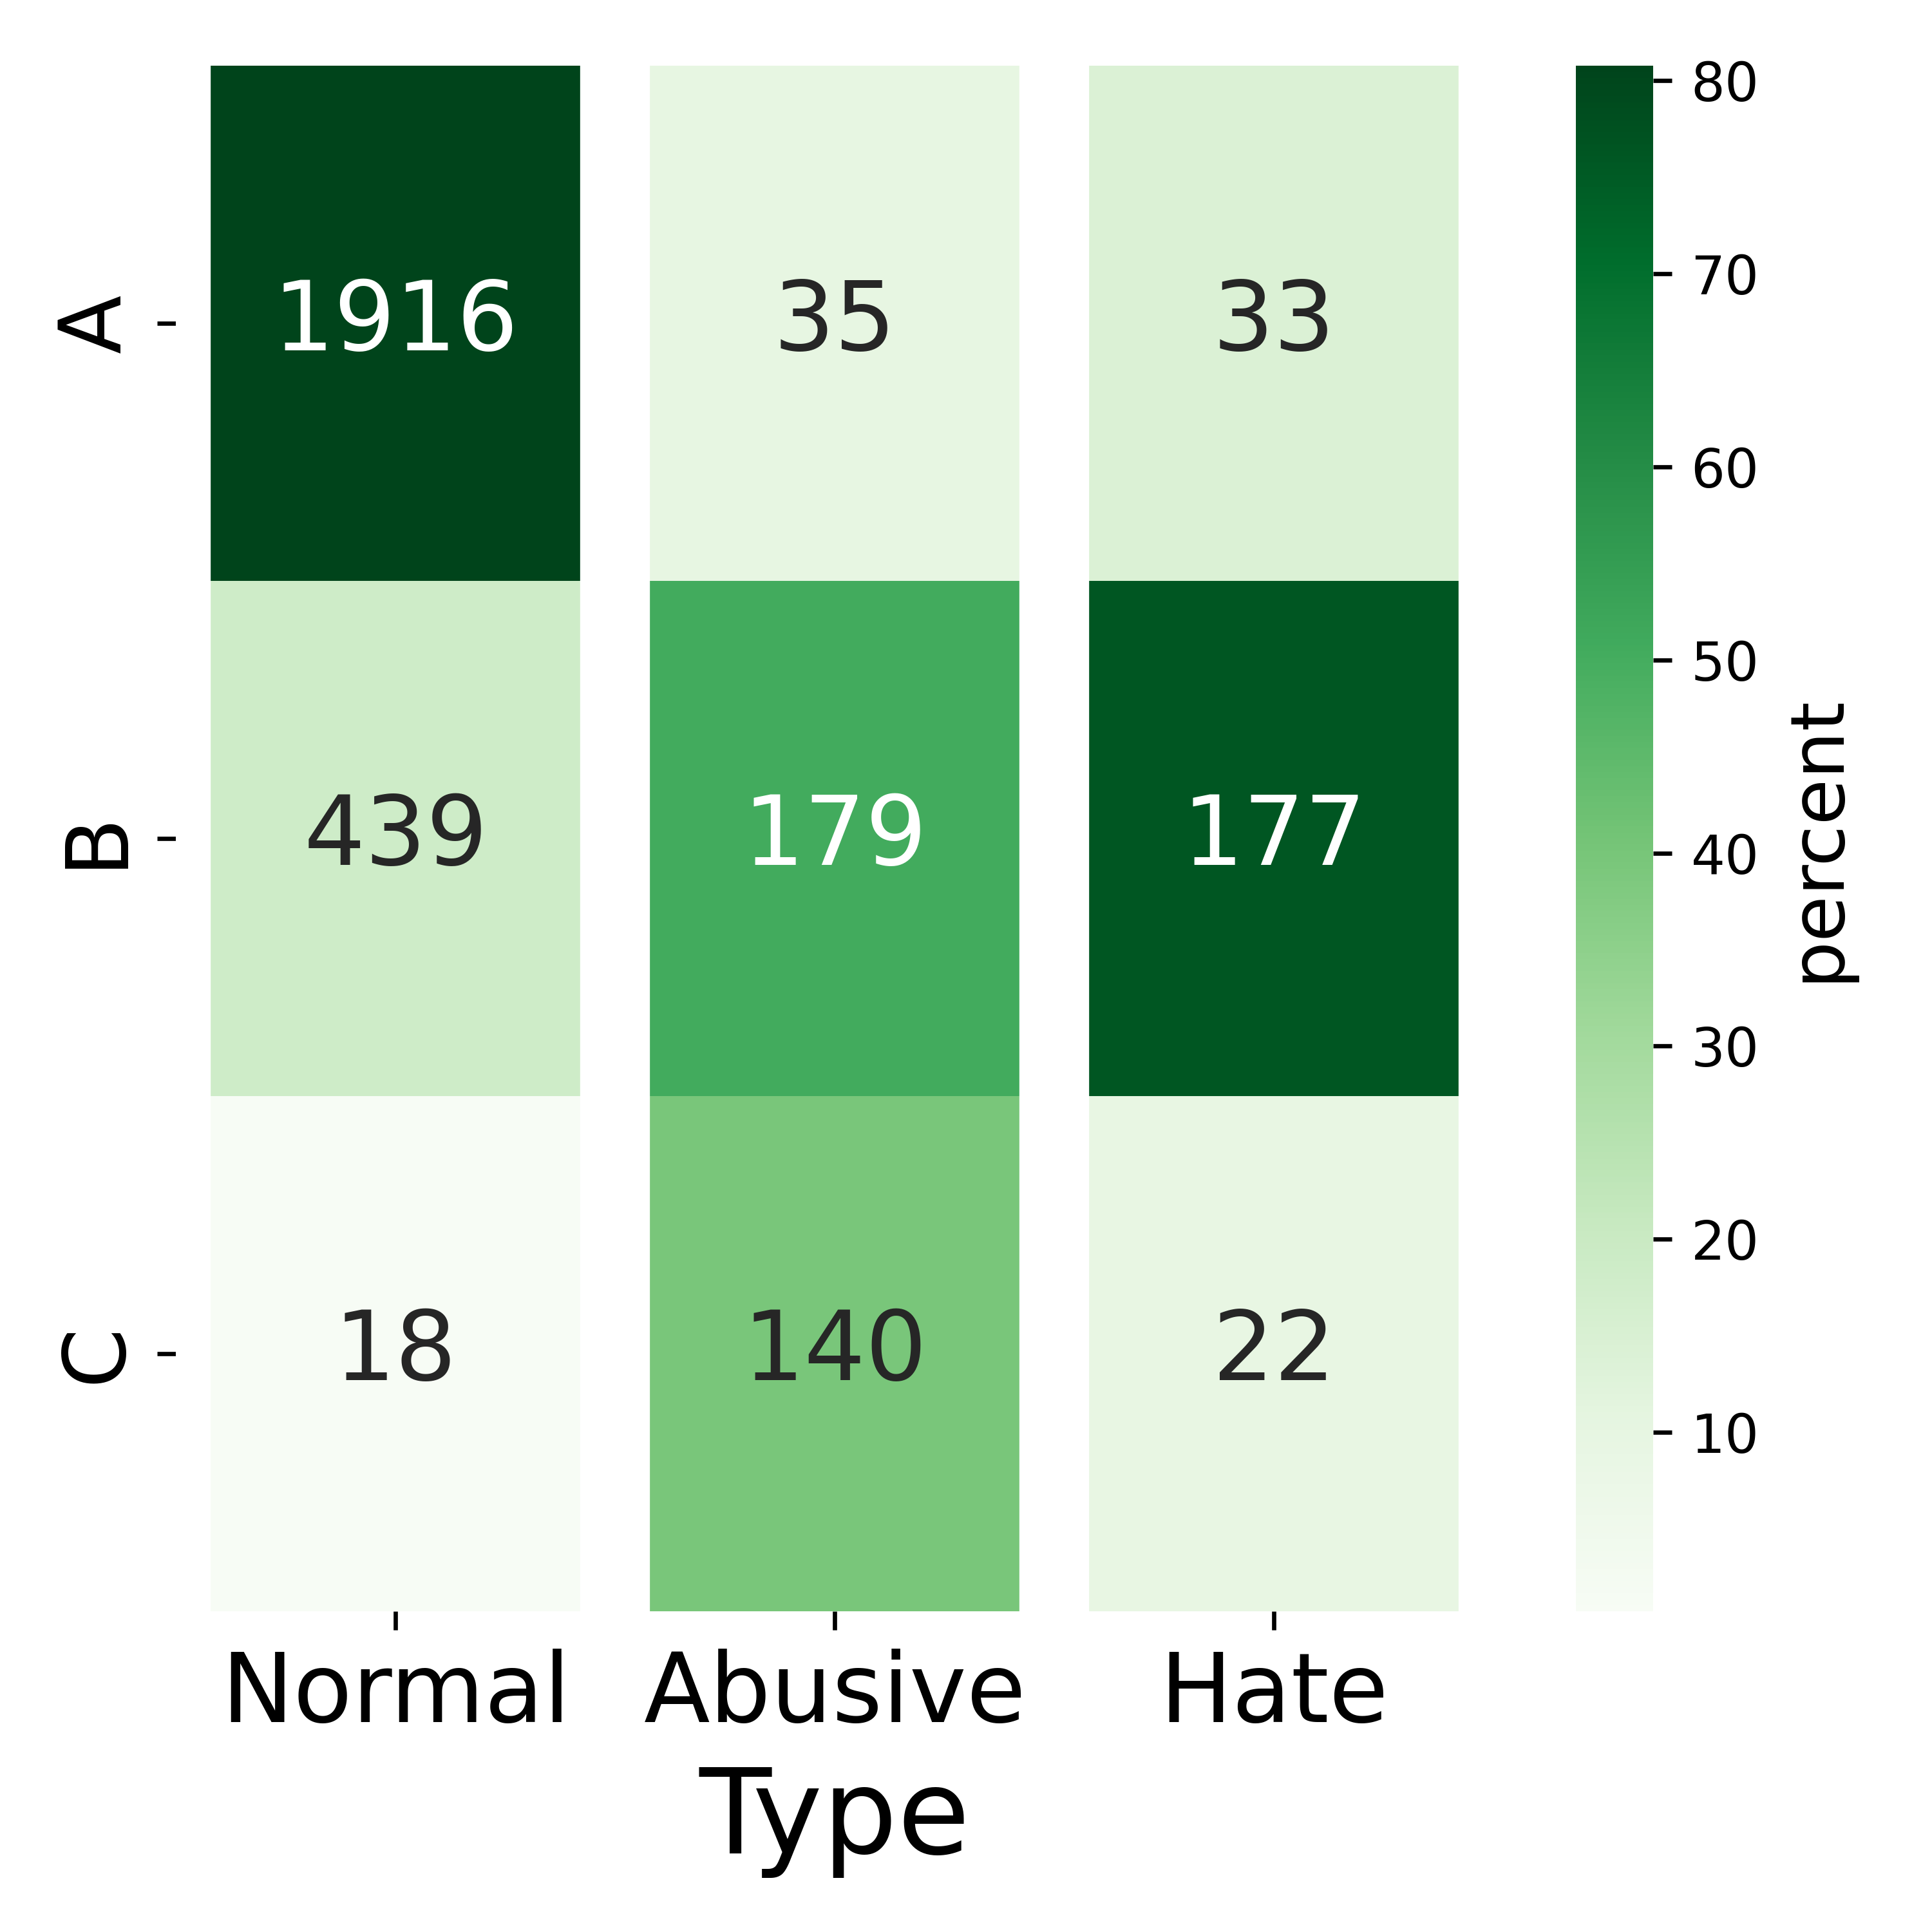
Annotation Class For each attribute, each of the remaining 2959 tweets is assigned a value for Annotation Class based on the level of agreement between annotators: A if all annotators unanimously agree, B if annotators differ on exactly 2 categories, and C if each of the attribute’s available categories is selected by at least 1 annotator. Fig. 3 displays the contingency tables between our attributes and their corresponding Annotation Classes. The background color gradient correlates to each cell’s column-wise percentage.
We observe that Target only contains 2 Annotation Classes. For the Not Aggressive and Very Aggressive categories, Class A and B dominate respectively, indicating strong general agreement. On the other hand, Somewhat Aggressive sees 51 instances (7.3% of this category) where annotators could not reach consensus (Class C) and a majority of this category (61%) falls within Class B. More pronounced levels of disagreement is observed for Type attribute. While Class C instances appear in both Neither and Hate categories, this class slightly trails behind Class B (40% vs. 51%) whereas Class A occupies only 10% of the Abusive category. In addition to the class imbalance of final aggregate labels, these statistics reveal another dimension of implicit imbalance of annotator agreement.
Comparison to other Datasets Among recent works on COVID-related hate speech, He et al. [26] employed 2 undergraduate annotators to label 3255 tweets on anti-Asian hate and counter-hate speech under the authors’ supervision. Vidgen et al. [27] used a team of experienced annotators from United Kingdom, Europe and South America to obtain annotations on Hostility, Criticism, Discussion and Counter speech of East-Asian entities, with adjudication from PhD-level experts. An et al. [33] focused on characterizing anti-Asian hateful Twitter users. Complimenting these pioneering research our dataset offers more levels of granularity using crowdsourced annotation instead of experts. We believe that the varying levels of agreements demonstrated in the preceding section reflect the subtle diversity of opinions in the discussion of COVID-related hate speech. Thus, we strive to incorporate this information in our subsequent classification tasks.
IV Model Development
In this section, we develop various models to classify the tweets according to our attributes. From this point, we refer to the classification of the attributes Aggression, Target and Type as Task 1, 2 and 3, respectively. We further convert the annotations for each tweets into probability distributions, or soft labels, while the silver label is derived from majority voting. For instance, a tweet with a 3-way split among Normal, Abusive and Hate for the Type attribute would have the soft label and the silver label Abusive. The soft labels’ indices are arranged in the same order as their corresponding attribute introduced in Section III.
IV-A Tweet Pre-processing
To be consistent with the content seen by AMT workers, we remove all non-ASCII character from the tweets and convert them to lower case. We further remove all retweet identifiers (‘rt’), and substitute hyperlinks with the token. All patterns of emoticons and emojis are also removed. Mentions of other usernames are replaced with the tokens. Groups of repetitive patterns are replaced with a single representative (e.g.: “a a a” becomes “a”). Since hashtags may express relevant sentiments to our tasks, we process them with a specialized approach. We first remove the ‘#’ sign. If a hashtag is in our list of hate phrases or [25]’s specified keywords, we keep them as is. For other hashtags, we segment them into separate tokens using the Ekphrasis333Available at https://github.com/cbaziotis/ekphrasis Python library.
IV-B Architectures
Architectures based on BERT (Bidirectional Encoder Representations from Transformers) have proven particularly versatile in sentiment-related classification tasks [16]. In our work, we employ RoBERTa (Robustly Optimized BERT Approach) as the basis of our models. In contrast to BERT, RoBERTA is pre-trained with only the Masked Language Modeling (MLM) objective on large English corpora, allowing the model to learn contextual word representations that are highly leverageable for downstream tasks.
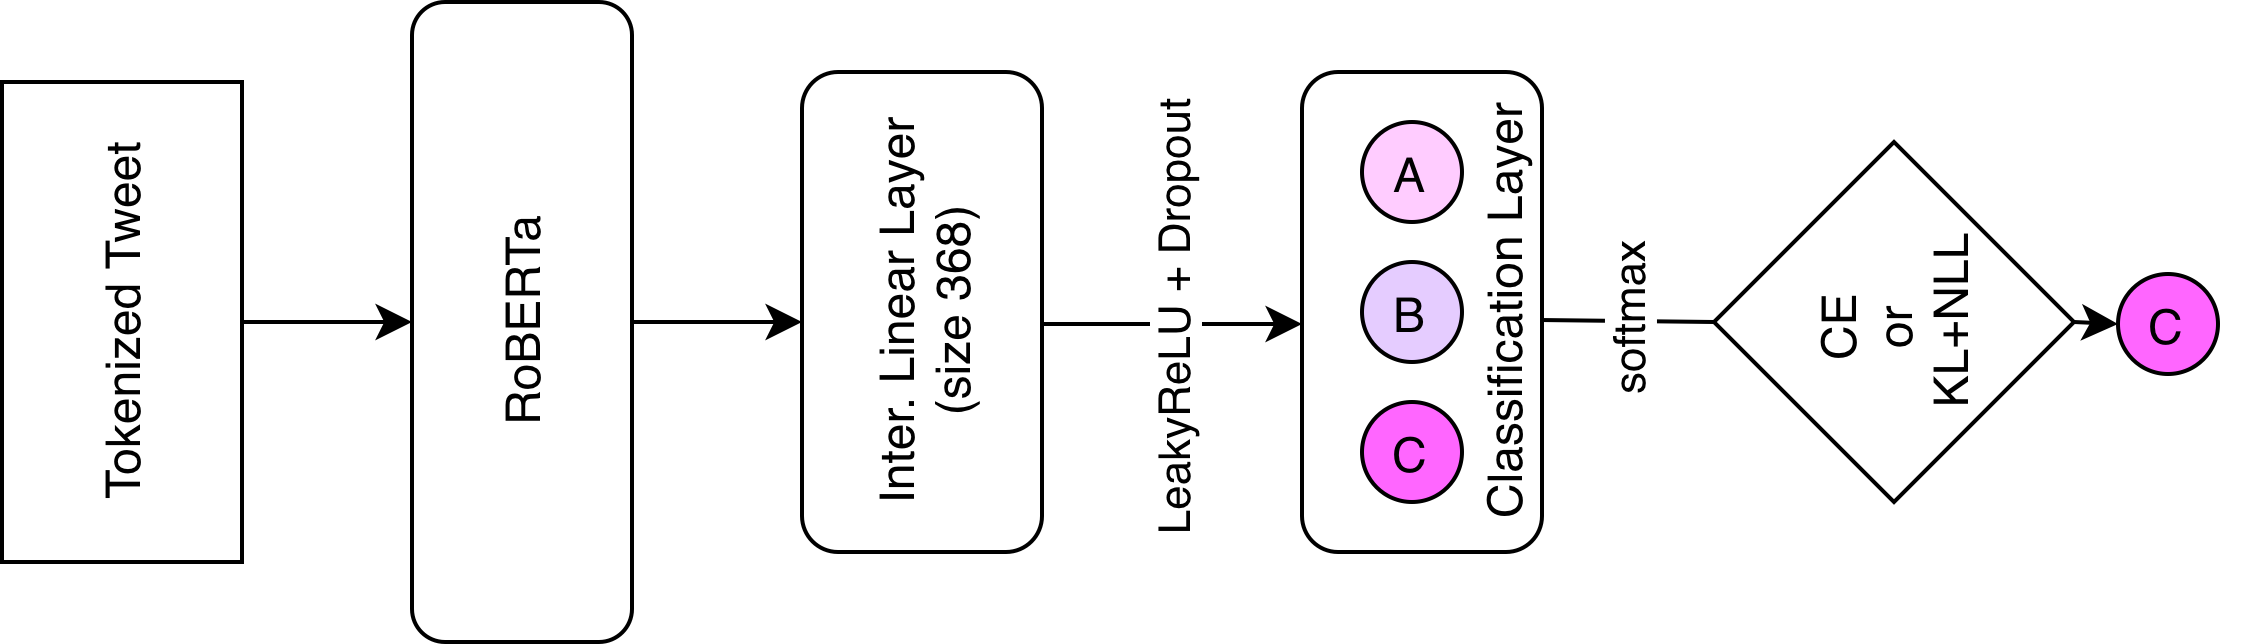
To accommodate computational constrains, we choose RoBERTabase from the HuggingFace library, which contains 12 layers of transformers blocks, 12 attention heads and approximately 125 million trainable parameters. Fig. 4(a) illustrates the following general architecture. Processed tweets are tokenized by the RoBERTaTokenizer, then fed in mini-batches as inputs to to the RoBERTabase model. We keep the last-layer hidden state (size 768) of the sequence’s classification token [CLS] and connect it to an intermediate linear layer of size 364. We apply the LeakyReLU activation function and DropOut to this layer’s outputs before connecting them to the final linear classification layers, whose sizes correspond to the number of categories in each task. A Softmax function is applied to this layer’s outputs to normalize logits into final predicted probabilities. We distinguish the following models based on their objective functions.

RoBERTa_CE This model seeks to minimize the classic Cross Entropy (CE) loss function. Equation (1) describes the loss function for each mini batch, where N denotes the number of samples in each batch, the model’s predicted probabilities, and the singular silver label as previously described.
| (1) |
RoBERTa_KLNLL In contrast, this model simultaneously minimizes a combination of the Kullback–Leibler Divergence (KL) and Negative Log-likelihood (NLL) loss functions. The KL loss provides a measure of how one probability distribution is different from another while the NLL function calculates the negative logarithm of the model’s predicted probabilities. It is important to note that we use the PyTorch implementation of NLL loss, which only considers the predicted probability of the correct class, i.e.: . In (2), and are scalars that control the contribution of each function to the final loss value. We also apply a Softmax function to the raw soft label distributions, denoted by , to be the target of the KL loss. This objective function is designed to incorporate soft labels, which contains information about agreement among annotators, and silver labels, which are derived from soft labels.
| (2) |
Class Weights To counteract class imbalance, we incorporate class weights into our loss functions. For each task, each sample is attributed a weight corresponding to its category as described in (3), where is the total number of observations in the training set, the number of categories for that task (attribute) and the number of samples in that category . Weights are applied to the corresponding samples in the calculation of the CE and NLL loss functions above.
| (3) |
IV-C Training Regiment
Evaluation Metrics Precision, Recall and F1 scores are chosen as performance metrics due to to the multi-categorical and imbalance nature of our tasks. In (4), TP stands for True Positives, FP False Positives and FN False Negatives. Precision (P) gives the proportion of correct instances (TP) instances out of all samples that are predicted to belong to a category. On the other hand, Recall (R) gives the proportion of correctly predicted instances out of all samples that belong to the silver label. F1 score is the harmonic mean of Precision and Recall. Our models are evaluated on macro metrics, the numerical means of Precision, Recall and F1 respectively, over all categories of the corresponding task.
| (4) |
Training Details We train our models using Google Collab Pro with GPU Tesla P100 with 16GB of RAM. The data is split using approximately 80:20 ratio, with 2400 samples in the training set and 559 in the test set. Models are optimized using the AdamW optimizer. Dropout’s probability is set to 0.2. We tune hyperparameters using 4-fold cross-validation on the training set to select values that yield the best macro F1 metrics. The following sets are candidates for tuning with chosen values in bold: learning rate {1e-5, 2e-5, 3e-5}, batch size {10, 20, 30}, maximum length of sequence {150, 200, 250, 300}, number of epochs {2, 3, 4, 5}, and {0.2, 0.5, 0.8, 1} . Specific values are reported in the sections below. Once determined, the models are trained using these sets on the entire train data and evaluated on the test data.
IV-C1 Single Task Training
We perform experiments to examine whether the best performance is achieved when the tasks are trained simultaneously or individually. For this regiment, the models are trained independently for each of the 3 tasks. Loss functions are evaluated with respect to the soft and silver labels of the corresponding tasks. Table IV-C1 reports the specific values for the chosen hyperparameters for each model.
(for model names, R is short for Roberta)
| Model | Task | Learn. | |||||
| Batch | Rate | ||||||
| Max | |||||||
| Num | |||||||
| R_CE | 1 | 2e-05 | 20 | 250 | 3 | N/A | N/A |
| 2 | 5 | ||||||
| 3 | 3 | ||||||
| R_KLNLL | 1 | 3 | 1 | 0.5 | |||
| 2 | 2 | 0.2 | |||||
| 3 | 2 | 0.2 |
IV-C2 Multitask Training
In contrast, in multitask setting, a single model is trained to produce outputs for all 3 tasks simultaneously. As illustrated in Fig. 4(b) all components up to and including the intermediate linear layer are shared, with only the final classification layers separate for each task. The final loss function is now a weighted combination of all 3 tasks, as shown in (5) where and , denotes the weight and value of each component’s loss, respectively.
| (5) |
’s are tuned among candidate values (0.2, 0.5, 0.8, 1) also using 4-fold cross validation on the train set. Values that yield the highest average macro-F1 score for all 3 tasks are selected for final training. Multitasks RoBERTa_CE models are trained for 3 epochs while its KL_NLL counterpart only 2. To achieve reported performance, Multitask RoBERTa_KLNLL’s learning rate of Task 1’s classification layer is set to 2.5e-5, and final ’s to 0.2, 0.2, 1 for Task 1, 2 and 3, respectively. All other hyperparameters stay consistent with their reported counterparts in Table IV-C1.
Single Task Training Model Task 1: Aggression Task 2: Target Task 3: Label Precision Recall F1 Precision Recall F1 Precision Recall F1 RoBERTa_CE 0.63 +- 0.04 0.63 +- 0.02 0.63 +- 0.03 0.81 +- 0.01 0.87 +- 0.02 0.83 +- 0.01 0.57 +- 0.03 0.61 +- 0.03 0.57 +- 0.03 RoBERTa_KLNLLno softmax 0.67 +- 0.03 0.63 +- 0.02 0.64 +- 0.02 0.80 +- 0.01 0.89 +- 0.01 0.83 +- 0.01 0.59 +- 0.02 0.61 +- 0.05 0.59 +- 0.04 RoBERTa_KLNLLsoftmax 0.72 +- 0.09 0.64 +- 0.01 0.66 +- 0.02 0.81 +- 0.01 0.89 +- 0.01 0.84 +- 0.01 0.62 +- 0.02 0.64 +- 0.02 0.62 +- 0.02 Multitask Training RoBERTa_CEequal 0.60 +- 0.01 0.66 +- 0.03 0.62 +- 0.01 0.80 +- 0.01 0.91 +- 0.01 0.83 +- 0.00 0.57 +- 0.02 0.66 +- 0.03 0.59 +- 0.02 RoBERTa_KLNLLequal 0.66 +- 0.03 0.66 +- 0.02 0.66 +- 0.02 0.80 +- 0.01 0.89 +- 0.01 0.84 +- 0.01 0.61 +- 0.01 0.63 +- 0.02 0.58 +- 0.01 RoBERTa_KLNLLtuned 0.66 +- 0.01 0.66 +- 0.04 0.65 +- 0.02 0.82 +- 0.01 0.86 +- 0.01 0.84 +- 0.01 0.63 +- 0.02 0.64 +- 0.02 0.62 +- 0.02 RoBERTa_KLNLLensemble5 0.69 0.66 0.67 0.83 0.86 0.84 0.65 0.67 0.65
| Task 1 | Task 2 | Task 3 | ||||||||||||||
|---|---|---|---|---|---|---|---|---|---|---|---|---|---|---|---|---|
| Not | Somewhat | Very | N/A | anti-Asian | Normal | Abusive | Hate | |||||||||
| Precision | 0.91 | 0.90 | 0.61 | 0.69 | 0.28 | 0.47 | 0.99 | 0.96 | 0.61 | 0.69 | 0.95 | 0.93 | 0.38 | 0.54 | 0.39 | 0.47 |
| Recall | 0.89 | 0.93 | 0.61 | 0.62 | 0.50 | 0.44 | 0.89 | 0.94 | 0.94 | 0.79 | 0.87 | 0.93 | 0.43 | 0.45 | 0.70 | 0.65 |
| F1 | 0.90 | 0.91 | 0.61 | 0.65 | 0.36 | 0.46 | 0.94 | 0.95 | 0.74 | 0.74 | 0.91 | 0.93 | 0.40 | 0.49 | 0.50 | 0.50 |
V Results
Due to the small size of our dataset, each model is trained and evaluated over 5 random seeds. In Table III, we present the average and standard deviation (SD) of macro Precision, Recall and F1 scores over these runs to compare the models’ performance in each setting.
V-A Single Task Performance
We observe that RoBERTa_CE provides respectable performance. Unsurprisingly, the model achieves the highest F1 score at above 0.8 on the binary classification Task 2 of predicting targets. Task 1 yields the next best result with F1 reaching 0.63 while Task 3 emerges the most challenging, yielding F1 not reaching 0.6. Overall, this discrepancy among results appear consistent with the corresponding attribute’s level of (dis)agreement among annotations discussed in Section III.
For RoBERTa_KLNLL, we also present results where the raw soft labels are use instead of to calculate the KL Divergence component in (2) as a reference point. This RoBERTa_KLNLLno_softmax model does achieve 4 points and 1 point respective increase in Task 1’s Precision and F1 scores, and 2 points for Task 3’s. These considerable improvements demonstrate the efficacy of leveraging soft labels’ information to assist the model in predicting the final silver labels. By minimizing the KL divergence from the soft labels, the model is equipped to predict distribution of annotations, enhancing the ultimate classifications.
Using allows RoBERTa_KLNLL (denoted RoBERTa_KLNLLsoftmax) to gain further improvements across the board. In fact, Task 2 now sees a 1 point increase in F1 (0.84) over the other 2 models whereas Task 3’s F1 score now jumps to 0.62 from RoBERTa_CE’s 0.57, an 8.8% boost. We acknowledge that this model’s Precision score of 0.72 may be inflated by some outlier results (0.9 SD). However, the corresponding F1 score of 0.66 corroborates RoBERTa softmax’s superior performance.
Why ? Applying the Softmax function to raw soft labels, which are already discrete probability distributions themselves, reduces the overall range of the distribution. For example, a soft label distribution of then becomes approximately post-Softmax, with the index of the maximum value unchanged. On the other hand, an equally divisive tweet of Annotation Class C retains its soft label of regardless. RoBERTa_KLNLLsoftmax’s most significant improvement in F1 scores over RoBERTa_CE in Task 3, which has the most diverse Annotation Class distribution among all tasks, demonstrates the advantage of minimizing the KL Divergence from the flattened distribution. Furthermore, the component is expected to guide the model to allocate more probability mass towards the correct class, especially in cases of ambiguous agreement.
V-B Multitask Performance
In Table III, we present the macro results for the multitask RoBERTa_CE where ’s = 1, denoted RoBERTa_CEequal, as baseline for this setting. This model yields significantly higher Recalls at the cost of generally lower Precisions, resulting in overall worse F1 scores compared to its single task counterpart. In contrast, RoBERTa_KLNLL with ’s = 1, also denoted with the subscript “equal”, achieves much better performance, with Task 1 and 2’s F1 scores comparable to its single task counterparts. However, RoBERTa_KLNLLequal under-performs in Task 3, with F1 score of only 0.58.
Using the values of 0.2, 0.2, 1 for respectively, RoBERTa_KLNLLtuned recovers its expected Task 3’s F1 score of 0.62 while only having a slightly lower F1 score in Task 1 (0.65 vs 0.66). For Task 2, RoBERTa_KLNLLtuned yields a Recall of 0.86, 3 points lower than its single task’s 0.89, but makes up with Precision of 0.82 and an F1 score equal to its single task version (0.84). We note that this set of ’s essentially treats Task 3 as the main task while the other 2 as auxiliary.
Multitask over Single Task? By sharing all but the final classification layers, multitask training reduces the number of trainable parameters by almost 3 times as opposed to training separately. Furthermore, our annotation template does not allow a tweet to be labelled Not Aggressive yet have a non-neutral Target or Speech Type. Multitask training allows RoBERTa_KLNLL to learn this constraint, producing only 1 instance of this type of self-contradictory prediction across all 5 seeds whereas single task training produces 61 instances.
Ensemble Classifier We construct an ensemble classifier, denoted RoBERTA_KLNLLensemble, by combining the results of each independent seed’s run via majority voting. The final predicted label per attribute for each tweet is the one with the highest frequency among all seeds’ corresponding votes. Ties are decided using the following simple logic:
-
•
Aggression: (Not, Somewhat) Not, (Somewhat, Very) Somewhat, (Not, Very) Not
-
•
Target: (N/A, anti-Asian) N/A
-
•
Type: (Normal, Abusive) Normal, (Abusive, Hate) Abusive, (Normal, Hate) Normal
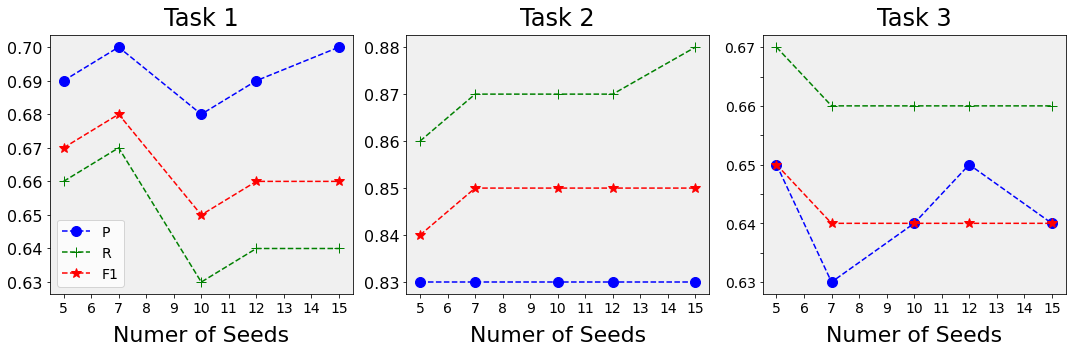
Fig. 5 displays the macro Precision, Recall and F1 scores over the test set for each task using different number of seeds. We report the set of results using 5 seeds in Table III as RoBERTa_KLNLLensemble5 for consistency. Task 1 and 2 achieve peak macro F1 scores at 7 seeds (0.68 and 0.85, respectively) while Task 3 at only 5 seeds (0.65), allowing better computational efficiency over using more (10+) seeds. Furthermore, RoBERTa_KLNLLensemble5’s results match or exceed other models’ reported means in almost all metrics, validating this simple ensemble approach’s effectiveness when only a single predicted label per attribute is demanded.
Finally, Table IV provides a side-by-side comparison between the results per category between RoBERTa_KLNLLensemble5 (right sub-columns) and the similarly constructed RoBERTa_CEensemble5 (left sub-columns). The latter model tends to over-classify samples into the more minor categories (by silver label’s frequency) to achieve higher Recall (Task 1 Very Aggressive, Task 2 anti-Asian, Task 3 Hate) at the cost of drastically lower Precision, and consequently under-classify the major neutral categories. In contrast, RoBERTa_KLNLLensemble5 yields much more balanced metrics both within and across categories, offering further evidence to support our method of combining soft and silver labels to combat class imbalance.
VI Conclusion & Future Work
In this work, we have made 3 contributions with generalizable insights into the field of hate speech detection. First, we provide a COVID-related dataset with a focus on Asians, a group often underrepresented in literature [16, 18]. Our crowdsourced annotation is an alternative approach to expert adjudication, which provides a case study where public sentiments are attached to a still-developing social phenomenon.
Due to the subjectivity of personal interpretation, there are often scenarios with no clear consensus among annotators, and we argue that this information should be incorporated in downstream classification models. Our second contribution is the proposed approach to leverage soft labels, which conveys annotators’ levels of agreement, via a simple modification of the objective functions. Our experiments show that this approach could produce considerably better results than using solely majority-voted singular labels. Third, we demonstrate a straightforward architecture along with a training regimen that is not only computationally parsimonious, but also adaptable to other datasets, tasks and/or more sophisticated models.
Our results corroborate the benefits of releasing individual annotator’s labels in addition to the singular adjudicated label [18, 17, 23, 24]. We acknowledge the limited size of our dataset, which is a result of resource constraints, a common challenge in procuring data for under-represented groups [19]. Furthermore, “Asians” and “Blacks” consist of many subgroups with diverse characteristics. We invite other researchers to extend their work towards these subgroups beyond the general umbrella categories introduced in this paper. Finally, the vast portion of available data is often unlabelled. We believe further investigation into meta learning or semi-supervised learning approaches should be considered to more effectively leverage this generally under-utilized resource.
VII Acknowledgement
Appendix
Due to space constraints, anti-Black key phrases will be released with the official repository. Anti-Asian Phrases batsoup, bioattack, blame china, boycott china, bug men, bugland, ccp, chankoro, chicom, china is asshole, chinais terrorist, china lie people die, china should apologize, china virus, china virus outbreak, chinaflu , chinazi, chi-nese propaganda, chinese virus, ching chong, chinigger, chink, chinkland , chinksect, communism kill, communistchina, fuck china, goloid, gook, gook eyed, gookie, gook-let, gooky eye, insectoid, make china pay, no asian allowed, no chinese allowed, oriental devil, pinkdick, ricenigger, wohan, wuflu, wuhancorona, wuhaninfluenza, wuhanpne-unomia, wuhansars, yellow jew, yellow nigger, yellow peril
References
- [1] Y.-C. Wu, C.-S. Chen, and Y.-J. Chan, “The outbreak of covid-19: An overview,” Journal of the Chinese medical association, vol. 83, no. 3, p. 217, 2020.
- [2] T. K. Le, L. Cha, H. R. Han, and W. Tseng, “Anti-asian xenophobia and asian american covid-19 disparities,” American journal of public health, vol. 110, no. 9, pp. 1371–1373, 2020.
- [3] A. A. Joubin, “Anti-asian racism during covid-19 pandemic, gw today, april 20, 2020,” GW Today, 2020.
- [4] J. S.-L. Kwan and K. H. Lim, “Understanding public sentiments, opinions and topics about covid-19 using twitter,” in 2020 IEEE/ACM International Conference on Advances in Social Networks Analysis and Mining (ASONAM). IEEE, 2020, pp. 623–626.
- [5] T. T. Reny and M. A. Barreto, “Xenophobia in the time of pandemic: othering, anti-asian attitudes, and covid-19,” Politics, Groups, and Identities, vol. 10, no. 2, pp. 209–232, 2022.
- [6] F. Kapadia, “Violence and the covid-19 pandemic: a public health of consequence, may 2022,” pp. 706–708, 2022.
- [7] C. Wu, Y. Qian, and R. Wilkes, “Anti-asian discrimination and the asian-white mental health gap during covid-19,” Ethnic and Racial Studies, vol. 44, no. 5, pp. 819–835, 2021.
- [8] F. Tahmasbi, L. Schild, C. Ling, J. Blackburn, G. Stringhini, Y. Zhang, and S. Zannettou, ““go eat a bat, chang!”: On the emergence of sinophobic behavior on web communities in the face of covid-19,” in Proceedings of the Web Conference 2021, 2021, pp. 1122–1133.
- [9] Y. Hswen, X. Xu, A. Hing, J. B. Hawkins, J. S. Brownstein, and G. C. Gee, “Association of “# covid19” versus “# chinesevirus” with anti-asian sentiments on twitter: March 9–23, 2020,” American Journal of Public Health, vol. 111, no. 5, pp. 956–964, 2021.
- [10] H. Budhwani, R. Sun et al., “Creating covid-19 stigma by referencing the novel coronavirus as the “chinese virus” on twitter: quantitative analysis of social media data,” Journal of Medical Internet Research, vol. 22, no. 5, p. e19301, 2020.
- [11] B. Zhong, Y. Huang, and Q. Liu, “Mental health toll from the coronavirus: Social media usage reveals wuhan residents’ depression and secondary trauma in the covid-19 outbreak,” Computers in human behavior, vol. 114, p. 106524, 2021.
- [12] F. E. Ayo, O. Folorunso, F. T. Ibharalu, and I. A. Osinuga, “Machine learning techniques for hate speech classification of twitter data: State-of-the-art, future challenges and research directions,” Computer Science Review, vol. 38, p. 100311, 2020.
- [13] S. Misra, P. D. Le, E. Goldmann, and L. H. Yang, “Psychological impact of anti-asian stigma due to the covid-19 pandemic: A call for research, practice, and policy responses.” Psychological Trauma: Theory, Research, Practice, and Policy, vol. 12, no. 5, p. 461, 2020.
- [14] S. MacAvaney, H.-R. Yao, E. Yang, K. Russell, N. Goharian, and O. Frieder, “Hate speech detection: Challenges and solutions,” PloS one, vol. 14, no. 8, p. e0221152, 2019.
- [15] A. M. Founta, C. Djouvas, D. Chatzakou, I. Leontiadis, J. Blackburn, G. Stringhini, A. Vakali, M. Sirivianos, and N. Kourtellis, “Large scale crowdsourcing and characterization of twitter abusive behavior,” in Twelfth International AAAI Conference on Web and Social Media, 2018.
- [16] P. Fortuna and S. Nunes, “A survey on automatic detection of hate speech in text,” ACM Computing Surveys (CSUR), vol. 51, no. 4, pp. 1–30, 2018.
- [17] F. Poletto, V. Basile, M. Sanguinetti, C. Bosco, and V. Patti, “Resources and benchmark corpora for hate speech detection: a systematic review,” Language Resources and Evaluation, vol. 55, no. 2, pp. 477–523, 2021.
- [18] B. Vidgen and L. Derczynski, “Directions in abusive language training data, a systematic review: Garbage in, garbage out,” PloS one, vol. 15, no. 12, p. e0243300, 2020.
- [19] B. Vidgen, A. Harris, D. Nguyen, R. Tromble, S. Hale, and H. Margetts, “Challenges and frontiers in abusive content detection.” Association for Computational Linguistics, 2019.
- [20] E. Leonardelli, S. Menini, A. P. Aprosio, M. Guerini, and S. Tonelli, “Agreeing to disagree: Annotating offensive language datasets with annotators’ disagreement,” in Proceedings of the 2021 Conference on Empirical Methods in Natural Language Processing, 2021, pp. 10 528–10 539.
- [21] S. Larimore, I. Kennedy, B. Haskett, and A. Arseniev-Koehler, “Reconsidering annotator disagreement about racist language: Noise or signal?” in Proceedings of the Ninth International Workshop on Natural Language Processing for Social Media, 2021, pp. 81–90.
- [22] X. Zhou, M. Sap, S. Swayamdipta, Y. Choi, and N. Smith, “Challenges in automated debiasing for toxic language detection,” in Proceedings of the 16th Conference of the European Chapter of the Association for Computational Linguistics: Main Volume. Association for Computational Linguistics, Apr. 2021, pp. 3143–3155.
- [23] T. Fornaciari, A. Uma, S. Paun, B. Plank, D. Hovy, and M. Poesio, “Beyond black & white: Leveraging annotator disagreement via soft-label multi-task learning,” in Proceedings of the 2021 Conference of the North American Chapter of the Association for Computational Linguistics: Human Language Technologies, 2021, pp. 2591–2597.
- [24] A. M. Davani, M. Díaz, and V. Prabhakaran, “Dealing with disagreements: Looking beyond the majority vote in subjective annotations,” Transactions of the Association for Computational Linguistics, vol. 10, pp. 92–110, 2022.
- [25] E. Chen, K. Lerman, E. Ferrara et al., “Tracking social media discourse about the covid-19 pandemic: Development of a public coronavirus twitter data set,” JMIR Public Health and Surveillance, vol. 6, no. 2, p. e19273, 2020.
- [26] B. He, C. Ziems, S. Soni, N. Ramakrishnan, D. Yang, and S. Kumar, “Racism is a virus: anti-asian hate and counterspeech in social media during the covid-19 crisis,” in Proceedings of the 2021 IEEE/ACM International Conference on Advances in Social Networks Analysis and Mining, 2021, pp. 90–94.
- [27] B. Vidgen, S. Hale, E. Guest, H. Margetts, D. Broniatowski, Z. Waseem, A. Botelho, M. Hall, and R. Tromble, “Detecting east asian prejudice on social media,” in Proceedings of the Fourth Workshop on Online Abuse and Harms, 2020, pp. 162–172.
- [28] M. Sap, D. Card, S. Gabriel, Y. Choi, and N. A. Smith, “The risk of racial bias in hate speech detection,” in Proceedings of the 57th annual meeting of the association for computational linguistics, 2019, pp. 1668–1678.
- [29] D. Chatzakou, N. Kourtellis, J. Blackburn, E. De Cristofaro, G. Stringhini, and A. Vakali, “Mean birds: Detecting aggression and bullying on twitter,” in Proceedings of the 2017 ACM on web science conference, 2017, pp. 13–22.
- [30] S. Assimakopoulos, R. V. Muskat, L. van der Plas, and A. Gatt, “Annotating for hate speech: The maneco corpus and some input from critical discourse analysis,” in Proceedings of the 12th Language Resources and Evaluation Conference, 2020, pp. 5088–5097.
- [31] M. Zampieri, S. Malmasi, P. Nakov, S. Rosenthal, N. Farra, and R. Kumar, “Predicting the type and target of offensive posts in social media,” in Proceedings of the 2019 Conference of the North American Chapter of the Association for Computational Linguistics: Human Language Technologies, Volume 1 (Long and Short Papers), 2019, pp. 1415–1420.
- [32] [Online]. Available: https://developers.perspectiveapi.com/s/
- [33] J. An, H. Kwak, C. S. Lee, B. Jun, and Y.-Y. Ahn, “Predicting anti-asian hateful users on twitter during covid-19,” in Findings of the Association for Computational Linguistics: EMNLP 2021, 2021, pp. 4655–4666.