Lithium-ion battery degradation: how to model it
Abstract
Predicting lithium-ion battery degradation is worth billions to the global automotive, aviation and energy storage industries, to improve performance and safety and reduce warranty liabilities. However, very few published models of battery degradation explicitly consider the interactions between more than two degradation mechanisms, and none do so within a single electrode. In this paper, the first published attempt to directly couple more than two degradation mechanisms in the negative electrode is reported. The results are used to map different pathways through the complicated path dependent and non-linear degradation space. Four degradation mechanisms are coupled in PyBaMM, an open source modelling environment uniquely developed to allow new physics to be implemented and explored quickly and easily. Crucially it is possible to see ‘inside’ the model and observe the consequences of the different patterns of degradation, such as loss of lithium inventory and loss of active material. For the same cell, five different pathways that can result in end-of-life have already been found, depending on how the cell is used. Such information would enable a product designer to either extend life or predict life based upon the usage pattern. However, parameterization of the degradation models remains as a major challenge, and requires the attention of the international battery community.
Broader context
Lithium-ion batteries were originally developed for portable electronics, for which energy and power density are of greater concern than lifetime. With their expansion into transport and energy storage applications, lifetime has become a significant concern. Many different degradation mechanisms occur inside LIBs and none of them can be measured directly during operation, only their consequences can be ‘observed’ as capacity and power fade. In contrast, computer simulations allow access to the internal states of the battery and track the evolution of each relevant degradation mechanism. While many models of LIB degradation exist, only few consider more than two mechanisms, and even fewer consider direct interactions between the mechanisms. Yet, degradation in a real battery involves multiple mechanisms that are strongly coupled with each other. In this work, the open-source modelling environment Python Battery Mathematical Modelling (PyBaMM) is modified to include four different degradation mechanisms, all of which directly interact with each other. Being open-source makes it possible for other researchers to easily reproduce and build upon this work, adding more degradation mechanisms and studying their interactions. This is therefore an important step on the path towards a universal model for lithium-ion battery degradation.
1 Introduction
Lithium-ion batteries (LiBs) have already transformed our world by triggering a revolution in portable electronics. They are now enabling further transformations in electric vehicles (EVs) and stationary energy storage applications [1]. However, in these applications, the batteries are operated in harsher conditions and required to last longer. As a result, cycle life and safety have become the main concern, prompting a significant increase in research into the physics of battery degradation. A comprehensive review of LiB degradation was published in 2005 [2], but the expansion in LiB applications has prompted many more reviews in recent years, each with a different focus. Hendricks et al. [3] and Birkl et al. [4] focus on diagnosing degradation, Han et al. [5] and Tomaszewska et al. [6] focus on the effect of cycling conditions, and Edge et al. [7] focus on the interactions between different degradation mechanisms.
While experiments, both destructive and life cycle testing, provide essential information, much can be achieved by models, as long as they are proved to be trustworthy in their prediction of degradation. It is important to include the interactions between degradation mechanisms, as behaviour of combined mechanisms cannot always be reproduced by combining individual mechanisms. Empirical models may capture this combined behaviour, but they can offer insights into how to prevent degradation only when combined with physics-based models.
In their review of interactions between degradation mechanisms, Edge et al. [7] reported that several computational studies have attempted to analyse some of these interactions, but few included more than two mechanisms. Lin et al. [8] modelled solid-electrolyte interphase (SEI) growth on the negative electrode, Mn dissolution from the positive electrode, Mn deposition on the negative electrode and hydrogen gas evolution. Jin et al. [9] modelled SEI growth and mechanical loss of active material in both electrodes. Reniers, Mulder and Howey [10] modelled SEI growth, lithium plating and mechanical loss of active material in the negative electrode, and Mn dissolution from the positive electrode. Li, Landers and Park modelled SEI growth on cracks in the negative electrode particles, alongside the Mn dissolution equations of Lin et al. . Keil and Jossen [11] focused on degradation at the negative electrode, modelling partially reversible lithium plating and SEI growth on cracks.
Crucially, none of these studies consider the direct interactions between more than two mechanisms in the same electrode. Instead, they focused on indirect interactions, where each mechanism affects the underlying battery model, which, in turn, affects the other mechanisms. Sections 2.5 and 2.6 explore this distinction in-depth.
In this work, a Doyle-Fuller-Newman (DFN) model is created that includes strongly coupled models of degradation in the graphite negative electrode and is implemented in PyBaMM [12]. The interaction between Li plating and the SEI is modelled by letting plated Li decay into inactive “dead lithium” over time. The thicker the SEI, the slower the rate of dead lithium formation. Electrode crack propagation and particle fracture are unified into a single stress-based model [13]. Solvent diffusion-limited SEI growth occurs on the crack surfaces as they propagate [14].
2 Degradation mechanisms
The degradation mechanisms specific to the graphite negative electrode are generally better understood than those specific to the positive electrode, making the negative electrode the main focus of this work. As particle fracture is known to occur in both electrodes, this one degradation mechanism is also simulated at the positive electrode side.
2.1 SEI layer growth
The organic electrolytes used in most LiBs are unstable at voltages below 1 V vs. Li/Li+ [15]. Lithiated graphite has an equilibrium potential well below this threshold, causing the electrolyte to break down, reacting with the lithiated graphite and forming an SEI layer on the graphite surface.
The SEI contributes to battery degradation in several ways. The compounds in the SEI contain lithium, trapping it and preventing it from participating in charge storage; an effect known as loss of lithium inventory. The SEI also increases impedance in a more direct way; while Li+ ions can move through the SEI, its ionic resistance is higher than that of the electrolyte.
The model developed by Safari et al. [16] has become the basis for most SEI models in the current literature. Safari et al. noted that the main SEI reaction, in which Li+ reacts with one of the organic solvents, is limited by two factors. First, the solvent molecule must diffuse through the existing SEI to reach the graphite surface. Then, the graphite must supply an electron to reduce the solvent molecule. Safari et al. ’s model accounts for both these limitations, but found that the diffusion-limited regime provides the best fit to experimental data. A simplified diffusion-limited model is therefore used in this work.
2.2 Lithium plating
Another side reaction that occurs on the negative electrode is lithium plating, where Li+ ions from the electrolyte form Li metal on the graphite surface, instead of intercalating into the graphite bulk. Li plating has been reviewed in dedicated papers [17, 18] and as part of a wider review of fast charging [6]. It occurs under conditions that slow down the main intercalation reaction, such as low temperatures or when the graphite surface is fully lithiated, making the competing Li plating reaction more favourable. Conditions that raise the electrolyte potential to unusually high levels, such as fast charging or pore clogging, also cause Li plating.
As with other electroplating reactions, there exists a reverse process, termed Li stripping, in which the Li metal atoms are oxidized and return to the electrolyte as Li+ ions. However, the surface of the Li metal exposed to the electrolyte reacts with it to form SEI, so not all of the lithium can be recovered via stripping. SEI growth atop plated Li can cause parts of the Li metal deposit to become electrically isolated, forming ”dead lithium” that cannot be recovered [19, 20].
The first model of Li plating and stripping on graphite was reported by Arora, Doyle and White [21], who used a Butler-Volmer equation for plating/stripping. However, there is no dependence on the amount of plated Li in their model, causing it to predict negative values of the plated Li when all Li is stripped. This means the model can only be used for charge and not for discharge. Despite this limitation, the model received experimental validation from Ge et al. [22].
The three-way interaction between Li plating, stripping and SEI formation has resulted in a range of models in recent years. Yang et al. [23] used a simplified version of Safari et al. ’s [16] model of SEI growth and a simple Tafel equation for irreversible Li plating. Their follow-up paper [24] introduced an updated Butler-Volmer equation including dependence on the amount of plated Li, taken from work on lithium metal batteries [25]. Ren et al. [19] and von Lüders et al. [26] used a different approach, multiplying Arora, Doyle and White’s original equation by a function that becomes zero when all the lithium is stripped, preventing the plated Li from going negative. Zhao et al. [20] let a preset fraction of plated Li turn into irreversible SEI instantaneously upon plating. Keil and Jossen [11] made this fraction time-dependent to achieve an excellent fit to experimental data. However, no models exist where plated Li gradually turns into SEI over time. A first step towards such a model is proposed in this work.
2.3 Particle fracture
The volume of the electrode changes substantially during cycling, e.g. for graphite it expands on lithiation and contracts on delithiation. Concentration gradients inside the particles therefore cause mechanical stress, which can cause cracks to develop [27]. Cracking occurs more severely during higher currents and for larger particle sizes [28]. Towards the end of battery life, complete fracture can occur, often close to the separator, due to the higher local reaction current density during cycling [29].
Electrode particle fracture causes degradation in three ways. The cracks reveal additional surface area for SEI growth, causing further loss of lithium inventory [30]. The conductive additives can also detach from the particles during delithiation [29], leading to a loss in electronic conductivity. Complete fracture or complete detachment from the binder causes the particle to become electrically isolated, causing loss of active material [31, 32].
Different models for particle cracking have been proposed, depending on the length scale of the problem. At cell level, a fatigue crack model (Paris’ model) has been introduced to the single particle model (SPM) and coupled with the SEI formation and growth [30]. At electrode level, the morphology of LiNixMnyCozO2 positive electrodes has been studied by Xu et al. [29], using finite element methods in 3D. At particle level, Laresgoiti et al. [32] calculated the mechanical stress inside the graphite and SEI separately. The model presented in this work combines these three relevant models, while keeping the computational load manageable, as explained in Sections 3.3 and 3.4
2.4 Other degradation mechanisms
Degradation mechanisms specific to the positive electrode are less well understood, but are known to include irreversible phase changes [33], transition metal dissolution and formation of a positive SEI (pSEI) layer on the cathode particles. Transition metals, especially Mn, can also migrate to the negative electrode and be deposited there in a similar process to lithium plating [34]. Unlike SEI growth or Li plating, new models are required, such as that developed for irreversible phase changes in NMC positive electrodes [35]. Including these mechanisms remains the topic of future work.
Another factor neglected in this work is the increasing use of composite electrodes with more than one type of particle. In electrodes with a bimodal size distribution, the particles can be classified as small and large [36], which impacts mechanical degradation. The increasing use of graphite negative electrodes with a small fraction of SiOx particles also presents a challenge to modelling mechanical degradation. These electrodes have higher capacity but show strong hysteresis [37] and are highly vulnerable to mechanical degradation due to the large volume change of the SiOx particles on lithiation.
2.5 Indirect interactions
All mechanisms contribute to five degradation modes [7]: loss of lithium inventory (LLI), loss of active material (LAM) in the negative and positive electrodes, stoichiometric drift and impedance change. SEI formation causes LLI by immobilising Li+ ions and impedance changes via film resistance and pore clogging [16]. Lithium plating causes LLI in the most literal sense by forming dead lithium and also causes some impedance changes via pore clogging [17]. Particle fracture can contribute to all five modes: LLI by enabling additional SEI formation on cracks [38], impedance changes including binder degradation [29] and LAM in the extreme case when particles detach completely [31, 32].
The five degradation modes affect the degradation mechanisms, resulting in feedback loops, both positive and negative [7]. LLI results in negative feedback. Having less cyclable lithium inhibits lithium plating, by preventing the negative electrode from reaching the highly lithiated state in which plating occurs [10, 39]. In contrast, impedance increase caused by pore clogging is known to aggravate Li plating by reducing the electrolyte potential [40]. LAM also triggers a positive feedback loop, as it enhances particle fracture: LAM decreases the interface area between the active material and electrolyte, thus increasing the interfacial current density and, in turn, leading to larger concentration gradients and increased mechanical stress [10].
2.6 Direct interactions
It is generally acknowledged that SEI growth is self-limiting due to the diffusion limitation of solvent molecules through the SEI. The interactions between SEI growth and other degradation mechanisms, however, are less well-researched. As mentioned in Section 2.2, the three-way interaction between Li plating, Li stripping and SEI growth has resulted in a range of models, none of which form a complete physical description. Another major interaction is the growth of SEI on fresh surface exposed by particle cracking, which has been shown to be faster than SEI growth on pre-existing surface with pre-existing SEI. [38]
Most relevant models treat crack-assisted SEI growth and mechanically-induced LAM as separate mechanisms, governed by empirical equations [9, 31, 41]. In reality they cannot be independent because they have a common origin: the mechanical stress caused by concentration gradients [32]. Crack growth and mechanical LAM are different outcomes of the same fundamental physics, so ideally should be modelled in a coupled way.
A strongly coupled model of battery degradation is presented that seeks to unify the two different forms of mechanical degradation into a single stress model, while also including the direct interactions between SEI growth, Li plating and particle cracking.
3 Governing equations
The Doyle-Fuller-Newman (DFN) model of LiBs is chosen for representing the beginning of life behaviour of the battery [42]. The system of coupled differential and algebraic equations is listed in the Supplementary Information.
3.1 SEI growth model
The solvent diffusion limited SEI growth model [14] is used in this work. In this model, the diffusion of solvent molecules through the SEI layer limits its growth. It assumes steady state, such that the flux of the solvent molecules follows Fick’s law,
| (1) | |||
| (2) | |||
| (3) |
where is the solvent concentration, is the solvent concentration in the electrolyte, is the solvent diffusion coefficient, is one location of the SEI layer and is the thickness (and also the location of the outer surface) of the SEI layer. The solution is
| (4) |
By conservation of mass, the interfacial flux density in the SEI layer is
| (5) |
The thickness growth rate of the SEI layer is
| (6) |
Equation (6) shows that the thickness of the SEI layer is determined by the square root of time. The key parameter is , which is assumed to have an Arrhenius temperature dependence:
| (7) |
where K (25 ∘C) throughout. The SEI layer is assumed to have an Ohmic resistivity , causing a voltage drop :
| (8) |
where is the interfacial current density and is defined in Table S1. This SEI growth model is a simplified version of the one used by PyBaMM, which considers two SEI layers as opposed to the single layer considered here. Details of the double-layer model are given in the Supplementary Information.
3.2 Li plating model
The first DFN model of Li plating/stripping on graphite electrodes was published by Arora, Doyle and White [21], whose Butler-Volmer equation had no dependence on the concentration of plated Li. Yang et al. [24] used an updated equation for the Li stripping flux that included concentration dependence:
| (9) |
where and both and were used as fitting parameters. The transfer coefficients and were set to 0.3 and 0.7 respectively, as Arora, Doyle and White [21] did. O’Kane et al. [43] used a simpler expression taken from Wood et al. [44]:
| (10) |
Whichever form of the Butler-Volmer equation is used, is found by solving the differential equation
| (11) |
However, O’Kane et al. ’s model is not a complete description of Li plating, as it does not consider the subsequent decay of plated Li into SEI and ”dead lithium”. As previously mentioned, the three-way interaction between plating, stripping and SEI formation results in a range of models throughout the literature. None of these models are strongly coupled and so a new model, where plated Li decays into dead Li over time, is proposed here. This time-limited decay adds a second term to (11):
| (12) |
The concentration of dead lithium is given by
| (13) |
where the decay rate has dimensions of s-1. Assuming that a reaction with the electrolyte solvent is required to turn plated Li into dead Li, is not constant; instead, it is diffusion-limited just like the SEI formation reaction, making it dependent on the SEI thickness . A simple way to model this dependence is
| (14) |
where is the SEI thickness at and is a fitting parameter. Returning to the Butler-Volmer equation for , (10) is updated with variable and and the SEI overpotential , resulting in
| (15) |
where
| (16) |
Equations (12)-(16) define the complete Li plating model used in this work.
3.3 Particle cracking model
Electrode materials experience large volume changes during (de)lithiation, and the resulting stress can cause particle cracking, which creates new surfaces and accelerates side reactions including the SEI growth and Li plating. Several crack models have been developed for battery degradation, which are classified as empirical models [41] and physics-based models [45, 27]. While empirical models are only accurate up to moderate C-rates, e.g. 1 C in Ekstrom and Lindbergh [41], physical models can be more accurate for higher C-rates. The crack model in this work is based on the fatigue crack model in Deshpande et al. [27] and demonstrated below.
A stress model at particle level was proposed by Zhang et al. [46], based on the equilibrium of stresses for a free standing spherical electrode particle. The analytical solutions for the radial stress , tangential stress and displacement are shown below, respectively:
| (17a) | |||
| (17b) | |||
| (17c) | |||
where is the partial molar volume, is the Young’s modulus, is the Possion’s ratio, is the radius of the particle and is the average Li+ concentration between 0 and :
| (18) |
where is the departure in lithium concentration from the reference value for the stress-free case. The magnitude of stress is determined by the lithium concentration gradient and particle radius, as shown in (17a)-(17c). Both and are defined as being positive for tensile stress and negative for compressive stress. This stress model has been incorporated into the P2D model for battery pouch cells [13] and was used to predict the thickness evolution of the pouch cell.
Electrode particles experience a cyclic stress loading during multiple charges and discharges, which can lead to fatigue cracking. However, it is very challenging to track the crack patterns experimentally. The assumptions for cracks in Deshpande et al. [27] are applied here: identical micro cracks on the electrode particle surface with a length , a width and a density of the crack number per unit area ; cracks grow in length during cycling but their width and density is constant. The fatigue crack growth model follows Paris’ law [27]
| (19) |
where is the time for one cycle, is the stress intensity factor correction, and are constants that are determined from experimental data, e.g. the approach in Purewal et al. [45]. The condition means only tensile stress contributes to crack growth. The instantaneous rate of change of the crack area to volume ratio can therefore be estimated by
| (20) |
For interactions between the SEI growth and particle cracking, one solution is to apply the same SEI growth model on the cracks. However, the SEI formation on the increasing fresh crack surfaces must be considered, which is different from the SEI growth on normal particle surfaces. A very thin initial SEI layer is defined on the cracks, e.g. , leading to fast initial SEI layer growth to simulate the SEI formation stage. The SEI layer thickness is not uniform along cracks, because crack propagation leads to different exposure times for different interface locations along a crack. The averaged thickness of the SEI layer on cracks is used for simplicity, with a time evolution defined by
| (21) |
The first term on the right hand side of (21) is always positive and accounts for the diffusion-limited growth of the SEI on existing cracks. The second term is always negative and accounts for the particle crack propagation, which increases the total surface area and therefore lowers the average thickness of the SEI layer on cracks.
3.4 Loss of active material model
Li-ion batteries suffer from LAM as a result of cycling, either due to electrochemical reactions between the electrodes and the electrolyte, e.g. positive electrode dissolution [47], or due to mechanical damage from stresses in the electrode material leading to particle cracking and binder detachment. In the current model, only LAM as a consequence of particle cracking is included, as electrode dissolution is not modelled.
The key equations for LAM due to particle cracking are given below, whilst for the detailed derivations the reader is referred to Laresgoiti et al. [32] and Reniers, Mulder and Howey [10]. Using the stress model in (17a)-(17c), the decrease in the accessible volume fraction of active materials is estimated by
| (22) |
where and are two constants normally obtained from experiments, the hydrostatic stress is a combination of (17a) and (17b), is the critical stress and the subscripts min and max are the minimum and the maximum values respectively. As with particle cracking, only tensile stress () contributes to LAM. Between complete cycles of charge and discharge, the particle can reach a steady state with no stress, i.e. and (22) can be modified for instantaneous reactions to
| (23) |
4 Simulation methods
4.1 Parameters
The LG M50T cylindrical cell was chosen for simulations because a parameter set suitable for the DFN model is available in Chen et al. [48]. The negative electrode consists of graphite with 10 SiOx by mass; the positive electrode consists of NMC 811. The used parameter values are listed in the Supplementary Information.
PyBaMM contains several different thermal models, any of which can be added to the electrochemical models to create thermally coupled battery models. However, the authors are not aware of sufficient experimental data to parametrize these thermal models for the LG M50 cell. Sturm et al. [49] obtained data for the entropic (reversible) heating coefficients as functions of stoichiometry, but did not measure any thermal conductivities or heat capacities. Due to this lack of data, no thermal model is included in this work and the temperature is therefore assumed to be constant.
4.2 Standard cycling protocol
Unless otherwise stated, the following cycling protocol is used. First, the cell is held at 4.2 V until the current falls below 50 mA (C/100), followed by a 4 hour rest period. Next the first characterization cycle is applied, consisting of a 0.5 A (C/10) discharge to 2.5 V, then a 1.5 A (0.3C) constant current charge to 4.2 V and finally a constant voltage charge at 4.2 V until the current falls below 50 mA (C/100). The cell is then cycled 1000 times, starting with a 5 A (1C) discharge until 2.5 V and followed by the same 1.5 A/4.2 V constant current/constant voltage charge as in the characterization cycle. After 1000 cycles are complete, a second characterization cycle is applied, identical to the first one. The cell temperature is set to 25 ∘C during the 1000 degradation cycles unless otherwise stated, and is always set to 25 ∘C during the characterization cycles. The procedure described in this paragraph is from here on referred to as “the standard cycling protocol”.
As the capacity of the simulated cell decreases with ageing, the amount of charge passed during a cycle also decreases. Measures of degradation, such as capacity loss, are plotted against the total charge throughput , where
| (24) |
with the absolute value of the applied current. Simulations with various combinations of fully coupled degradation models are run using the standard cycling protocol and discussed in Section 5.
4.3 PyBaMM
PyBaMM (Python Battery Mathematical Modelling) is a multiphysics battery modelling software package designed to consolidate the myriad of models in the field and enable the international community of battery modellers to collaborate more effectively. [12] The software has been designed to be extendable and modular so that new models and numerical methods can be easily added and rigorously tested. During the creation of the model proposed here, submodels for the degradation mechanisms of lithium plating, loss of active material and particle cracking were developed and added to the code, alongside SEI growth which was already in PyBaMM. Crucially, coupling between these degradation mechanisms was also implemented.
The model described in Section 3 is solved by PyBaMM using the method of lines. First, the equations are discretized in space, using a finite volume discretization with X grid points in the electrodes and separator and Y grid points in the particles. This yields a system of differential-algebraic equations, which is then solved using the IDA solver from SUNDIALS via CasADi [50, 51].
The model for the constant current discharge and charge phases is the standard DFN model described in the Supporting Information, while for the constant voltage phase an additional algebraic equation for the current is introduced so that the voltage constraint is satisfied. Rest phases are modeled as constant current with the current set to zero. The final state of each phase is used as the initial state of the following phase; when switching between constant current and constant voltage, this requires carefully constructing the new vector of (spatially-discretized) initial conditions, since the set of variables is different for the two models. An alternative, and potentially faster, implementation would be to use a differential equation for the current for the charging phase that will ensure CCCV charging [52], but this was not implemented in this work.
To determine when to switch between phases, PyBaMM keeps track of the ‘events’ (such as a voltage cut-off) as the simulation progresses. While some DAE solvers come with in-built functionality to find events, the CasADi solver used in this work does not. Therefore, PyBaMM uses a ‘step-and-check’ approach to find events, where in each iteration the model is solved for a fixed time window and check whether any events have been crossed. The size of time window requires a trade-off: if the time window is too small, the solver will be slow as it will require many iterations, but if the time window is too large, the solver might step too far past an event and fail.
If the solver fails during the time window, the window is halved before trying again. If the model is solved successfully and no events have been crossed, the solution is accepted and the time window moved forward.
If any events have been crossed, the times just before and after the first event crossing are recorded. The simulation is then run between those times with very small steps in order to accurately identify the time at which the event was crossed, which is crucial for keeping track of the discharged capacity as the battery degrades. The additional fine-grain solve is required, instead of interpolation, since the voltage is typically very non-linear close to cut-offs.
5 Results and Discussion
5.1 SEI growth
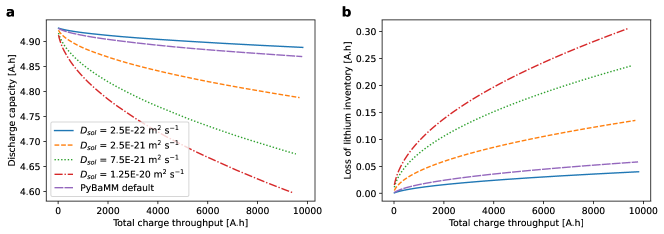
In the first parametric study, the diffusion-limited SEI model outlined in section 3.1 is run with different values of the solvent diffusion coefficient and the standard cycling protocol is applied. All degradation mechanisms other than SEI growth, i.e. Li plating, SEI on cracks and LAM, are disabled.
The reduction in 1C discharge capacity over 1000 cycles is shown in Fig. 1 (a), and is matched by the loss of lithium inventory plotted in Fig. 1 (b). The rate of capacity fade gets slower over time as expected for diffusion-limited SEI growth [16, 10].
For the sake of simplicity when interacting with other degradation mechanisms, an SEI with only one layer is considered. By default, PyBaMM considers a two-layer SEI, so the results for two layers and PyBaMM’s default value of m2 s-1 are also plotted in Fig. 1. The effect of having two SEI layers instead of one is small compared to that of changing the solvent diffusivity by an order of magnitude.
m2 s-1.
5.2 Li plating
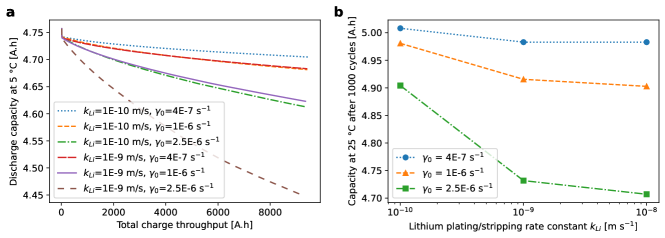
To investigate the effect of the new time-limited dead Li formation model proposed in section 3.2 on capacity, both SEI growth and Li plating are enabled, while SEI on cracks and LAM are disabled. The standard cycling protocol is used, but the 1000 degradation cycles are done at the lower temperature of 5 ∘C, in order to increase the effect of Li plating relative to SEI growth. Both of the characterization cycles are done at 25 ∘C. The cell capacity at 5 ∘C over 1000 cycles is plotted in Fig. 2 (a) for a range of values of the two unknown constants and the decay rate for the formation of dead lithium. All capacity curves follow the same trend, because the decay of plated Li into dead Li is controlled by , and evolves in the same way regardless of plating in this model.
The effect of the magnitude of the two constants and can be analysed by considering the cell capacity at 25 ∘C evaluated from the final characterization cycle, plotted in Fig. 2 (b). For m s-1, the capacity fade is much more sensitive to than , while for m s-1, both constants have a large impact. This can be explained by the fact that increasing increases the rate of both plating and stripping; additional Li plated by increasing above m s-1 is stripped before it decays into dead Li.
5.3 Cracking and SEI
The particle cracking model outlined in section 3.3 is combined with the SEI growth model outlined in Section 3.1, with Li plating and LAM disabled. Degradation over 1000 cycles is tracked for the standard rate of particle cracking, as in Table S5, as well as for three accelerated cracking rates. All other parameters and the cycling conditions are per the default.
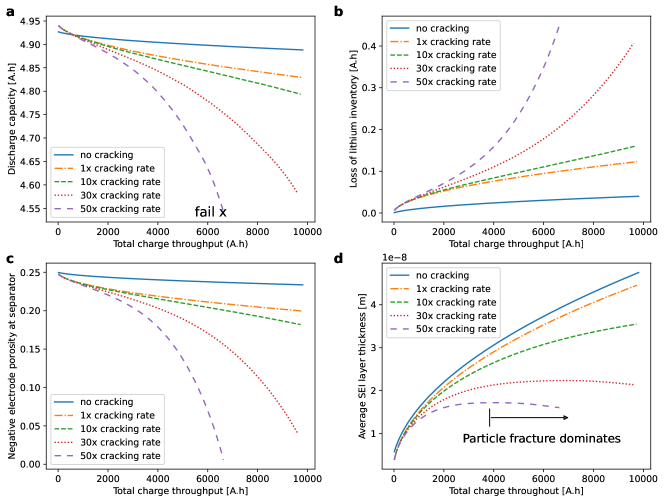
The capacity fade is shown in Fig. 3 (a). For the lowest cracking rate, degradation decreases with time, as expected for diffusion-limited SEI growth. For the 10x cracking rate, the capacity fade is quasi-linear. For the largest cracking rates, a knee point is visible after 5000 Ah and 3000 Ah throughput, for the 30x and the 50x cracking rate, respectively. For the 50x cracking rate, sudden failure occurs at 6600 Ah throughput.
The loss of lithium inventory caused by the SEI is shown in Fig. 3 (b). For low cracking rates, the LLI varies as the square root of time, a result of the solvent diffusion limited SEI growth model. For larger cracking rates, the LLI starts with a square root dependence, but then accelerates as the cracks propagate. The accelerated LLI is the cause for the knee point transition in the capacity loss. The additional surface exposed by particle cracking is shown in Fig. S2.
The reason for the sudden failure in the 50x cracking rate is that the porosity at the negative electrode-separator interface reaches zero, as shown in Fig. 3 (c). The cell with 30x cracking rate would fail in the same way if the simulation carried on after 1000 cycles.
The case of particle cracking uses the assumption of microcracks, which is different from the ideal sphere assumption in the case of no cracking (also the standard Newman battery model). The averaged SEI layer thickness is presented in Fig. 3 (d). For the cases of 30x and 50x cracking rate it stops increasing after 7500 Ah and 4000 Ah throughput respectively, indicating that the cracks are growing faster than the SEI can passivate them. This causes the runaway pore clogging shown in Fig. 3 (c), leading to sudden failure. [53, 54]
5.4 Loss of active material
The loss of active material (LAM) due to particle cracking in the positive and negative electrodes is modelled as outlined in section 3.4. The effects of LAM on cell degradation are studied while all other degradation mechanisms - SEI, lithium plating and SEI on cracks - are disabled. The governing equation (23) indicates that the amount of LAM is dependent on the magnitude of the hydrostatic tensile stress; compressive stress make no contribution. Model predictions for cell degradation are run for five different combinations of the proportionality constant . The negative and positive electrodes have independent rates, with “np” denoting the negative and positive electrode respectively. The values of and are proportionality constants applied to the reference values in Table S5.
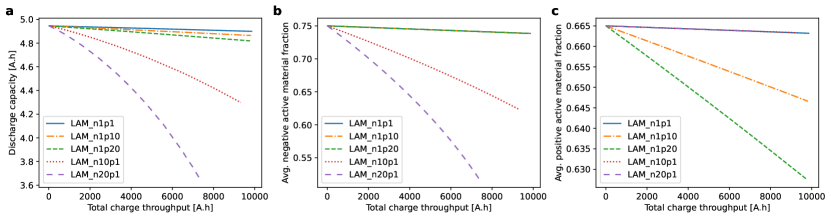
The discharge capacity fade, shown in Fig. 4 (a), decreases quasi-linearly with cycle number for n1p1, n1p10 and n1p20, and non-linearly for the other two cases. The loss of active material in each electrode is shown in Fig. (4) (b) and (c). For instance, the active material fraction in the negative electrode decreases by 30% for the case n20p1, corresponding to 25% capacity loss. The capacity fade is stronger than linear because of the increase of the interfacial current density, as shown in Fig. S3, leading to higher stresses. For the same proportionality constant , the LAM in the negative electrode is larger than that in the positive electrode, as visible, for example, between n1p20 and n20p1. This occurs for two reasons. Firstly, the discharge rate in the standard cycling protocol is 1C, whereas the charge rate is only 0.3C. Inspection of (17a) and (17b) shows that only the electrode from which Li+ de-intercalates experiences tensile (positive) stress, and only tensile stress contributes to LAM. Secondly, the positive electrode can be subjected to a higher tensile stress without cracking, as its critical stress is higher than that of the negative electrode, Pa vs Pa.
5.5 All degradation mechanisms
With all degradation mechanisms - SEI layer growth, lithium plating, SEI on cracks and LAM - enabled, model predictions are created using the standard cycling protocol and five variations, as described in Table 1. The degradation parameters that were varied in Section 5.1-5.4 are assumed to have the default values listed in Table S5.
| Cycling protocol | Discharge rate | Charge rate | Temperature |
|---|---|---|---|
| (i) | 1C | 0.3C | 25 ∘C |
| (ii) | 1C | 1.2C | 25 ∘C |
| (iii) | 0.5C | 0.3C | 25 ∘C |
| (iv) | 2C | 0.3C | 25 ∘C |
| (v) | 1C | 0.3C | 5 ∘C |
| (vi) | 1C | 0.3C | 45 ∘C |
The discharge capacity evolution over the 1000 cycles is plotted in Fig. 5 (a) for each of the six protocols. The largest change in discharge capacity occurs for the discharge at 5 ∘C, followed by the cell cycled at 45 ∘C. The cells kept at 25 ∘C degrade the least.
The total LLI from the three contributing mechanisms - surface SEI, SEI on cracks and dead lithium - is plotted in Fig. 5 (b). For every cell except the one cycled at 5 ∘C, the LLI accounts for most of the loss in discharge capacity. The relative contribution of each mechanism to LLI is depicted in Fig. S4.
The time evolution of the average active material volume fraction for each of the six protocols is shown in Fig. 5 (c) for the negative electrode and in Fig. 5 (d) for the positive electrode. Even for protocol (ii), in which the charge rate is faster than the discharge rate, more active material is lost in the negative electrode because the critical stress in the positive electrode is much larger. By far the greatest loss of active material occurs when the temperature is reduced to 5 ∘C in protocol (v). Low temperatures reduce the solid diffusion coefficients , increasing the Li+ concentration gradients within the electrode particles and therefore increasing mechanical stress.
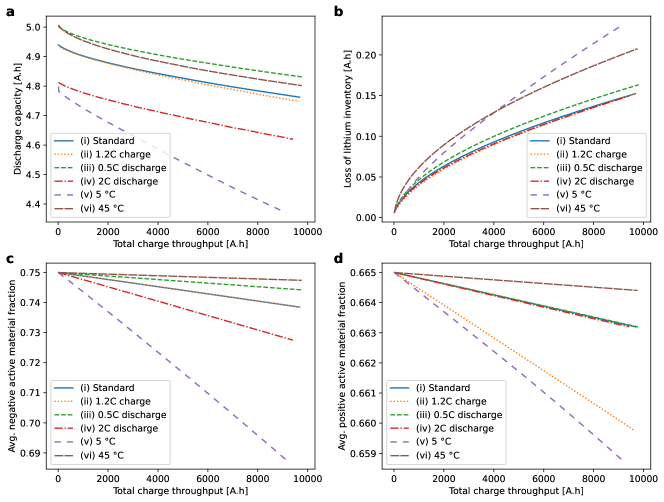
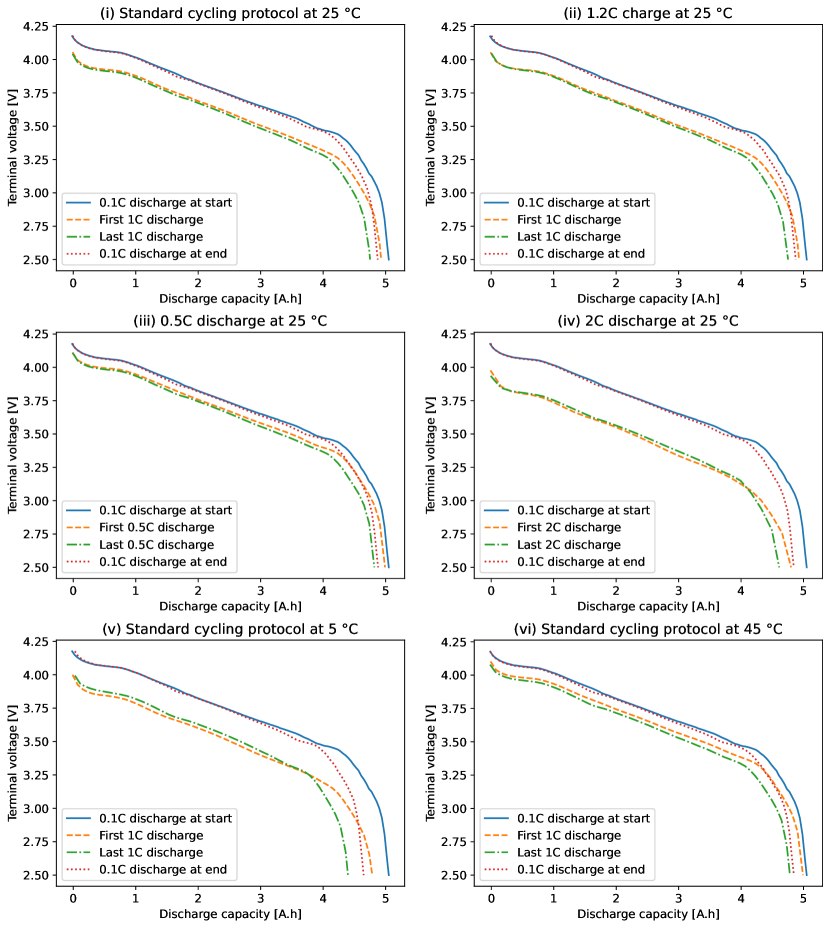
However, the capacity plot in Fig. 5 (a) only considers discharge capacity at 1C. Voltage-capacity plots for the ‘before and after’ characterization cycles are compared with those of the first and last standard cycles in Fig. 6. In all cases, the capacity is different for all four of these cycles. However, the difference in capacity between the first and last 1C discharges is the same as that between the two corresponding 0.1C discharges, so the reduction in capacity due to degradation is not due to the increasing current. The difference in capacity between the first and last 0.1C characterization cycles is similar for all protocols except for the cell cycled at 5 ∘C, which degraded much more than the others. This additional degradation is accounted for by the loss of active material as plotted in Fig. 5 (c).
5.6 Degradation paths
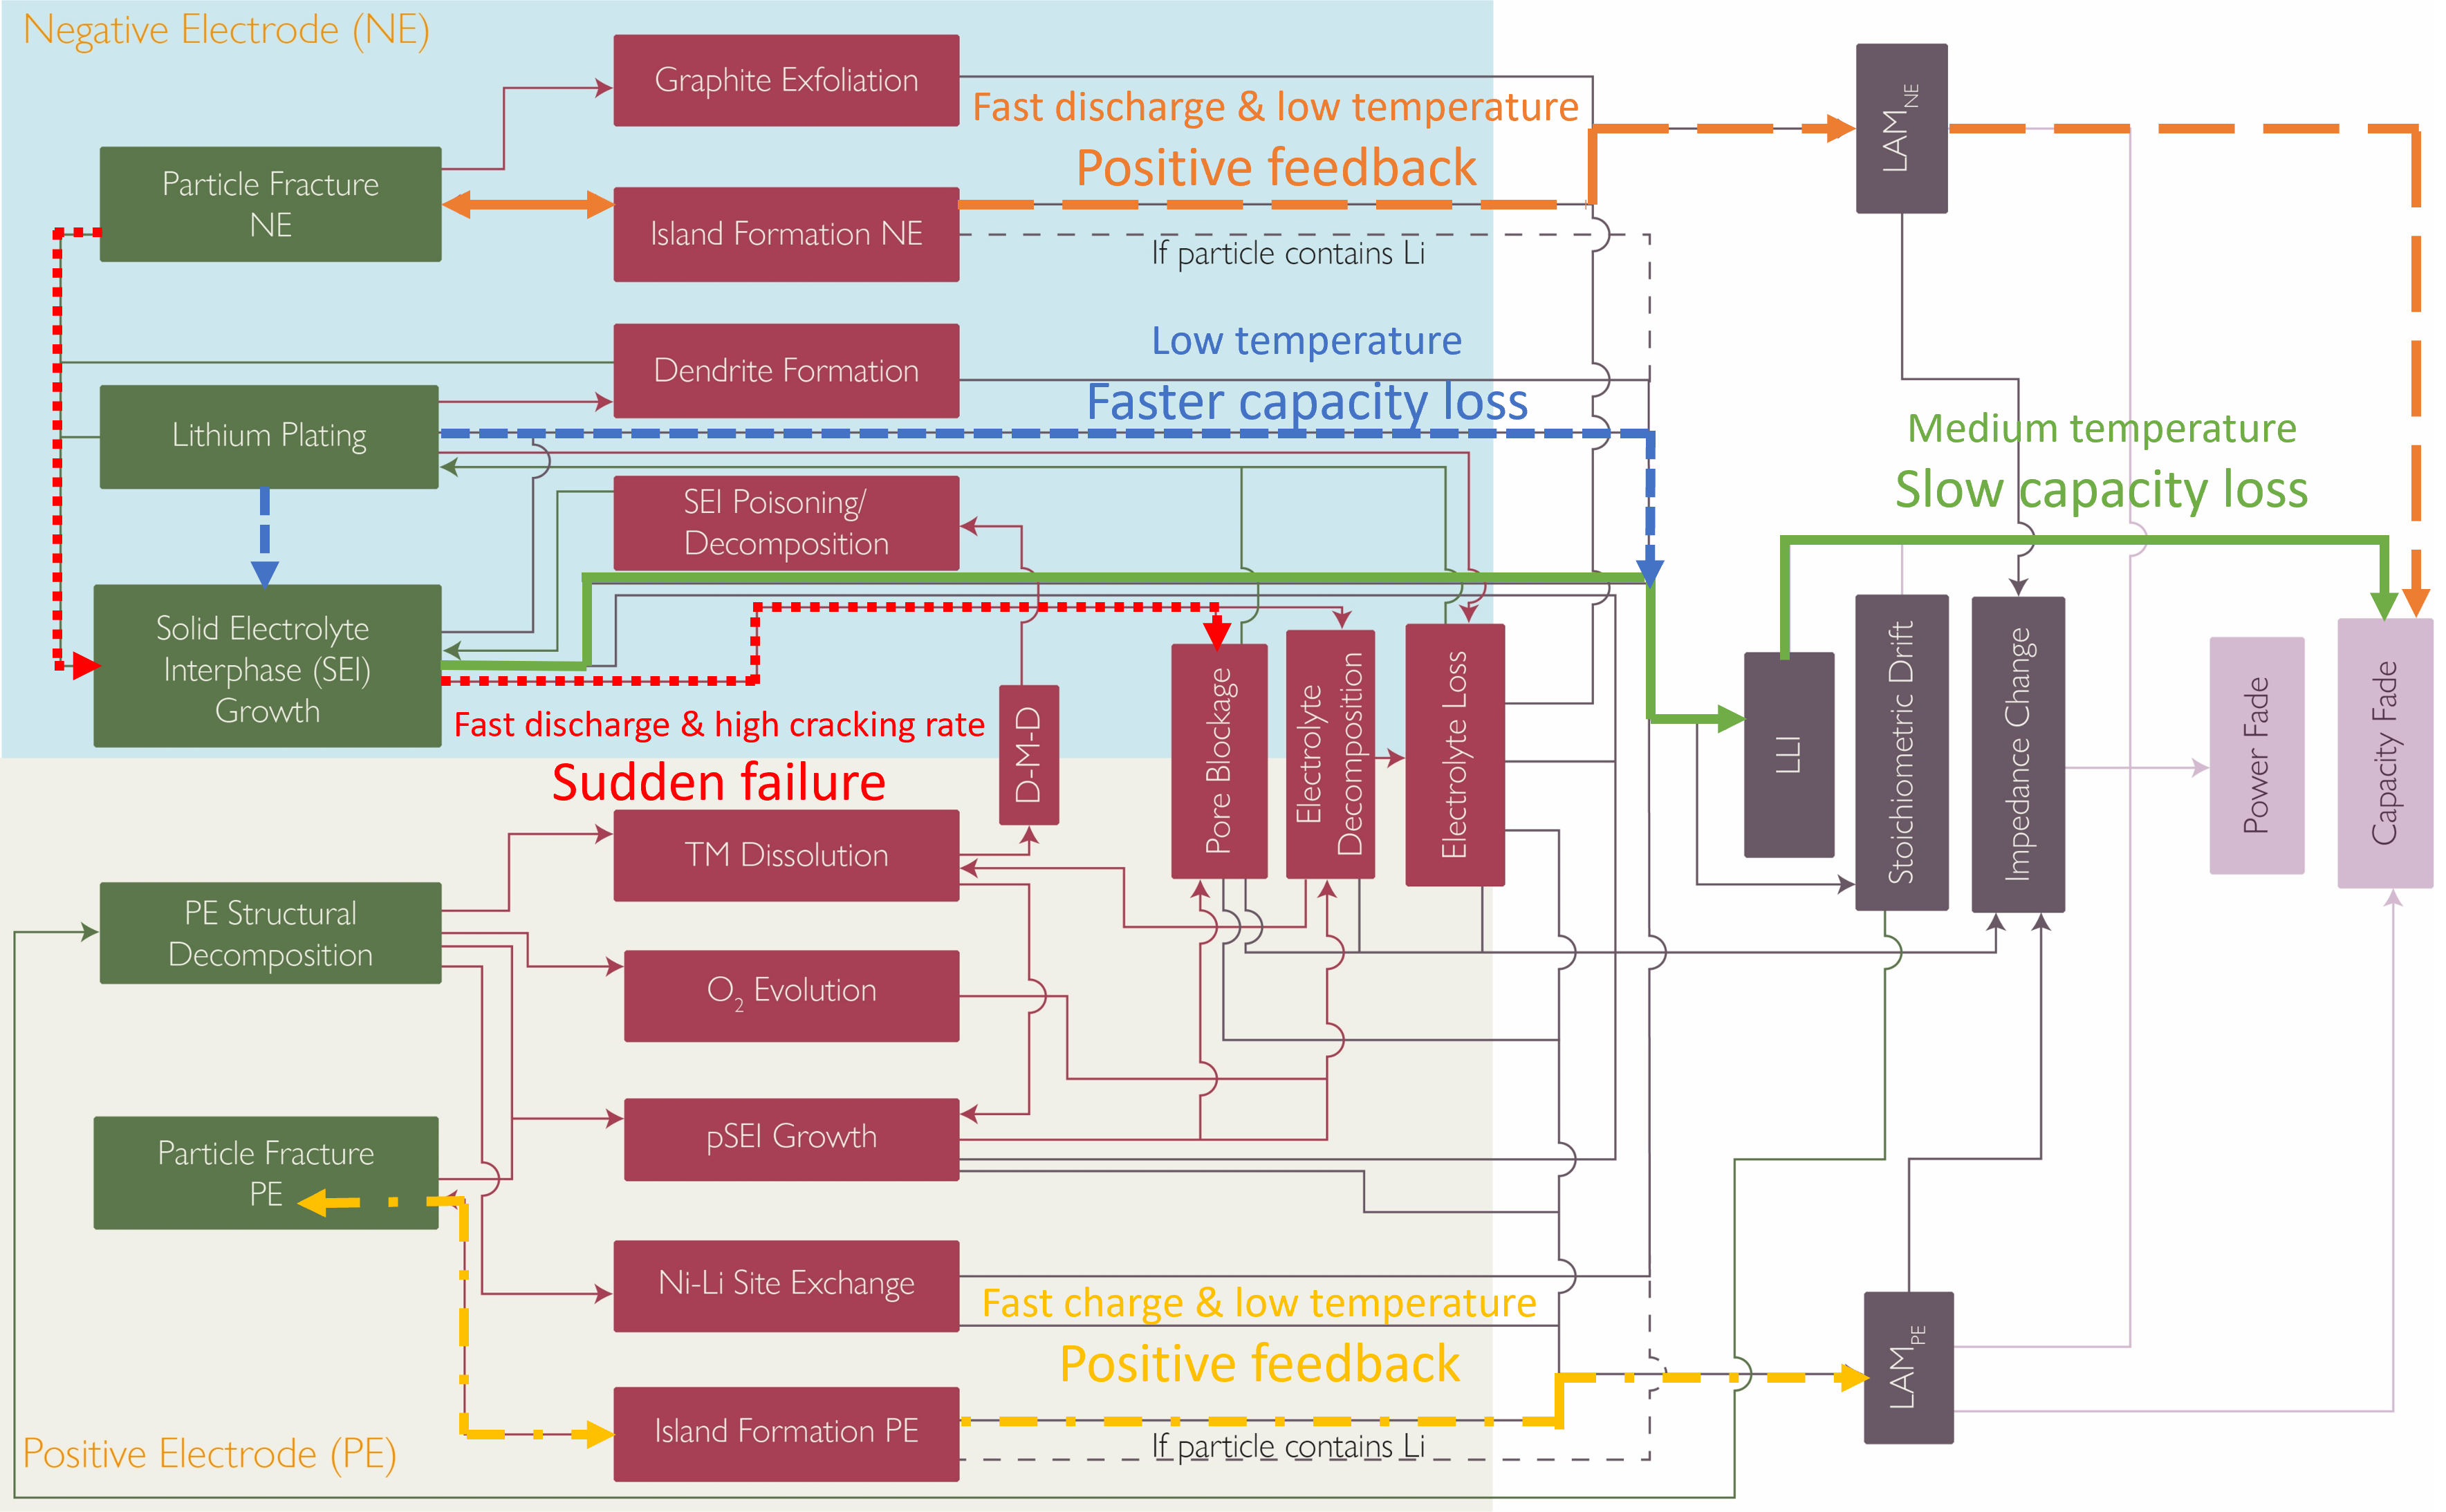
The multitude of possible interactions between degradation mechanisms creates a maze of possible paths for a Li-ion battery, depicted in Fig. 9 of Edge et al. [7]. Five of these paths have been identified in this work and have been overlaid on the original figure to create Fig. 7.
The slowest degradation is achieved by cycling protocols (i)-(iv) in Table 1, characterized by moderate temperature. In this case, the major degradation mechanism is a relatively slow SEI growth. Cycling protocol (vi), which occurs at a higher temperature, also follows this path but with a higher rate of degradation.
Cycling protocol (v) occurs at significantly lower temperatures. The dominant degradation path in this scenario is particle cracking causing LAM through island formation and binder delamination, resulting in higher interfacial current densities, increasing mechanical stress and thus accelerated LAM. The same self-reinforcing behaviour is achieved when the LAM parameter in the model is increased.
Low temperatures also trigger faster capacity loss due to lithium plating, which speeds up capacity fade through the creation of dead lithium and additional SEI, the latter not included in this model. Unlike SEI growth, dead lithium formation is not self-inhibiting, so the resulting capacity fade is faster compared to scenarios with only SEI growth.
Figure 5 (d) shows that decreasing the temperature or increasing the charge rate increases the loss of active material in the positive electrode. Either of these can activate the same positive feedback loop as in the negative electrode. However, the Young’s modulus assumed for NMC 811 in this work was set too high for the loss of active material to make a significant contribution to overall capacity fade.
Only one of the scenarios modelled in this work reproduces the infamous “cliff edge” or sudden failure, and it is displayed in Fig. (3). When the Paris’ Law cracking rate is increased, the cracks grow at a faster rate than the SEI can passivate them, resulting in runaway SEI growth that causes rapid pore clogging.
As more degradation mechanisms are implemented and the parameter space is further explored, other scenarios where sudden failure occurs may be discovered. Importantly, even if sudden failure is predicted for a particular parameter set, the case is only relevant if that parameter set occurs in practice. While the sensitivity studies in this work are an important first step, it is equally important to carry out experimental work to find out what range of parameters is relevant for different cells and operating conditions.
5.7 Recommendations for future model additions
This work represents a significant step towards developing an all-encompassing model of degradation mechanisms in LiBs and harnessing the opportunities provided by the PyBaMM code. The main features recommended for future implementation are: adding thermal-electrochemical coupling, accounting for the effects of SiOx on the solid state diffusion, lithium plating and cell voltage hysteresis, allowing Li plating on fresh crack surfaces, allowing plated Li to transform into SEI, including a more comprehensive model of cathode degradation, and loss of electrolyte through solvent evaporation or consumption. Despite the strong dependence of lithium plating on nonlinear diffusion [43], it is not implemented here, because is difficult to define for negative electrodes that contain both graphite and SiOx [48]. For negative electrodes with SiOx, the voltage hysteresis has recently been modelled [37] and could be included.
6 Conclusions
Modelling of lithium-ion batteries is essential for the development of future electric vehicles and grid scale energy storage systems. Many modelling efforts have included degradation effects such as solid-electrolyte interphase growth, lithium plating, particle cracking and loss of active material. However, these were usually considered in isolation. There is an urgent need to develop understanding around the coupled nature of these degradation mechanisms and their effects.
In this work, a model is developed in the PyBaMM software package that couples many of the relevant degradation mechanisms. Model predictions show that diffusion-limited SEI growth formula of Single et al. [14] results in the SEI thickness increasing with the square root of time, causing the loss of lithium inventory to increase with the same dependency. It is shown that increasing the solvent diffusivity by an order of magnitude has a larger effect than including a two-layer SEI.
The modified Butler-Volmer equation for Li plating/stripping pioneered by Yang et al. [24] is combined with a new model for a time-limited decay of plated Li to dead Li. For values of the Butler-Volmer rate constant larger than m s-1, the capacity fade becomes much more sensitive to the rate constant for dead Li formation than to the plating rate constant. For values of the Butler-Volmer rate constant smaller than m s-1, the capacity fade is highly sensitive to both parameters. The model therefore requires further parameterization work in order to be of any practical use.
When the particle cracking mechanism is included, the loss of lithium inventory increases significantly. For larger cracking rates, the porosity at the negative electrode-separator interface is shown to reach zero due to runaway SEI growth on cracks, causing sudden cell failure. This scenario demonstrates the increased predictive power of pseudo-2D models over single particle models, which track an average porosity only, and therefore would overestimate the battery’s lifespan.
The formula for the loss of active material (LAM) proposed by Laresgoiti et al. [32], which works by calculating the mechanical stress in electrode particles, results in a positive feedback loop where degradation accelerates over time. The loss of active material has a larger effect in the negative electrode than in the positive electrode because the critical stress in the negative electrode is assumed to be over six times lower. This is therefore another degradation mechanism for which more accurate knowledge of key parameters is required.
When all four mechanisms are enabled, the model predicts low temperatures to cause the most irreversible capacity fade. While significant lithium plating occurs, the main cause of the observed capacity fade is due to loss of active material, which is greatly accelerated at low temperatures due to mechanical cracking of the negative electrode. The sudden cell failure due to pore clogging is also due to mechanical cracking. Therefore, the model predicts that avoiding cracking is just as important as avoiding lithium plating, if not more so.
Conflicts of interest
The authors have no conflicts of interest to report.
Acknowledgement
The authors would like to acknowledge financial support from EPSRC Faraday Institution Multiscale Modelling project (EP/S003053/1, grant number FIRG025).
Credit statement
Simon E. J. O’Kane wrote the code for the lithium plating model, ran all simulations used to produce the final results and was involved in writing all sections of the manuscript. Weilong Ai wrote the code for the particle cracking and active material models and wrote the first drafts of sections (2.3), (3.3), (3.4), (4.3), (5.3) and (5.4). Ganesh Madabattula wrote a Jupyter notebook that was later adapted to produce the final results. Diego Alonso Albarez provided technical support with PyBaMM, managed the authors’ interactions with the PyBaMM team and managed a GitHub repository that allowed the authors to share code. Robert Timms and Valentin Sulzer added the constant voltage charge protocol and event state feature to PyBaMM and also provided technical support with PyBaMM. Jacqueline Sophie Edge wrote the first draft of Section (5.7) and provided strategic advice on many aspects of the work. Billy Wu provided many helpful comments on early drafts of the manuscript and supervised Weilong Ai’s work on the mechanical model. Gregory J. Offer wrote the first draft of the abstract and Broader Context, while also providing the leadership to make this collaboration possible. Monica Marinescu carried out edits to all sections of the final version of the manuscript and supervised Simon E. J. O’Kane’s development of the plating model and final PybaMM simulations.
References
- [1] Turgut M. Gür. Review of electrical energy storage technologies, materials and systems: challenges and prospects for large-scale grid storage. Energy Environ. Sci., 11:2696–2767, 2018.
- [2] J. Vetter, P. Novák, M.R. Wagner, C. Veit, K.-C. Möller, J.O. Besenhard, M. Winter, M. Wohlfahrt-Mehrens, C. Vogler, and A. Hammouche. Ageing mechanisms in lithium-ion batteries. Journal of Power Sources, 147(1-2):269–281, 9 2005.
- [3] Christopher Hendricks, Nick Williard, Sony Mathew, and Michael Pecht. A failure modes, mechanisms, and effects analysis (fmmea) of lithium-ion batteries. Journal of Power Sources, 297:113–120, 2015.
- [4] Christoph R. Birkl, Matthew R. Roberts, Euan McTurk, Peter G. Bruce, and David A. Howey. Degradation diagnostics for lithium ion cells. Journal of Power Sources, 341:373–386, 2017.
- [5] Xuebing Han, Languang Lu, Yuejiu Zheng, Xuning Feng, Zhe Li, Jianqiu Li, and Minggao Ouyang. A review on the key issues of the lithium ion battery degradation among the whole life cycle. eTransportation, 1:100005, 2019.
- [6] Anna Tomaszewska, Zhengyu Chu, Xuning Feng, Simon O’Kane, Xinhua Liu, Jingyi Chen, Chenzhen Ji, Elizabeth Endler, Ruihe Li, Lishuo Liu, Yalun Li, Siqi Zheng, Sebastian Vetterlein, Ming Gao, Jiuyu Du, Michael Parkes, Minggao Ouyang, Monica Marinescu, Gregory Offer, and Billy Wu. Lithium-ion battery fast charging: A review. eTransportation, 1:100011, 2019.
- [7] Jacqueline S. Edge, Simon O’Kane, Ryan Prosser, Niall D. Kirkaldy, Anisha N. Patel, Alastair Hales, Abir Ghosh, Weilong Ai, Jingyi Chen, Jiang Yang, Shen Li, Mei-Chin Pang, Laura Bravo Diaz, Anna Tomaszewska, M. Waseem Marzook, Karthik N. Radhakrishnan, Huizhi Wang, Yatish Patel, Billy Wu, and Gregory J. Offer. Lithium ion battery degradation: what you need to know. Phys. Chem. Chem. Phys., 23:8200–8221, 2021.
- [8] Xianke Lin, Jonghyun Park, Lin Liu, Yoonkoo Lee, Wei Lu, and A. M. Sastry. A Comprehensive Capacity Fade Model and Analysis for Li-Ion Batteries. Journal of the Electrochemical Society, 160(10):A1701–A1710, 2013.
- [9] Xing Jin, Ashish Vora, Vaidehi Hoshing, Tridib Saha, Gregory Shaver, Oleg Wasynczuk, and Subbarao Varigonda. Applicability of available Li-ion battery degradation models for system and control algorithm design. Control Engineering Practice, 71(October 2017):1–9, 2018.
- [10] Jorn M. Reniers, Grietus Mulder, and David A. Howey. Review and performance comparison of mechanical-chemical degradation models for lithium-ion batteries. Journal of the Electrochemical Society, 166(14):A3189–A3200, 2019.
- [11] Jonas Keil and Andreas Jossen. Electrochemical Modeling of Linear and Nonlinear Aging of Lithium-Ion Cells. Journal of The Electrochemical Society, 167(11):110535, 2020.
- [12] Valentin Sulzer, Scott Marquis, Robert Timms, Martin Robinson, and S. Jon Chapman. Python Battery Mathematical Modelling (PyBaMM). Journal of Open Research Software, 9, 2021.
- [13] Weilong Ai, Ludwig Kraft, Johannes Sturm, Andreas Jossen, and Billy Wu. Electrochemical Thermal-Mechanical Modelling of Stress Inhomogeneity in Lithium-Ion Pouch Cells. Journal of The Electrochemical Society, 167(1):013512, 2020.
- [14] Fabian Single, Arnulf Latz, and Birger Horstmann. Identifying the Mechanism of Continued Growth of the Solid–Electrolyte Interphase. ChemSusChem, 11(12):1950–1955, 2018.
- [15] Shuwei Wang, Kai Yang, Fei Gao, Deyu Wang, and Cai Shen. Direct visualization of solid electrolyte interphase on li4ti5o12 by in situ afm. RSC Adv., 6:77105–77110, 2016.
- [16] M. Safari, M. Morcrette, A. Teyssot, and C. Delacourt. Multimodal Physics-Based Aging Model for Life Prediction of Li-Ion Batteries. Journal of The Electrochemical Society, 156(3):A145, 2009.
- [17] Qianqian Liu, Chunyu Du, Bin Shen, Pengjian Zuo, Xinqun Cheng, Yulin Ma, Geping Yin, and Yunzhi Gao. Understanding undesirable anode lithium plating issues in lithium-ion batteries. RSC Advances, 6(91):88683–88700, 2016.
- [18] Thomas Waldmann, Björn-Ingo Hogg, and Margret Wohlfahrt-Mehrens. Li plating as unwanted side reaction in commercial li-ion cells – a review. Journal of Power Sources, 384:107–124, 2018.
- [19] Dongsheng Ren, Kandler Smith, Dongxu Guo, Xuebing Han, Xuning Feng, Languang Lu, Minggao Ouyang, and Jianqiu Li. Investigation of lithium plating-stripping process in li-ion batteries at low temperature using an electrochemical model. Journal of The Electrochemical Society, 165(10):A2167–A2178, 2018.
- [20] Xinchen Zhao, Yilin Yin, Yang Hu, and Song Yul Choe. Electrochemical-thermal modeling of lithium plating/stripping of Li(Ni0.6Mn0.2Co0.2)O2/Carbon lithium-ion batteries at subzero ambient temperatures. Journal of Power Sources, 418(January):61–73, 2019.
- [21] P Arora, M Doyle, and R E White. Mathematical modeling of the lithium deposition overcharge reaction in lithium-ion batteries using carbon-based negative electrodes. Journal of the Electrochemical Society, 146(10):3543–3553, 10 1999.
- [22] Hao Ge, Tetsuya Aoki, Nobuhisa Ikeda, Sohei Suga, Takuma Isobe, Zhe Li, Yuichiro Tabuchi, and Jianbo Zhang. Investigating lithium plating in lithium-ion batteries at low temperatures using electrochemical model with nmr assisted parameterization. Journal of the Electrochemical Society, 164(6):A1050–A1060, 2017.
- [23] Xiao Guang Yang, Yongjun Leng, Guangsheng Zhang, Shanhai Ge, and Chao Yang Wang. Modeling of lithium plating induced aging of lithium-ion batteries: Transition from linear to nonlinear aging. Journal of Power Sources, 360:28–40, 2017.
- [24] Xiao Guang Yang, Shanhai Ge, Teng Liu, Yongjun Leng, and Chao Yang Wang. A look into the voltage plateau signal for detection and quantification of lithium plating in lithium-ion cells. Journal of Power Sources, 395(May):251–261, 2018.
- [25] Kuan-Hung Chen, Kevin N. Wood, Eric Kazyak, William S. LePage, Andrew L. Davis, Adrian J. Sanchez, and Neil P. Dasgupta. Dead lithium: mass transport effects on voltage, capacity, and failure of lithium metal anodes. J. Mater. Chem. A, 5:11671–11681, 2017.
- [26] Christian von Lüders, Jonas Keil, Markus Webersberger, and Andreas Jossen. Modeling of lithium plating and lithium stripping in lithium-ion batteries. Journal of Power Sources, 414:41–47, 2019.
- [27] Rutooj Deshpande, Mark Verbrugge, Yang-Tse Cheng, John Wang, and Ping Liu. Battery Cycle Life Prediction with Coupled Chemical Degradation and Fatigue Mechanics. Journal of The Electrochemical Society, 159(10):A1730–A1738, 2012.
- [28] John Christensen and John Newman. Stress generation and fracture in lithium insertion materials. Journal of Solid State Electrochemistry, 10:293–319, 2006.
- [29] Rong Xu, Yang Yang, Fei Yin, Pengfei Liu, Peter Cloetens, Yijin Liu, Feng Lin, and Kejie Zhao. Heterogeneous damage in Li-ion batteries: Experimental analysis and theoretical modeling. Journal of the Mechanics and Physics of Solids, 129(2019):160–183, 2019.
- [30] J. Li, K. Adewuyi, N. Lotfi, R.G. Landers, and J. Park. A single particle model with chemical/mechanical degradation physics for lithium ion battery state of health (soh) estimation. Applied Energy, 212:1178–1190, 2018.
- [31] C. Delacourt and M. Safari. Life simulation of a graphite/LiFePO4cell under cycling and storage. Journal of The Electrochemical Society, 159(8):A1283–A1291, 2012.
- [32] Izaro Laresgoiti, Stefan Käbitz, Madeleine Ecker, and Dirk Uwe Sauer. Modeling mechanical degradation in lithium ion batteries during cycling: Solid electrolyte interphase fracture. Journal of Power Sources, 300:112–122, 2015.
- [33] Roland Jung, Michael Metzger, Filippo Maglia, Christoph Stinner, and Hubert A. Gasteiger. Oxygen release and its effect on the cycling stability of LiNixMnyCozO2(NMC) cathode materials for li-ion batteries. Journal of The Electrochemical Society, 164(7):A1361–A1377, 2017.
- [34] A. Blyr, C. Sigala, G. Amatucci, D. Guyomard, Y. Chabre, and J.-M. Tarascon. Self-discharge of LiMn2 o 4/c li-ion cells in their discharged state: Understanding by means of three-electrode measurements. Journal of The Electrochemical Society, 145(1):194–209, jan 1998.
- [35] Abir Ghosh, Jamie M. Foster, Gregory Offer, and Monica Marinescu. A shrinking-core model for the degradation of high-nickel cathodes (NMC811) in li-ion batteries: Passivation layer growth and oxygen evolution. Journal of the Electrochemical Society, 168(2):020509, feb 2021.
- [36] Madeleine Ecker, Stefan Käbitz, Izaro Laresgoiti, and Dirk Uwe Sauer. Parameterization of a Physico-Chemical Model of a Lithium-Ion Battery. Journal of The Electrochemical Society, 162(9):A1849–A1857, 2015.
- [37] Yang Jiang, Gregory Offer, Jun Jiang, Monica Marinescu, and Huizhi Wang. Voltage Hysteresis Model for Silicon Electrodes for Lithium Ion Batteries, Including Multi-Step Phase Transformations, Crystallization and Amorphization. Journal of The Electrochemical Society, 167(13):130533, 2020.
- [38] J. Li, R. G. Landers, and J. Park. A comprehensive single-particle-degradation model for battery state-of-health prediction. Journal of Power Sources, 456(January), 2020.
- [39] Tao Gao, Yu Han, Dimitrios Fraggedakis, Supratim Das, Tingtao Zhou, Che-Ning Yeh, Shengming Xu, William C. Chueh, Ju Li, and Martin Z. Bazant. Interplay of lithium intercalation and plating on a single graphite particle. Joule, 5(2):393–414, 2021.
- [40] Xinyi M. Liu and Craig B. Arnold. Effects of Current Density on Defect-Induced Capacity Fade through Localized Plating in Lithium-Ion Batteries. Journal of The Electrochemical Society, 167(13):130519, 2020.
- [41] Henrik Ekström and Göran Lindbergh. A Model for Predicting Capacity Fade due to SEI Formation in a Commercial Graphite/LiFePO 4 Cell . Journal of The Electrochemical Society, 162(6):A1003–A1007, 2015.
- [42] Thomas F. Fuller, Marc Doyle, and John Newman. Simulation and Optimization of the Dual Lithium Ion Insertion Cell. Journal of The Electrochemical Society, 141(1):1–10, 1994.
- [43] Simon E. J. O’Kane, Ian D. Campbell, Mohamed W. J. Marzook, Gregory J. Offer, and Monica Marinescu. Physical Origin of the Differential Voltage Minimum Associated with Lithium Plating in Li-Ion Batteries. Journal of The Electrochemical Society, 167(9):090540, 2020.
- [44] Kevin N. Wood, Eric Kazyak, Alexander F. Chadwick, Kuan Hung Chen, Ji Guang Zhang, Katsuyo Thornton, and Neil P. Dasgupta. Dendrites and pits: Untangling the complex behavior of lithium metal anodes through operando video microscopy. ACS Central Science, 2(11):790–801, 2016.
- [45] Justin Purewal, John Wang, Jason Graetz, Souren Soukiazian, Harshad Tataria, and Mark W. Verbrugge. Degradation of lithium ion batteries employing graphite negatives and nickel-cobalt-manganese oxide + spinel manganese oxide positives: Part 2, chemical-mechanical degradation model. Journal of Power Sources, 272:1154–1161, 12 2014.
- [46] Xiangchun Zhang, Wei Shyy, and Ann Marie Sastry. Numerical Simulation of Intercalation-Induced Stress in Li-Ion Battery Electrode Particles. Journal of The Electrochemical Society, 154(10):A910, 2007.
- [47] Frank M. Kindermann, Jonas Keil, Alexander Frank, and Andreas Jossen. A SEI modeling approach distinguishing between capacity and power fade. Journal of The Electrochemical Society, 164(12):E287–E294, 2017.
- [48] Chang-Hui Chen, Ferran Brosa Planella, Kieran O’Regan, Dominika Gastol, W. Dhammika Widanage, and Emma Kendrick. Development of Experimental Techniques for Parameterization of Multi-scale Lithium-ion Battery Models. Journal of The Electrochemical Society, 167(8):080534, 2020.
- [49] J. Sturm, A. Rheinfeld, I. Zilberman, F. B. Spingler, S. Kosch, F. Frie, and A. Jossen. Modeling and simulation of inhomogeneities in a 18650 nickel-rich, silicon-graphite lithium-ion cell during fast charging. Journal of Power Sources, 412(September 2018):204–223, 2019.
- [50] Alan C Hindmarsh, Peter N Brown, Keith E Grant, Steven L Lee, Radu Serban, Dan E Shumaker, and Carol S Woodward. SUNDIALS: Suite of nonlinear and differential/algebraic equation solvers. ACM Transactions on Mathematical Software (TOMS), 31(3):363–396, 2005.
- [51] Joel A E Andersson, Joris Gillis, Greg Horn, James B Rawlings, and Moritz Diehl. CasADi – A software framework for nonlinear optimization and optimal control. Mathematical Programming Computation, 11:1–36, 2019.
- [52] Peyman Mohtat, Sravan Pannala, Valentin Sulzer, Jason B Siegel, and Anna G Stefanopoulou. An algorithmic safety vest for li-ion batteries during fast charging. IFAC-PapersOnLine, 54(20):522–527, 2021.
- [53] Taylor R. Garrick, Xinyu Huang, Venkat Srinivasan, and John W. Weidner. Modeling volume change in dual insertion electrodes. Journal of The Electrochemical Society, 164(11):E3552–E3558, 2017.
- [54] Christiane Rahe, Stephen T. Kelly, Mansoureh Nourozi Rad, Dirk Uwe Sauer, Joachim Mayer, and Egbert Figgemeier. Nanoscale x-ray imaging of ageing in automotive lithium ion battery cells. Journal of Power Sources, 433:126631, 2019.