Current address: ]Lightbox Jewelry, Orion House, 5 Upper St. Martins Lane, London, WC2H 9EA, United Kingdom
Long spin coherence times of nitrogen vacancy centers in milled nanodiamonds
Abstract
Nanodiamonds containing negatively charged nitrogen vacancy centers () have applications as localized sensors in biological materials and have been proposed as a platform to probe the macroscopic limits of spatial superposition and the quantum nature of gravity. A key requirement for these applications is to obtain nanodiamonds containing with long spin coherence times. Using milling to fabricate nanodiamonds processes the full 3D volume of the bulk material at once, unlike etching pillars, but has, up to now, limited spin coherence times. Here, we use natural isotopic abundance nanodiamonds produced by ball milling of chemical vapor deposition grown bulk diamond with an average single substitutional nitrogen concentration of . We show that the electron spin coherence times of centers in these nanodiamonds can exceed at room temperature with dynamical decoupling. Scanning electron microscopy provides images of the specific nanodiamonds containing for which a spin coherence time was measured.
I Introduction
The negatively charged nitrogen vacancy center () in diamond [1] has attracted attention as a tool in quantum information [2, 3], magnetometry [4, 5], electrometry [6, 7, 8, 9], and thermometry [10, 11, 12, 13] using optically detected magnetic resonance (ODMR). This leverages the optical initialization and readout of the electron spin state of the center, along with the microwave resonance of the spin state transitions, to control the state of the center [14]. In nanodiamonds, the has potential applications in sensing within biological materials as living cells can take in nanodiamonds and remain functional, allowing local sensing within cells [15, 16, 17, 18, 19, 20, 21, 22, 23, 24, 25, 26]. Also, nanodiamonds containing have been proposed as a platform to probe macroscopic spatial superpositions [27, 28, 29, 30, 31, 32] and the quantum nature of gravity [33, 34, 35]. These proposals require macroscopic spatial superposition states of the nanodiamonds involved, therefore, diamonds with a diameter on the order of containing a single center are proposed. Along with large nanodiamonds, the electron spin coherence time, , of the is a critical factor for these experiments. Dynamical decoupling techniques are used to suppress the dephasing of the spin state due to static or slowly changing fluctuations in the environment, maximizing the time.
In bulk diamond, times exceeding have been observed, using dynamical decoupling, at cryogenic temperatures [36, 37]. At room temperature the longest time is around , using purification and dynamical decoupling [38, 37]. However, observed times in nanodiamonds are significantly shorter. The longest reported in micro- or nanodiamonds is with dynamical decoupling and using isotopically pure diamond material that is etched into pillars of diameters to and lengths to [39]. For natural abundance micro- or nanodiamonds, the longest time reported for particles fabricated using etching techniques is [40] and by milling [41].
The time is sensitive to the dynamics of spins surrounding the , hence the shorter times for nanodiamonds containing uncontrolled spins. Therefore, it has been suggested that the suppression of in nanodiamonds is due to defects at the surface [42, 43, 44].
Here, we show that chemical vapor deposition (CVD) grown diamond with natural abundance and nitrogen concentration , can be processed by milling to fabricate nanodiamonds containing , with exceeding at room temperature. Milling conveniently permits the creation of nanodiamonds from the full 3D volume of the bulk material at once, unlike etching. The nanodiamond measurements were carried out using confocal fluorescence microscopy (CFM), and the same nanodiamonds were viewed by scanning electron microscopy (SEM).
Single-crystal CVD diamond was manufactured by Element Six with an average single substitutional nitrogen concentration of measured by electron paramagnetic resonance [46], and a natural abundance of . The expected grown-in concentration was [47]. Prior to ball milling [48], the diamonds used for this research were irradiated with electrons for one minute and annealed for three hours at , four hours at , and two hours at , similarly to previous methods [46, 49]. The irradiation time was chosen such that the expected final concentration was approximately . Given the atomic density of diamond (), it was expected that a nanodiamond containing a single center was around in diameter.
Reference [48] provides a detailed report of the fabrication process, x-ray photoelectron spectroscopy measurements of the surface, and particle-size distributions. In summary, the diamond plates were milled with balls to avoid magnetic contaminants from steel ball milling. After milling, the sample was acid cleaned in and then cleaned in NaOH, to remove the contaminants. This process does not remove all the contaminants, as the diamond sample gains mass after milling. The nanodiamonds were then annealed in an air atmosphere, dispersed in water, and centrifuged at a relative centrifugal force of . The air anneal produces nanodiamonds that have surfaces consisting of C-Si, COOH, C=O, C-O, C=C, and C-C bonds.
The nanodiamonds were held in a suspension of methanol at a density of approximately and sprayed for three seconds by a nebulizer (Omron MicroAIR U22) into an upturned vial, ensuring that a high density of nanodiamonds were injected. The nanodiamonds were then allowed to precipitate onto silicon wafers. This was to reduce the coffee-ring effect which was often observed in drop casting and to prevent aggregation, which was found to be prevalent when using direct spray applications. Other methods have also been demonstrated previously for mitigating the coffee-ring effect [50]. -type silicon wafers doped with of phosphorus were plasma etched using photolithography to create a grid system for locating individual nanodiamonds. This allows verification that the same nanodiamond is being addressed in both the CFM and SEM measurements.
Under CFM, nanodiamonds containing single centers were identified by Hanbury Brown-Twiss (HBT) measurements. HBT measurements quantify the degree of correlation between photon-detection events for different time delays, . A single cannot emit two photons simultaneously, therefore is expected. However, background fluorescence generates spurious coincidence events so indicates a single center. Background counts are not subtracted from the HBT data in this paper.
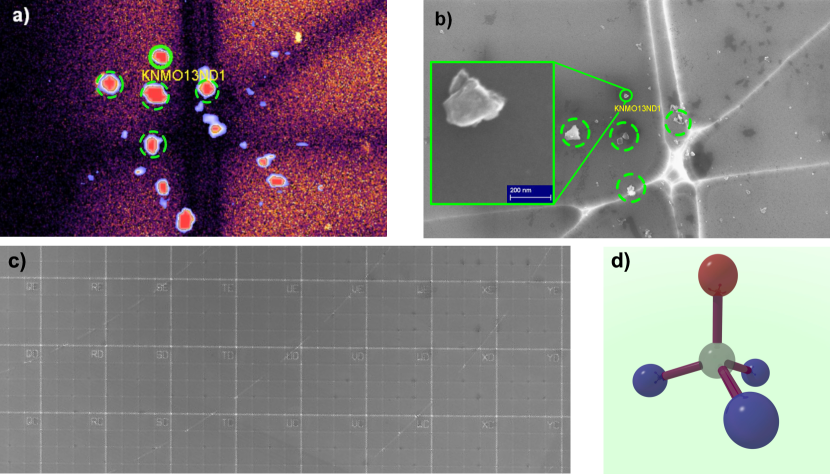
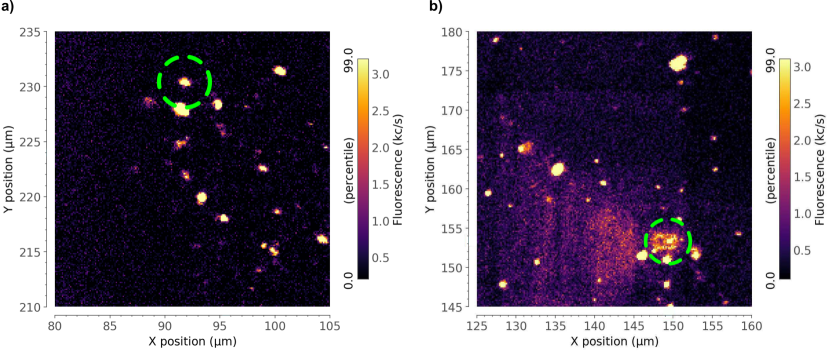
Those that displayed ODMR were selected and an external magnetic field aligned to the axis. The magnetic field is generated by a permanent magnet on an arm connected to three motors. Two motors rotate the magnet about perpendicular axes that intersect at the position of the sample. These allow rotation in a sphere around the sample without altering the distance between the magnet and the sample. The final motor linearly alters the distance between the magnet and the sample, without changing the angle. Therefore the angular alignment and magnetic field strength can be varied precisely and independently. To align the magnetic field, the fluorescent count rate is monitored and the angle of the magnet adjusted until the magnet can be brought close to the sample without the count rate decreasing. The count rate decreases in the presence of a misaligned field as the levels are no longer eigenstates of the system and so the spin states mix [4]. ODMR could have been used for the magnetic field alignment, however, we found that monitoring the count rate provided a faster alignment. For aligned centers, the fluorescence intensity remains constant as the magnitude of the magnetic field increases [4]. Spin-echo decay experiments were then carried out at room temperature to determine times using the Hahn echo, XY8-1, and XY8-4 dynamical decoupling pulse sequences. The sizes of the individual nanodiamonds were measured by SEM, as shown in Fig. 1.
II Results and Discussion
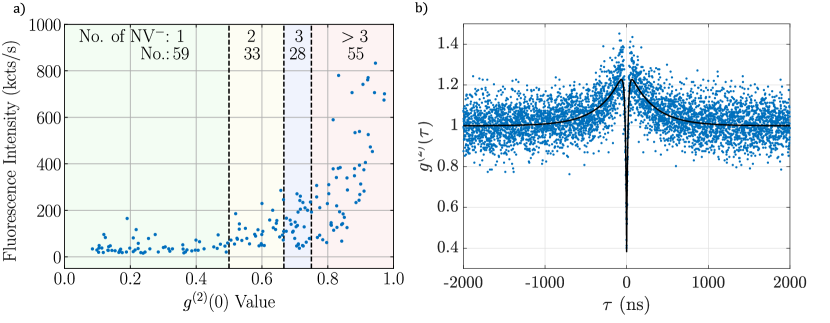
An automated survey collected HBT and fluorescence intensity measurements from 175 nanodiamonds containing , as shown in Fig. 2(a). Of the nanodiamonds measured, contained a single center whilst contained two, contained three, and contained more than three centers, respectively. We have characterized to indicate a single center, indicates two, indicates three and indicates more than three. The survey was conducted at an excitation laser power of .
The sites marked to be included in the HBT survey were identified from their fluorescence under CFM, therefore the number of nanodiamonds that do not contain any centers was not measured. If Poissonian statistics are assumed for the number of nanodiamonds containing one, two, and three centers, a fit of gives . Therefore, it can be estimated that the number of nanodiamonds containing zero in the surveyed region is . However, there are a number of factors that suggest that the data is not well described by Poissonian statistics and that the number of nanodiamonds containing zero centers is an order of magnitude estimate at best. First, while centers may have been incorporated into the bulk diamond material at an approximately constant rate, a range of nanodiamond sizes exist in the sample. Furthermore, selection bias exists in marking sites for surveys. Bright, roughly circular, isolated fluorescence spots are more likely to be identified as a nanodiamond containing and marked for survey than a dim spot, or an extended patch of fluorescence.
Figure 2(a) also contains a number of single centers with unusually high fluorescence intensity. We typically see single emitters with under CFM, however an number of surveyed sites exceeded this with one approaching . A possible explanation for the inflated fluorescence intensity is that the geometry of the milled nanodiamond and the location of the center are, by chance, in the required orientation to act as a waveguide [51, 52]. This could couple more of the emitted fluorescence into the microscope objective than would be the case from a spherical nanodiamond, boosting the measured fluorescence intensity.
HBT measurements on the nanodiamond labeled KNMO13ND1 (ND1) in Fig. 1 gave the value , as shown in Fig. 2(b), indicating that it contained a single center. (For further discussion of this inflated , see Appendix B). SEM observations of ND1 were used to estimate that the maximum distance an center could be from the surface () was .
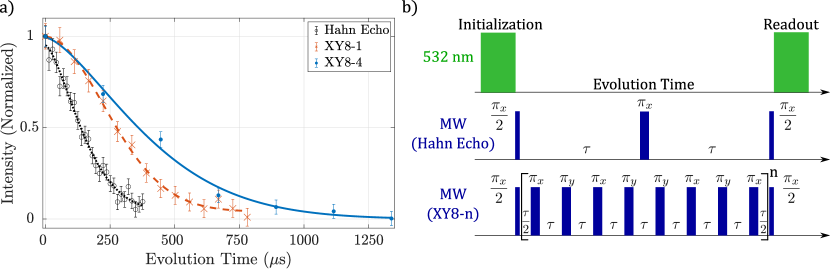
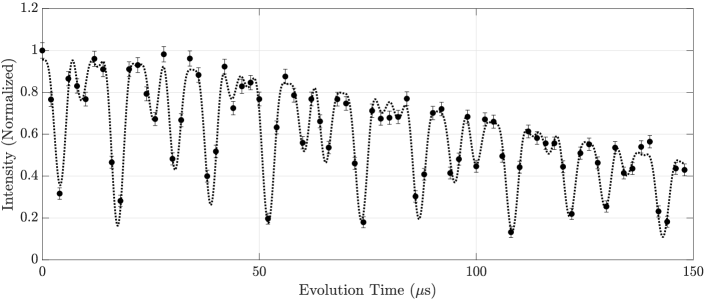
Spin-echo decay measurements were performed on seven nanodiamonds containing a single that also displayed satisfactory ODMR contrast (the difference in fluorescence intensity for an in the or the states). The nanodiamond ND1 provided the longest time of all nanodiamonds measured, as shown in Fig. 3(a), with values of , , and for the Hahn echo, XY8-1, and XY8-4 pulse sequences, respectively. These measurements were taken at an external field strength, measured by ODMR, of . Schematics of the pulse sequences are shown in Fig. 3(b).
measurements taken on the same nanodiamond before and after SEM indicated that was not corrupted. While small variations were observed, this is likely to be due to small changes in the magnetic field alignment [53, 54]. As discussed in Sec. I, the nanodiamond surface is largely oxygen terminated [48]. Any oxygen based groups that may be removed under SEM will immediately return on venting. The only significant change to the sample after SEM is that background fluorescence increases. We suggest that this is due to electrostatic charging of the silicon under SEM, which then attracts more fluorescent material after venting. This increase in background fluorescence can be seen in Appendix B.
The measurements in Fig. 3(a) were made with the time delay between microwave pulses chosen to sample the peaks of the revivals of the spin-echo signal [55, 53] that is present in ND1 (see Appendix C). This allows the data to be fit by an exponential without sinusoidal components.
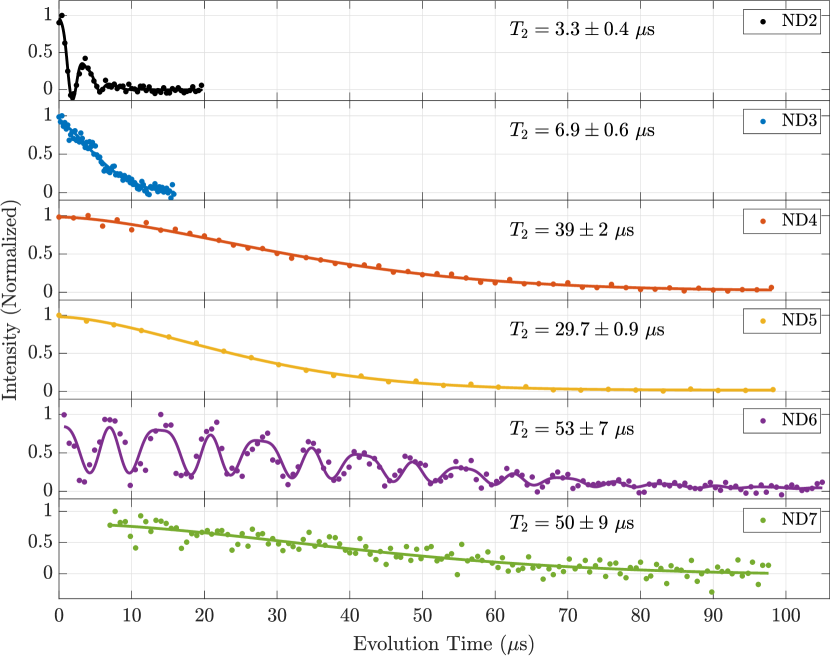
Hahn echo measurements on six other nanodiamonds containing single gave in the range to , as shown in Fig. 4. The mean time, including ND1, was . From SEM imaging of this group, including ND1, the mean size was characterized by . The six measurements were taken with external magnetic fields, measured by ODMR, that ranged from to .
The times presented here are, to our knowledge, the longest times for centers in nanodiamonds with a natural abundance of , despite these nanodiamonds being produced by milling. Milling produces much larger quantities of nanodiamonds, as it allows for production of nanodiamonds from the full volume of the bulk material, unlike etching. Previous measurements in the literature have reported that milled nanodiamonds contain with times shorter than those in nanodiamonds produced by etching [41, 40]. Furthermore, we have introduced a technique with SEM and silicon grid mapping to image the exact nanodiamonds for which we measure spin coherence times. Previous experiments reporting the time of nanodiamonds did not have a way of getting SEM images of the specific nanodiamond for which they measured spin coherence. Our time of is over twice as long as the reported in Ref. [40] using etching and over six times longer than the reported in Ref. [41] with milling. Five of the six Hahn echo times in Fig. 4 are longer than the longest Hahn echo times previously reported for milled nanodiamonds of to in Ref. [41]. It should be noted that the nanodiamond pillars in Ref. [40] are of a similar size to those measured here, with diameter and height . However, in Ref. [41], the nanodiamonds are smaller, with the majority of diameters within -.
The nanodiamonds surveyed for Fig. 2(a) were in a different region on the silicon grid to those nanodiamonds that were measured for spin coherence times. We estimate that around nanodiamonds containing single centers were investigated to measure seven times. There are a number of reasons why a single may not produce a measurement. For instance, if the ODMR contrast is too low, the number of measurement repeats required to reach an acceptable signal-to-noise ratio becomes prohibitive. s can display low ODMR contrast if they are too far from the wire delivering microwave excitation, and we have also observed that some , even if close to the wire, have little to no ODMR contrast. This lack of ODMR contrast has been observed before [56]. s can also fail to produce a measurement due to the limited range of motion of the arms that align the magnet to the axis to avoid crashing into the sample stage. If the magnet cannot be aligned to the axis, then a magnetic field cannot be applied to break the degeneracy of the levels without also significantly degrading the time [53, 54].
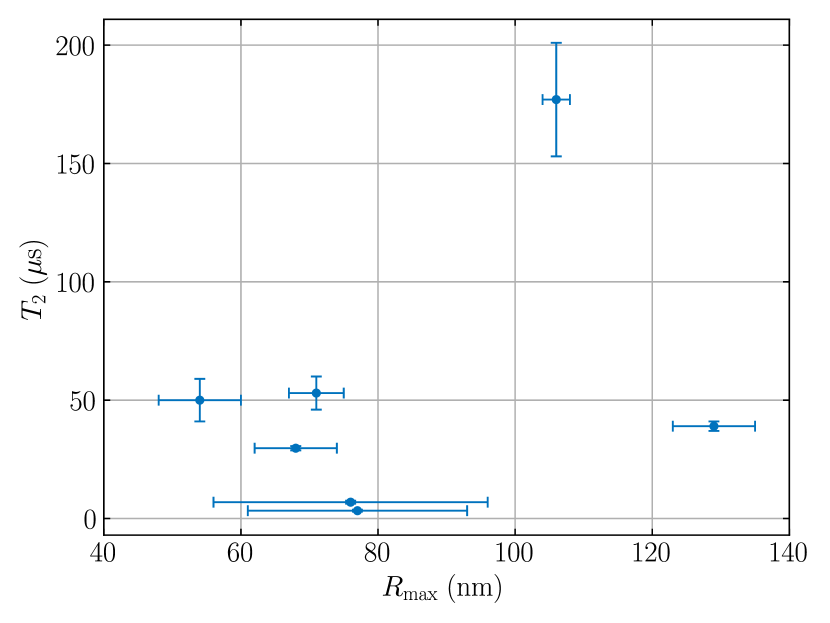
Under the assumption that all the nanodiamonds are spherical, and the s are located at the center of the sphere, we would expect that larger nanodiamonds would correlate with longer times. The further the is from the surface, the decohering effects of the surface are suppressed. However, in practice our milled nanodiamonds are far from spherical, and the center could be anywhere within the volume of the nanodiamond. As such, we do not observe a correlation between the size of the nanodiamond and the time (see Appendix D).
III Conclusion
We observed a nanodiamond containing a single electron spin coherence exceeding , with dynamical decoupling. For other nanodiamonds containing single centers, the average time measured by the Hahn echo sequence across the sample was . All spin coherence measurements were performed at room temperature. The nanodiamonds containing were fabricated from CVD diamond bulk material by ball milling [48, 46]. CVD allows diamond to be grown with low, and controllable, defect concentrations and milling permits the conversion of the entire bulk sample into nanodiamonds quickly, unlike masked etching of pillars. We have also used etched grid markings in silicon to be able to address specific nanodiamonds, that provided measurements, under SEM.
These times demonstrate that nanodiamonds produced by milling can contain centers with times that are comparable with or longer, than those produced by etching. These times should enable AC magnetometry with a sensitivity on the order of [4]. Furthermore, the high-volume fabrication enabled by milling is compatible with applications such as sensing [15, 16, 17, 18, 19, 20, 21, 22, 23, 24, 25, 26] and nanodiamond levitation [27, 28, 29, 30, 31, 34, 35, 57, 58, 59, 46, 60, 61, 62].
Acknowledgements.
G.A.S.’s PhD studentship is funded by the Engineering and Physical Sciences Research Council (EPSRC) Centre for Doctoral Training in Diamond Science and Technology (Grant No. EP/L015315/1). J.E.M.’s PhD studentship is funded by the Royal Society. B.L.G. is supported by the Royal Academy of Engineering. This work is supported by the UK National Quantum Technologies Programme through the NQIT Hub (Networked Quantum Information Technologies), the Quantum Computing and Simulation (QCS) Hub, and the Quantum Technology Hub for Sensors and Metrology with funding from UKRI EPSRC Grants No. EP/M013243/1, No. EP/T001062/1, and No. EP/M013294/1, respectively. G.W.M. is supported by the Royal Society.Appendix A Electron Irradiation
The irradiation was performed by Synergy Health in Swindon, United Kingdom. The beam is not well characterized, however, the beam current is approximately and produces vacancies at a rate of around 0.3 ppm/hr. Based on prior experience of using the irradiation facility, the one minute exposure time was chosen such that the expected final concentration was approximately .
Appendix B ND1 photon autocorrelation
HBT measurements on ND1 gave a fitted autocorrelation value of . Whilst this satisfies the condition for a single , it is larger than the values we typically observe for single in nanodiamonds at room temperature. The inflated value could be caused either by ND1 containing two centers with the emission intensity of one suppressed, or ND1 containing a single with a high background count rate, as background counts are not subtracted from the HBT data.
The first potential cause for emission suppression is if the two have different orientations in the diamond lattice then the input polarization of the excitation could couple preferentially with one orientation over the other. However, a number of experimental observations suggest that if there are two then they have the same orientation. First, there is only one pair of peaks observed in ODMR when an external magnetic field is applied. Second, a magnet can be aligned and moved from a distance of approximately to approximately from ND1 without changing the emitted fluorescence intensity. If there were two of different orientations, the off-axis magnetic field would further suppress the counts from one of them. Finally, multiple HBT measurements were taken with and without an aligned magnetic field and there was no clear difference in the value between the two cases. Once again, if there were two of different orientations, the magnetic field should change the level of suppression of the emission from one of the , changing the value.
Second, if one of the two is charge switching to , then its average fluorescence intensity is reduced. However, step changes in count rate due to charge-state switching have never been observed for ND1. It could be that charge switching is happening at a high frequency that cannot be seen as step changes in the fluorescence count rate, however, the charge switching would have had to have been consistently high frequency over the many hours of ND1 observations.
Finally, high background count levels can inflate values by increasing the number of coincident counts. For ND1, dynamical decoupling measurements were taken after the sample had been observed by SEM. After SEM, a rectangle of background fluorescence, more intense than the global background, was visible around ND1, as shown in Fig. 5. It is possible that the electron dose incident on the silicon on which ND1 sits caused fluorescent material to electrostatically stick to the silicon around ND1. Furthermore, a HBT measurement taken prior to SEM observation gave a value of .
Therefore, despite the inflated value for an ideal single center, , secondary observations and the condition being satisfied suggest that ND1 is a nanodiamond containing a single in the presence of a high level of background counts.
Appendix C revivals
Dynamical decoupling sequences, such as Hahn echo and XY8-n, act to cancel magnetic fluctuations local to the center that are static, or change slowly with respect to the pulse spacing. However, a prominent dynamical change in the magnetic environment is due to the precession of spins. Slight differences in the precession frequency of spins in the surrounding spin bath due to slight misalignment between the external magnetic field and the axis and hyperfine interaction between those spins and the spin induces decoherence [54].
Alongside the decoherence effects of the spin bath, individual spins close to the can couple coherently through the hyperfine interaction causing collapses and revivals in the fluorescence intensity in spin-echo measurements [55, 53]. Examples of these collapses and revivals are shown in Fig. 6 in a Hahn echo measurement on ND1, where the oscillation is well described by the interaction between the and one proximal spin.
The revivals are not present in Fig. 3 of the main text as the sampled evolution times are chosen to match the peaks of the revivals in the spin-echo signal. This allows the measurement to be run with far fewer data points than would be required to adequately fit the oscillations across the full range. The exponential envelope, and as such the times, can then be fit with a higher signal-to-noise ratio for the same elapsed time as each data point can be repeated a greater number of times.
For the longer pulses sequences, XY8-1 and XY8-4, the time required to collect enough data points with a good enough signal-to-noise ratio to properly fit the revivals becomes prohibitive. Therefore, the sampled evolution times are chosen to match the revival peaks once again. However, the minimum interpulse wait time, , in Fig. 3(b) of the main text must be an integer multiple of the revival time. This integer requirement to hit the revival peaks means that the total evolution time in XY8-4 steps in integer multiples of 32 times the fitted revival period in Fig. 3. This is why there are only seven points in the XY8-4 measurement in Fig. 3(a) of the main text, as that is the most tightly spaced evolution time sampling possible whilst still hitting revival peaks.
Appendix D Nanodiamond size vs. time
Using the grid markings etched onto the silicon the nanodiamonds are deposited on, each nanodiamond that contained an for which a was measured was viewed under SEM. Figure 7 shows that we did not observe a correlation between nanodiamond size and time.
There are limitations to characterizing the nanodiamond size under SEM. The two-dimensional image allows the projected size to be measured, but provides no information as to the depth of the nanodiamond. Nanodiamonds are sometimes deposited in clumps, leaving it unclear under SEM as to whether there is one large nanodiamond that contains the , or a smaller nanodiamond containing the next to another small nanodiamond that does not contain an . This is the case for the two data points in Fig. 7 that have .
Even if the SEM observations could provide perfect information on the size and shape of each nanodiamond, we have no knowledge of the location of the center within the diamond. Therefore, is an estimate from the SEM images of the maximum distance that the center could be from the surface. These factors, along with those discussed in the main text, all contribute to mask any possible correlation between the nanodiamond size and time.
References
- Doherty et al. [2013] M. W. Doherty, N. B. Manson, P. Delaney, F. Jelezko, J. Wrachtrup, and L. C. L. Hollenberg, The nitrogen-vacancy colour centre in diamond, Phys. Rep. 528, 1 (2013).
- Robledo et al. [2011] L. Robledo, L. Childress, H. Bernien, B. Hensen, P. F. A. Alkemade, and R. Hanson, High-fidelity projective read-out of a solid-state spin quantum register, Nature 477, 574 (2011).
- Bradley et al. [2019] C. E. Bradley, J. Randall, M. H. Abobeih, R. C. Berrevoets, M. J. Degen, M. A. Bakker, M. Markham, D. J. Twitchen, and T. H. Taminiau, A Ten-Qubit Solid-State Spin Register with Quantum Memory up to One Minute, Phys. Rev. X 9, 031045 (2019).
- Rondin et al. [2014] L. Rondin, J.-P. Tetienne, T. Hingant, J.-F. Roch, P. Maletinsky, and V. Jacques, Magnetometry with nitrogen-vacancy defects in diamond, Rep. Prog. Phys. 77, 056503 (2014).
- Barry et al. [2020] J. F. Barry, J. M. Schloss, E. Bauch, M. J. Turner, C. A. Hart, L. M. Pham, and R. L. Walsworth, Sensitivity optimization for NV-diamond magnetometry, Rev. Mod. Phys. 92, 015004 (2020).
- Dolde et al. [2011] F. Dolde, H. Fedder, M. W. Doherty, T. Nöbauer, F. Rempp, G. Balasubramanian, T. Wolf, F. Reinhard, L. C. L. Hollenberg, F. Jelezko, and J. Wrachtrup, Electric-field sensing using single diamond spins, Nat. Phys. 7, 459 (2011).
- Dolde et al. [2014] F. Dolde, M. W. Doherty, J. Michl, I. Jakobi, B. Naydenov, S. Pezzagna, J. Meijer, P. Neumann, F. Jelezko, N. B. Manson, and J. Wrachtrup, Nanoscale Detection of a Single Fundamental Charge in Ambient Conditions Using the NV- Center in Diamond, Phys. Rev. Lett. 112, 097603 (2014).
- Karaveli et al. [2016] S. Karaveli, O. Gaathon, A. Wolcott, R. Sakakibara, O. A. Shemesh, D. S. Peterka, E. S. Boyden, J. S. Owen, R. Yuste, and D. Englund, Modulation of nitrogen vacancy charge state and fluorescence in nanodiamonds using electrochemical potential, Proc. Natl. Acad. Sci. U.S.A. 113, 3938 (2016).
- Chen et al. [2017] E. H. Chen, H. A. Clevenson, K. A. Johnson, L. M. Pham, D. R. Englund, P. R. Hemmer, and D. A. Braje, High-sensitivity spin-based electrometry with an ensemble of nitrogen-vacancy centers in diamond, Phys. Rev. A 95, 053417 (2017).
- Acosta et al. [2010] V. M. Acosta, E. Bauch, M. P. Ledbetter, A. Waxman, L. S. Bouchard, and D. Budker, Temperature Dependence of the Nitrogen-Vacancy Magnetic Resonance in Diamond, Phys. Rev. Lett. 104, 070801 (2010).
- Toyli et al. [2013] D. M. Toyli, C. F. de las Casas, D. J. Christle, V. V. Dobrovitski, and D. D. Awschalom, Fluorescence thermometry enhanced by the quantum coherence of single spins in diamond, Proc. Natl. Acad. Sci. U.S.A. 110, 8417 (2013).
- Neumann et al. [2013] P. Neumann, I. Jakobi, F. Dolde, C. Burk, R. Reuter, G. Waldherr, J. Honert, T. Wolf, A. Brunner, J. H. Shim, D. Suter, H. Sumiya, J. Isoya, and J. Wrachtrup, High-Precision Nanoscale Temperature Sensing Using Single Defects in Diamond, Nano Lett. 13, 2738 (2013).
- Plakhotnik et al. [2014] T. Plakhotnik, M. W. Doherty, J. H. Cole, R. Chapman, and N. B. Manson, All-Optical Thermometry and Thermal Properties of the Optically Detected Spin Resonances of the NV-Center in Nanodiamond, Nano Lett. 14, 4989 (2014).
- Jelezko and Wrachtrup [2006] F. Jelezko and J. Wrachtrup, Single defect centres in diamond: A review, Phys. Status Solidi A 203, 3207 (2006).
- Yu et al. [2005] S.-J. Yu, M.-W. Kang, H.-C. Chang, K.-M. Chen, and Y.-C. Yu, Bright fluorescent nanodiamonds: No photobleaching and low cytotoxicity, J. Am. Chem. Soc. 127, 17604 (2005).
- Fu et al. [2007] C. C. Fu, H. Y. Lee, K. Chen, T. S. Lim, H. Y. Wu, P. K. Lin, P. K. Wei, P. H. Tsao, H. C. Chang, and W. Fann, Characterization and application of single fluorescent nanodiamonds as cellular biomarkers, Proc. Natl. Acad. Sci. U.S.A. 104, 727 (2007).
- Neugart et al. [2007] F. Neugart, A. Zappe, F. Jelezko, C. Tietz, J. P. Boudou, A. Krueger, and J. Wrachtrup, Dynamics of Diamond Nanoparticles in Solution and Cells, Nano Lett. 7, 3588 (2007).
- Chang et al. [2008] Y.-R. Chang, H.-Y. Lee, K. Chen, C.-C. Chang, D.-S. Tsai, C.-C. Fu, T.-S. Lim, Y.-K. Tzeng, C.-Y. Fang, C.-C. Han, H.-C. Chang, and W. Fann, Mass production and dynamic imaging of fluorescent nanodiamonds, Nat. Nanotechnol. 3, 486 (2008).
- McGuinness et al. [2011] L. P. McGuinness, Y. Yan, A. Stacey, D. A. Simpson, L. T. Hall, D. MacLaurin, S. Prawer, P. Mulvaney, J. Wrachtrup, F. Caruso, R. E. Scholten, and L. C. L. Hollenberg, Quantum measurement and orientation tracking of fluorescent nanodiamonds inside living cells, Nat. Nanotechnol. 6, 358 (2011).
- Schroeder et al. [2012] A. Schroeder, D. A. Heller, M. M. Winslow, J. E. Dahlman, G. W. Pratt, R. Langer, T. Jacks, and D. G. Anderson, Treating metastatic cancer with nanotechnology, Nat. Rev. Cancer 12 (2012).
- Le Sage et al. [2013] D. Le Sage, K. Arai, D. R. Glenn, S. J. Devience, L. M. Pham, L. Rahn-Lee, M. D. Lukin, A. Yacoby, A. Komeili, and R. L. Walsworth, Optical magnetic imaging of living cells, Nature 496, 486 (2013).
- Kucsko et al. [2013] G. Kucsko, P. C. Maurer, N. Y. Yao, M. Kubo, H. J. Noh, P. K. Lo, H. Park, and M. D. Lukin, Nanometre-scale thermometry in a living cell, Nature 500, 54 (2013).
- Chipaux et al. [2018] M. Chipaux, K. J. van der Laan, S. R. Hemelaar, M. Hasani, T. Zheng, and R. Schirhagl, Nanodiamonds and their applications in cells, Small 14, 1704263 (2018).
- Wang et al. [2019] P. Wang, S. Chen, M. Guo, S. Peng, M. Wang, M. Chen, W. Ma, R. Zhang, J. Su, X. Rong, F. Shi, T. Xu, and J. Du, Nanoscale magnetic imaging of ferritins in a single cell, Sci. Adv. 5, eaau8038 (2019).
- Choi et al. [2020] J. Choi, H. Zhou, R. Landig, H.-Y. Wu, X. Yu, S. E. Von Stetina, G. Kucsko, S. E. Mango, D. J. Needleman, A. D. T. Samuel, P. C. Maurer, H. Park, and M. D. Lukin, Probing and manipulating embryogenesis via nanoscale thermometry and temperature control, Proc. Natl. Acad. Sci. U.S.A. 117, 14636 (2020).
- Fujiwara et al. [2020] M. Fujiwara, S. Sun, A. Dohms, Y. Nishimura, K. Suto, Y. Takezawa, K. Oshimi, L. Zhao, N. Sadzak, Y. Umehara, Y. Teki, N. Komatsu, O. Benson, Y. Shikano, and E. Kage-Nakadai, Real-time nanodiamond thermometry probing in vivo thermogenic responses, Sci. Adv. 6, eaba9636 (2020).
- Scala et al. [2013] M. Scala, M. S. Kim, G. W. Morley, P. F. Barker, and S. Bose, Matter-Wave Interferometry of a Levitated Thermal Nano-Oscillator Induced and Probed by a Spin, Phys. Rev. Lett. 111, 180403 (2013).
- Yin et al. [2013] Z.-q. Yin, T. Li, X. Zhang, and L. M. Duan, Large quantum superpositions of a levitated nanodiamond through spin-optomechanical coupling, Phys. Rev. A 88, 033614 (2013).
- Wan et al. [2016a] C. Wan, M. Scala, G. W. Morley, ATM. A. Rahman, H. Ulbricht, J. Bateman, P. F. Barker, S. Bose, and M. S. Kim, Free Nano-Object Ramsey Interferometry for Large Quantum Superpositions, Phys. Rev. Lett. 117, 143003 (2016a).
- Wan et al. [2016b] C. Wan, M. Scala, S. Bose, A. C. Frangeskou, ATM. A. Rahman, G. W. Morley, P. F. Barker, and M. S. Kim, Tolerance in the Ramsey interference of a trapped nanodiamond, Phys. Rev. A 93, 043852 (2016b).
- Pedernales et al. [2020] J. S. Pedernales, G. W. Morley, and M. B. Plenio, Motional dynamical decoupling for interferometry with macroscopic particles, Phys. Rev. Lett. 125, 023602 (2020).
- Wood et al. [2022] B. D. Wood, S. Bose, and G. W. Morley, Spin dynamical decoupling for generating macroscopic superpositions of a free-falling nanodiamond, Phys. Rev. A 105, 012824 (2022).
- Albrecht et al. [2014] A. Albrecht, A. Retzker, and M. B. Plenio, Testing quantum gravity by nanodiamond interferometry with nitrogen-vacancy centers, Phys. Rev. A 90, 033834 (2014).
- Bose et al. [2017] S. Bose, A. Mazumdar, G. W. Morley, H. Ulbricht, M. Toroš, M. Paternostro, A. A. Geraci, P. F. Barker, M. S. Kim, and G. Milburn, Spin Entanglement Witness for Quantum Gravity, Phys. Rev. Lett. 119, 240401 (2017).
- Marletto and Vedral [2017] C. Marletto and V. Vedral, Gravitationally Induced Entanglement between Two Massive Particles is Sufficient Evidence of Quantum Effects in Gravity, Phys. Rev. Lett. 119, 240402 (2017).
- Abobeih et al. [2018] M. H. Abobeih, J. Cramer, M. A. Bakker, N. Kalb, M. Markham, D. J. Twitchen, and T. H. Taminiau, One-second coherence for a single electron spin coupled to a multi-qubit nuclear-spin environment, Nat. Commun. 9, 2552 (2018).
- Bar-Gill et al. [2013] N. Bar-Gill, L. M. Pham, A. Jarmola, D. Budker, and R. L. Walsworth, Solid-state electronic spin coherence time approaching one second, Nat. Commun. 4, 1743 (2013).
- Balasubramanian et al. [2009] G. Balasubramanian, P. Neumann, D. Twitchen, M. Markham, R. Kolesov, N. Mizuochi, J. Isoya, J. Achard, J. Beck, J. Tissler, V. Jacques, P. R. Hemmer, F. Jelezko, and J. Wrachtrup, Ultralong spin coherence time in isotopically engineered diamond, Nat. Mater. 8, 383 (2009).
- Andrich et al. [2014] P. Andrich, B. J. Alemán, J. C. Lee, K. Ohno, C. F. de las Casas, F. J. Heremans, E. L. Hu, and D. D. Awschalom, Engineered Micro- and Nanoscale Diamonds as Mobile Probes for High-Resolution Sensing in Fluid, Nano Lett. 14, 4959 (2014).
- Trusheim et al. [2014] M. E. Trusheim, L. Li, A. Laraoui, E. H. Chen, H. Bakhru, T. Schröder, O. Gaathon, C. A. Meriles, and D. Englund, Scalable Fabrication of High Purity Diamond Nanocrystals with Long-Spin-Coherence Nitrogen Vacancy Centers, Nano Lett. 14, 32 (2014).
- Knowles et al. [2014] H. S. Knowles, D. M. Kara, and M. Atatüre, Observing bulk diamond spin coherence in high-purity nanodiamonds, Nat. Mater. 13, 21 (2014).
- Rondin et al. [2010] L. Rondin, G. Dantelle, A. Slablab, F. Grosshans, F. Treussart, P. Bergonzo, S. Perruchas, T. Gacoin, M. Chaigneau, H.-C. Chang, V. Jacques, and J.-F. Roch, Surface-induced charge state conversion of nitrogen-vacancy defects in nanodiamonds, Phys. Rev. B 82, 115449 (2010).
- Sangtawesin et al. [2019] S. Sangtawesin, B. L. Dwyer, S. Srinivasan, J. J. Allred, L. V. H. Rodgers, K. De Greve, A. Stacey, N. Dontschuk, K. M. O’Donnell, D. Hu, D. A. Evans, C. Jaye, D. A. Fischer, M. L. Markham, D. J. Twitchen, H. Park, M. D. Lukin, and N. P. de Leon, Origins of Diamond Surface Noise Probed by Correlating Single-Spin Measurements with Surface Spectroscopy, Phys. Rev. X 9, 031052 (2019).
- de Guillebon et al. [2020] T. de Guillebon, B. Vindolet, J.-F. Roch, V. Jacques, and L. Rondin, Temperature dependence of the longitudinal spin relaxation time of single nitrogen-vacancy centers in nanodiamonds, Phys. Rev. B 102, 165427 (2020).
- Binder et al. [2017] J. M. Binder, A. Stark, N. Tomek, J. Scheuer, F. Frank, K. D. Jahnke, C. Müller, S. Schmitt, M. H. Metsch, T. Unden, T. Gehring, A. Huck, U. L. Andersen, L. J. Rogers, and F. Jelezko, Qudi: A modular python suite for experiment control and data processing, SoftwareX 6, 85 (2017).
- Frangeskou et al. [2018] A. C. Frangeskou, A. T. M. A. Rahman, L. Gines, S. Mandal, O. A. Williams, P. F. Barker, and G. W. Morley, Pure nanodiamonds for levitated optomechanics in vacuum, New J. Phys. 20, 043016 (2018).
- Edmonds et al. [2012] A. M. Edmonds, U. F. S. D’Haenens-Johansson, R. J. Cruddace, M. E. Newton, K. M. C. Fu, C. Santori, R. G. Beausoleil, D. J. Twitchen, and M. L. Markham, Production of oriented nitrogen-vacancy color centers in synthetic diamond, Phys. Rev. B 86, 035201 (2012).
- Ginés et al. [2018] L. Ginés, S. Mandal, D. J. Morgan, R. Lewis, P. R. Davies, P. Borri, G. W. Morley, and O. A. Williams, Production of metal-free diamond nanoparticles, ACS Omega 3, 16099 (2018).
- Chu et al. [2014] Y. Chu, N. P. de Leon, B. J. Shields, B. Hausmann, R. Evans, E. Togan, M. J. Burek, M. Markham, A. Stacey, A. S. Zibrov, A. Yacoby, D. J. Twitchen, M. Loncar, H. Park, P. Maletinsky, and M. D. Lukin, Coherent Optical Transitions in Implanted Nitrogen Vacancy Centers, Nano Lett. 14, 1982 (2014).
- Hees et al. [2011] J. Hees, A. Kriele, and O. A. Williams, Electrostatic self-assembly of diamond nanoparticles, Chem. Phys. Lett. 509, 12 (2011).
- Babinec et al. [2010] T. M. Babinec, B. J. M. Hausmann, M. Khan, Y. Zhang, J. R. Maze, P. R. Hemmer, and M. Lončar, A diamond nanowire single-photon source, Nat. Nanotechnol. 5, 195 (2010).
- Momenzadeh et al. [2015] S. A. Momenzadeh, R. J. Stöhr, F. F. de Oliveira, A. Brunner, A. Denisenko, S. Yang, F. Reinhard, and J. Wrachtrup, Nanoengineered Diamond Waveguide as a Robust Bright Platform for Nanomagnetometry Using Shallow Nitrogen Vacancy Centers, Nano Lett. 15, 165 (2015).
- Maze et al. [2008] J. R. Maze, J. M. Taylor, and M. D. Lukin, Electron spin decoherence of single nitrogen-vacancy defects in diamond, Phys. Rev. B 78, 094303 (2008).
- Stanwix et al. [2010] P. L. Stanwix, L. M. Pham, J. R. Maze, D. Le Sage, T. K. Yeung, P. Cappellaro, P. R. Hemmer, A. Yacoby, M. D. Lukin, and R. L. Walsworth, Coherence of nitrogen-vacancy electronic spin ensembles in diamond, Phys. Rev. B 82, 201201(R) (2010).
- Childress et al. [2006] L. Childress, M. V. G. Dutt, J. M. Taylor, A. S. Zibrov, F. Jelezko, J. Wrachtrup, P. R. Hemmer, and M. D. Lukin, Coherent Dynamics of Coupled Electron and Nuclear Spin Qubits in Diamond, Science 314, 281 (2006).
- van Dam et al. [2019] S. B. van Dam, M. Walsh, M. J. Degen, E. Bersin, S. L. Mouradian, A. Galiullin, M. Ruf, M. IJspeert, T. H. Taminiau, R. Hanson, and D. R. Englund, Optical coherence of diamond nitrogen-vacancy centers formed by ion implantation and annealing, Phys. Rev. B 99, 161203(R) (2019).
- Hoang et al. [2016] T. M. Hoang, J. Ahn, J. Bang, and T. Li, Electron spin control of optically levitated nanodiamonds in vacuum, Nat. Commun. 7, 12250 (2016).
- Hsu et al. [2016] J.-F. Hsu, P. Ji, C. W. Lewandowski, and B. D’Urso, Cooling the Motion of Diamond Nanocrystals in a Magneto-Gravitational Trap in High Vacuum, Sci. Rep. 6, 30125 (2016).
- Pettit et al. [2017] R. M. Pettit, L. P. Neukirch, Y. Zhang, and A. Nick Vamivakas, Coherent control of a single nitrogen-vacancy center spin in optically levitated nanodiamond, J. Opt. Soc. Am. B 34, C31 (2017).
- Delord et al. [2018] T. Delord, P. Huillery, L. Schwab, L. Nicolas, L. Lecordier, and G. Hétet, Ramsey Interferences and Spin Echoes from Electron Spins Inside a Levitating Macroscopic Particle, Phys. Rev. Lett. 121, 053602 (2018).
- Conangla et al. [2018] G. P. Conangla, A. W. Schell, R. A. Rica, and R. Quidant, Motion Control and Optical Interrogation of a Levitating Single Nitrogen Vacancy in Vacuum, Nano Lett. 18, 3956 (2018).
- O’Brien et al. [2019] M. C. O’Brien, S. Dunn, J. E. Downes, and J. Twamley, Magneto-mechanical trapping of micro-diamonds at low pressures, Appl. Phys. Lett. 114, 053103 (2019).