Understanding Performance Problems in Deep Learning Systems
Abstract.
Deep learning (DL) has been widely applied to many domains. Unique challenges in engineering DL systems are posed by the programming paradigm shift from traditional systems to DL systems, and performance is one of the challenges. Performance problems (PPs) in DL systems can cause severe consequences such as excessive resource consumption and financial loss. While bugs in DL systems have been extensively investigated, PPs in DL systems have hardly been explored. To bridge this gap, we present the first comprehensive study to i) characterize symptoms, root causes, and introducing and exposing stages of PPs in DL systems developed in TensorFLow and Keras, with 224 PPs collected from 210 StackOverflow posts, and to ii) assess the capability of existing performance analysis approaches in tackling PPs, with a constructed benchmark of 58 PPs in DL systems. Our findings shed light on the implications on developing high-performance DL systems, and detecting and localizing PPs in DL systems. To demonstrate the usefulness of our findings, we develop a static checker DeepPerf to detect three types of PPs. It has detected 488 new PPs in 130 GitHub projects. 105 and 27 PPs have been confirmed and fixed.
1. Introduction
The advances in deep learning (DL) have attracted an increasing interest in applying DL to various applications in both industry and academia, e.g., image processing, machine translation, speech recognition, medical diagnosis, self-driving cars, and robotics. DL systems adopt a data-driven programming paradigm, where developers define a desired neural network that learns the decision logic from a large amount of training data. Differently, traditional systems follow a logic-based programming paradigm, where developers directly encode the decision logic in the source code. This paradigm shift poses unique challenges to engineering DL systems (Amershi et al., 2019; Zhang et al., 2019; Han et al., 2020; Chen et al., 2020).
In particular, performance, as an important quality requirement, is one of the challenges in engineering DL systems (Zhang et al., 2019). It has a significant impact on the time and resources (e.g., GPU memory and power) required during the process pipeline (e.g., training and inference) of DL systems (Menghani, 2021). For example, the language model GPT-3 costs millions of dollars for a single training run111https://lambdalabs.com/blog/demystifying-gpt-3/. Performance problems (PPs) can slow down DL systems, consume excessive resources, hurt user experience, cause financial loss, or threaten human lives. For example, many users suffered a significant slowdown of their DL systems after upgrading TensorFlow 1.x to TensorFlow 2.x, and hence decided to switch to PyTorch222https://stackoverflow.com/questions/58441514/why-is-tensorflow-2-much-slower-than-tensorflow-1. Moreover, performance questions of DL systems are recognized as the most difficult to answer among all questions of DL systems on StackOverflow (Zhang et al., 2019). Therefore, it is necessary to study the characteristics of PPs in DL systems.
A lot of efforts have been recently made to extensively investigate the characteristics (e.g., symptoms, root causes, fixes and taxonomy) of general bugs (Zhang et al., 2018; Islam et al., 2019; Humbatova et al., 2020; Islam et al., 2020) and specific bugs (Zhang et al., 2020c; Chen et al., 2021; Zhang et al., 2021b; Wan et al., 2021) in DL systems. However, these studies are not specifically designed for PPs, and thus only capture some partial characteristics of PPs in DL systems. In contrast, PPs have been widely studied for traditional systems, e.g., desktop or server applications (Jin et al., 2012; Zaman et al., 2012; Nistor et al., 2013a; Song and Lu, 2014), highly configurable systems (Han and Yu, 2016; He et al., 2020), mobile applications (Liu et al., 2014; Linares-Vasquez et al., 2015), database-backed web applications (Yang et al., 2018, 2019), and JavaScript systems (Selakovic and Pradel, 2016). However, PPs in DL systems could be different due to the programming paradigm shift from traditional systems to DL systems. In summary, the characteristics of PPs in DL systems are under-investigated.
To bridge this knowledge gap, we present the first comprehensive study to characterize PPs in DL systems developed in TensorFlow and Keras and to assess existing approaches in tackling PPs. To this end, we first collect 224 PPs from 210 StackOverflow posts, and manually investigate the PPs to characterize their symptoms (RQ1), root causes (RQ2), and introducing and exposing stages (RQ3). Based on these 224 PPs, we manually build a benchmark of 58 PPs that cover most symptoms and root causes, and assess the capability of a profiler in detecting PPs, the capability of a compiler in optimizing PPs, and the capability of documentation in hinting PPs (RQ4).
-
•
RQ1 Symptom: what are the symptoms of PPs?
-
•
RQ2 Root Cause: what are the root causes of PPs?
-
•
RQ3 Stage: what are the stages of introducing and exposing PPs?
-
•
RQ4 Assessment: how is the capability of existing performance analysis approaches in tackling PPs?
Through these research question analysis, we aim to provide useful findings for developers and researchers. For example, more than half of the PPs slow down DL systems, and nearly one-third of the PPs consume either extremely low or high resources. About half of the PPs are introduced by API misuses, and root causes related to model, data and hardware introduce more than one-third of the PPs. The most bug-prone stages are data preparation, environment setting, model building and training. The most bug-affecting stages are training and data preparation. 40% of the PPs are not exposed in the introducing stage. Existing approaches have a very limited capability in tackling PPs. Our findings provide implications for developers and researchers on developing high-performance DL systems and detecting and localizing PPs in DL systems, e.g., performance-aware techniques to recommend DL library APIs and DL models, static techniques to model and estimate time cost and resource consumption of DL systems, and rule-based techniques to detect and localize PPs in DL systems.
To demonstrate the usefulness of our findings, we develop a static checker, named DeepPerf, that supports rule-based detection of three types of PPs derived from our study. We run DeepPerf against 1,108 GitHub projects with more than 100 stars. DeepPerf has detected 488 new PPs in 130 of these projects with 15 false positives. 105 of these PPs have already been confirmed by the developers, and 27 of them have already been fixed. Others are still waiting for confirmation.
In summary, this paper makes the following contributions.
-
•
We present the first comprehensive study to characterize 224 PPs in DL systems written in TensorFlow and Keras, and to assess existing approaches in tackling a contructed benchmark of 58 PPs.
-
•
We develop a static checker, named DeepPerf, to detect three types of PPs, and detect 488 new PPs in 130 GitHub projects.
2. Empirical Study Methodology
We first introduce the design of our study, and then present our data collection, data labeling, and benchmark construction process.
2.1. Study Design
Our goal is to understand PPs in DL systems. As DL systems can be built on top of various DL libraries, we limit our scope to DL systems developed in TensorFlow and Keras. We select TensorFlow as it is the most popular DL library on GitHub. We also include Keras because it is built on top of and tightly integrated with TensorFlow 2. We include Keras but do not distinguish between TensorFlow and Keras in our analysis because i) Keras is a frontend and should be used with a backend, and TensorFlow is the most popular backend, and ii) TensorFlow and Keras are often tightly used together.
To achieve this goal, we propose the four research questions as introduced in Sec. 1. Our symptom analysis in RQ1 aims to understand the observable consequences of PPs. Our findings from RQ1 can characterize the significance of PPs, and provide insights for developing PP detection approaches. Our root cause analysis in RQ2 aims to characterize the fundamental reasons for the occurrence of PPs. Our findings from RQ2 can provide insights for designing PP localization approaches. Our stage analysis in RQ3 aims to locate DL pipeline stages where PPs are introduced and exposed, and measure the distance between exposing stage and introducing stage. Our findings from RQ3 can locate the bug-prone and bug-affecting stages that should be concerned, and reflect the difficulty of PP localization. Our approach assessment in RQ4 aims to quantitatively evaluate existing approaches in tackling PPs. Our findings from RQ4 can reveal the necessity of PP detection and localization approaches. Besides, our findings can also provide hints to develop high-performance DL systems.
2.2. Data Collection
We collected PPs from a well-known Q&A site StackOverflow, where world-wide developers can discuss software development problems. Our PP collection process consists of the following three steps.
Step 1: DL Post Selection. We first selected posts related to DL libraries TensorFlow and Keras by checking whether the tags of a post contain the keywords “tensorflow” and “keras”. We also filtered posts that were created before 2018-01-01 to avoid usage discussions about old versions of DL libraries that are usually no longer used. At the time of selection (i.e., 2021-03-01), we obtained 61,169 DL posts. Then, we excluded posts that did not contain any source code in question descriptions for the ease of our manual analysis. To focus on high-quality posts, we also excluded posts that did not have an accepted answer or any answer whose votes were greater than two because questioners often commented that the problems had been solved, but forgot to accept the answer. After this step, we had 18,730 DL posts.
Step 2: PP Post Selection. Instead of directly using performance-related keywords from the existing studies on PPs in traditional systems (e.g., (Jin et al., 2012; Zaman et al., 2012; Nistor et al., 2013a; Song and Lu, 2014)), we derived a keyword set in the following way to achieve a wide and comprehensive coverage of PP posts. We first randomly sampled 100 posts with a tag of “performance” from 18,730 posts in Step 1. Then, we manually analyzed these posts to extract performance-related keywords, and added them to the set of keywords from existing studies. We continued this procedure of random sampling and manual analysis for another two rounds until no new keyword was found; i.e., we sampled 300 posts, which achieved 95% confidence level and 5.6% confidence interval. Finally, we used the derived keyword set to search question descriptions of the 18,730 posts in Step 1, which resulted in 742 candidate PP posts. We provide the full set of derived keywords at our replication site.
Step 3: PP Identification. We manually verified the 742 candidate PP posts to reduce noise that was not about PPs in DL systems. For example, some posts might happen to have performance-related keywords, but did not discuss PPs; some posts actually discussed the accuracy of DL models (because accuracy is often interchangeable with performance in the DL community, and we align with the SE community where performance is usually referred to as efficiency); and some posts indeed discussed performance, but did not have a correct answer, which could not be used to understand the characteristics of PPs. In particular, two of the authors separately inspected each candidate PP post to identify PPs. We used Cohen’s Kappa coefficient to measure the agreement, and it reached 0.813. A third author was involved to resolve disagreements. Finally, we identified 224 PPs from 210 PP posts, of which 14 PP posts contained two PPs. This scale is comparable to previous studies on PPs, e.g., 109 PPs in desktop or server applications (Jin et al., 2012) and 70 PPs in mobile applications (Liu et al., 2014).
2.3. Data Labeling
To answer RQ1, RQ2 and RQ3, two of the authors labeled each of the 224 PPs with respect to three dimensions: symptom, root cause, and introducing and exposing stages. In particular, they started with the classification schema, used for labeling, from the existing general DL bug studies (Zhang et al., 2018; Islam et al., 2019; Humbatova et al., 2020; Islam et al., 2020) and adapted it by appending new ones and excluding non-applicable ones. They separately read all post contents, including the title, question description, comments, answers, and reference links mentioned during discussion, to carefully label PPs.
Specifically, the symptom of a PP was determined if the questioner explicitly reported the symptom in the post. Otherwise, it was conservatively labeled as “Unknown”. The root cause of a PP was inferred from the buggy code version in the question and the fixed code version (always existed) in the valid answer. The introducing stage of a PP was determined by analyzing where its root cause was located, while the exposing stage of a PP was decided by analyzing where its symptom was exhibited. The introducing/exposing stage of a PP was labeled as “Unknown” if there was no clear indication in the post. We provide actionable code of the final taxonomies for symptoms, root causes and stages at our replication site.
The Cohen’s Kappa coefficient was 0.906, 0.772, 0.847 and 0.928 for the labeling of symptom, root cause, introducing stage and exposing stage. A third author was involved to resolve disagreements. It is worth mentioning that the manual effort, involved in our data collection and labeling procedure, required six person-months.
2.4. Benchmark Construction
To answer RQ4, we constructed a benchmark by reproducing PPs. We reproduced PPs on a machine with a 16-core Intel i7-7820X CPU (3.60GHz), NVIDIA TITAN Xp GPU, 128GB RAM and 1TB SSD. Different PPs require different TensorFlow versions which further require different CUDA Toolkit versions to support GPU. It is tricky to install different CUDA versions in the same physical machine. Thus, we used TensorFlow Docker images. Only NVIDIA GPU Driver was installed in the physical machine, and each docker container had its own CUDA Toolkit version. Finally, TensorFlow Docker images ranging from version 1.12 to 1.15 and version 2.0 to 2.5 with GPU support were covered to build our PP benchmark.
We decided to sample some PPs from the 224 PPs instead of trying to reproduce all 224 PPs due to the large effort in reproducing PPs from StackOverflow posts. To have a good coverage of symptoms and root causes, we sampled 50% PPs from each set of PPs that were caused by each inner category of root causes (see Sec. 3.2) while exhibiting each high-level category of symptoms (see Sec. 3.1). For each sampled PP, we reproduced it with the following three steps.
Step 1: Decide TensorFlow Version. If the TensorFlow version was shown in the post, we used it. If not, we checked whether APIs specific to TensorFlow 1.x (e.g., tf.Session) or TensorFlow 2.x (e.g., @tf.function) existed in the post. If yes, we used the latest TensorFlow version of 1.x (i.e., 1.15) or 2.x (i.e., 2.5). If not, we used TensorFlow 2.5.
Step 2: Complete Code Snippets. As developers tend to only include code fragments that are directly related to questions, code snippets in the post are often incomplete. Specifically, if the buggy (or fixed) version was executable, we completed the fixed (or buggy) version based on it. Otherwise, we wrote missing code fragments for buggy and fixed versions based on question description and answer.
Step 3: Reproduce Symptoms. We executed the buggy and fixed version to reproduce symptoms reported in the post. We may change input data size, model parameters, etc. to reproduce described symptoms as our hardware environment might be different from the post. For PPs with out of memory errors, we set the maximum GPU memory limit with tf.GPUOptions such that the out of memory errors could be reproduced even on GPUs with a larger memory.
We successfully reproduced 58 PPs from 112 sampled PPs with four person-months effort. The main reasons for failed reproduction are: i) developers provide very incomplete code snippets in the posts, making it difficult for us to complete the buggy or fixed version, and ii) some PPs require specific hardware environments that are different from our machine. To foster future research on PPs in DL systems, we recorded for each PP in our benchmark its environment configuration, input data, buggy version, fixed version, performance change after fixing, and reproduction steps.
3. Empirical Study Results
We present the results of the four research questions.
3.1. Symptom Analysis (RQ1)
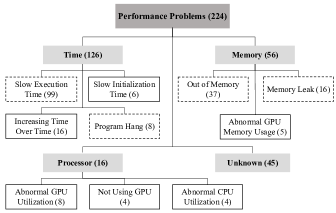
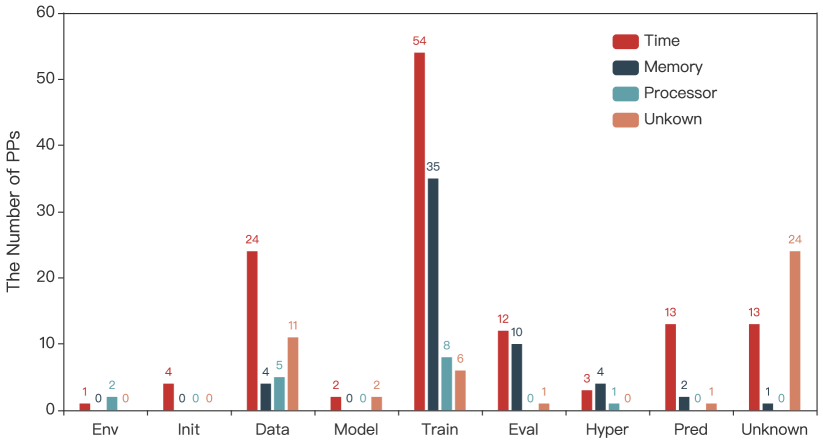
The taxonomy of PP symptoms is shown in Fig. 1. It is organized into three high-level categories (i.e., Time, Memory and Processor) and 10 inner categories, which are exhibited by 179 (79.9%) of the 224 PPs. The remaining 45 (20.1%) PPs belong to the Unknown category (defined in Sec. 2.3). Notice that one PP can exhibit multiple symptoms.
Time. This category covers PPs exhibiting high time cost, which accounts for the largest portion of PPs, i.e., 126 (56.3%). In particular, 99 (44.2%) of the PPs manifest Slow Execution Time during the execution of DL systems, including data preparation, model building, training, evaluation, hyper parameter tuning, or prediction. Further, 16 (7.1%) of the PPs exhibit Increasing Time Over Time; e.g., the prediction time became longer and longer as the model ran333https://stackoverflow.com/questions/60267911/. Moreover, 6 (2.7%) of the PPs manifest Slow Initialization Time when DL systems are initialized before execution; e.g., it spent more than 80 seconds to import TensorFlow444https://stackoverflow.com/questions/49053434/. DL systems can still work but slowly when exhibiting the above symptoms. Differently, 8 (3.6%) of the PPs result in Program Hang that makes DL systems cease to respond to inputs, which is the most severe symptom.
Memory. This category includes PPs consuming RAM/GPU memory abnormally, accounting for 56 (25.0%) of the PPs. Specifically, Out of Memory is the most common as well as the most severe symptom, covering 37 (16.5%) of the PPs. Memory Leak, manifested in 16 (7.1%) of the PPs, occurs when the memory usage keeps increasing, and may finally lead to out of memory errors. Moreover, Abnormal GPU Memory Usage, i.e., either unexpectedly high or low GPU memory usage, is exhibited in 5 (2.2%) of the PPs.
Processor. This category consists of PPs with abnormal CPU/GPU utilization, which accounts for 16 (7.1%) of the PPs. In particular, Abnormal GPU Utilization, i.e., either unexpectedly high or low GPU utilization, is manifested in 8 (3.6%) of the PPs. For example, the GPU utilization was only around 15%, while the training time was slow (each epoch took 40 to 50 seconds)555https://stackoverflow.com/questions/56795642/. Moreover, DL systems may Not Use GPU, leading to no speedup than when running on CPU, which occurs in 4 (1.8%) of the PPs. In addition, Abnormal CPU Utilization is also exhibited in 4 (1.8%) of the PPs.
Summary. More than half of the PPs slow down DL systems, and nearly one-third of the PPs consume either extremely low or high resources like memory and processor. Such severe consequences of PPs motivate the significance of PPs. Moreover, only four of the ten symptoms, as highlighted in dotted rectangles in Fig. 1, are shared with the existing symptom taxonomies for general DL bugs (Zhang et al., 2018; Islam et al., 2019). In other words, symptoms of PPs are quite different from those of general DL bugs, and the existing studies on general DL bugs only capture a partial set of PPs, and thus PPs deserve a comprehensive investigation.
3.2. Root Cause Analysis (RQ2)
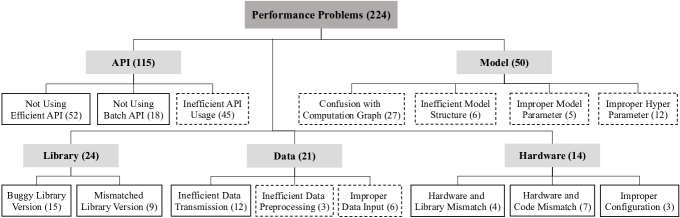
The taxonomy of PP root causes is reported in Fig. 2. It is grouped into five high-level categories (i.e., API, Model, Library, Data and Environment) and 15 inner categories.
API. This category covers PPs caused by library API misuses. This is the most common category and accounts for 115 (51.3%) of the PPs. Specifically, TensorFlow and Keras provide efficient APIs for achieving high performance, e.g., the tf.data API for building efficient input pipelines, and various operation APIs for efficient computation. However, developers often write their own implementation which is often less efficient, but do Not Use the corresponding Efficient API directly, potentially due to the unfamiliarity with APIs. This causes 52 (23.2%) of the PPs. For example, a developer wrote a for loop to perform concatenation on a set of images, which could be efficiently achieved by the map API from tf.data.Dataset666https://stackoverflow.com/questions/63002205/. Moreover, TensorFlow and Keras provide various batch processing APIs for high performance, e.g., data loading, training, evaluation or prediction in a batch mode. However, developers might Not Use a Batch API, and some even implement batch processing by themselves, which causes 18 (8.0%) of the PPs. For example, a developer loaded a large data set into GPU memory all at once, causing an out of memory error777https://stackoverflow.com/questions/59456128/. The flow_from_directory API in Keras can solve this PP by dynamically loading a batch of data from the specified directory. Notice that Not Using Batch API is a sub-category of Not Using Efficient API, and we treat it separately due to its high frequency. In the previous two root causes, developers are mostly unaware of the efficient or batch APIs. However, even when developers are aware of some APIs, they might not fully understand their performance characteristics, and write Inefficient API Usage, which causes 45 (20.1%) of the PPs. Fig. LABEL:fig:example-1 shows an example of inefficient API usage, where a developer called the map API before the batch API, and did not pass the num_parallel_calls argument to map888https://stackoverflow.com/questions/53424152/, leading to a long training time. To speed up, map should be called after batch to reduce the number of times the mapped function _batch_parser is called, and num_parallel_calls should be passed to enable parallelism.
Model. This category consists of PPs that are related to DL models, which is the second most common category, accounting for 50 (22.3%) of the PPs. In particular, developers may have Confusion with Computation Graph because of the unfamiliarity with the programming model in TensorFlow and Keras, which causes 27 (12.1%) of the PPs. A typical confusion is with the programming model of TensorFlow 1.x, which is to first build a dataflow computation graph and then run it repeatedly with inputs being fed to and outputs being fetched from the graph. Developers often mix the graph construction into the graph execution. As a result, nodes are repeatedly added to the graph, and the graph execution becomes slower and slower. An example999https://stackoverflow.com/questions/53137115/ is shown in Fig. LABEL:fig:example-2, where Line 14–16 builds the graph and should be moved out of the execution loop to Line 6–8. Another common confusion is with the usage of session, which owns resources like queues and variables. However, developers repeatedly create a session in the graph execution loop without reusing, or forget to close the session. The example in Fig. LABEL:fig:example-2 also forgets to close the session, and the fix is to use the session as a context manger at Line 11 that will automatically close the session. A typical confusion in TensorFlow 2.x is with the @tf.function decorator, which accelerates the decorated function by running it in graph mode instead of in eager mode. However, developers often do not know where to add the decorator and how to design the decorated function to get real speedup. Further, developers design an Inefficient Model Structure (e.g., missing convolution and pooling layers before the flatten layer to have too many weights) or set Improper Model Parameter (e.g., a large kernel size in a convolution layer to cause a long training time). These two categories respectively cause 6 (2.7%) and 5 (2.2%) of the PPs. Moreover, developers also set Improper Hyper Parameter, e.g., a large batch size to cause an out of memory error or a small batch size to cause a long training time. This category causes 12 (5.4%) of the PPs.
Library. This category refers to PPs caused by problems of DL libraries, accounting for 24 (10.7%) of the PPs. Specifically, 15 (6.7%) of the PPs are caused by Buggy Library Version; i.e., DL systems themselves are correctly written, but trigger the PPs in DL libraries. For example, repeated calls to model.predict (e.g., in a loop) resulted in a memory leak101010https://stackoverflow.com/questions/60267911/, due to a memory leak persisting across multiple versions of TensorFlow111111https://github.com/tensorflow/tensorflow/issues/34579/. These 15 PPs trigger the PPs in 12 distinctive APIs. It is non-trivial to detect such PPs as we do not have a full list of APIs with PPs in each DL library version. Moreover, Mismatched Library Version causes 9 (4.0%) of the PPs, as version restrictions have to be satisfied for full GPU usage. For example, TensorFlow 1.x is not fully supported on CUDA 11.1, resulting in a long time to start the training121212https://stackoverflow.com/questions/64462347/.
Data. This category covers PPs related to data processing, accounting for 21 (9.4%) of the PPs. Specifically, developers may write Inefficient Data Transmission, e.g., loading input data over the network during training but not directly copying them to the local storage, or storing weight data in CPU which causes the weights copied to GPU and the gradients copied back to CPU in each training iteration. This category accounts for 12 (5.4%) of the PPs. Further, developers may implement Inefficient Data Preprocessing (e.g., lack of image normalization before changing an image to a tensor), which causes 3 (1.3%) of the PPs. Moreover, Improper Input Data (e.g., improper data format or size that consumes excessive resources) causes 6 (2.7%) of the PPs. For example, images with unnecessarily high resolution were loaded, causing an out of memory error131313https://stackoverflow.com/questions/50742757/.
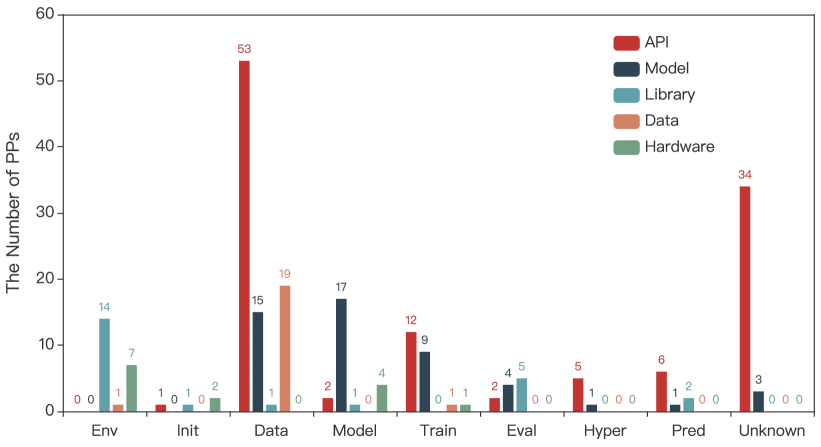
Hardware. This category covers PPs related to hardware issues, accounting for 14 (6.3%) of the PPs. Specifically, hardware may only support part of the DL library versions, and hence Hardware and Library Mismatch causes 4 (1.8%) of the PPs. For example, a GPU with compute capability 6.1 is not supported in TensorFlow 2.3 which requires a GPU with compute capability 7.0141414https://stackoverflow.com/questions/63602858/. Further, to utilize the full acceleration capability of TPU, DL systems often need specific code design. Thus, Hardware and Code Mismatch causes 7 (3.1%) of the PPs. For example, to use Colab TPU, a DL model need to be explicitly converted to a TPU compatible version; if not, the training becomes extremely slow151515https://stackoverflow.com/questions/58670563/. Moreover, hardware need proper configuration to achieve full utilization, especially for distributed training. Thus, Improper Configuration causes 3 (1.3%) of the PPs. For example, the tf.distribute.Strategy API should be used to properly configure and allocate multiple GPUs161616https://stackoverflow.com/questions/59074659/.
Summary. About half of the PPs are introduced by API misuses. Model, data and hardware, i.e., the enabling characteristics of DL systems, introduce more than one-third of the PPs. DL libraries also introduce one-tenth of the PPs. These diverse sources of root causes increase the complexity of PP localization. Moreover, only seven of the 15 root causes, as shown in dotted rectangles in Fig. 2, are the same to the previous root cause taxonomies for general DL bugs (Zhang et al., 2018; Islam et al., 2019; Humbatova et al., 2020). These differences owe to the fact that our study is focused on the performance of DL systems, while the previous studies are mainly concentrated on the functionality of DL systems.
3.3. Stage Analysis (RQ3)
Islam et al. (Islam et al., 2019) classify the pipeline of DL systems into six stages, i.e., Data Preparation, Model Building, Training, Evaluation, Hyper Para-meter Tuning and Prediction, in their study on general DL bugs. We consider them as the execution stages of DL systems, and add two new stages, found in our data labeling, before them. The first newly added stage is Environment Setting, where DL environment like libraries and hardware are installed and configured. The second one is Initialization, where the DL system is initialized (e.g., importing libraries and initializing parameters) before starting the execution stages.
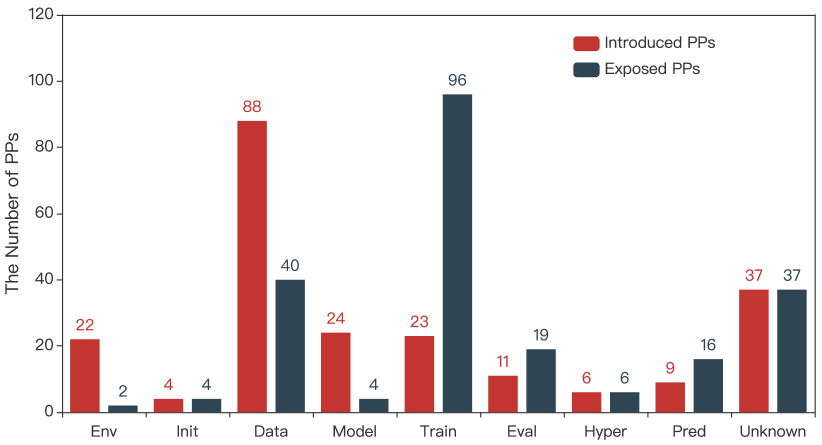
Fig. 5(a) reports the number of PPs introduced and exposed in each stage, where the stage name on the -axis is simplified to the initial letters. Data preparation is the most bug-prone stage, which is blamed in 88 (39.3%) of the PPs. Environment setting, model building and training are the second most bug-prone stages, respectively causing about 10% of the PPs. Hence, developers should pay more attention to these stages to avoid the introduction of PPs, while automated PP localization approaches should be specifically developed for these stages. The other stages are less bug-prone, respectively introducing at most 5% of the PPs. On the other hand, training and data preparation are the two most bug-affecting stages, where 96 (42.9%) and 40 (17.9%) of the PPs are respectively exposed. Thus, developers should focus more efforts on these two stages to optimize their performance, while automated PP detection approaches should be specifically developed for these two stages. Around 7% of the PPs are respectively exposed until the evaluation and prediction stages. The other stages are less bug-affecting, respectively exposing at most 3% of the PPs.
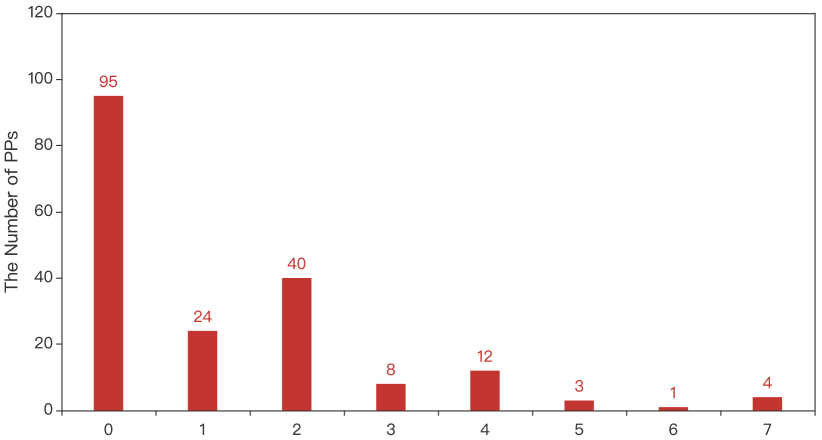
Further, data preparation introduces more PPs than exposed. This difference is more severe in the other two earlier pipeline stages, i.e., environment setting and model building. About 62% of the PPs are introduced in the earlier four pipeline stages, about 61% of which are exposed in the later four pipeline stages. The other way around, training exposes more PPs than introduced. This difference holds in the other two later pipeline stages, i.e., evaluation and prediction. Nearly 61% of the PPs are exposed in the later four pipeline stages. Thus, PPs should be proactively detected and localized before severe consequences occur so as to reduce time cost and resource consumption. Besides, for each PP, we measure the distance between its exposing stage and introducing stage, which is used as an indicator of the difficulty of PP localization. Intuitively, the larger the distance, the more difficult to localize a PP from its symptom to root cause. As shown in Fig. 5(b), 95 (42.4%) of the PPs are exposed and introduced in the same stage, while 92 (41.1%) of the PPs cannot be exposed in the introducing stage. Specifically, 68 (30.4%) of the PPs are exposed two stages later. Extremely, 4 (1.8%) of the PPs are exposed seven stages later; i.e., they are introduced in the first stage but exposed in the last stage. Hence, PP localization is challenging for a considerable amount of PPs.
Moreover, we investigate the symptom distribution of the PPs exposed in each stage, which is shown in Fig. 6(a). This distribution helps pinpoint the potentially useful performance indicators for detecting PPs exposed in different stages. For example, time-related indicators can be valuable to detect PPs exposed in initialization, data preparation and prediction, because the most common symptom of the PPs exposed in these stages is under the category of Time. Similarly, we report the root cause distribution of the PPs introduced in each stage in Fig. 6(b). This distribution helps hint the potential technical solutions to localize PPs introduced in different stages. For example, the most frequent root cause of the PPs introduced in most stages is under the category of API, and hence API misuse detection could be developed to localize PPs introduced in these stages.
Summary. The most bug-prone stages are data preparation, envi-ronment setting, model building and training, which introduce nearly 70% of the PPs. The most bug-affecting stages are training and data preparation, which expose around 60% of the PPs. Nearly 40% of the PPs cannot be exposed in the introducing stage. Moreover, we introduce two new stages that are not covered in the previous stage analysis for general DL bugs (Islam et al., 2019), and investigate the introducing and exposing stages that are not distinguished in the previous study (Islam et al., 2019).
| Root Cause | Symptom | Total | Profiler | XLA | Doc. | |||||
| Time | Memory | Processor | Unknown | App. | Par. | App. | Par. | App. | ||
| API | 18 (54) | 4 (23) | 0 (10) | 10 (38) | 32 (115) | 6 | 1 | 17 | 3 | 9 |
| Not Using Efficient API | 8 (19) | 0 (1) | 0 (5) | 10 (31) | 17 (52) | 1 | 1 | 14 | 3 | 2 |
| Not Using Batch API | 1 (6) | 2 (9) | 0 (1) | 0 (2) | 3 (18) | 2 | 0 | 0 | 0 | 0 |
| Inefficient API Usage | 9 (29) | 2 (13) | 0 (4) | 0 (5) | 7 (45) | 3 | 0 | 3 | 0 | 7 |
| Model | 10 (30) | 7 (19) | 0 (0) | 2 (5) | 17 (50) | 8 | 1 | 7 | 1 | 2 |
| Confusion with Computation Graph | 7 (22) | 2 (4) | 0 (0) | 1 (3) | 9 (27) | 2 | 0 | 6 | 1 | 0 |
| Inefficient Model Structure | 0 (2) | 1 (2) | 0 (0) | 1 (2) | 2 (6) | 1 | 0 | 1 | 0 | 0 |
| Improper Model Parameter | 2 (2) | 3 (4) | 0 (0) | 0 (0) | 4 (5) | 4 | 1 | 0 | 0 | 0 |
| Improper Hyper Parameter | 1 (4) | 1 (9) | 0 (0) | 0 (0) | 2 (12) | 1 | 0 | 0 | 0 | 2 |
| Library | 4 (15) | 4 (9) | 0 (3) | 0 (1) | 6 (24) | 0 | 0 | 0 | 0 | 0 |
| Buggy Library Version | 4 (8) | 4 (8) | 0 (0) | 0 (1) | 6 (15) | 0 | 0 | 0 | 0 | 0 |
| Mismatched Library Version | 0 (7) | 0 (1) | 0 (3) | 0 (0) | 0 (9) | – | – | – | – | – |
| Data | 2 (14) | 0 (4) | 1 (3) | 1 (1) | 3 (21) | 1 | 0 | 0 | 0 | 1 |
| Inefficient Data Transmission | 1 (10) | 0 (1) | 1 (2) | 0 (0) | 1 (12) | 0 | 0 | 0 | 0 | 1 |
| Inefficient Data Preprocessing | 0 (1) | 0 (1) | 0 (0) | 1 (1) | 1 (3) | 1 | 0 | 0 | 0 | 0 |
| Improper Data Input | 1 (3) | 0 (2) | 0 (1) | 0 (0) | 1 (6) | 0 | 0 | 0 | 0 | 0 |
| Hardware | 0 (13) | 0 (1) | 0 (0) | 0 (0) | 0 (14) | – | – | – | – | – |
| Total | 34 (126) | 15 (56) | 1 (16) | 13 (45) | 58 (224) | 15 | 2 | 24 | 4 | 12 |
3.4. Approach Assessment (RQ4)
To the best of our knowledge, there is no PP detection and localization approach for DL systems. Notice that performance analysis approaches in (Qi et al., 2016; Gao et al., 2020) can estimate performance metrics (i.e., time and GPU memory), but cannot directly pinpoint PPs. Based on their estimation, either automated approaches need to be further designed or developer experience need to be relied on to identify PPs. Therefore, we do not use them. Thus, we select and assess the following three typical performance analysis approaches, which can be used by developers to improve the performance of DL systems.
-
•
TensorFlow Profiler171717https://tensorflow.org/guide/profiler: It is built on top of NVIDIA CUDA Profiling Interface to track the performance of TensorFlow models. It visualizes the time cost and resource consumption of various TensorFlow operations in the model, finds performance bottlenecks, and recommends best practices to improve performance. Differently, general python profiling tools (e.g., cProfile and memory_profiler) can only measure performance metrics, but cannot directly pinpoint PPs. Therefore, we do not use them.
-
•
XLA (Accelerated Linear Algebra)181818https://tensorflow.org/xla: It is a domain-specific compiler that can accelerate TensorFlow models. Each TensorFlow operation is executed by a precompiled GPU kernel implementation. XLA can compile the TensorFlow graph into a sequence of computation kernels generated specifically for the given model, and fuse the kernels to avoid memory operations between the execution of different kernels to improve the performance (Li et al., 2021).
-
•
TensorFlow Documentation: It includes all TensorFlow API documentation191919https://www.tensorflow.org/versions/r2.5/api_docs and performance guide202020https://www.tensorflow.org/guide where developers can find hints about performance problems and optimization solutions.
Generally, we assess each technique in two dimensions: i) whether a technique is applicable to a PP (or whether a PP is in the capability scope of a technique), and ii) whether a technique can solve a PP. The assessment results on our benchmark (see Sec. 2.4) are shown in the last five columns in Table 1. The first six columns of Table 1 show the number of reproduced PPs across root causes and symptoms, where the number in parentheses is the total number of PPs. They cover all root causes except for Mismatched Library Version and the three hardware relevant root causes. They cover all high-level symptoms, but achieve a relatively low coverage of processor relevant symptoms.
As shown in the seventh column of Table 1, TensorFlow Profiler is only applicable to 15 (25.9%) PPs, but is not applicable to the others for two reasons. First, TensorFlow Profiler requires a TensorFlow version of at least 1.14. However, some PPs are reproduced with a lower version. Second, TensorFlow Profiler requires a full training or evaluation process to track the performance, which is not always available for the PPs in our benchmark. Moreover, of these 15 PPs, TensorFlow Profiler fails to finish profiling because of out of memory errors for 9 PPs, and does not raise any warning or raises a false warning for 4 PPs. Hence, we consider these 13 PPs as not solved by TensorFlow Profiler. For the remaining 2 PPs, TensorFlow Profiler either raises a warning but suggests a fix that achieves a smaller performance improvement than our fixed version in the benchmark, or helps detect the PP by reporting the most time-consuming operation but fails to raise a warning and suggest a fix. Thus, we consider these 2 PPs as partially solved by TensorFlow Profiler, as reported in the eighth column of Table 1. These results demonstrate that TensorFlow Profiler has limited capability in tackling PPs.
As presented in the ninth column of Table 1, XLA is applicable to 24 (41.4%) PPs. There are two reasons that XLA is not applicable to the others. First, XLA uses just-in-time (JIT) compilation. However, compilation errors might occur for some PPs in our benchmark. Second, XLA is designed for optimizing the performance of TensorFlow models. Thus, it is not applicable to PPs whose root causes are not related to TensorFlow operations or computation graphs. Furthermore, of these 24 PPs, XLA only improves the performance for 4 PPs but still achieves a smaller performance improvement than our fixed version in the benchmark. This is reasonable because XLA is actually not aware of the PPs, but optimizes performance by fusing nodes in computation graphs, while our fixed version reduces the number of nodes in computation graphs. Hence, we consider these 4 PPs as partially solved by XLA, as reported in the tenth column of Table 1. For the other 20 PPs, XLA does not have any performance improvement because of the small number of nodes in computation graphs. Thus, we consider these 20 PPs as not solved by XLA. These results indicate that PPs in DL systems often cannot be eliminated by the compilation optimization techniques in XLA.
As shown in the last column of Table 1, TensorFlow documentation is only applicable to 12 (20.7%) PPs. We consider TensorFlow documentation as applicable as long as the documentation mentions the optimization solution of a PP. There are two main reasons that TensorFlow documentation is applicable to a small portion of PPs. The first is that performance characteristics, especially non-time characteristics, are hardly described in API documentation. The second is that many PPs are caused by inefficient usages of multiple APIs, but API documentation is often focused on individual API usages. Although performance guide covers usages of multiple APIs, they only cover limited APIs such as tf.data. We consider these 12 PPs as solved by TensorFlow documentation. These results show that TensorFlow documentation provides limited support for PPs.
Summary. Efforts like profiling, compilation optimization and documentation have been devoted to optimizing the performance of DL systems from different perspectives. However, they provide limited capability in tackling PPs, potentially due to the lack of a comprehensive understanding of PPs in DL systems.
4. Implication, Application and Threat
We discuss the implications for developers and researchers, demonstrate one application to PP detection, and discuss the threats.
4.1. Implications
Developers. Our study reveals the common symptoms of PPs that developers could pay attention to when testing and running their DL systems for detecting potential PPs. Our study also identifies the common root causes of PPs that can be useful for developers to diagnose, debug or fix PPs. Our study also captures the most bug-prone or bug-affecting stages where developers could focus more efforts on to provide the most benefit for PP introduction avoidance or performance optimization. Furthermore, our findings provide some development suggestions. Developers should carefully read the release note and API documentation of DL libraries to get familiar with the rich set of library APIs and their performance characteristics. In this way, PPs caused by the most common root cause (i.e., API misuses) might be reduced. Developers should also be systematically trained to have a comprehensive understanding of computation graph to build efficient DL models. In this way, PPs caused by the second most common root cause (i.e., model construction) might be reduced.
Researchers. Our findings provide several implications on future research in three directions. First, intelligent techniques for high-performance DL system development are needed. As developers are often unaware of library APIs that are specifically designed for high performance or unaware of the performance characteristics of library APIs, DL library API recommendation methods should be developed. To realize performance-aware API recommendation, a knowledge graph of DL library APIs should be constructed based on release note, API documentation and StackOverflow discussions with a specific focus on modeling performance characteristics of APIs and performance differences across library versions. To locate and replace inefficient code snippets written from scratch by developers, semantic analysis techniques should be developed to determine their semantic similarity to existing library APIs. Apart from such intelligent techniques at the code level, recommendation techniques should be developed to automatically suggest DL library versions, efficient DL models and their parameters, and environment configurations.
Second, PP detection techniques are needed. Half of the symptoms (i.e., Increasing Time Over Time, Program Hang, Out of Memory, Memory Leak, and Not Using GPU) can be regarded as a credible oracle for detecting PPs in DL systems. Therefore, proactive monitoring and prediction techniques should be developed to detect PPs as early as possible before these severe symptoms occur. DL systems exhibiting the other symptoms are not guaranteed to contain PPs as it is often not clear how much time or resources a DL system should consume to run without a PP. To solve this performance oracle problem, one potential way is to design differential testing techniques to compare the performance of DL systems running with different DL libraries, different DL models, or different hardware configurations. However, it may incur too much overhead. Hence, another potential way is to design static techniques to model and estimate time cost or resource consumption of DL systems so that performance bottlenecks can be identified in advance before execution. During our manual analysis, we find that TensorFlow has some built-in mechanism in detecting PPs and recommending fixes by throwing a warning message, e.g., “WARNING: tensorflow: multiprocessing can interact badly with TensorFlow, causing nondeterministic deadlocks. For high performance data pipelines tf.data is recommended”. However, such warning messages are only raised in 3 of the PPs, indicating the preliminary support in PP detection due to symptom and root cause diversity. Hence, built-in mechanisms in DL libraries should be further enhanced to detect PPs and recommend fixes.
Third, PP localization techniques are needed. Our study reveals that the exposing stage of a PP is usually not the introducing stage. For example, the location that throws the error message of an out of memory error is usually not the location of the root cause. Therefore, it is often challenging to localize PPs. During our manual analysis, we find that developers often use logs as the clue to locate PPs. Hence, automated log analysis techniques should be developed to smartly insert log statements into DL systems and locate potential PPs using log traces. Further, as API misuse is the most common root cause of PPs, mining techniques should be designed to learn frequent API usage sequences and localize potential violations in DL systems. API usage mining has been widely explored in traditional systems (Robillard et al., 2012), but it is interesting to investigate how they are applicable to PPs in DL systems. From our experience, there are three challenges to detect API-related PPs. First, due to the lack of effective type inference tool in Python, it is hard to precisely extract API usages from Python code. Second, as traditional API usage mining is not aware of performance characteristics of APIs, it is non-trivial to automatically determine the performance difference among mined API sequences. Third, it is difficult to detect PPs caused by Not Using Efficient APIs, because the inefficient APIs that developers use are totally different from efficient APIs that should be used. Last but not the least, rule-based techniques should be developed to detect and localize PPs, considering the potentially large amount of PPs on StackOverflow or GitHub. The challenge is to automatically derive but not manually specify the rules.
4.2. Application
To demonstrate the usefulness of our findings, we implement a rule-based static checker, named DeepPerf, to detect PPs in DL systems. DeepPerf is implemented with two static analysis tools, AST212121https://docs.python.org/3/library/ast.html and Jedi222222https://github.com/davidhalter/jedi/. It currently supports three types of PPs whose detection rules are manually derived from our empirical study (Sec. 3).
Checker 1: Repeated Node Creation. Creating the same nodes repeatedly to a computation graph is one of the common types of PPs under the root cause category of Confusion with Computation Graph. DeepPerf is designed to detect node creation APIs that are called in loops with the same argument values; e.g., the two APIs tf.matmul and optimizer.minimize in Fig. LABEL:fig:example-2. Actually, it is similar to Loop Invariant Computation and Code Motion (LICM) optimization, which has been well studied in classic compilers (Bacon et al., 1994). However, Grappler232323https://tensorflow.org/guide/graph_optimization, the default graph optimizer in TensorFlow runtime, cannot eliminate this type of PPs although it has the loop optimizer. Notice that this type of PP has been reported in (Zhang et al., 2018). However, to the best of knowledge, its detection has not been investigated in prior studies
To implement the checker, we first extract TensorFlow APIs that may add computation graph nodes by parsing the @tf_export decorators in the source code of TensorFlow Python APIs242424https://github.com/tensorflow/tensorflow/tree/r1.15/tensorflow/python/ops. Then, we manually review these APIs to exclude APIs that actually do not add nodes (e.g., tf.assign) or APIs that produce different values given the same inputs (e.g., tf.random.uniform). Finally, we obtain 356 APIs.
Our checker determines whether these 356 APIs are called with same argument values among loop iterations. To this end, it tracks variables that are changed among loop iterations, including the loop control variable, variables that are assigned in the loop body but are defined outside the loop, and any variables that depend on them. It identifies APIs called without using changed variables as arguments as PPs. Our analysis is inter-procedural. If there are functions called in the loop, it passes changed variables to callee functions, analyzes changed variables in callee functions, and identifies APIs called without using changed variables as arguments in callee functions.
Checker 2: Inefficient Order of batch and map. As showed in Fig. LABEL:fig:example-1, calling map before batch is not efficient, and hence batch is suggested to be called before map to reduce the number of times the mapped function is called. To detect such API misuse of batch and map, our checker first identifies tf.Dataset object, and then analyzes the call sites to check whether batch is called after map.
Checker 3: Disabled Parallelism of map and interleave. As listed in Fig. LABEL:fig:example-1, calling map without setting its num_parallel_calls argument disables parallelism. It also holds for interleave. To detect such API misuse of map and interleave, our checker identifies tf.Dataset object, and analyzes the call sites to check whether map and interleave are called without setting num_parallel_calls.
| Checker | Detected | Confirmed | Fixed | ||||
| PP | Proj. | FP | PP | Proj. | PP | Proj. | |
| Checker 1 | 77 | 49 | 15 | 20 | 14 | 7 | 4 |
| Checker 2 | 195 | 68 | 0 | 52 | 18 | 0 | 0 |
| Checker 3 | 216 | 66 | 0 | 33 | 18 | 20 | 10 |
| Total | 488 | 130 | 15 | 105 | 44 | 27 | 13 |
Evaluation on Our Benchmark. In our PP benchmark, four, two and two PPs belong to the PP types targeted by the three checkers. Three, two and two of them were successfully detected by the three checkers. The only one false negative of Checker 1 is caused by the incomplete type inference in Jedi. As reported in Sec. 3.4, TensorFlow Profiler is not applicable to these eight PPs. XLA is applicable to four, one and one of them, but fails to solve them. TensorFlow Documentation is applicable to zero, two and two of them by only hinting the solution in API documentation or performance guide.
Evaluation on GitHub Projects. We used PyGitHub252525https://github.com/PyGithub/PyGithub to crawl 1,108 GitHub repositories that used TensorFlow and Python and had at least 100 stars, and ran DeepPerf on these repositories. We reported detected PPs as issues to developers, and also manually reviewed and verified all the detected PPs. As TensorFlow Profiler and XLA are dynamic analysis tools, it is difficult for us to properly configure and execute 1,108 GitHub repositories. TensorFlow Documentation only provides guidance but is not a tool. Thus, we did not compare our checkers with them in this large-scale evaluation. The results are shown in Table 2, where the statistics about detected, confirmed and fixed PPs are reported for each checker.
Specifically, Checker 1 detected 77 PPs in 49 projects. It detected 15 false positives (i.e., the fourth column in Table 2). The reason is that we use lightweight heuristics to decide loop invariants based on AST and Jedi, but do not use heavyweight data/control flow analysis, for the scalability of our checker. 20 PPs in 14 projects have been confirmed by developers, and 7 of them in 4 projects have been fixed. Checker 2 detected 195 PPs in 68 projects with no false positive. 52 PPs in 18 projects have been confirmed by developers, but none of them has been fixed. The reason is that the fix requires extra effort in vectorizing the mapped function (e.g., the _batch_parser function in Fig. LABEL:fig:example-1), which is non-trivial. In that sense, automated vectorization is required in TensorFlow, like auto-vectorization in LLVM262626https://www.llvm.org/docs/Vectorizers.html#slp-vectorizer. Checker 3 detected 216 PPs in 66 projects with no false positive. 33 PPs in 18 projects have been confirmed by developers, while 20 of them in 10 projects have already been fixed. The projects that have confirmed/fixed our detected PPs include popular ones like Keras, TensorFlow Agents, TensorFlow Hub and Tensorforce. Besides, we randomly sampled 5 PPs from the 7 and 20 fixed PPs for Check 1 and Checker 3 respectively, and measured the execution time of the buggy and fixed version. On average, the execution time was improved by 35.6% and 20.4% after fixing PPs, respectively.
Summary. PP is a widespread problem in DL systems, and rule-based PP detection is promising. The three checkers in DeepPerf detected 488 PPs in 130 projects with 15 false positives. 105 PPs in 44 projects have been confirmed by developers, while 27 of them in 13 projects have been fixed by developers.
4.3. Threats
We discuss the threats to our empirical study, PP benchmark, and detection approach. Our study investigates PPs in DL systems written with TensorFlow and Keras. Thus, it is not clear whether our findings can generalize to DL systems developed with other DL libraries like PyTorch. We believe it deserves a separate study to investigate differences across DL libraries. Further, our study analyzes PPs from StackOverflow posts. However, GitHub is another valuable source of PPs. It is interesting to further explore PPs from GitHub to strength our findings, which in fact requires large manual efforts as we spent six person-months to analyze 224 PPs. Our PP detection results on GitHub projects also indicate the potential applicability of our findings. Moreover, our study involves manual analysis on PPs, which may incur biases. To reduce them, two of the authors separately analyzed PPs and a third author was involved to resolve disagreements.
Our benchmark consists of 58 PPs, whose size, to be honest, is not very large. However, considering the large human efforts involved in constructing the benchmark, we believe it is acceptable. We are still continuously enlarging our benchmark via reproducing those non-sampled PPs from the 224 PPs and collecting PPs from GitHub.
Our rule-based static checker, DeepPerf, currently only supports three types of PPs. Here, DeepPerf is not designed to cover all type of PPs, but to demonstrate the potential of rule-based PP detection as well as the usefulness of our findings. We plan to manually enrich the detection rules in DeepPerf to support more PP types. In the long run, we hope to automatically learn the detection rules.
5. Related Work
We discuss the closely related work in understanding and analyzing deep learning bugs and performance problems.
5.1. Deep Learning Bugs
The recent success in applying deep learning techniques to a variety of domains has gained increasing interest in understanding characteristics of bugs in deep learning systems. Zhang et al. (Zhang et al., 2018) collected 175 bugs in deep learning systems developed in TensorFlow from StackOverflow posts and GitHub commits. They analyzed the symptoms and root causes of these bugs, and explored the challenges and strategies in bug detection and localization. Islam et al. (Islam et al., 2019) and Humbatova et al. (Humbatova et al., 2020) expanded the scope of Zhang et al.’s study to include more deep learning libraries. Islam et al. (Islam et al., 2019) analyzed types, root causes, impacts and pipeline stages of 970 bugs in deep learning systems written in Caffe, Keras, TensorFlow, Theano and Torch, while Humbatova et al. (Humbatova et al., 2020) constructed a taxonomy of bugs in deep learning systems that use TensorFlow, Keras and PyTorch based on manual analysis of 375 bugs and interviews with 20 developers. In their follow-up work, Islam et al. (Islam et al., 2020) analyzed bug fix patterns. Kim et al. (Kim et al., 2021) built a benchmark of 4,577 bugs from 193 deep learning systems. Differently, Jia et al. (Jia et al., 2020) explored the symptoms, root causes and locations of 202 bugs in the TensorFlow library.
Apart from the studies that are focused on a general scope of bugs in deep learning systems, several recent studies have targeted more specific bugs. Zhang et al. (Zhang et al., 2020c) studied failures of deep learning jobs that are running on a remote, shared platform in Microsoft. Chen et al. (Chen et al., 2021) investigated faults related to the deployment of deep learning models to mobile devices. Zhang et al. (Zhang et al., 2021b) summarized five common training problems in deep learning systems, and developed a tool to automatically detect and repair training problems. Wan et al. (Wan et al., 2021) studied API misuses when deep learning systems use cloud AI services, summarized eight misuse patterns, and developed static checkers to automatically detect some of the misuse patterns. Huang et al. (Huang et al., 2022) explored dependency bugs across the DL stack.
Some of these studies reveal some partial characteristics of performance problems in deep learning systems. For example, Zhang et al. (Zhang et al., 2018) and Islam et al. (Islam et al., 2019) respectively recognized low efficiency and hang as a symptom of deep learning bugs. Zhang et al. (Zhang et al., 2020c) identified GPU out of memory as a failure category of deep learning jobs. Chen et al. (Chen et al., 2021) recognized memory and speed issues as two types of faults in the inference stage of deployment process. Wan et al. (Wan et al., 2021) derived four performance-related API misuse patterns of cloud AI services. Despite these efforts, there still lacks a comprehensive study to understand characteristics of performance problems in deep learning systems, and thus our study aims to bridge this knowledge gap and raise the awareness of performance problems in DL systems.
Besides, some studies have explored general problems and challenges in developing and deploying deep learning systems. For example, Guo et al. (Guo et al., 2019) measured the accuracy and performance differences across four deep learning libraries. Zhang et al. (Zhang et al., 2019) identified seven kinds of frequently asked deep learning questions in StackOverflow, and analyzed their resolution difficulty and root causes. Han et al. (Han et al., 2020) explored the topics that developers discuss when developing deep learning systems. Chen et al. (Chen et al., 2020) built a taxonomy of challenges in deploying deep learning systems to different platforms through manual analysis of StackOverflow posts. Pham et al. (Pham et al., 2020) measured accuracy variance in training deep learning systems. Cummaudo et al. (Cummaudo et al., 2020) studied pain-points that developers face when using cloud services of computer vision by mining StackOverflow posts.
Although these studies are not designed for deep learning bugs, they shed light on debugging and bug detection in deep learning systems. Specifically, Guo et al. (Guo et al., 2019) reported performance differences in terms of time cost and memory consumption when trained deep learning models are migrated or quantized to different mobile devices and web browsers, and called for performance optimization and testing techniques. Zhang et al. (Zhang et al., 2019) summarized performance as a category of frequently asked deep learning questions in StackOverflow, and recognized that performance questions are the most difficult to answer. Our study is inspired by these studies to systematically characterize performance problems in deep learning systems.
Moreover, some advances have been made to detect deep learning bugs. For example, Zhang et al. (Zhang et al., 2020b) developed a static analysis approach to detect numerical bugs in neural architectures based on abstract interpretation. Lagouvardos et al. (Lagouvardos et al., 2020) proposed a static analysis to detect shape incompatibility errors in TensorFlow programs, while Verma and Su (Verma and Su, 2020) proposed a dynamic abstract interpreter to catch such errors. Wardat et al. (Wardat et al., 2021) developed a dynamic analysis approach to locate faults in deep neural networks. In addition, great efforts have been devoted to testing deep learning systems (e.g., (Pei et al., 2017; Tian et al., 2018; Ma et al., 2018; Odena et al., 2019; Xie et al., 2019; Sun et al., 2018; Kim et al., 2019)) and deep learning libraries (e.g., (Pham et al., 2019; Nejadgholi and Yang, 2019; Guo et al., 2020; Wang et al., 2020, 2021; Zhang et al., 2021a)) for quality assurance. Zhang et al. (Zhang et al., 2020a) presented a comprehensive survey of work in this direction. However, little attention has been received to detecting and testing performance problems in deep learning systems, and our study sheds light on this area.
5.2. Performance Problems
Many empirical studies have characterized performance problems from different perspectives (e.g., root causes, discovery, diagnosis, fixing and reporting) for desktop or server applications (Jin et al., 2012; Zaman et al., 2012; Nistor et al., 2013a; Song and Lu, 2014; Zhao et al., 2020), highly configurable systems (Han and Yu, 2016; He et al., 2020), mobile applications (Liu et al., 2014; Linares-Vasquez et al., 2015), database-backed web applications (Yang et al., 2018, 2019), and JavaScript systems (Selakovic and Pradel, 2016). They shed light on potential directions on performance analysis (e.g., detection, profiling and testing). Our study is the first to understand performance problems in deep learning systems, which differs from traditional systems on the programming paradigm.
Advances (e.g., (Ammons et al., 2004; Cito et al., 2019; Han et al., 2012; Curtsinger and Berger, 2015)) have been made to identify general performance problems with dynamic profiles from production runs. A large body of work has designed pattern-based methods to detect specific performance problems, e.g., reusable/cacheable data (e.g., (Bhattacharya et al., 2011; Della Toffola et al., 2015; Nguyen and Xu, 2013)), inefficient/redundant loops (e.g., (Dhok and Ramanathan, 2016; Nistor et al., 2013b; Song and Lu, 2017; Nistor et al., 2015)), and inefficient collections (e.g., (Jung et al., 2011; Shacham et al., 2009; Xu and Rountev, 2010)). Besides, a lot of techniques have been proposed for performance testing, i.e., generating test cases to trigger worst-case performance (e.g., (Burnim et al., 2009; Luckow et al., 2017; Lemieux et al., 2018; Petsios et al., 2017; Wei et al., 2018)) and find performance problems (e.g., (Grechanik et al., 2012; Shen et al., 2015; Tizpaz-Niari et al., 2020)). Another line of work is performance profiling technique to identify hot paths (e.g., (Ball and Larus, 1996; Duesterwald and Bala, 2000; Larus, 1999)) and fit a performance model to the input size (e.g., (Coppa et al., 2012; Goldsmith et al., 2007; Zaparanuks and Hauswirth, 2012)). These performance analysis approaches are designed for traditional systems, and cannot be directly applied to deep learning systems.
Recently, some performance analysis approaches have been proposed for deep learning systems. For example, Qi et al. (Qi et al., 2016) modeled and estimated time cost of training deep neural networks, while Gao et al. (Gao et al., 2020) estimated GPU memory consumption. Such estimation techniques are useful to find potential performance problems in advance. Liu et al. (Liu et al., 2019) measured the performance of training deep learning models on mobile devices, while Ma et al. (Ma et al., 2019) compared time cost of JavaScript-based deep learning libraries when running deep learning tasks in browsers. These studies empirically demonstrate the performance differences. To reduce memory usage of deep neural networks, Rhu et al. (Rhu et al., 2016) developed a dynamic memory manager to virtualize memory usage, while Wang et al. (Wang et al., 2018) proposed a dynamic GPU memory scheduler. To make deep learning models efficient, Han et al. (Han et al., 2016) used pruning and quantization to compress models, Yan et al. (Yan et al., 2015) used a performance model to estimate the time of distributed model training and find the optimal distributed configuration, and Menghani (Menghani, 2021) presented a survey in this area. These approaches are system-level performance optimization techniques, while DeepPerf is at the source code level. Despite these efforts, the characteristics of performance problems in deep learning systems are still unclear, and our study fills this gap.
6. Conclusions
We present the first comprehensive study to characterize PPs in DL systems written in TensorFLow and Keras, and build the first benchmark of PPs in DL systems to assess existing approaches in tackling them. Further, we develop a static checker DeepPerf to detect three types of PPs, and detect many new PPs in GitHub projects.
7. Data-Availablity Statement
All the study data and source code of DeepPerf are available at (Junming Cao, 2022) to foster future research.
Acknowledgements.
This work was supported by the National Key R&D Program of China (2021ZD0112903).References
- (1)
- Amershi et al. (2019) Saleema Amershi, Andrew Begel, Christian Bird, Robert DeLine, Harald Gall, Ece Kamar, Nachiappan Nagappan, Besmira Nushi, and Thomas Zimmermann. 2019. Software engineering for machine learning: A case study. In Proceedings of the IEEE/ACM 41st International Conference on Software Engineering: Software Engineering in Practice. 291–300.
- Ammons et al. (2004) Glenn Ammons, Jong-Deok Choi, Manish Gupta, and Nikhil Swamy. 2004. Finding and removing performance bottlenecks in large systems. In Proceedings of the European Conference on Object-Oriented Programming. 172–196.
- Bacon et al. (1994) David F. Bacon, Susan L. Graham, and Oliver J. Sharp. 1994. Compiler Transformations for High-Performance Computing. ACM Comput. Surv. 26, 4 (1994), 345–420.
- Ball and Larus (1996) Thomas Ball and James R Larus. 1996. Efficient path profiling. In Proceedings of the 29th Annual IEEE/ACM International Symposium on Microarchitecture. 46–57.
- Bhattacharya et al. (2011) Suparna Bhattacharya, Mangala Gowri Nanda, Kanchi Gopinath, and Manish Gupta. 2011. Reuse, recycle to de-bloat software. In Proceedings of the European Conference on Object-Oriented Programming. 408–432.
- Burnim et al. (2009) Jacob Burnim, Sudeep Juvekar, and Koushik Sen. 2009. WISE: Automated test generation for worst-case complexity. In Proceedings of the IEEE 31st International Conference on Software Engineering. 463–473.
- Chen et al. (2020) Zhenpeng Chen, Yanbin Cao, Yuanqiang Liu, Haoyu Wang, Tao Xie, and Xuanzhe Liu. 2020. A comprehensive study on challenges in deploying deep learning based software. In Proceedings of the 28th ACM Joint Meeting on European Software Engineering Conference and Symposium on the Foundations of Software Engineering. 750–762.
- Chen et al. (2021) Zhenpeng Chen, Huihan Yao, Yiling Lou, Yanbin Cao, Yuanqiang Liu, Haoyu Wang, and Xuanzhe Liu. 2021. An empirical study on deployment faults of deep learning based mobile applications. In Proceedings of the IEEE/ACM 43rd International Conference on Software Engineering. 674–685.
- Cito et al. (2019) Jürgen Cito, Philipp Leitner, Martin Rinard, and Harald C Gall. 2019. Interactive production performance feedback in the IDE. In Proceedings of the IEEE/ACM 41st International Conference on Software Engineering. 971–981.
- Coppa et al. (2012) Emilio Coppa, Camil Demetrescu, and Irene Finocchi. 2012. Input-Sensitive Profiling. In Proceedings of the 33rd ACM SIGPLAN Conference on Programming Language Design and Implementation. 89–98.
- Cummaudo et al. (2020) Alex Cummaudo, Rajesh Vasa, Scott Barnett, John Grundy, and Mohamed Abdelrazek. 2020. Interpreting Cloud Computer Vision Pain-Points: A Mining Study of Stack Overflow. In Proceedings of the ACM/IEEE 42nd International Conference on Software Engineering. 1584–1596.
- Curtsinger and Berger (2015) Charlie Curtsinger and Emery D Berger. 2015. Coz: Finding code that counts with causal profiling. In Proceedings of the 25th Symposium on Operating Systems Principles. 184–197.
- Della Toffola et al. (2015) Luca Della Toffola, Michael Pradel, and Thomas R. Gross. 2015. Performance Problems You Can Fix: A Dynamic Analysis of Memoization Opportunities. In Proceedings of the ACM SIGPLAN International Conference on Object-Oriented Programming, Systems, Languages, and Applications. 607–622.
- Dhok and Ramanathan (2016) Monika Dhok and Murali Krishna Ramanathan. 2016. Directed test generation to detect loop inefficiencies. In Proceedings of the 24th ACM SIGSOFT International Symposium on Foundations of Software Engineering. 895–907.
- Duesterwald and Bala (2000) Evelyn Duesterwald and Vasanth Bala. 2000. Software Profiling for Hot Path Prediction: Less is More. In Proceedings of the Ninth International Conference on Architectural Support for Programming Languages and Operating Systems. 202–211.
- Gao et al. (2020) Yanjie Gao, Yu Liu, Hongyu Zhang, Zhengxian Li, Yonghao Zhu, Haoxiang Lin, and Mao Yang. 2020. Estimating gpu memory consumption of deep learning models. In Proceedings of the 28th ACM Joint Meeting on European Software Engineering Conference and Symposium on the Foundations of Software Engineering. 1342–1352.
- Goldsmith et al. (2007) Simon F Goldsmith, Alex S Aiken, and Daniel S Wilkerson. 2007. Measuring empirical computational complexity. In Proceedings of the the 6th joint meeting of the European software engineering conference and the ACM SIGSOFT symposium on The foundations of software engineering. 395–404.
- Grechanik et al. (2012) Mark Grechanik, Chen Fu, and Qing Xie. 2012. Automatically finding performance problems with feedback-directed learning software testing. In Proceedings of the 34th International Conference on Software Engineering. 156–166.
- Guo et al. (2019) Qianyu Guo, Sen Chen, Xiaofei Xie, Lei Ma, Qiang Hu, Hongtao Liu, Yang Liu, Jianjun Zhao, and Xiaohong Li. 2019. An empirical study towards characterizing deep learning development and deployment across different frameworks and platforms. In Proceedings of the 34th IEEE/ACM International Conference on Automated Software Engineering. 810–822.
- Guo et al. (2020) Qianyu Guo, Xiaofei Xie, Yi Li, Xiaoyu Zhang, Yang Liu, Xiaohong Li, and Chao Shen. 2020. Audee: Automated testing for deep learning frameworks. In Proceedings of the 35th IEEE/ACM International Conference on Automated Software Engineering. 486–498.
- Han et al. (2020) Junxiao Han, Emad Shihab, Zhiyuan Wan, Shuiguang Deng, and Xin Xia. 2020. What do programmers discuss about deep learning frameworks. Empirical Software Engineering 25, 4 (2020), 2694–2747.
- Han et al. (2012) Shi Han, Yingnong Dang, Song Ge, Dongmei Zhang, and Tao Xie. 2012. Performance debugging in the large via mining millions of stack traces. In Proceedings of the 34th International Conference on Software Engineering. 145–155.
- Han et al. (2016) Song Han, Huizi Mao, and William J. Dally. 2016. Deep Compression: Compressing Deep Neural Network with Pruning, Trained Quantization and Huffman Coding. In Proceedings of the 4th International Conference on Learning Representations.
- Han and Yu (2016) Xue Han and Tingting Yu. 2016. An empirical study on performance bugs for highly configurable software systems. In Proceedings of the 10th ACM/IEEE International Symposium on Empirical Software Engineering and Measurement. 1–10.
- He et al. (2020) Haochen He, Zhouyang Jia, Shanshan Li, Erci Xu, Tingting Yu, Yue Yu, Ji Wang, and Xiangke Liao. 2020. CP-detector: using configuration-related performance properties to expose performance bugs. In Proceedings of 35th IEEE/ACM International Conference on Automated Software Engineering. 623–634.
- Huang et al. (2022) Kaifeng Huang, Bihuan Chen, Susheng Wu, Junmin Cao, Lei Ma, and Xin Peng. 2022. Demystifying Dependency Bugs in Deep Learning Stack. CoRR abs/2207.10347 (2022).
- Humbatova et al. (2020) Nargiz Humbatova, Gunel Jahangirova, Gabriele Bavota, Vincenzo Riccio, Andrea Stocco, and Paolo Tonella. 2020. Taxonomy of real faults in deep learning systems. In Proceedings of the ACM/IEEE 42nd International Conference on Software Engineering. 1110–1121.
- Islam et al. (2019) Md Johirul Islam, Giang Nguyen, Rangeet Pan, and Hridesh Rajan. 2019. A Comprehensive Study on Deep Learning Bug Characteristics. In Proceedings of the 2019 27th ACM Joint Meeting on European Software Engineering Conference and Symposium on the Foundations of Software Engineering. 510–520.
- Islam et al. (2020) Md Johirul Islam, Rangeet Pan, Giang Nguyen, and Hridesh Rajan. 2020. Repairing deep neural networks: Fix patterns and challenges. In Proceedings of the IEEE/ACM 42nd International Conference on Software Engineering. 1135–1146.
- Jia et al. (2020) Li Jia, Hao Zhong, Xiaoyin Wang, Linpeng Huang, and Xuansheng Lu. 2020. An Empirical Study on Bugs Inside TensorFlow. In Proceedings of the International Conference on Database Systems for Advanced Applications. 604–620.
- Jin et al. (2012) Guoliang Jin, Linhai Song, Xiaoming Shi, Joel Scherpelz, and Shan Lu. 2012. Understanding and Detecting Real-World Performance Bugs. In Proceedings of the 33rd ACM SIGPLAN Conference on Programming Language Design and Implementation. 77–88.
- Jung et al. (2011) Changhee Jung, Silvius Rus, Brian P. Railing, Nathan Clark, and Santosh Pande. 2011. Brainy: Effective Selection of Data Structures. In Proceedings of the 32nd ACM SIGPLAN Conference on Programming Language Design and Implementation. 86–97.
- Junming Cao (2022) Chao Sun Longjie Hu Shuaihong Wu Xin Peng Junming Cao, Bihuan Chen. 2022. Understanding Performance Problems in Deep Learning Systems. Zenodo. https://doi.org/10.5281/zenodo.7060209
- Kim et al. (2019) Jinhan Kim, Robert Feldt, and Shin Yoo. 2019. Guiding deep learning system testing using surprise adequacy. In Proceedings of the IEEE/ACM 41st International Conference on Software Engineering. 1039–1049.
- Kim et al. (2021) Misoo Kim, Youngkyoung Kim, and Eunseok Lee. 2021. Denchmark: A Bug Benchmark of Deep Learning-related Software. In Proceedings of the IEEE/ACM 18th International Conference on Mining Software Repositories. 540–544.
- Lagouvardos et al. (2020) Sifis Lagouvardos, Julian Dolby, Neville Grech, Anastasios Antoniadis, and Yannis Smaragdakis. 2020. Static analysis of shape in TensorFlow programs. In Proceedings of the 34th European Conference on Object-Oriented Programming. 1–29.
- Larus (1999) James R. Larus. 1999. Whole Program Paths. In Proceedings of the ACM SIGPLAN 1999 Conference on Programming Language Design and Implementation. 259–269.
- Lemieux et al. (2018) Caroline Lemieux, Rohan Padhye, Koushik Sen, and Dawn Song. 2018. Perffuzz: Automatically generating pathological inputs. In Proceedings of the 27th ACM SIGSOFT International Symposium on Software Testing and Analysis. 254–265.
- Li et al. (2021) Mingzhen Li, Yi Liu, Xiaoyan Liu, Qingxiao Sun, Xin You, Hailong Yang, Zhongzhi Luan, Lin Gan, Guangwen Yang, and Depei Qian. 2021. The Deep Learning Compiler: A Comprehensive Survey. IEEE Transactions on Parallel and Distributed Systems 32, 3 (2021), 708–727.
- Linares-Vasquez et al. (2015) Mario Linares-Vasquez, Christopher Vendome, Qi Luo, and Denys Poshyvanyk. 2015. How developers detect and fix performance bottlenecks in android apps. In Proceedings of the IEEE international conference on software maintenance and evolution. 352–361.
- Liu et al. (2019) Jie Liu, Jiawen Liu, Wan Du, and Dong Li. 2019. Performance analysis and characterization of training deep learning models on mobile device. In Proceedings of the IEEE 25th International Conference on Parallel and Distributed Systems. 506–515.
- Liu et al. (2014) Yepang Liu, Chang Xu, and Shing-Chi Cheung. 2014. Characterizing and detecting performance bugs for smartphone applications. In Proceedings of the 36th international conference on software engineering. 1013–1024.
- Luckow et al. (2017) Kasper Luckow, Rody Kersten, and Corina Păsăreanu. 2017. Symbolic complexity analysis using context-preserving histories. In Proceedings of the IEEE International Conference on Software Testing, Verification and Validation. 58–68.
- Ma et al. (2018) Lei Ma, Felix Juefei-Xu, Fuyuan Zhang, Jiyuan Sun, Minhui Xue, Bo Li, Chunyang Chen, Ting Su, Li Li, Yang Liu, et al. 2018. Deepgauge: Multi-granularity testing criteria for deep learning systems. In Proceedings of the 33rd ACM/IEEE International Conference on Automated Software Engineering. 120–131.
- Ma et al. (2019) Yun Ma, Dongwei Xiang, Shuyu Zheng, Deyu Tian, and Xuanzhe Liu. 2019. Moving deep learning into web browser: How far can we go?. In Proceedings of the World Wide Web Conference. 1234–1244.
- Menghani (2021) Gaurav Menghani. 2021. Efficient Deep Learning: A Survey on Making Deep Learning Models Smaller, Faster, and Better. CoRR abs/2106.08962 (2021).
- Nejadgholi and Yang (2019) Mahdi Nejadgholi and Jinqiu Yang. 2019. A study of oracle approximations in testing deep learning libraries. In Proceedings of the 34th IEEE/ACM International Conference on Automated Software Engineering. 785–796.
- Nguyen and Xu (2013) Khanh Nguyen and Guoqing Xu. 2013. Cachetor: Detecting cacheable data to remove bloat. In Proceedings of the 9th Joint Meeting on Foundations of Software Engineering. 268–278.
- Nistor et al. (2015) Adrian Nistor, Po-Chun Chang, Cosmin Radoi, and Shan Lu. 2015. Caramel: Detecting and fixing performance problems that have non-intrusive fixes. In Proceedings of the IEEE/ACM 37th IEEE International Conference on Software Engineering. 902–912.
- Nistor et al. (2013a) Adrian Nistor, Tian Jiang, and Lin Tan. 2013a. Discovering, reporting, and fixing performance bugs. In Proceedings of the 10th working conference on mining software repositories. 237–246.
- Nistor et al. (2013b) Adrian Nistor, Linhai Song, Darko Marinov, and Shan Lu. 2013b. Toddler: Detecting performance problems via similar memory-access patterns. In Proceedings of the 35th International Conference on Software Engineering. 562–571.
- Odena et al. (2019) Augustus Odena, Catherine Olsson, David Andersen, and Ian Goodfellow. 2019. Tensorfuzz: Debugging neural networks with coverage-guided fuzzing. In Proceedings of the International Conference on Machine Learning. 4901–4911.
- Pei et al. (2017) Kexin Pei, Yinzhi Cao, Junfeng Yang, and Suman Jana. 2017. Deepxplore: Automated whitebox testing of deep learning systems. In proceedings of the 26th Symposium on Operating Systems Principles. 1–18.
- Petsios et al. (2017) Theofilos Petsios, Jason Zhao, Angelos D Keromytis, and Suman Jana. 2017. Slowfuzz: Automated domain-independent detection of algorithmic complexity vulnerabilities. In Proceedings of the 2017 ACM SIGSAC Conference on Computer and Communications Security. 2155–2168.
- Pham et al. (2019) Hung Viet Pham, Thibaud Lutellier, Weizhen Qi, and Lin Tan. 2019. CRADLE: cross-backend validation to detect and localize bugs in deep learning libraries. In Proceedings of the IEEE/ACM 41st International Conference on Software Engineering. 1027–1038.
- Pham et al. (2020) Hung Viet Pham, Shangshu Qian, Jiannan Wang, Thibaud Lutellier, Jonathan Rosenthal, Lin Tan, Yaoliang Yu, and Nachiappan Nagappan. 2020. Problems and opportunities in training deep learning software systems: an analysis of variance. In Proceedings of the 35th IEEE/ACM International Conference on Automated Software Engineering. 771–783.
- Qi et al. (2016) Hang Qi, Evan R Sparks, and Ameet Talwalkar. 2016. Paleo: A performance model for deep neural networks. In Proceedings of the 5th International Conference on Learning Representations.
- Rhu et al. (2016) Minsoo Rhu, Natalia Gimelshein, Jason Clemons, Arslan Zulfiqar, and Stephen W Keckler. 2016. vDNN: Virtualized deep neural networks for scalable, memory-efficient neural network design. In Proceedings of the 49th Annual IEEE/ACM International Symposium on Microarchitecture. 1–13.
- Robillard et al. (2012) Martin P Robillard, Eric Bodden, David Kawrykow, Mira Mezini, and Tristan Ratchford. 2012. Automated API property inference techniques. IEEE Transactions on Software Engineering 39, 5 (2012), 613–637.
- Selakovic and Pradel (2016) Marija Selakovic and Michael Pradel. 2016. Performance issues and optimizations in javascript: an empirical study. In Proceedings of the 38th International Conference on Software Engineering. 61–72.
- Shacham et al. (2009) Ohad Shacham, Martin Vechev, and Eran Yahav. 2009. Chameleon: Adaptive Selection of Collections. In Proceedings of the 30th ACM SIGPLAN Conference on Programming Language Design and Implementation. 408–418.
- Shen et al. (2015) Du Shen, Qi Luo, Denys Poshyvanyk, and Mark Grechanik. 2015. Automating performance bottleneck detection using search-based application profiling. In Proceedings of the 2015 International Symposium on Software Testing and Analysis. 270–281.
- Song and Lu (2014) Linhai Song and Shan Lu. 2014. Statistical Debugging for Real-World Performance Problems. In Proceedings of the 2014 ACM International Conference on Object Oriented Programming Systems Languages & Applications. 561–578.
- Song and Lu (2017) Linhai Song and Shan Lu. 2017. Performance diagnosis for inefficient loops. In Proceedings of the IEEE/ACM 39th International Conference on Software Engineering. 370–380.
- Sun et al. (2018) Youcheng Sun, Min Wu, Wenjie Ruan, Xiaowei Huang, Marta Kwiatkowska, and Daniel Kroening. 2018. Concolic testing for deep neural networks. In Proceedings of the 33rd ACM/IEEE International Conference on Automated Software Engineering. 109–119.
- Tian et al. (2018) Yuchi Tian, Kexin Pei, Suman Jana, and Baishakhi Ray. 2018. Deeptest: Automated testing of deep-neural-network-driven autonomous cars. In Proceedings of the 40th international conference on software engineering. 303–314.
- Tizpaz-Niari et al. (2020) Saeid Tizpaz-Niari, Pavol Černỳ, and Ashutosh Trivedi. 2020. Detecting and understanding real-world differential performance bugs in machine learning libraries. In Proceedings of the 29th ACM SIGSOFT International Symposium on Software Testing and Analysis. 189–199.
- Verma and Su (2020) Sahil Verma and Zhendong Su. 2020. ShapeFlow: Dynamic Shape Interpreter for TensorFlow. CoRR abs/2011.13452 (2020).
- Wan et al. (2021) Chengcheng Wan, Shicheng Liu, Henry Hoffmann, Michael Maire, and Shan Lu. 2021. Are Machine Learning Cloud APIs Used Correctly?. In Proceedings of the IEEE/ACM 43rd International Conference on Software Engineering. 125–137.
- Wang et al. (2018) Linnan Wang, Jinmian Ye, Yiyang Zhao, Wei Wu, Ang Li, Shuaiwen Leon Song, Zenglin Xu, and Tim Kraska. 2018. Superneurons: Dynamic GPU memory management for training deep neural networks. In Proceedings of the 23rd ACM SIGPLAN symposium on principles and practice of parallel programming. 41–53.
- Wang et al. (2021) Song Wang, Nishtha Shrestha, Abarna Kucheri Subburaman, Junjie Wang, Moshi Wei, and Nachiappan Nagappan. 2021. Automatic Unit Test Generation for Machine Learning Libraries: How Far Are We?. In Proceedings of the IEEE/ACM 43rd International Conference on Software Engineering. 1548–1560.
- Wang et al. (2020) Zan Wang, Ming Yan, Junjie Chen, Shuang Liu, and Dongdi Zhang. 2020. Deep learning library testing via effective model generation. In Proceedings of the 28th ACM Joint Meeting on European Software Engineering Conference and Symposium on the Foundations of Software Engineering. 788–799.
- Wardat et al. (2021) Mohammad Wardat, Wei Le, and Hridesh Rajan. 2021. DeepLocalize: Fault Localization for Deep Neural Networks. In Proceedings of the IEEE/ACM 43rd International Conference on Software Engineering. 251–262.
- Wei et al. (2018) Jiayi Wei, Jia Chen, Yu Feng, Kostas Ferles, and Isil Dillig. 2018. Singularity: Pattern fuzzing for worst case complexity. In Proceedings of the 2018 26th ACM Joint Meeting on European Software Engineering Conference and Symposium on the Foundations of Software Engineering. 213–223.
- Xie et al. (2019) Xiaofei Xie, Lei Ma, Felix Juefei-Xu, Minhui Xue, Hongxu Chen, Yang Liu, Jianjun Zhao, Bo Li, Jianxiong Yin, and Simon See. 2019. Deephunter: a coverage-guided fuzz testing framework for deep neural networks. In Proceedings of the 28th ACM SIGSOFT International Symposium on Software Testing and Analysis. 146–157.
- Xu and Rountev (2010) Guoqing Xu and Atanas Rountev. 2010. Detecting Inefficiently-Used Containers to Avoid Bloat. In Proceedings of the 31st ACM SIGPLAN Conference on Programming Language Design and Implementation. 160–173.
- Yan et al. (2015) Feng Yan, Olatunji Ruwase, Yuxiong He, and Trishul Chilimbi. 2015. Performance modeling and scalability optimization of distributed deep learning systems. In Proceedings of the 21th ACM SIGKDD International Conference on Knowledge Discovery and Data Mining. 1355–1364.
- Yang et al. (2018) Junwen Yang, Cong Yan, Pranav Subramaniam, Shan Lu, and Alvin Cheung. 2018. How not to structure your database-backed web applications: a study of performance bugs in the wild. In Proceedings of the IEEE/ACM 40th International Conference on Software Engineering. 800–810.
- Yang et al. (2019) Junwen Yang, Cong Yan, Chengcheng Wan, Shan Lu, and Alvin Cheung. 2019. View-centric performance optimization for database-backed web applications. In Proceedings of the 41st International Conference on Software Engineering. 994–1004.
- Zaman et al. (2012) Shahed Zaman, Bram Adams, and Ahmed E Hassan. 2012. A qualitative study on performance bugs. In Proceedings of the 9th IEEE working conference on mining software repositories. 199–208.
- Zaparanuks and Hauswirth (2012) Dmitrijs Zaparanuks and Matthias Hauswirth. 2012. Algorithmic Profiling. In Proceedings of the 33rd ACM SIGPLAN Conference on Programming Language Design and Implementation. 67–76.
- Zhang et al. (2020a) Jie M Zhang, Mark Harman, Lei Ma, and Yang Liu. 2020a. Machine learning testing: Survey, landscapes and horizons. IEEE Transactions on Software Engineering (2020).
- Zhang et al. (2020c) Ru Zhang, Wencong Xiao, Hongyu Zhang, Yu Liu, Haoxiang Lin, and Mao Yang. 2020c. An empirical study on program failures of deep learning jobs. In Proceedings of the IEEE/ACM 42nd International Conference on Software Engineering. 1159–1170.
- Zhang et al. (2019) Tianyi Zhang, Cuiyun Gao, Lei Ma, Michael Lyu, and Miryung Kim. 2019. An empirical study of common challenges in developing deep learning applications. In Proceedings of the IEEE 30th International Symposium on Software Reliability Engineering. 104–115.
- Zhang et al. (2021a) Xufan Zhang, Ning Sun, Chunrong Fang, Jiawei Liu, Jia Liu, Dong Chai, Jiang Wang, and Zhenyu Chen. 2021a. Predoo: precision testing of deep learning operators. In Proceedings of the 30th ACM SIGSOFT International Symposium on Software Testing and Analysis. 400–412.
- Zhang et al. (2021b) Xiaoyu Zhang, Juan Zhai, Shiqing Ma, and Chao Shen. 2021b. AUTOTRAINER: An Automatic DNN Training Problem Detection and Repair System. In Proceedings of the IEEE/ACM 43rd International Conference on Software Engineering. 359–371.
- Zhang et al. (2018) Yuhao Zhang, Yifan Chen, Shing-Chi Cheung, Yingfei Xiong, and Lu Zhang. 2018. An empirical study on TensorFlow program bugs. In Proceedings of the 27th ACM SIGSOFT International Symposium on Software Testing and Analysis. 129–140.
- Zhang et al. (2020b) Yuhao Zhang, Luyao Ren, Liqian Chen, Yingfei Xiong, Shing-Chi Cheung, and Tao Xie. 2020b. Detecting numerical bugs in neural network architectures. In Proceedings of the 28th ACM Joint Meeting on European Software Engineering Conference and Symposium on the Foundations of Software Engineering. 826–837.
- Zhao et al. (2020) Yutong Zhao, Lu Xiao, Xiao Wang, Lei Sun, Bihuan Chen, Yang Liu, and Andre B Bondi. 2020. How Are Performance Issues Caused and Resolved?-An Empirical Study from a Design Perspective. In Proceedings of the ACM/SPEC International Conference on Performance Engineering. 181–192.