Visualization of Oscillatory Electron Dynamics on the Surface of Liquid Helium
Abstract
We have measured signals induced in 5 Corbino electrodes by spontaneous oscillations of 2D surface electrons on liquid helium at 0.3 K, with a perpendicular magnetic field and microwave radiation. Analysis using multi-scale, time-resolved, methods yields results consistent with magnetoplasmons modulated by slow surface gravity waves, with the latter requiring consideration of the 3rd dimension. Calculation of phase differences and phase coherences between signals from differently-positioned pairs of electrodes enables reconstruction of the electron dynamics on the helium surface.
The two-dimensional electron system (2DES) formed by electrons above the surface of liquid helium facilitates the exploration of 2D non-equilibrium phenomena in an almost perfectly clean environment [1], complementary to the 2DES in GaAs heterostructures [2]. Following the prediction [3] and observation [4] of electrons on helium, research highlights have included magnetoplasmons [5], Wigner crystallization [6, 7], the ripplonic Lamb shift [8], coupling of Rydberg states to Landau levels [9], quantum information processing [10, 11, 12], incompressible electronic behaviour [13, 14, 15], zero-resistance states [16, 17] , a plethora of important results on many-electron phenomena and non-equilibrium physics [18, 19, 20, 21, 17], and the highest known 2D electronic mobilities [22]. The recent studies [13, 14] used a strong magnetic field causing vanishing diagonal conductivity, and resonant microwave radiation (MW). For a circular pool of surface electrons, currents induced at the center of a Corbino electrode geometry above the liquid exhibited nonlinear oscillations in the audiofrequency range. These were attributed to edge magnetoplasmons [23, 24, 15, 25], but there was also evidence [26, 27] of an even lower-frequency modulation.
In this Letter, we study the electric currents induced in five electrodes above the liquid by the motion of electrons on the surface, under a strong magnetic field and microwave irradiation. Time-resolved multi-scale analysis methods are used to reconstruct the electrons’ underlying oscillatory dynamics from the recorded signals.
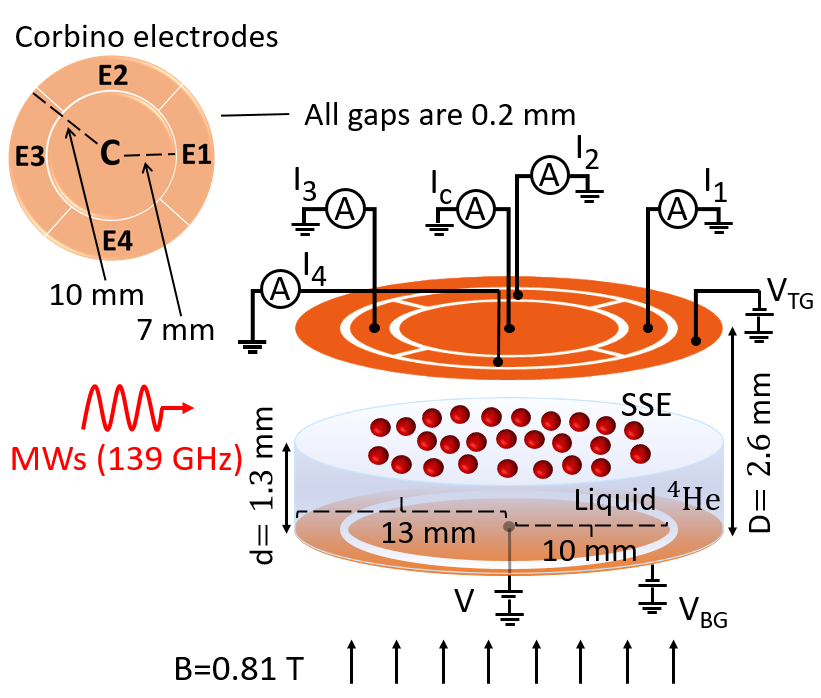
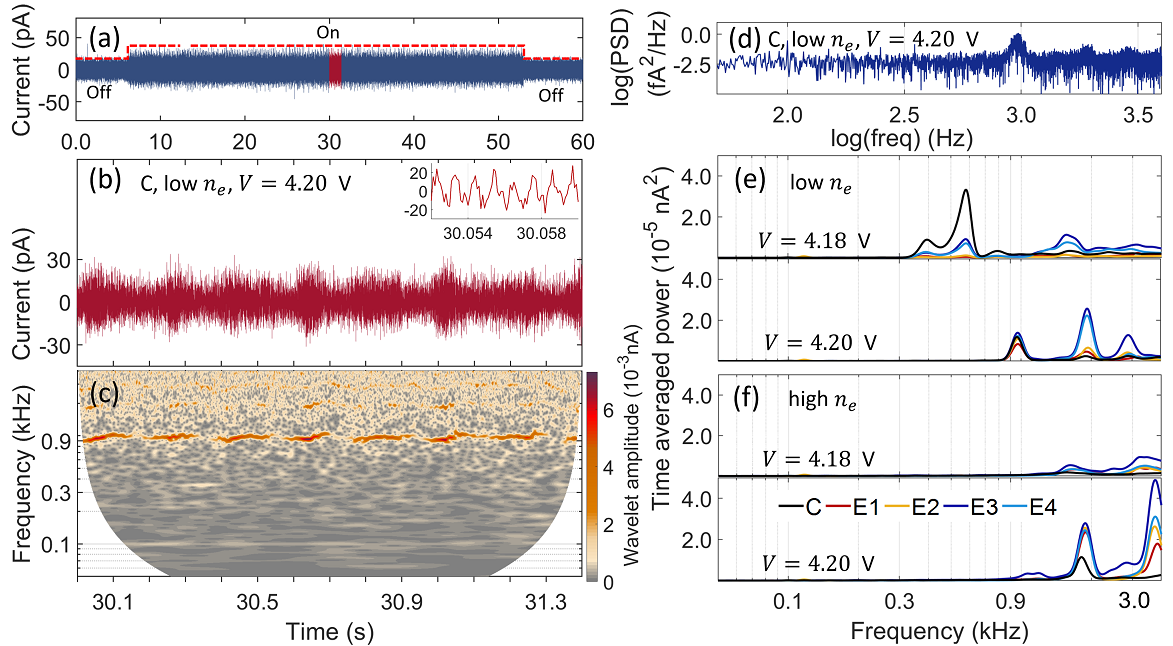
Fig. 1 illustrates the experimental arrangement. The copper cell is attached to the mixing chamber of a dilution refrigerator at 0.3 K. The system of electrodes represents a parallel - plate capacitor with two horizontal circular plates of 20 mm diameter, separated by mm. The liquid 4He surface is set midway between the plates, so that the helium depth mm. The top plate consists of two concentric Corbino electrodes: a central disk C and an outer ring divided into four equal segments E1, E2, E3 and E4. The bottom disk-shaped electrode is positively biased to press the electrons against the helium surface. The top and bottom plates are each surrounded by a negatively-biased guard-ring ( = = 0.5 V) to confine the electrons within their pool. The helium level is controlled within by monitoring the capacitance between the top and bottom plates. A pulse of electrons, thermionically emitted from a tungsten filament, accumulates above the liquid surface. A positive potential on the bottom electrode during charging controls the electron density . The areal electron density = , where and are the helium dielectric constant and the vacuum permittivity, respectively, and is the electronic charge. Resonant microwaves propagating parallel to the helium surface with frequency = 139 GHz, and power 0 dBm, excite an intersubband transition between the ground and the first excited electronic surface states. The intersubband transition is tuned to resonance by adjustment of the holding electric field. A fixed magnetic field = 0.81 T perpendicular to the liquid surface leads to the zero resistance state [16]. The microwaves are activated for 47 seconds. Current signals and are measured simultaneously from C, E1, E2, E3 and E4, respectively. They are converted to voltage signals by current preamplifiers with a gain A/V and a frequency bandwidth 10 kHz. The pressing voltage is set to a value V with an electron density of either or . The signals are sampled for 60 s with a sampling frequency of 100 kHz. The microwaves are switched on 6 s after the start of recording and switched off 7 s before the end.
The main results and analyses are summarised in Figs. 2-4; further detail is provided in the Supplemental Material (SM). Fig. 2(a) shows a typical signal, with (b) an enlargement of the part that we analyse. Signals from all electrodes increase in amplitude under MW irradiation. For low and small , the greatest increases are at electrodes C and E3 (closest to the MW input).
Signals were pre-processed by subtraction of a best-fit cubic polynomial [29] to remove non-oscillatory trends. Wavelet analysis [30, 29, 31] using the complex Morlet wavelet was then applied to obtain time-frequency representations of the wavelet amplitude and phase, with logarithmic frequency resolution. The spectral properties of the time series are described by the complex spectral function where subscripts and denote the data discreteness. Time is discretised by , so the amplitude = , and the phase = for each time and frequency . Thus, for two signals and , the relative phase difference = - .
Fig. 2(c) shows the wavelet amplitude as a function of frequency and time, cf. the traditional calculation of power spectral density in (d), with linear frequency resolution, averaged over time and thus losing the information in the frequency variations. Time-averaged wavelet powers for signals recorded on each of the electrodes at and V are shown in (e) for lower and in (f) for higher .
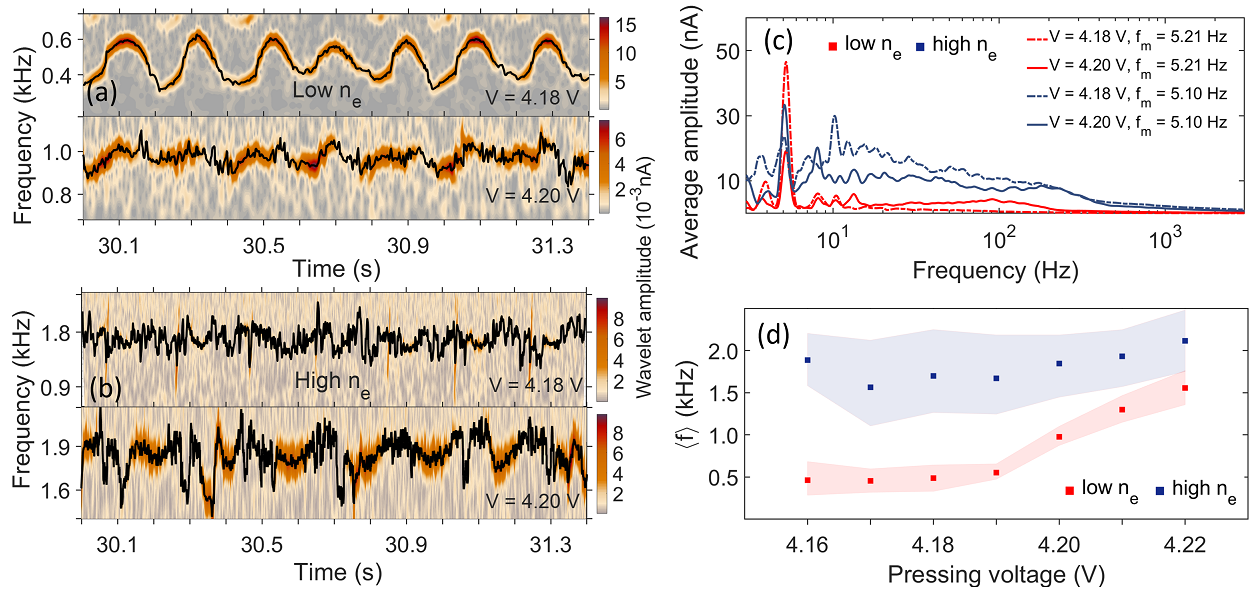
It is evident from Fig. 2(c) that the basic frequency is varying. Similar behaviour was observed earlier using a single electrode [23, 26, 27]. The instantaneous frequency of each mode can be determined by ridge extraction [28], which traces in time the loci of the highest amplitude/power. Typical results are shown in Figure. 3(a) and (b).
The higher frequencies in the wavelet transform are attributable to harmonics [32] (see SM). The more pronounced peak in the time-averaged spectral power for C at low and V in Fig. 2(e) implies electron motion mostly involving C. For given values of and , the frequency is found to be the same on all electrodes. At low electron density, the power is unevenly distributed among the electrodes. When V, most of the power is associated with the central electrode, but it becomes more uniformly distributed among the 4 outer electrodes for and 4.22 V. For the higher , Fig. 2(f), the spectral power is more uniformly distributed between the edge electrodes but it is consistently lower for the central electrode. This suggests that the highest frequencies (see Fig. 3(d) correspond to electrons moving predominantly below the edge electrodes, while the lower frequencies correspond to their moving mainly below the central electrode.
The low frequency modulation 5 Hz revealed by the ridge extractions in Fig. 3(a) is almost independent of and . It may arise from the interaction of surface electrons with gravity waves, also known as ripplons [23, 27]: for radially symmetric modes, the lowest resonant frequency is , where is the acceleration due to gravity, and and are respectively the height and radius of the circular liquid pool [33]. This yields 5.28 Hz, comparable with the observations.
A possible explanation of the kHz oscillations is that they arise from edge-magnetoplasmons (EMP) for which Volkov and Mikhailov [34] calculate a frequency of
| (1) |
where , the constant depends on details of the density profile, is the width of the transition layer, and is the wavevector component along the boundary. This gives frequencies of 2.28 and 3.58 kHz for low and high electron densities, respectively, i.e. close to the experimental values. Figure. 3(d) shows how the mean oscillation frequency for C changes with for different . We note that the mean frequency starts to increase at V when the electron density is low with only a minimal difference between the maxima and minima of the oscillations (red shadow), perhaps due to an accumulation of electrons under the edge electrodes [27] (SM). For larger , the mean frequency is higher and almost independent of .
The wavelet phases can be used to calculate the phase difference between the signals on any chosen pair of electrodes. By averaging the sine and cosine components of the phase differences over time, we find the phase coherence function
| (2) |
where the coefficients and are given in [35]. Its value ranges between 0 and 1. When , the phase difference changes continuously so that there in no phase coherence, whilst 1 means that the phase difference remains constant corresponding to perfect phase coherence. The phase difference varies within and shows how one signal lags or leads another. We used the method of surrogates [36, 37] to test the statistical significance of the computed coherence, employing 100 iterative amplitude-adjusted Fourier transform (IAAFT) surrogates. The statistically significant coherence is calculated by subtracting the 95th percentile of the surrogate numbers.
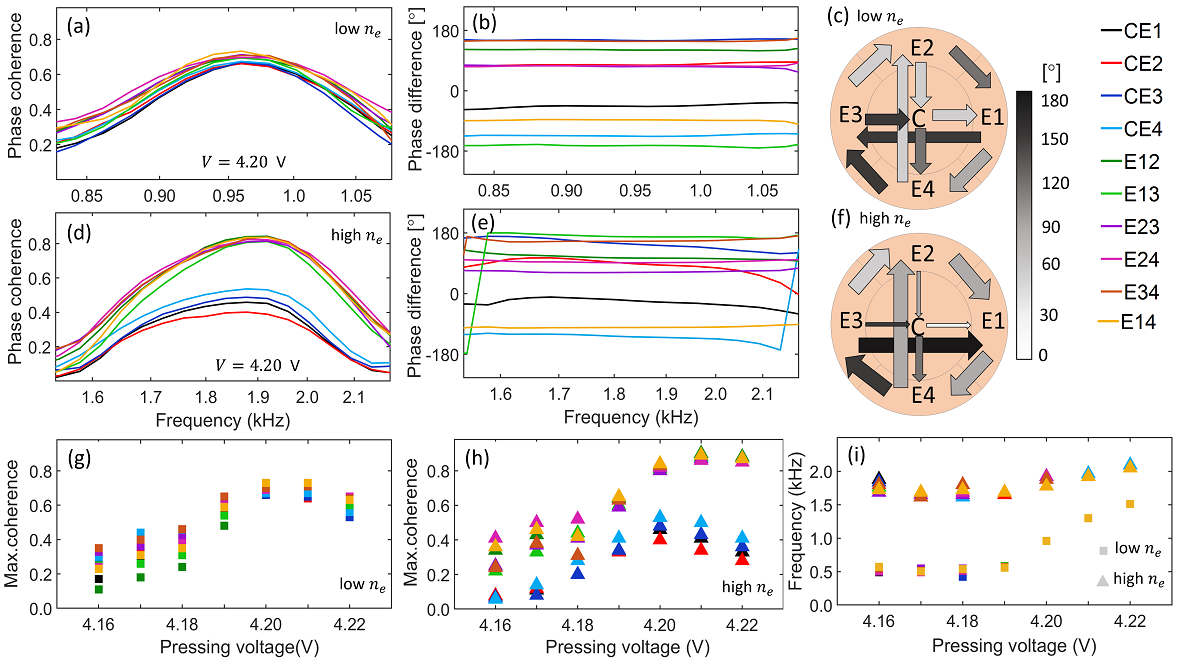
We have studied the mutual relationships of the current oscillations in the five electrodes by calculation of the wavelet phase coherence and phase differences between different electrode pairs. Results are shown for low and high in Figs. 4(a-c) and (d-f), respectively, for V; for results with other values of , see SM. At low , significant coherence was found for all electrode permutations for V (Fig. 4(a)). For high at V (Fig. 4(d)), there is lower coherence between the central electrode and each of the edge electrodes, but high coherence when the edge electrodes are paired. From Fig. 4(b) and (e), the phase difference is constant for both low and high electron density around the frequency where maximal phase coherence occurs. For high Fig. 4(e) shows that some of the currents are almost in antiphase.
The most plausible explanation of the phase differences between the signals from differently-positioned electrodes is that there is a complex clockwise circumferential electron flow, and there are also flows towards and away from C: the circular schematics (c) and (f) illustrate electron flow at the same V but at different . It is clear that changing changes the flow pattern. The flow direction is independent of at the higher , but dependent on it at lower values (see SM). The complexity of the flow may in part be attributable to interaction between the electrons and the gravity waves. Fig. 4(g,h) show that, for all paired electrodes, the maximum phase coherence changes with for both : (g) shows that, for low , the resonance condition is satisfied at V, implying that the coherence is uniform over the electrodes. Fig. 4(i) shows that the frequency of maximum coherence changes with at both electron densities, similarly to the behavior of the mean frequency of oscillation on each of the electrodes Fig. 3(d).
In conclusion, we have confirmed that the main kHz signals are generated by inter-edge magnetoplasmons [34] modulated by interaction with surface ripplons at about 5 Hz [23, 27]. Note that, in attributing the Hz modulation to the effect of ripplons, we are effectively taking account of vertical motion, i.e. of the third dimension. Our use of segmented electrodes, coupled with time-frequency analysis, has illuminated the dynamics of the surface electrons. If the power spectral densities alone were calculated, the signals would look mostly like white noise. Adding the time dimension enables the varying frequency to be followed and brings new insight. We find that increasing can change the pattern of phase differences and coherence between the signals induced at differently positioned electrodes. Treating the time-resolved dynamics with logarithmic frequency resolution, opens up new possibilities for understanding these paradigmatic far-from-equilibrium phenomena, bringing together the quantum and classical processes involved.
We acknowledge valuable discussions with Julian Newman, Paul Wileman, Sasha Proctor, Lawrence Sheppard, Yunus Abdulhameed, Mark Dykman and Yuriy Monarkha. The experimental data were obtained by the Quantum Condensed Phases Research Team, RIKEN CEMS, Japan. HS is supported by Jazan University, Saudi Arabia. KK is supported by the Ministry of Science and Technology, Taiwan, ROC, under Grant No. MOST 109-2112-M-009-021, and JSPS KAKENHI Grant Number JP17H01145. PVEMcC is supported by the Engineering and Physical Sciences Research Council (UK) under Grant No. EP/P022197/1.
References
- Monarkha and Kono [2004] Y. Monarkha and K. Kono, Two-dimensional Coulomb Liquids and Solids (Springer-Verlag, Berlin, 2004).
- Zudov et al. [2001] M. A. Zudov, R. R. Du, J. A. Simmons, and J. L. Reno, Shubnikov–de Haas-like oscillations in millimeterwave photoconductivity in a high-mobility two-dimensional electron gas, Phys. Rev. B 64, 201311 (2001).
- Cole and Cohen [1969] M. W. Cole and M. H. Cohen, Image-potential-induced surface bands in insulators, Phys. Rev. Lett. 23, 1238 (1969).
- Williame et al. [1971] R. Williame, R. S. Crandall, and A. H. Willis, Surface states of electrons on liquid helium, Phys. Rev. Lett. 26, 7 (1971).
- Grimes and Adams [1976] C. C. Grimes and G. Adams, Observation of 2-dimensional plasmons and electron-ripplon scattering in a sheet of electrons on liquid-helium, Phys. Rev. Lett. 36, 145 (1976).
- Grimes and Adams [1979] C. C. Grimes and G. Adams, Evidence for a liquid-to-crystal phase-transition in a classical 2-dimensional sheet of electrons, Phys. Rev.Lett. 42, 795 (1979).
- Fisher et al. [1979] D. S. Fisher, B. I. Halperin, and P. M. Platzman, Phonon-ripplon coupling and the 2-dimensional electron solid on a liquid-helium surface, Phys. Rev. Lett. 42, 798 (1979).
- Dykman et al. [2017] M. I. Dykman, K. Kono, D. Konstantinov, and M. J. Lea, Ripplonic Lamb shift for electrons on liquid helium, Phys. Rev. Lett. 119 (2017).
- Yunusova et al. [2019] K. M. Yunusova, D. Konstantinov, H. Bouchiat, and A. D. Chepelianskii, Coupling between Rydberg states and Landau levels of electrons trapped on liquid helium, Phys. Rev. Lett. 122, 176802 (2019).
- Platzman and Dykman [1999] P. M. Platzman and M. I. Dykman, Quantum computing with electrons floating on liquid helium, Science 284, 1967 (1999).
- Schuster et al. [2010] D. I. Schuster, A. Fragner, M. I. Dykman, S. A. Lyon, and R. J. Schoelkopf, Proposal for manipulating and detecting spin and orbital states of trapped electrons on helium using cavity quantum electrodynamics, Phys. Rev. Lett. 105, 040503 (2010).
- Koolstra et al. [2019] G. Koolstra, G. Yang, and D. I. Schuster, Coupling a single electron on superfluid helium to a superconducting resonator, Nat. Commun. 10, 10.1038/s41467-019-13335-7 (2019).
- Konstantinov et al. [2012] D. Konstantinov, A. Chepelianskii, and K. Kono, Resonant photovoltaic effect in surface state electrons on liquid helium, J. Phys. Soc. Jpn. 81, 093601 (2012).
- Chepelianskii et al. [2015] A. D. Chepelianskii, M. Watanabe, K. Nasyedkin, K. Kono, and D. Konstantinov, An incompressible state of a photo-excited electron gas, Nature Commun. 6, 1 (2015).
- Monarkha [2016] Y. P. Monarkha, Density domains of a photo-excited electron gas on liquid helium, Low Temp. Phys. 42, 441 (2016).
- Konstantinov and Kono [2010] D. Konstantinov and K. Kono, Photon-induced vanishing of magnetoconductance in 2D electrons on liquid helium, Phys. Rev. Lett. 105, 226801 (2010).
- Monarkha [2011] Y. P. Monarkha, Microwave-resonance-induced magnetooscillations and vanishing resistance states in multisubband two-dimensional electron systems, Low Temp. Phys. 37, 655 (2011).
- Konstantinov and Kono [2009] D. Konstantinov and K. Kono, Novel radiation-induced magnetoresistance oscillations in a nondegenerate two-dimensional electron system on liquid helium, Phys. Rev. Lett. 103, 266808 (2009).
- Konstantinov et al. [2009] D. Konstantinov, M. I. Dykman, M. J. Lea, Y. Monarkha, and K. Kono, Resonant correlation-induced optical bistability in an electron system on liquid helium, Phys. Rev. Lett. 103, 096801 (2009).
- Ikegami et al. [2012] H. Ikegami, H. Akimoto, D. G. Rees, and K. Kono, Evidence for reentrant melting in a quasi-one-dimensional Wigner crystal, Phys. Rev. Lett. 109, 236802 (2012).
- Rees et al. [2016] D. G. Rees, N. R. Beysengulov, J.-J. Lin, and K. Kono, Stick-Slip Motion of the Wigner Solid on Liquid Helium, Phys. Rev. Lett. 116, 206801 (2016).
- Shirahama et al. [1995] K. Shirahama, S. Ito, H. Suto, and K. Kono, Surface study of liquid He-3 using surface state electrrons, J. Low Temp. Phys. 101, 439 (1995).
- Konstantinov et al. [2013] D. Konstantinov, M. Watanabe, and K. Kono, Self-generated audio-frequency oscillations in 2D electrons with nonequilibrium carrier distribution on liquid helium, J. Phys. Soc. Jpn. 82, 075002 (2013).
- Arai et al. [2012] T. Arai, S. Yamanaka, H. Yayama, A. Sawada, and A. Fukuda, Linewidth broadening in edge-magnetoplasmon resonance of helium surface state electrons, J Phys.: Conf. Ser. 400, 042001 (2012).
- Zadorozhko et al. [2018] A. A. Zadorozhko, Y. P. Monarkha, and D. Konstantinov, Circular-polarization-dependent study of microwave-induced conductivity oscillations in a two-dimensional electron gas on liquid helium, Phys. Rev. Lett. 120, 046802 (2018).
- Clemson and Stefanovska [2014] P. T. Clemson and A. Stefanovska, Discerning non-autonomous dynamics, Phys. Rep. 542, 297 (2014).
- Monarkha and Konstantinov [2019] Y. Monarkha and D. Konstantinov, Magneto-oscillations and anomalous current states in a photoexcited electron gas on liquid helium, J. Low Temp. Phys. 197, 208 (2019).
- Iatsenko et al. [2016] D. Iatsenko, P. V. E. McClintock, and A. Stefanovska, Extraction of instantaneous frequencies from ridges in time–frequency representations of signals, Sig. Process 125, 290 (2016).
- Iatsenko et al. [2015] D. Iatsenko, P. V. E. McClintock, and A. Stefanovska, Linear and synchrosqueezed time-frequency representations revisited: Overview, standards of use, resolution, reconstruction, concentration, and algorithms, Digit. Sig. Process 42 (2015).
- Kaiser [1994] G. Kaiser, A Friendly Guide to Wavelets (Birkhäuser, Boston, 1994).
- Clemson et al. [2016] P. Clemson, G. Lancaster, and A. Stefanovska, Reconstructing time-dependent dynamics, Proc. IEEE 104, 223 (2016).
- Sheppard et al. [2011] L. W. Sheppard, A. Stefanovska, and P. V. E. McClintock, Detecting the harmonics of oscillations with time-variable frequencies, Phys. Rev. E 83, 016206 (2011).
- Landau and Lifshitz [1987] L. D. Landau and E. M. Lifshitz, Course of Theoretical Physics, Vol. 6: Fluid Mechanics (Heinemann, Oxford, 1987).
- Volkov and Mikhailov [1991] V. A. Volkov and S. A. Mikhailov, Electrodynamics of two-dimensional electron systems in high magnetic fields, in Modern Problems in Condensed Matter Sciences, Vol. 27 (Elsevier, 1991) pp. 855–907.
- Bandrivskyy et al. [2004] A. Bandrivskyy, A. Bernjak, P. V. E. McClintock, and A. Stefanovska, Wavelet phase coherence analysis: application to skin temperature and blood flow, Cardiovasc. Eng. 4, 89 (2004).
- Schreiber and Schmitz [1996] T. Schreiber and A. Schmitz, Improved surrogate data for nonlinearity tests, Phys. Rev. lett. 77, 635 (1996).
- Lancaster et al. [2018] G. Lancaster, D. Iatsenko, A. Pidde, V. Ticcinelli, and A. Stefanovska, Surrogate data for hypothesis testing of physical systems, Phys. Rep. 748, 1 (2018).