VLA Observations of the AE Aqr-type Cataclysmic Variable LAMOST J024048.51+195226.9
Abstract
AE Aqr was until recently the only known magnetic cataclysmic variable (MCV) containing a rapidly spinning (33.08 s) white dwarf (WD). Its radio emission is believed to be a superposition of synchrotron emitting plasmoids, because it has a positive spectral index spanning three orders of magnitude ( GHz) and is unpolarized. Both characteristics are unusual for MCVs. Recently, Thorstensen has suggested that the cataclysmic variable LAMOST J024048.51+195226.9 (henceforth, J0240+19) is a twin of AE Aqr based on its optical spectra. Optical photometry shows the star to be a high-inclination, eclipsing binary with a spin period of 24.93 s, making it the fastest spinning WD. This paper presents three hours of Very Large Array radio observations of J0240+19. These observations show that the persistent radio emission from J0240+19 is dissimilar to that of AE Aqr in that it shows high circular polarization and a negative spectral index. The emission is most similar to the nova-like CV V603 Aql. We argue that the radio emission is caused by a superposition of plasmoids emitting plasma radiation or electron cyclotron maser emission from the lower corona of the donor star and not from the magnetosphere near the WD, because the latter site is expected to be modulated at the orbital period of the binary and to show eclipses of which there is no evidence. The radio source J0240+19, although weak ( mJy), is a persistent source in a high-inclination eclipsing binary, making it a good laboratory for studying radio emission from CVs.
1 Introduction
Magnetic cataclysmic variables (MCVs) showing two photometric periods are called intermediate polars (also known as DQ Herculis stars). The longer period (of order a few hours) is associated with the orbital period of the binary and the shorter period (of order tens of minutes) with the rotation period of the white dwarf (WD). The ratio . The exception to the spin-orbit rule is AE Aquarii (AE Aqr), which until recently, contained the fastest known rotating WD with a period of 33.08 s (; Patterson 1979). The rapid rotation along with the moderately strong magnetic field of the WD (1-10 MG) causes almost all of the accreted material (%; Meintjes et al. 2015) to be expelled from the binary in a so called “magnetic propeller”. The WD’s rapidly spinning magnetosphere acts as a centrifugal barrier to the accreted diamagnetic plasmoids and propels them out of the system (Wynn & King, 1995; Wynn et al., 1997). This accretion scenario is similar to that of accreting millisecond pulsars.
AE Aqr also has several other unique observational characteristics. de Jager et al. (1994) using 14 years of X-ray data found that the WD is spinning down at a rate of s s-1. This rate equates to a spin-down luminosity erg s-1. This is roughly 500 times larger than the accretion luminosity of erg s-1 (Eracleous & Horne, 1996).
Bookbinder & Lamb (1987) and Bastian et al. (1988) using the National Radio Astronomy Observatory (NRAO) Very Large Array found that AE Aqr is a persistent radio emitter showing rapid variablity and large flares. Observations at 1.5, 4.9, 15, and 22.5 GHz show a long-term averaged spectral index (; Bastian et al. 1988). The flux density at 15 GHz showed variations of a few mJy on minute timescales during quiescence and peaked at 12 mJy during flares, which occur about every five hours. They also note that in those cases where the flares are temporally resolved, the rise time is shorter than the decay time, which suggests that an external medium limits the flare’s rate of expansion. Ground-based millimeter and submillimeter, and spaced-based infrared observations show that the positive spectral index extends to terahertz frequencies (Abada-Simon et al., 2005; Dubus et al., 2007; Torkelsson, 2013). Above 2 THz the spectrum turns over and has a spectral index of . This nonthermal radio emission, spanning more than three orders of magnitude in frequency, is attributed to a superposition of synchrotron emitting plasmoids that expand and cool radiatively through synchrotron radiation (van der Laan, 1963, 1966).
Thorstensen (2020) recently argued that the CV LAMOST J024048.51+195226.9, also known as CRTS J024048.5+19227, (hereafter J0240+19) may be a possible twin of AE Aqr based on its unusual optical spectrum, which shows no He II emission and weak He I lines. In addition, the light curves show large irregular flaring on the timescale of minutes. However, the time resolution of the photometry was insufficient to search for pulsations on the order of tens of seconds. Using publically available Catalina Real-Time Transient Survey (CRTS) and All-Sky Automated Survey for Supernovae (ASAS-SN) data, Littlefield & Garnavich (2020) identify a shallow dip in the light curves at the secondary’s inferior conjunction and identify this feature with an eclipse by the secondary star. This means that J0240+19 is a high inclination system and explains why the He I Å emission line briefly disappears at orbital phase 0. Additional photometric observations by Garnavich et al. (2021) confirmed the high inclination of J0240+19, but did not detect the WD’s spin period. The spin period was finally found by Pelisoli et al. (2021) to be 24.9328(38) s with an amplitude of 0.2% in the g band, which is below the detection limits of the previous searches. J0240+19 is now the fastest known rotating WD. A search of the NRAO Very Large Array Sky Survey (VLASS) version 1.2 (tile T15t04, 2019 Jun 07; Lacy et al. 2020) showed the presence of a Jy () radio source at 3 GHz within 1 arcsec of the J0240+19 position. It was also detected in a MeerKAT pointed observation on 2020 Aug 12 with a flux density of Jy at 1.284 GHz and spectral index (Pretorius et al., 2021). Neither observation reported any polarization measurements.
In this paper we present three hours of NRAO Karl G. Jansky Very Large Array (VLA) observations of J0240+19. The observations are split between one hour of spectroscopy in order to compare the spectrum of J0240+19 to that of AE Aqr and two hours of photometry in order to detect the spin period of the WD. If J0240+19 is a twin of AE Aqr, then its radio flux density is expected to increase with frequency and to be mJy at 22 GHz, assuming a flux density of Jy at 3 GHz and a spectral index of 0.5, the same as AE Aqr. At this flux density, it should be possible to detect a large amplitude pulsation with a period as short as 30 s.
2 Observations and Data Reduction
J0240+19 was observed by the VLA for three hours on two seperate dates. The first observation measured the spectrum of J0240+19 across five radio bands from 2–26 GHz during a one hour scheduling block. The exposures in each band range between 600–628 s duration. The results of this observation determined which frequency band to use for the second photometric observation of two hours. This second observation was done using the C band (4–8 GHz) with an on-source time of about 1.6 hours. During the second observation, the VLA cycled between the target J0240+19 and the phase calibrator J0238+1636 every 570 s with about 525 s being on target. Each observation used the 3-bit samplers for wideband coverage. The radio sources J0137+3309 (=3C48) and J0238+1636 were used as the flux and polarization, and the phase and gain calibrators for each observation, respectively. No polarization leakage calibrators were observed, because the cross-polarization is % and varies slowly over sevaral months (Perley & Sault, 2014). This accuracy is sufficient for our needs. Note that the flux calibrator 3C48 has been undergoing a flare since about January 2018, which will affect the absolute flux scale. The effect is smaller at low frequencies (% at S band) and greater at high frequencies (% at Ku band; VLA SUS 2021). Table 1 gives a log of the observations.
| Start Date | Start Time | Band | Frequency | Exposure |
|---|---|---|---|---|
| (UTC) | (GHz) | (h:m:s) | ||
| 2021 Jun 11 | 16:52:36 | K | 18–26 | 00:05:28 |
| 16:59:54 | Ku | 12–18 | 00:05:22 | |
| 17:07:09 | X | 8–10 | 00:05:12 | |
| 17:14:15 | C | 4–8 | 00:05:10 | |
| 17:21:20 | S | 2–4 | 00:05:00 | |
| 2021 Jul 20 | 15:22:50 | C | 4–8 | 01:35:55 |
The data were calibrated using version 6.1.2 of the CASA (Common Astronomy Applications Software) calibration pipeline (McMullin et al., 2007). The imaging application tclean is used to generate IQUV and RRLL images of each target scan to check for any source confusion and radio frequency interference. None were found. The flux densities are measured by fitting a point source to the UV data using the Julia programming language package Visfit (Barrett, 2021). The package uses a box-constrained Levenberg-Marquardt algorithm to minimize the model residuals. The position of the point source is constrained to be within 2 arcsec of the known source position. When measuring the left and right circular polarizations, the flux densities are measured simulaneously using the same source position. Although the phase centers for the left and right polarizations may have slightly different positions, this approach is recommended for faint sources.
3 Analysis
3.1 Spectroscopy
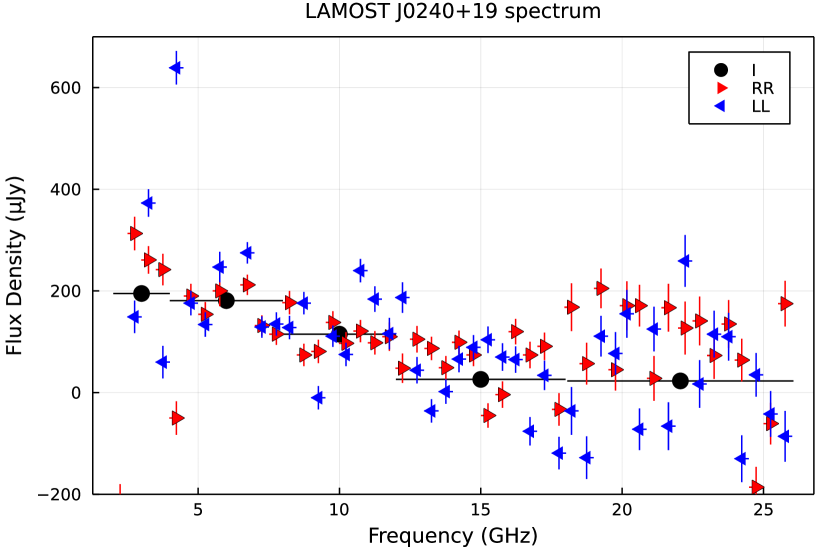
The spectrum of J0240+19 obtained during the first observation is shown in Figure 1. This observation occured between orbital phases 0.70–0.78 using the ephemeris of Garnavich et al. (2021). The average flux density and standard deviations for each frequency band are shown in black. It varies from Jy at 3 GHz to Jy at 22 GHZ. The spectral index of these measurements is roughly consistent with the negative spectral index measured by MeerKAT of (Pretorius et al., 2021), where . Figure 1 also shows the left (LL) and right (RR) circular polarizations for a narrower bandwidth (512 MHz) across the entire frequency range. These data show that the circular polarization varies randomly from one frequency to the next. In particular, the measurement at 4.231 GHz shows strong (%) circularly polarized emission. Note that the Q and U images show no significant linear polarization (%).
3.2 Photometry
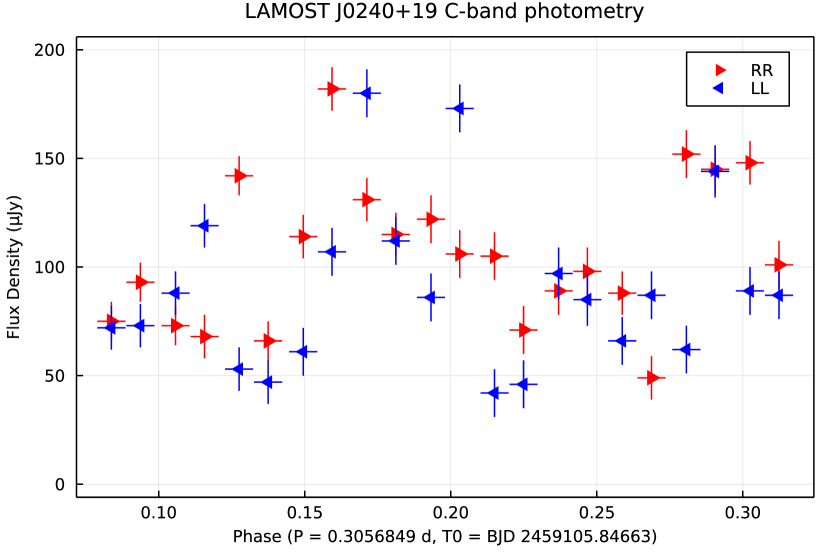
Because the spectroscopy showed that the S and C bands have similar flux densities ( Jy), the photometry was done using the C band, because its wider bandwidth provides greater sensitivity. Unfortunately, J0240+19 was even weaker during the second observation with an average flux density of Jy. Such a low flux density precludes any attempt at searching for, or detecting, a spin period as short as 30 s. We found that the best compromise between time resolution and signal-to-noise ratio is an integration time of 265 s. The observation occurred just after inferior conjunction between orbital phases 0.08–0.32 using the ephemeris of Garnavich et al. (2021). The resulting left and right circular polarization light curves are shown in Figure 2. Like the spectrum shown in Figure 1, the light curve also shows that the flux density and circular polarization vary randomly on a timescale of at most a few minutes. The light curve is too short and variable to show any evidence of an orbital period.
4 Discussion
4.1 Coherent radio emission
The brightness temperature, K, where is the observed flux density in mJy, is the distance in units of 100 pc, is the frequency in GHz, and is the radius of the projected source area in cm. For J0240+19, K for at 3 GHz, (Gaia Collab., 2020), and . The value of assumes that the area of the radio emission has a radius twice that of the donor star. This high implies a coherent emission process.
Following the discussion of Bastian & Bookbinder (1987), there are two coherent mechanisms that can produce highly circularly polarized emission as seen in the spectrum and light curve of J0240+19: magnetic plasma radiation and electron cyclotron maser emission (ECME). Synchrotron emission as suggested by (Pretorius et al., 2021) is unlikely. These emissions can be produced by the ordinary (O), the extraordinary (X), or the low frequency branch of the extraordinary (Z) modes depending on the emission mechanism. In the case of plasma emission, the radiation is produced at either the fundamental or the second harmonic of the electron plasma frequency, , where is the electron density, is the electron charge, and is the electron mass. Emission at the fundamental frequency can be completely polarized and is ascribed to the O mode. Whereas, emission at the second harmonic is moderately polarized and is related to either the O or X modes. For the frequency range of 2–18 GHz, gives a density of the source region of cm-3.
In the case of ECME, the polarized emission is related to the O, X, or Z modes. Emission at the fundamental gyrofrequency, , is unlikely to escape the source region, because of the strong gyroresonant absorption at the second harmonic. However, emisson at the second harmonic of the O or X modes may escape the source region and be highly polarized. The polarized emission at GHz places an upper limit of cm-3 on the electron density, since the ECME requires the plasma frequency to be less than the gyrofrequency. It also implies that the ambient magnetic field of the source region ( G) is in the range of 360 – 3200 G.
4.2 The radio emission compared to AE Aqr
The two physical constraints of a low density plasma and kiloGauss magnetic field restricts the location of the radio emission to a low density plasma in the magnetosphere of the WD or the lower corona of the donor star. Emission from the accretion stream or disk is therefore unlikely because the densities in those regions are too high ( cm-3 Barrett et al. 2020). We first consider emission from the WD magnetosphere. Assuming a 1 MG dipolar surface field for the WD, The strength of the magnetic field with radius is: G, where is the WD radius in cm. Therefore, the radio emission comes from a region between 7–14 WD radii for magnetic fields of 360–3200 G. These radii are much smaller than the radius of the donor star and are therefore likely to be modulated by the orbital period and eclipsed by the donor star. Although the radio observations are sparse and do not cover the orbital phase of the eclipse (0.95–0.05), neither the MeerKAT L band (Pretorius et al., 2021) nor VLA C band observations show any evidence of an orbital modulation. The MeerKAT observations occur during orbital phases 0.25–0.44 and our VLA observation during phases 0.08–0.32. Therefore, emission from the WD magnetosphere is problematic.
Based on these arguments, the donor star’s corona is the most likely location of the radio emission. Roche tomography of the donor star of AE Aqr (Dunford & Smith, 2005; Watson et al., 2006; Smith et al., 2012) shows that % of its surface is affected by high-latitude starspots similar to that seen in Doppler images of rapidly rotating isolated stars. This implies that the donor star in AE Aqr is highly active, which is expected for a rapidly rotating star ( days), because the magnetic dynamo saturates at about this spin period. We propose that the donor star in J0240+19 is also magnetically active and is the source of the radio emission. This means that the surface field of the donor star is few kG in strength. It also provides an explanation of the random nature of the circular polarization in time and frequency due to a superposition of plasma radiation or ECME from several emitting plasmoids.
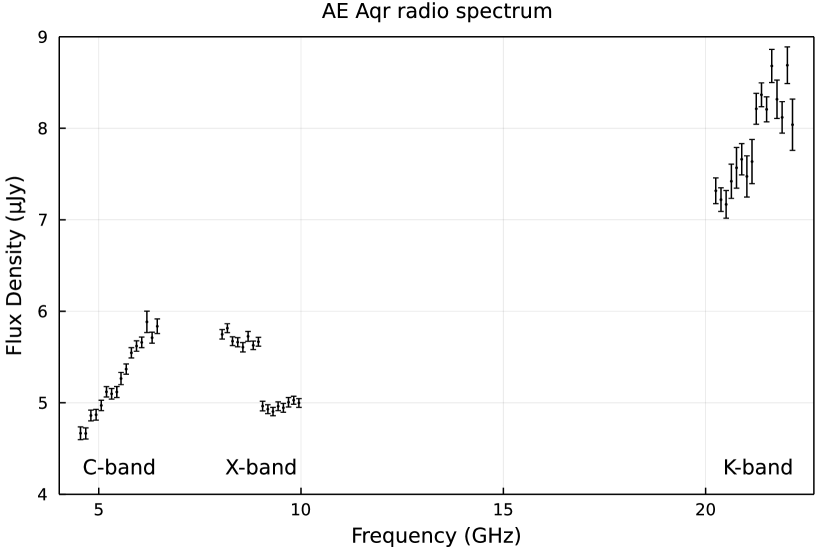
In order to compare the spectra of AE Aqr and J0240+19, we have reanalyzed one of the observations of AE Aqr by Barrett et al. (2017) from 2015. Figure 3 shows a positive spectral index between the C and K bands (6 GHz and 22 GHz, resp.). Because each band was observed several minutes apart and the radio emission varies rapidly (minutes), the X band (8 GHz) was caught during a period of negative spectral index. As noted previously, AE Aqr has a positive spectral index spanning over three orders of magnitude and only begins to turnover at THz. Also note that radio emission in all three bands is unpolarized (%). This spectrum is unlike that of the spectrum of J0240+19 with its negative spectral index and strong circular polarization. Instead, the spectrum of J0240+19 is similar to that of the nova-like V603 Aql, which on average has a negative spectral index between 2–12 GHz and shows strong, randomly varying, circular polarization (Coppejans et al., 2015; Barrett et al., 2017, 2020, 2021)111Although, V603 Aql has been suspected of being an IP, to date no optical or X-ray spin period has been detected (see e.g., Haefner & Metz 1985; Udalski & Schwarzenberg-Czerny 1989; Gnedin et al. 1990). In addition, the specific radio luminosities at 3 GHz are of similiar magnitude. That of J0240+19 is 7.3–18.3 ergs s-1 Hz-1 and that of V603 Aql is 2.0–3.5 ergs s-1 Hz-1. These luminosities are in the range of 1–50 ergs s-1 Hz-1, which is typical of most CVs (See Figure 2 of Pretorius et al. 2021).
5 Conclusions
The three hours of VLA observations of J0240+19 show a spectrum and light curve that are dissimilar to those of AE Aqr. The spectrum has a negative spectral index between 2–26 GHz and the emission shows periods of high circular polarization, while those of AE Aqr show a positive spectral index and unpolarized emission. The radio emission from J0240+19 is characteristic of magnetic plasma radiation or electron cyclotron maser emission, while that of AE Aqr and AR Sco is characteristic of synchrotron emission. Therefore, the radio emission from J0240+19 is unlike that of AE Aqr and AR Sco, although the characteristics of their optical emission are very similar. The radio emission from J0240+19 is similar to most radio-emitting magnetic CVs and is most similar to the nova-like CV V603 Aql, which is suspected of containing a rapidly spinning WD.
We argue that the source of the radio emission in J0240+19 is the magnetically active donor star and not a low density region of the magnetosphere near the WD, because the radio light curves show no evidence of an orbital modulation. If the radio emission is from the WD magnetosphere, then it should be eclipsed during inferior conjunction, because of its proximity to the WD. We therefore encourage additional radio observations to refute this assertion by looking for radio eclipses. Although J0240+19 is a weak radio source ( mJy), it is a persistent source in a high-inclination, eclipsing CV, making it a good laboratory for studying radio emission from CVs.
6 Acknowledgements
We thank Paul Mason for a critical reading of the manuscript and several useful comments. The National Radio Astronomy Observatory is a facility of the National Science Foundation operated under cooperative agreement by Associated Universities, Inc.
References
- Abada-Simon et al. (2005) Abada-Simon, M., et al. 2005, A&A, 433, 1063.
- Barrett et al. (2017) Barrett, P. E., Dieck, C., Beasley, A. J., Singh, K. P., & Mason, P. A. 2017, AJ, 154, 252–260.
- Barrett et al. (2020) Barrett, P., Dieck, C., Beasley, A. J., Mason, P. A., & Singh, K. P. 2020, AdSpR, 66, 1226.
- Barrett (2021) Barrett, P. 2021, in preparation.
- Barrett et al. (2021) Barrett, P., Dieck, C., Beasley, A. J., Mason, P. A., & Singh, K. P. 2021, in preparation.
- Bastian & Bookbinder (1987) Bastian, T. S. & Bookbinder, J. A. 1987, Nature, 326, 678.
- Bastian et al. (1988) Bastian, T. S., Dulk, G. A., & Chanmugam, G. 1988, ApJ, 324, 431.
- Bookbinder & Lamb (1987) Bookbinder, J. A. & Lamb, D. Q. 1987, ApJ, 323, L131.
- Coppejans et al. (2015) Coppejans, D. L., Körding, E. G., Miller-Jones, J. C. A., Rupen, M. P., Knigge, C., Sivakoff, G. R., & Groot, P. J. 2015, MNRAS, 451, 3801.
- de Jager et al. (1994) de Jager, O. C., Meintjes, P. J., O’Donoghue, D., & Robinson, E. L. 1994, MNRAS, 267, 577.
- Dunford & Smith (2005) Dunford, A. & Smith, R. C. 2005, ASPConf (eds. Hameury & Lasota), 330, 399.
- Dubus et al. (2007) Dubus, G., Taam, R. E., Hull, C., Watson, D. M., & Mauerhan, J. C. 2007, ApJ, 663, 516.
- Eracleous & Horne (1996) Eracleous, M. & Horne, K. 1996, ApJ, 471, 427.
- Gaia Collab. (2020) Gaia Collaboration, Brown, A. G. A., Vallenari, Prusti, A. T., de Bruijne, J. H. J., Babusiaux, C., & Biermann, M. (2020), arXiv 2012.01533.
- Garnavich et al. (2021) Garnavich, P., Littlefield, C., Wagner, R. M., van Roestel, J., Jaodand, A. D., Szkody, P., & Thorstensen, J. R. 2021, ApJ, 917, 22.
- Gnedin et al. (1990) Gnedin, Y. N., Borisov, N. V., & Natsvlishvili, T. M., 1990, Soviet Astro Let, 16, 272.
- Haefner & Metz (1985) Haefner, R. & Metz, K. 1985, A&A, 145, 311.
- Lacy et al. (2020) Lacy, M., Baum, S. A., Chandler, C. J., Clarke, T. E., Deustua, S., et al., 2020, PASP, 132, 1.
- Littlefield & Garnavich (2020) Littlefield, C. & Garnavich, P. 2020, RNAAS, 4, 171.
- McMullin et al. (2007) McMullin, J. P., Waters, B., Schiebel, D., Young, W., & Golap, K. 2007, Astronomical Data Analysis Software and Systems XVI (ASP Conf. Ser. 376), ed. R. A. Shaw, F. Hill, & D. J. Bell (San Francisco, CA: ASP), 127.
- Meintjes et al. (2015) Meintjes, P., Odendaal, A., & van Heerden, H. 2015, AcPPP, 2, 86.
- Patterson (1979) Patterson, J. 1979, ApJ, 234, 978.
- Pelisoli et al. (2021) Pelisoli, I., Marsh, T. R., Dhillon, V. S., Breedt, E., Brown, A. J., Dyer, M. J., Green, M. J., Kerry, P., Littlefair, S. P., Parsons, S. G., Sahman, D. I., & Wild, J. F. 2021, MNRAS, in press.
- Perley & Sault (2014) Perley, R. & Sault, B. 2014, EVLA Memo 178.
- Pretorius et al. (2021) Pretorius, M. L., Hewitt, D. M., Woudt, P. A., Fender, R. P., Heywood, I., Knigge, C., Miller-Jones, J. C. A., Buckley, D. A. H., Worters, H. L., Potter, S. B., & Williams, D. R. A. 2021, MNRAS, 503, 3692.
- Smith et al. (2012) Smith, R. C., Dunford, A., & Watson, C. A. 2012, SAIt (eds. Giovanelli & Sabau-Graziati), 83, 708.
- Thorstensen (2020) Thorstensen, J. R. 2020, AJ, 160, 151.
- Torkelsson (2013) Torkelsson, U. 2013, IAUS, 290, 145.
- Udalski & Schwarzenberg-Czerny (1989) Udalski, A. & Schwarzenberg-Czerny, A. 1989, Act Astron, 39 125.
- van der Laan (1963) van der Laan, H. 1963, MNRAS, 126, 535.
- van der Laan (1966) van der Laan, H. 1966, Nat, 211, 1131.
- VLA SUS (2021) Very Large Array Science User Support 2021, science.nrao.edu/facilities/vla/docs/manuals/oss/performance/fdscale
- Watson et al. (2006) Watson, C. A., Dhillon, V. S., & Shahbaz, T. 2006, MNRAS, 368, 637.
- Wynn & King (1995) Wynn, G. A. & King, A. R. 1995, MNRAS, 275, 9.
- Wynn et al. (1997) Wynn, G. A., King, A. R., & Horne, K. 1997, MNRAS, 286, 436.