SQuIGGE: Studying Quenching in Intermediate- Galaxies— Gas, Anguar Momentum, and Evolution
Abstract
We describe the SQuIGGE survey of intermediate-redshift post-starburst galaxies. We leverage the large sky coverage of the SDSS to select recently-quenched galaxies at based on their unique spectral shapes. These bright, intermediate-redshift galaxies are ideal laboratories to study the physics responsible for the rapid quenching of star formation: they are distant enough to be useful analogs for high-redshift quenching galaxies, but low enough redshift that multi-wavelength follow-up observations are feasible with modest telescope investments. We use the Prospector code to infer the stellar population properties and non-parametric star formation histories of all galaxies in the sample. We find that SQuIGGE galaxies are both very massive () and quenched, with inferred star formation rates , more than an order of magnitude below the star-forming main sequence. The best-fit star formation histories confirm that these galaxies recently quenched a major burst of star formation: of SQuIGGE galaxies formed at least a quarter of their total stellar mass in the recent burst, which ended just Myr before observation. We find that SQuIGGE galaxies are on average younger and more burst-dominated than most other post-starburst galaxy samples. This large sample of bright post-starburst galaxies at intermediate redshift opens a wide range of studies into the quenching process. In particular, the full SQuIGGE survey will investigate the molecular gas reservoirs, morphologies, kinematics, resolved stellar populations, AGN incidence, and infrared properties of this unique sample of galaxies in order to place definitive constraints on the quenching process.
1 Introduction
For nearly a century, astronomers have divided galaxies into two distinct categories based on their morphologies: spirals and ellipticals (Hubble 1926). This “galaxy bimodality” has since been shown to extend to a myriad of other properties, including color, size, environment, molecular gas content, and star formation rate (e.g., Blanton et al. 2003; Kauffmann et al. 2003; Shen et al. 2003; Noeske et al. 2007; Wuyts et al. 2011). Star-forming galaxies tend to be large, blue, rotationally-supported, and gas-rich; in contrast, quiescent galaxies are red, smaller at fixed mass, supported by random motions, and gas-poor. However, the fundamental question of why this galaxy bimodality exists remains unanswered to the present day. What physical processes are responsible for “quenching” star formation in galaxies? And why does a cessation of star formation appear to go hand-in-hand with structural and kinematic changes?
A variety of theoretical mechanisms have been proposed to form massive compact quiescent galaxies. These proposed mechanisms range from intense centrally-concentrated starbursts triggered by gas-rich major mergers (e.g., Hopkins et al. 2008, Wellons et al. 2015), very early assembly in a much denser universe (e.g., Naab et al. 2009, Wellons et al. 2015), or “morphological” quenching, where the transition from disk to spheroid stabilizes gas reservoirs (e.g., Martig et al. 2009). While all of these mechanisms could shut down star formation by depleting, removing, heating, or stabilizing molecular gas reservoirs, the resulting quenched galaxies differ in key observables including age gradients, rotational support, and morphology. Detailed multi-wavelength follow up of quenched galaxies holds the key to distinguishing between these theoretical quenching mechanisms. This multi-wavelength follow-up is most effective when performed in galaxies that have just concluded their major star-forming phase: the signatures of the quenching mechanism should still be apparent, and not diluted by later mergers or secular evolution. The question then becomes how to identify these recently-quenched galaxies.
Growing observational evidence suggests that there are at least two distinct pathways to quenching: galaxies can quench rapidly through the post-starburst phase, or quench slowly through the green valley phase (e.g., Barro et al. 2013, 2014; Schawinski et al. 2014; Wild et al. 2016; Carnall et al. 2018; Forrest et al. 2018; Wu et al. 2018; Rowlands et al. 2018; Belli et al. 2019; suess21). In this paper, we focus on the rapid quenching mode. These fast-quenching post-starburst galaxies, sometimes also called “K+A” or “E+A” galaxies, experienced a recent burst of intense star formation that concluded within the past gigayear (e.g., Dressler & Gunn 1983; Couch & Sharples 1987; see French 2021 for a recent review). Observationally, these galaxies are characterized by spectra that are dominated by A-type stars: the burst finished long enough ago that the most massive stars have died, but recently enough that the slightly longer-lived and less massive stars are still alive to dominate the optical spectrum. These spectra typically show strong Balmer breaks, deep Balmer absorption lines, weak or absent nebular emission lines, and blue slopes redward of the Balmer break.
A variety of observational techniques have been used to select post-starburst galaxies over a wide redshift range. “E+A” or “K+A” post-starburst galaxies in the local Universe are often selected by their high H equivalent widths and low [OII] luminosities; in combination, these spectral features indicate significant recent star formation but little ongoing star formation (e.g., Zabludoff et al. 1996; Dressler et al. 1999; Goto 2005; Brown et al. 2009; French et al. 2015). Some works use spectral template fitting approaches, which can identify galaxies whose light is dominated by young stars (e.g., Quintero et al. 2004; Pattarakijwanich et al. 2016). An alternate technique pioneered by Wild et al. (2014) uses principal component analysis (PCA), which effectively selects for the unique spectral shape of post-starburst galaxies (see also, e.g., Almaini et al. 2017; Maltby et al. 2018). A similar spectral shape indentification approach was also used by Kriek et al. (2010), using synthetic rest-frame colors instead of PCA-based “supercolors”. Finally, some studies have selected post-starburst galaxies based on their location in the plane (e.g., Whitaker et al. 2012a; Belli et al. 2019; Suess et al. 2020; see also Akins et al. 2021). These different methods of selecting post-starburst galaxies produce samples that are relatively similar, but do not fully overlap; we will explore the differences in these sample selection methods in more detail later in this paper.
While massive post-starburst galaxies are relatively rare across cosmic time (making up of the total population at , Wild et al. 2016), their number density evolves rapidly with redshift. At , post-starburst galaxies are common enough to explain half of the total growth in the red sequence; by , they represent just of all transitioning galaxies (Belli et al. 2019). By , massive post-starburst galaxies are so rare that they contribute negligibly to the growth of the quiescent population (Rowlands et al. 2018). These results imply that, while post-starburst galaxies play an important role in quenching at cosmic noon, their importance to the overall landscape of galaxy transformation diminishes towards lower redshifts.
The nature of post-starburst galaxies may also differ between and . Higher-redshift post-starburst galaxies generally appear to be more burst-dominated than their low-redshift counterparts: simple modeling of H and values indicates that post-starburst galaxies formed just of their mass in the recent burst, whereas post-starburst galaxies appear to have formed the majority of their mass in the recent burst (Suess et al. 2017). Full spectral modeling of post-starburst star formation histories (SFHs) confirms these findings: the median burst mass fraction of post-starburst galaxies is (French et al. 2018), in contrast to the median burst mass fractions of post-starburst galaxies (Wild et al. 2020). Low-redshift post-starburst galaxies also tend to be less massive than their higher-redshift counterparts (e.g., Wild et al. 2016; Rowlands et al. 2018), although they are not so low-mass that environmental effects play significant roles in their quenching, (e.g. Zabludoff et al. 1996; Feldmann et al. 2011). Taken together, these results indicate that high-redshift post-starburst galaxies are in the process of rapidly quenching their primary epoch of star formation, whereas low-redshift post-starburst galaxies are rapidly shutting down a smaller burst of late-time star formation that does not contribute as significantly to their stellar mass.
This redshift dependence complicates observational studies of quenching: pinpointing the physics responsible for shutting down the bulk of star formation requires looking beyond the local universe, but detailed follow-up observations require significant (and potentially prohibitive) telescope investments at . Even spectroscopic confirmation of post-starburst galaxies is difficult at , with samples consisting of a few tens of galaxies (e.g., Bezanson et al. 2013; Maltby et al. 2016; Wild et al. 2020) as opposed to the hundreds or thousands of post-starburst galaxies that can be identified from large all-sky surveys (e.g., Dressler et al. 1999; Quintero et al. 2004; Goto 2005; Brown et al. 2009; French et al. 2015; Alatalo et al. 2016).
Our goal in this paper is to bridge the gap between these low- and high-redshift samples by selecting bright intermediate-redshift post-starburst galaxies at that will serve as the ideal testbeds to understand the physics of quenching. We aim to find a large sample of galaxies that have high burst mass fractions and are therefore in the process of shutting down their major epoch of star formation. At the same time, we want these galaxies to be bright enough to conduct full multi-wavelength follow-up studies with reasonable telescope investments. These bright, massive, intermediate-redshift post-starburst galaxies will not provide us with a complete census of how star formation shuts down across all stellar masses and timescales; however, they will serve as excellent laboratories to study how rapid quenching proceeds in massive galaxies. This sample selection is now possible due to the SDSS, which provides millions of spectra over our targeted redshift range. This enormous public database allows us to identify a statistically large sample of rare bright, young post-starburst systems. With this sample, we will be Studying Quenching in Intermediate-z Galaxies– Gas, anguar momentum, and Evolution (SQuIGGE). The SQuIGGE sample will serve as the ideal testbed to study the quenching process in massive galaxies in detail.
This paper is organized as follows. In Section 2, we describe our post-starburst sample selection. We also generate mock galaxy spectra with known properties, and use those mocks to investigate what types of galaxies are included in our sample selection. In Section 3, we use the Prospector Bayesian stellar population synthesis code to fit the stellar masses, dust properties, and star formation histories of the galaxies in our sample. In particular, we use these derived star formation histories to investigate how long SQuIGGE post-starburst galaxies have been quiescent, the fraction of their mass that was formed in a recent starburst, and their ongoing star formation rates (SFRs). In Section 4, we calculate SFRs from spectral lines present in the SDSS spectra of our galaxies, and compare these results to the Prospector SFRs. In Section 5, we place the SQuIGGE sample in context by comparing it to other post-starburst samples. Finally, in Section 6 we briefly describe the science objectives of the remainder of the SQuIGGE survey. Throughout this paper we assume a flat CDM cosmology with , , and . We also assume a Chabrier (2003) initial mass function.
2 Sample Selection
In this section, we describe how we select post-starburst galaxies from the SDSS. Our selection is designed to select the brightest, most massive, most burst-dominated post-starburst galaxies at , with the goal of identifying galaxies that are ideal targets for multi-wavelength follow-up studies of the quenching process. We explore the differences between our sample selection algorithm and those used in previous studies in Section 5.
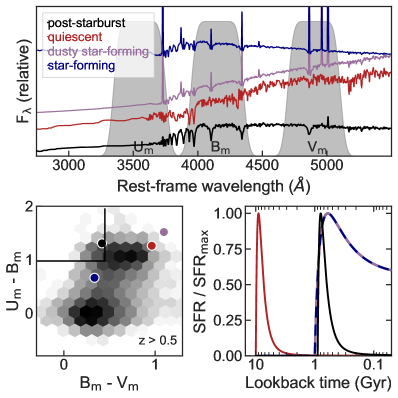
For the SQuIGGE sample, we follow the Kriek et al. (2010) method and select post-starburst galaxies from the SDSS based on their unique spectral shapes. Synthetic medium-band rest-frame , , and filters are designed to target both the Balmer break and the slope of the spectrum redward of the break; as shown in Figure 1, these two rest-frame colors alone are effective at selecting post-starburst galaxies. Model spectra (generated with FSPS, Conroy et al. 2009; Conroy & Gunn 2010) of a post-starburst galaxy (black), a fully quiescent galaxy (red), an unobsured star-forming galaxy (blue) and a dusty star-forming galaxy (purple) are shown over the same wavelength range. The bottom left panel in Figure 1 shows the location of these four spectra in space, as well as the density of all SDSS spectra with . Our post-starburst color selection cuts, described in detail below, are shown with black lines. The color cuts include the post-starburst galaxy while excluding both star-forming and older quiescent galaxies; just of all galaxies in the SDSS satisfy these color cuts. Figure 1 shows that unobscured star-forming galaxies— including galaxies which may have ongoing starbursts— have similar colors to post-starburst galaxies, but weaker Balmer breaks that do not satisfy our cut. In contrast, both dusty star-forming galaxies and older quiescent galaxies have similar colors as post-starburst galaxies, but redder colors. Spectrally, older quiescent galaxies and post-starburst galaxies can be distinguished by the differences in the strength of the Balmer break, the slope of the spectrum redward of the break, and the depth of both the Balmer absorption lines and the Calcium H & K lines. Dusty star-forming galaxies differ from post-starburst galaxies mainly in the slope of the spectrum redward of the Balmer break and the strength of the nebular emission lines.
Our parent sample consists of all 1,921,000 galaxies in the SDSS DR14 spectroscopic catalog (Abolfathi et al. 2018) with . We then make a quality cut which removes non-physical spectra: we calculate the and colors from the SDSS spectrum, and remove any galaxies for which these spectral colors differ from the SDSS photometric colors by more than 0.25 dex. We note that at these redshifts, the fiber encompasses of the total light from these compact post-starburst galaxies; typically the spectral and photometric colors are within 0.05 dex. We ensure that the wavelength range of the SDSS spectrum covers our rest-frame , , and filters, then calculate the flux in each synthetic rest-frame filter. To ensure high quality spectra, we require a signal-to-noise ratio (S/N) in both our and filters; this S/N cutoff was chosen by examining representative spectra by eye. We do not require a minimum S/N in the filter, because post-starburst galaxies typically have minimal UV flux and thus low S/N blueward of the Balmer break (see, e.g., Figure 1). 32,168 galaxies remain in the parent sample after these initial quality cuts. Finally, we select all objects in this sample with and as post-starburst galaxies. Our final sample includes 1,318 unique post-starburst galaxies. These galaxies form the full SQuIGGE sample.
Figure 2 shows histograms of the redshift and -band magnitude distribution of the full SQuIGGE sample. By construction, all galaxies have . The median sample redshift is , with a tail of galaxies up to . This redshift distribution is effectively a competition between apparent magnitude (there are fewer high-S/N SDSS spectra at higher redshift) and the number density evolution of post-starburst galaxies (there are many more post-starburst galaxies at higher redshift, e.g., Wild et al. 2016; Belli et al. 2019). The -band magnitudes of SQuIGGE galaxies range from 17.9 to 20.5, with the faint end cutoff primarily driven by our S/N cut.
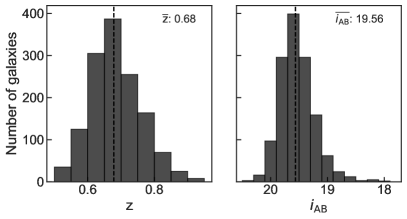
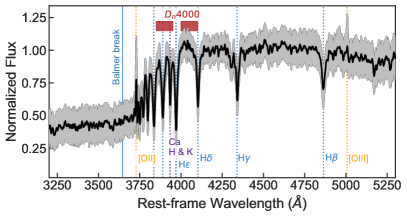
Figure 3 shows a stacked spectrum of all 1,318 post-starburst galaxies in SQuIGGE, normalized using the flux between 4150 and 4250 Å. The grey shaded region shows the 16-84th percentile of all spectra. This stacked spectrum clearly shows the representative characteristics of a post-starburst galaxy: a strong Balmer break, deep Balmer absorption lines, and weak [O ii] emission. Spectral modeling (Section 3) indicates that 98% of SQuIGGE galaxies have star formation rates below the main sequence, and 95% of SQuIGGE galaxies formed of their stellar mass in a recent burst; this indicates that our sample selection technique is very effective at identifying recently-quenched galaxies.
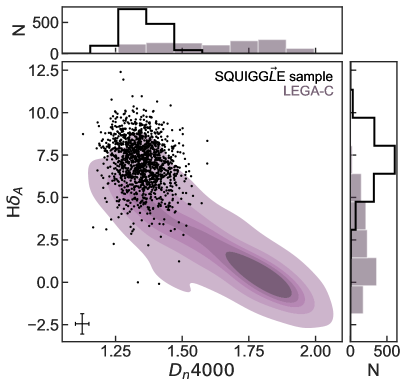
We also measure the H equivalent width and the index for all galaxies in our sample. H traces recent star formation, while probes the age of the stellar population; together, these indices provide a fairly reliable indication of the galaxy’s evolutionary stage. We use the pyphot python package to calculate H, and obtain error bars via bootstrap resampling. We measure from the SDSS spectra using the bandpass definitions from Balogh et al. (1999). In Figure 4, we show H as a function of for all galaxies in our sample (black points). To help place SQuIGGE galaxies in context, Figure 4 also shows star-forming and quiescent galaxies from the LEGA-C spectroscopic survey (van der Wel et al. 2016) with and . This mass and redshift range roughly matches that of SQuIGGE, though LEGA-C’s relatively small area means that it lacks the highest stellar masses found in SQuIGGE.
Despite the fact that we do not explicitly select post-starburst galaxies using either of these two indices (unlike some post-starburst galaxy selection techniques, which use an H cut), we see that SQuIGGE galaxies are clustered at high H and low . This result confirms that the galaxies in the SQuIGGE sample are indeed fairly young. We again see that SQuIGGE galaxies lie in a relatively extreme region of parameter space compared to the overall galaxy population. These extreme H and values hint at the fact that SQuIGGE galaxies have distinct star formation histories from the majority of galaxies at similar redshifts and stellar masses; we will explore this in greater detail in Section 3.
Table 1 lists the basic properties of the post-starburst galaxies identified by SQuIGGE.
| SDSS ID | RA (deg) | Dec (deg) | H (Å) | (km/s)a | aperture correction | ||
|---|---|---|---|---|---|---|---|
| spec-6137-56270-0195 | 353.79039 | 16.10073 | 0.7473 | 7.860.51 | 1.120.02 | 18652 | 1.50 |
| spec-0978-52431-0077 | 260.01290 | 30.28743 | 0.6840 | 9.450.33 | 1.160.01 | 22342 | 1.07 |
| spec-5192-56066-0419 | 238.72249 | 38.33752 | 0.7237 | 7.490.62 | 1.310.03 | 222123 | 1.21 |
| spec-5288-55865-0858 | 132.07321 | 13.07628 | 0.5233 | 8.530.47 | 1.190.02 | 21153 | 0.95 |
| spec-4575-55590-0605 | 144.35677 | 36.50522 | 0.6206 | 8.110.43 | 1.300.02 | 16720 | 1.39 |
| spec-3817-55277-0279 | 135.90519 | 3.81953 | 0.7570 | 4.540.50 | 1.340.02 | 26146 | 1.47 |
| spec-5140-55836-0177 | 21.74532 | 14.35716 | 0.6946 | 7.870.53 | 1.270.02 | 16443 | 1.35 |
| spec-1630-54476-0502 | 53.22548 | -6.20368 | 0.5715 | 5.020.39 | 1.300.02 | 23933 | 1.29 |
| spec-3754-55488-0041 | 120.22957 | 32.94343 | 0.7037 | 5.260.65 | 1.400.03 | 26562 | 1.64 |
| spec-6649-56364-0311 | 166.58688 | 45.04543 | 0.6391 | 6.530.59 | 1.320.03 | 19135 | 1.72 |
| spec-5048-56218-0165 | 337.14303 | 10.75239 | 0.6671 | 7.820.71 | 1.300.03 | 12965 | 1.57 |
| spec-6054-56089-0547 | 225.25613 | 42.77234 | 0.6094 | 5.580.39 | 1.300.02 | 23428 | 1.45 |
| spec-4403-55536-0765 | 27.85715 | 6.27124 | 0.6698 | 5.280.64 | 1.210.02 | 23250 | 1.72 |
| spec-6032-56067-0159 | 236.68717 | 45.81196 | 0.6819 | 8.750.63 | 1.240.03 | 20564 | 1.26 |
| spec-6639-56385-0597 | 177.92877 | 43.34649 | 0.7691 | 7.640.73 | 1.260.02 | 22947 | 1.58 |
| spec-4013-55629-0073 | 228.42489 | 2.08515 | 0.7409 | 5.920.52 | 1.290.02 | 14640 | 1.48 |
| spec-5993-56070-0251 | 199.47152 | 22.03277 | 0.7208 | 7.730.44 | 1.210.02 | 21857 | 1.68 |
| spec-5014-55717-0745 | 257.42214 | 27.66418 | 0.6926 | 8.970.69 | 1.360.03 | 17552 | 1.35 |
| spec-5291-55947-0601 | 132.52735 | 11.19210 | 0.6111 | 6.980.57 | 1.160.02 | 28821 | 1.35 |
| spec-5475-56011-0379 | 222.19133 | 10.16960 | 0.6462 | 7.280.34 | 1.230.01 | 20930 | 1.71 |
| … | … | … | … | … | … | … |
-
a
From the pPXF fits described in Greene et al. (2020).
-
•
(This table is available in its entirety in a machine-readable form in the online journal. A portion is shown here for guidance regarding its form and content.)
2.1 Why were these galaxies targeted by SDSS?
Here, we examine the target flags of the selected SQuIGGE galaxies to understand why they were included in the SDSS spectroscopic sample. The vast majority of SQuIGGE galaxies— 1,132 out of 1,318, — are part of the main “CMASS” BOSS sample (Dawson et al. 2013). The CMASS selection used color-magnitude cuts designed to target massive galaxies at . An additional 11 galaxies are part of the sparse CMASS sample, which includes fainter and bluer galaxies than the main CMASS sample. 64 galaxies are part of the “commissioning” CMASS sample, which used slightly different color cuts than the final CMASS survey. The remaining 111 PSBs were targeted as part of 24 different programs within SDSS. The majority of these 111 galaxies were selected as BOSS ancillary targets because their or WISE colors resembled those of high-redshift quasars or LRGs. Several others were selected because they had matches in the Chandra Source Catalog (Evans et al. 2010) or the FIRST radio survey (Becker et al. 1995, see also Greene et al. 2020). Galaxies with non-CMASS target flags tend to be slightly brighter and lie at lower redshifts than the median of the full SQuIGGE sample.
2.2 Understanding our sample selection: how do physical parameters map onto and colors?
In order to understand the types of galaxies that fall into our color-based selection method, we generate a set of mock SDSS-like spectra then map their physical properties onto color space. We generate these mock galaxy spectra using FSPS (Conroy et al. 2009; Conroy & Gunn 2010) assuming a Chabrier (2003) IMF, the Calzetti et al. (2000) dust law, a total stellar mass of , and a velocity dispersion of 200 km/s. We vary the dust attenuation (), the metallicity (), and the spectral S/N (10-90% noise levels of our observed SQuIGGE spectra). We model the SFHs of the mock galaxies as a delayed component plus a recent top-hat burst; we vary the mass fraction in the recent burst ( ), the duration of the recent burst ( /Myr ), the time since quenching (), and the star formation rate after quenching (e.g., the amount of “frosting”, ). We explain the generation of these mock spectra in more detail in a forthcoming paper, Suess et al. in prep., which examines the best methods to recover accurate SFHs for post-starburst galaxies.
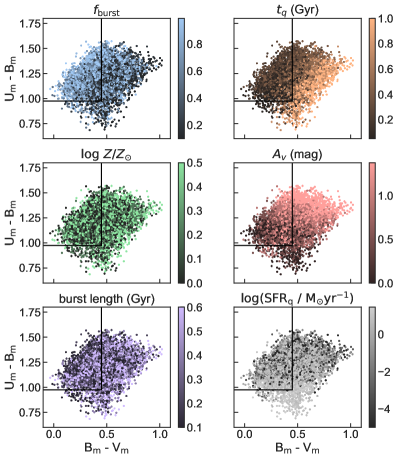
We generate 5,000 mock galaxy spectra, then run our color-based selection algorithm (Section 2) on the set of mock spectra. 1,821 of the 5,000 of the mock galaxies are classified as post-starburst by our sample selection criteria. Figure 5 shows versus for all 5,000 mock spectra. Each panel is colored by a different physical parameter, and our post-starburst color cuts are shown by the solid black lines. While , , Av, and SFRq show clear gradients across space, neither metallicity nor the length of the recent burst exhibit coherent trends. This indicates that our sample selection does not prefer galaxies of a specific or metallicity. However, the galaxies that we select as post-starburst tend to have high , low , and relatively low Av and SFRq. This indicates that our sample selection algorithm is sensitive to relatively dust-free galaxies that recently quenched after a large starburst— exactly the types of galaxies we were attempting to target.
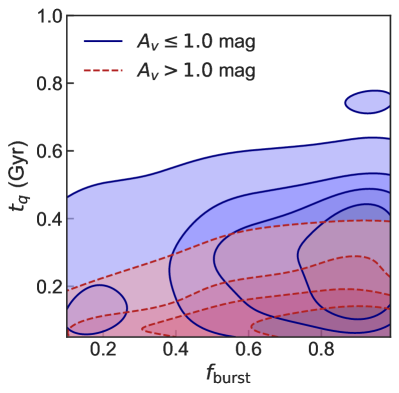
We also briefly explore correlations between these parameters. Figure 6 shows time since quenching as a function of burst mass fraction for the mock galaxies which are classified as post-starburst by our selection algorithm. The blue contours show relatively dust-free mock post-starburst galaxies, and the red contours show the dusty mock post-starburst galaxies. Relatively dust-free post-starburst galaxies can be found at a range of and values. However, dusty galaxies are only classified as post-starburst if they quenched very recently, within the past Myr. We can therefore expect that, while the majority of galaxies in the SQuIGGE sample are likely not highly dust-obscured, some especially young dusty galaxies may be included in the sample. We do not find a significant difference in the and values of low- and high-SFR mock post-starburst galaxies.
3 extracting star formation histories via spectral energy distribution fitting
In this section, we use the Prospector stellar population synthesis fitting code (Johnson & Leja 2017; Leja et al. 2017; Johnson et al. 2020) to investigate the stellar masses, dust properties, metallicities, SFRs, and star formation histories (SFHs) of galaxies in the SQuIGGE sample.
Robust SFHs provide a wealth of information, allowing us to investigate how long these galaxies have been quenched (), the fraction of their mass that was formed in the recent burst (), and the timescale of both the recent burst and the quenching process. However, traditional “parametric” SFH models that depend on just a few parameters impose strong priors on sSFRs and mass-weighted ages, and results from these parametric fits may not accurately reflect the true mass assembly histories of galaxies (e.g., Carnall et al. 2019). Previous studies have worked to mitigate these biases by modeling post-starburst SFHs as the sum of two parametric components, one for the recent burst and one for the older stellar population (e.g., Kaviraj et al. 2007; French et al. 2018; Wild et al. 2020). While this approach improves on traditional parametric approaches by allowing the mass fraction in the recent burst to vary, it still explicitly imposes a specific shape for the recent burst and may thus bias results. Here, we use a “non-parametric” form for the SFH, which allows for arbitrary SFR in adjacent timebins. This approach introduces a larger number of free parameters into the fit in exchange for allowing more flexibility and freedom in the derived SFH. These non-parametric SFHs have been shown to more accurately recover galaxy properties such as stellar mass (e.g., Lower et al. 2020). Here, we develop and use an non-parametric model specifically tuned to recover the SFHs of post-starburst galaxies. With these fits, we allow for full flexibility in the burst shape, burst duration, burst mass fraction, and quenching timescale of SQuIGGE post-starburst galaxies.
3.1 SED fitting setup
We fit the SEDs of all SQuIGGE galaxies using the Prospector stellar population synthesis fitting software (Johnson & Leja 2017; Leja et al. 2017; Johnson et al. 2020). We use the dynesty dynamic nested sampling package (Speagle 2020), the FSPS stellar population synthesis models (Conroy et al. 2009; Conroy & Gunn 2010), the MILES spectral library (Sánchez-Blázquez et al. 2006; Falcón-Barroso et al. 2011), and the MIST isochrones (Choi et al. 2016; Dotter 2016; based on MESA, Paxton et al. 2011, 2013, 2015). We assume the Chabrier (2003) initial mass function, fix the model redshift to the SDSS spectroscopic redshift, and add nebular emission to the spectra using the default fixed parameters in Prospector (see Byler et al. 2017). We fit for stellar mass and metallicity using the mass-metallicity prior described in Leja et al. (2019b). We also fit for the velocity dispersion of the SDSS spectra, using a gaussian prior with the mean and sigma of the output pPXF (Cappellari 2017) velocity dispersion fits (see Greene et al. 2020). We assume the Kriek & Conroy (2013) dust law, with a free Av and dust index; in this dust law, the bump strength is tied to the slope. Following e.g. Wild et al. (2020), we assume that the attenuation is doubled around young ( yr) stars. We fix the shape of the IR SED following the Draine & Li (2007) dust emission templates, with , , and . We also include both a spectroscopic jitter term and the Prospector pixel outlier model, which are designed to prevent mis-estimated spectroscopic uncertainties or bad spectral pixels from skewing the output.
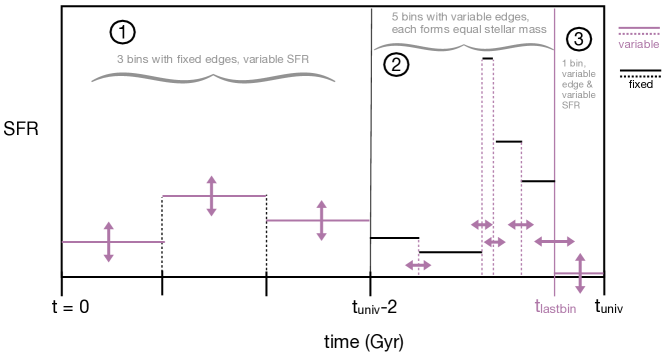
Our adopted SFH is a modified version of the flexible continuity prior from Leja et al. (2019a), and is illustrated in Figure 7. The SFH includes three fixed-edge time bins at the beginning of the universe, five flexible-edge time bins covering the 2 Gyr before observation, and a final bin where we fit for both the bin length and the SFR. All five of the flexible-edge bins form an equal stellar mass, and the edges of the flexible bins are adjusted at each likelihood call based on the log(SFR) ratio between adjacent bins; this parameterization is described in detail in Leja et al. (2019b). The SFH thus has nine free parameters: eight log(SFR) ratios, plus the width of the final timebin. Following Leja et al. (2019b), we place Student-t priors on the log(SFR) ratio between adjacent timebins. We center the priors such that they follow the predicted SFH for a massive quiescent galaxy at similar redshift from UniverseMachine (Behroozi et al. 2019). This prior is more physically-motivated than a prior centered at zero, which would imply that galaxies form stars at a constant rate across time. A forthcoming paper, Suess et al. in prep., describes this SFH model in more detail and presents mock recovery tests and comparisons with multiple other SFH parameterizations. The SFH we use here was designed to use a relatively small number of parameters to capture both a recent burst of arbitrary mass fraction and length, a variable quenching timescale, and a variable amount of residual star formation after the burst ends. Suess et al. in prep. shows that for SQuIGGE-like galaxies this fitting methodology recovers with just 0.06 dex of scatter and with 0.12 dex of scatter.
We define a “burst” for each galaxy based on the output SFH. We interpolate the SFH to a uniform 1 Myr time scale, then define the burst start and end as the time when the time derivative of the SFH rises above and drops below a threshold value. This threshhold is the same for all galaxies in the sample, and was tuned by visual examination of representative SFHs. In addition to basic quantities such as stellar mass and Av, we also report several quantities derived from this burst. We define as the time when the recent starburst ended based on our SFH derivative threshold; this quantity tells us how long the galaxy has been quenched. We also define to be the stellar mass formed in the burst, and to be the fraction of the total stellar mass formed during the burst. Suess et al. in prep. describes these definitions in more detail, and explores several alternate definitions of including the sSFR-based definitions used by Tacchella et al. (2021). While the exact numerical value of depends on the definition used, in general different definitions produce quantitatively similar results.
3.1.1 Data included in the SED fits
We fit the Prospector model described above jointly to both photometry and spectroscopy. We include the SDSS photometry and the WISE 3.4m and 4.6m photometric points. However, we do not include the WISE 12m and 24m photometry in our fit. Alatalo et al. (2017) shows that post-starburst galaxies in the local universe have complex and unusual mid-infrared properties: the WISE photometry of these galaxies cannot be reproduced by starlight alone, but appear to be significantly influenced by emission from AGN, PAH features, and/or AGB dust. Due to the complex and still poorly understood nature of this part of the spectrum, in particular for post-starburst galaxies, the mid-IR data points will not help constrain the properties we aim to address in this paper. We ensured that excluding these points did not bias our recovered SFRs: for a randomly-selected subsample of galaxies, there was no significant difference in the median SFR in fits where we included or excluded the WISE 12m and 24m photometry. Further analysis of the mid-IR data points are beyond the scope of this paper and will be subject to a future investigation. We discuss the WISE properties of our sample further in Section 3.3.

In addition to seven-band photometry, we fit the SDSS spectrum of each galaxy. We aperture-correct the spectrum using the observed SDSS photometry in the bands. We note that at , the diameter of the SDSS/BOSS fiber is larger than the effective radius of these compact post-starburst galaxies and thus the SDSS spectrum includes the majority of the light from each galaxy; our median aperture correction is a factor of 1.3. Maltby et al. (2018), Suess et al. (2020), and Setton et al. (2020) find that post-starburst galaxies have flat color gradients across similar spatial scales as the SDSS fiber, indicating that the aperture-corrected SDSS spectra are likely accurate reflections of the total integrated stellar light from these galaxies.
In our fits, we mask all spectral pixels within Åof the 3727Å[O ii] line, or within Åof the Å[O iii] line. Previous studies have found that [O ii] emission in post-starburst galaxies is primarily caused by LINER or AGN activity (e.g., Lemaux et al. 2010; Yan et al. 2006). Greene et al. (2020) shows that some SQuIGGE galaxies have extreme [O iii] equivalent widths, again due to the presence of AGN. Because it is currently not possible to model the AGN contribution to these forbidden lines in Prospector, we mask them in our fits. Unobscured AGN are too blue to fall into our color-based selection algorithm (Section 2). While Greene et al. (2020) does find an elevated occurance rate of obscured AGN in our sample, the continuum emission of all but the very most luminous obscured AGN are dominated by galaxy light. Masking [O ii] and [O iii] thus ensures that our fitting results are not dominated by AGN emission.
3.2 SED fitting results
| SDSS ID | (mag)a | dust indexa | (Myr) | |||
|---|---|---|---|---|---|---|
| spec-6137-56270-0195 | ||||||
| spec-0978-52431-0077 | ||||||
| spec-5192-56066-0419 | ||||||
| spec-5288-55865-0858 | ||||||
| spec-4575-55590-0605 | ||||||
| spec-3817-55277-0279 | ||||||
| spec-5140-55836-0177 | ||||||
| spec-1630-54476-0502 | ||||||
| spec-3754-55488-0041 | ||||||
| spec-6649-56364-0311 | ||||||
| spec-5048-56218-0165 | ||||||
| spec-6054-56089-0547 | ||||||
| spec-4403-55536-0765 | ||||||
| spec-6032-56067-0159 | ||||||
| spec-6639-56385-0597 | ||||||
| spec-4013-55629-0073 | ||||||
| spec-5993-56070-0251 | ||||||
| spec-5014-55717-0745 | ||||||
| spec-5291-55947-0601 | ||||||
| spec-5475-56011-0379 | ||||||
| … | … | … | … | … | … | … |
-
a
Assuming the Kriek et al. (2010) dust law.
-
•
(This table is available in its entirety in a machine-readable form in the online journal. A portion is shown here for guidance regarding its form and content.)
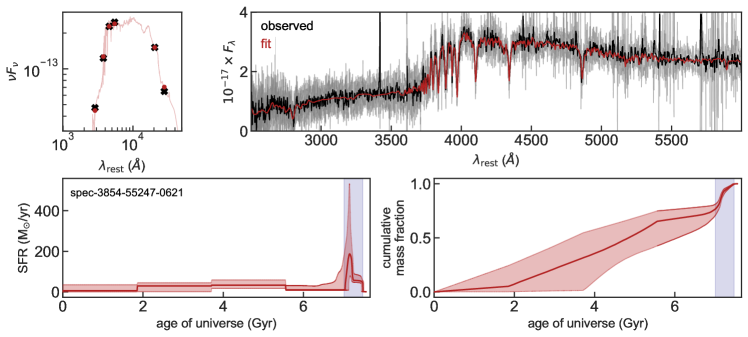
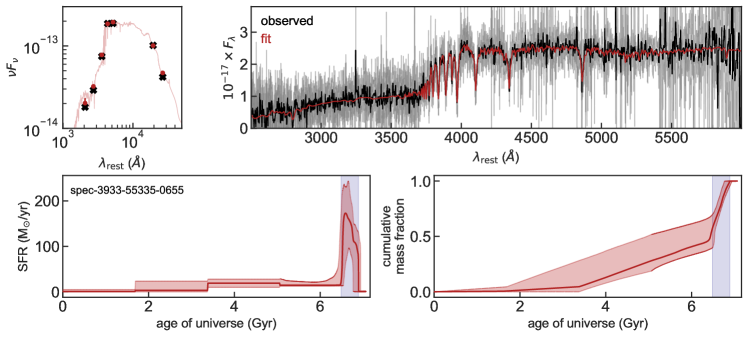
Here, we show the results of our SED fitting to the full SQuIGGE sample. Figure 8 shows example Prospector fits to three galaxies in SQuIGGE. The upper left panel shows the observed and best-fit SDSS and WISE photometry; the upper right panel shows the observed SDSS spectrum and the best-fit stellar population model; the lower left panel shows the derived SFH; as an alternate way of viewing the SFH, the lower right panel shows the cumulative mass fraction formed as a function of time. The shaded vertical blue region in the third and fourth columns marks the recent starburst (using the derivative-based method described in detail in Suess et al. in prep.). This figure illustrates that our data and modeling framework are able to place strong constraints on the SFH for each galaxy.
Figure 9 shows histograms of derived properties for the full SQuIGGE sample. These fits confirm that SQuIGGE galaxies are massive; nearly all galaxies in the sample have . This is not unexpected: these galaxies had to be bright enough to be targeted spectroscopically by SDSS and meet our S/N criterion. While lower-mass post-starburst galaxies may exist at , they would not be included in our sample; SQuIGGE was designed to select bright, massive, and burst-dominated galaxies that can serve as testbeds for the fast quenching process. SQuIGGE galaxies are likely the most extreme examples of what may be a much larger population of quenching galaxies. We also see that— as expected— the majority of SQuIGGE galaxies are relatively dust-free, with a median A mag. Very dusty post-starburst galaxies are generally too red to fall into our color-based sample selection (Section 2; Figure 6). The best-fit metallicities tend to be slightly supersolar, as expected for massive galaxies according to the Gallazzi et al. (2005) mass-metallicity prior we used in the fits. We see a wide range of dust indices, roughly spanning the prior range allowed in our fits. This is likely because our data have relatively little leverage on this parameter due to our short wavelength range and lack of UV and IR data. These massive galaxies have relatively high velocity dispersions, km/s, as expected from the pPXF results we used as a prior (Greene et al. 2020).

3.2.1 SED SFRs
Next, we use the Prospector fitting results to investigate where the SQuIGGE sample lies in relation to the star-forming main sequence: is star formation truly suppressed in these post-starburst galaxies? SED-based SFRs are notoriously tricky to calculate, and depend sensitively on the assumed SFH (e.g., Lee et al. 2009, 2010; Maraston et al. 2010; Wuyts et al. 2011). It is therefore essential that we test our SFH model and fitting framework before relying on SED SFRs. A forthcoming paper, Suess et al. in prep., fits the mock galaxies described in Section 2.2 and investigates how well the output SFHs capture the ongoing SFRs of the mock post-starburst galaxies. We find that SFRs above /yr are slightly underestimated ( dex median offset) but generally recovered well, with dex of scatter. However, below /yr the data do not have significant constraining power on the SFR. Given the high stellar masses of our galaxies, this limit corresponds to very low sSFRs of . Higher-quality spectra and/or additional wavelength coverage would likely be required to recover lower levels of ongoing star formation.
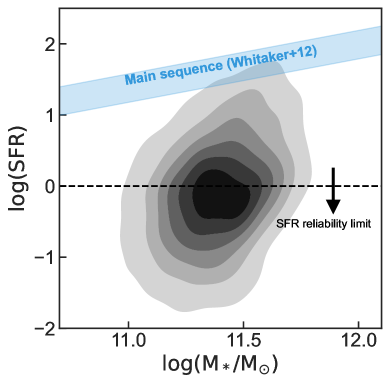
Figure 10 shows the derived SFRs as a function of stellar mass for all galaxies in the SQuIGGE sample. The shaded blue bar indicates the star-forming main sequence from Whitaker et al. (2012b). The dashed black line shows the reliability limit of our SFR measurements. The median SFR of the SQuIGGE galaxies is below our detectability threshold: the majority of SQuIGGE galaxies have /yr or less of ongoing star formation. This is more than an order of magnitude offset from the star-forming main sequence, which lies at /yr at this mass and redshift. While several galaxies in our sample do have higher ongoing SFRs, these galaxies are rare: just of SQuIGGE galaxies have SFRs on or above the star-forming main sequence.
We note that these SFRs are based on photometry with , and thus we cannot exclude the possibility that these objects host some amount of additional star formation that is fully obscured by dust. This would require optically thick dust: otherwise, dusty star-forming galaxies have colors that are too red to fall into our selection algorithm. Observations at rest-frame infrared or longer wavelengths, such as those described in Section 6, are required to fully rule out higher obscured SFRs (additionally see, e.g., Alatalo et al. 2017 and Smercina et al. 2018 for a discussion of the mid- and far-infrared properties of K+A galaxies). While in Section 3.3 we show that most of our sample is undetected in W4, these upper limits do not allow us to eliminate the possibility that some SQuIGGE galaxies could be highly dust-obscured star-formers.
3.2.2 Properties of the recent burst
The flexibility of our SFH model allows us to characterize the recent starburst. As described in detail in Section 3.1, we define the burst start and end based on the time derivative of the output SFH. Our modeling framework is able to accurately infer the end time of the recent burst () with a scatter of just 0.06 dex, as demonstrated in Suess et al. in prep. We are also able to place conservative limits on the mass fraction formed in the recent burst: while our recovered mass fractions tend to saturate at , we are able to recover lower burst mass fractions with high fidelity (scatter dex). This saturation is likely due to the fact that our prior assumes that the SFH follows the average UniverseMachine SFH of a massive quiescent galaxy (Behroozi et al. 2019); this effectively asserts that these quenched galaxies likely formed a significant amount of their mass at early times. This choice allows our model to effectively “hide” a large number of old, red stars under a large recent burst, disfavoring extremely high burst mass fractions.
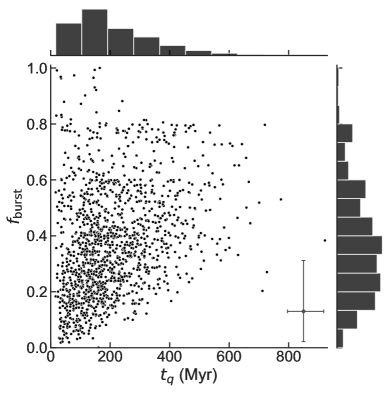
Figure 11 shows the time since quenching () as a function of the burst mass fraction (). These SED fitting results allow us to confirm that SQuIGGE galaxies recently quenched a major epoch of star formation. The quenching timescale distribution peaks at Myr, with a tail towards longer quenching times. Galaxies which quenched Myr ago make up just of the SQuIGGE sample. As expected based on their spectral shapes (Figure 3), our post-starburst sample does not include any galaxies which quenched more than a gigayear before observation. We find that galaxies with large values are included in our sample only if they also have relatively high values (as expected from Figure 6). The 16-84th percentile range on our inferred values is Myr, which corresponds to the main sequence lifetimes of stars. Thus, stars are generally the most massive stars we expect to be alive in SQuIGGE galaxies. This stellar mass corresponds roughly to the B4V classification, which is the boundary where stellar spectra begin to show very deep Balmer lines and strong Balmer breaks— exactly the spectral shapes we selected for. Our shortest recovered values are thus consistent with the main sequence lifetimes of the highest-mass stars we would expect to find in these galaxies.
Figure 11 also illustrates that, while SQuIGGE galaxies have a large range in burst mass fractions, in general these galaxies recently concluded a major burst. More than of SQuIGGE galaxies formed at least a quarter of their total stellar mass during the recent burst, and 20% of SQuIGGE galaxies formed more than half of their total stellar mass in the recent burst. Despite our relatively conservative priors on burst mass fraction, we find that SQuIGGE galaxies appear to be much more burst-dominated than local post-starburst galaxies; French et al. (2018) found that post-starburst galaxies often formed just of their mass during the recent starburst. By going to intermediate redshift, we were able to identify the tail end of the peak quenching era at cosmic noon.
3.3 SQuIGGE galaxies have anomalous mid-infrared properties
In the local universe, several studies have found that post-starburst galaxies have unusual mid-infrared properties. Alatalo et al. (2017) showed that post-starburst galaxies have strong infrared emission, shallow [3.4] - [4.6] colors, and flat or rising slopes at [12] - [22]. These properties are unlikely to be produced through star formation alone, and indicate the presence of AGN, strong PAH features, and/or significant contributions from dust-enshrouded AGB stars. Smercina et al. (2018) showed that post-starburst galaxies exhibit high PAH abundances and very strong PAH features as well as large reservoirs of warm dust indicating atypical radiation fields. These features are unusual for either star-forming or quiescent galaxies, and indicate that a “standard” SED fitting setup is unlikely to accurately reproduce the mid-infrared properties of post-starburst galaxies.
These results lead us to question whether the post-starburst galaxies in SQuIGGE may have unusually high WISE fluxes or anomalous WISE colors. Because the exact nature of the processes contributing to this mid-IR flux is uncertain, we did not include the WISE 12m (W3) or 22m (W4) photometry in our SED fitting. Here, we test whether the predicted WISE photometry from our Prospector modeling matches the observed data points.
We first carefully flag which SQuIGGE galaxies are detected in the W3 and W4 bands. We consider all W3 and W4 measurements to be detections. Because W1 and W2 are both significantly more sensitive than W3/W4 and have much better characterized PSFs, we then use the positions of W1 and W2 sources to confirm lower-S/N W3 and W4 sources. We consider W3 and W4 measurements at ( confidence) to be detections if they correspond to a W1/W2 source detected at . While individually these lower-S/N sources would not be formal detections, the combination of multiple bands of WISE imaging results in a robust identification of a source, albeit with large uncertainties on the individual WISE fluxes. For all sources that do not meet these criteria, we set robust upper limits on the W3 and W4 flux based on the measured background in the WISE bands. In total, we find that 511 SQuIGGE galaxies are detected in W3 and 176 are detected in W4.
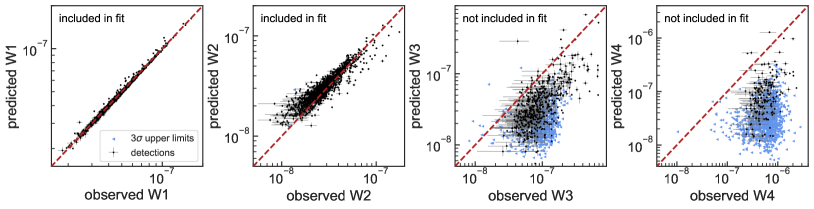
Figure 12 shows the WISE fluxes predicted from our Prospector modeling as a function of the observed WISE fluxes. The left two panels show W1 (3.4m) and W2 (4.6m), both of which are included in our Prospector fits; the right two panels show W3 (12m) and W4 (22m), which are not included in our fitting. The dashed red line in each panel shows the one-to-one relation. We find that the observed W1 and W2 values are well-matched by our fits, with a dex offset in W1 and a 0.03 dex offset in W2. However, the fluxes of SQuIGGE galaxies that are detected in W3 and W4 tend to be significantly underpredicted by our modeling. In W3, detected galaxies have fluxes dex higher than our predictions; for W4 detections, the observations are dex higher than the predictions. We note that including the W3 and W4 data points in our modeling does not resolve these offsets, indicating that the mid-infrared properties of these galaxies cannot be captured by our modeling framework. Understanding the nature of this excess mid-infrared flux is beyond the scope of this work, and will be studied in future SQuIGGE papers.
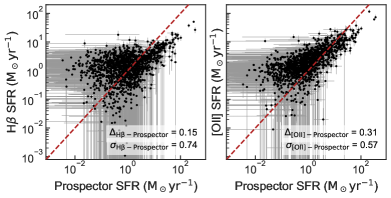
4 SFRs from lines
In this section, we compare the SFRs obtained by our SED fitting (Figure 10) with several alternate techniques for estimating SFRs based on optical lines; our goal here is to compare our Prospector SFRs with other SFR indicators commonly used in the literatures. Two spectral features in the SDSS wavelength regime— H and [O ii] 3727— are often used as SFR indicators. Both of these lines are imperfect SFR indicators for post-starburst galaxies. First, due to the strong A-star signatures of our post-starburst galaxies (Figure 3), we typically see H in absorption, not emission. While jointly modeling the continuum absorption along with the line emission can provide estimates of how much H emission is filling in the absorption line, these line flux measurements are extremely difficult for massive galaxies with broad lines. Second, LINER emission can contribute to both [O ii] and H line flux; previous studies have found that this LINER emission is common in post-starburst galaxies (e.g., Lemaux et al. 2010; Kocevski et al. 2011; French et al. 2015). Shocks could also contribute to the ionized emission from galaxies, including [O ii] (e.g., Alatalo et al. 2016; Maddox 2018). In this case, [O ii] and H SFRs should be treated as upper limits, as in French et al. (2015): star formation is not the only contributor to the measured line flux. However, both H and [O ii] are affected by dust. The SDSS spectra do not cover the H regime, and thus our best estimate of the dust attenuation in these galaxies comes from our SED fitting. If these dust values are underestimated, the SFR values should be considered lower limits. The competing effects of dust and LINER emission thus make it unclear whether H and [O ii] SFRs should be treated as upper or lower limits for post-starburst galaxies: the answer likely depends on the individual galaxy. For this reason— like Belli et al. (2021)— we conclude that the SED SFRs are more reliable than line-based SFRs for post-starburst galaxies. Nonetheless, here we compute both H and [O ii] SFRs to serve as a comparison point for the Prospector SFRs calculated in Section 3.
We adopt H line flux measurements from Greene et al. (2020), who used the public penalized pixel-fitting code pPXF (Cappellari & Emsellem 2004) to fit the stellar continuum as well as H and [O iii] emission lines. We assume an intrinsic line ratio of to estimate the H flux. We correct these fluxes for dust using the Prospector dust index and Av values. Again, our fitting assumes that lines (including H and H) are twice as attenuated as the stellar continuum. We then use the Kennicutt (1998b) conversion, adjusted to a Chabrier (2003) IMF, to estimate the SFR. We note that our Prospector fits include the H line, and thus this line is a also a major contributor to the SFRs shown in Figure 10. However, the Kennicutt (1998b) conversion assumes solar metallicity and a constant SFH, whereas the Prospector SFRs takes into account the metallicity and SFH.
To calculate [O ii] SFRs, we measure the aperture-corrected flux from the [O ii] doublet by modeling the region of the spectrum around the line with a single Gaussian centered at the mean wavelength of the [O ii] doublet plus a straight-line fit to the continuum. Our spectra do not resolve the [O ii] doublet. We hold the width of the Gaussian line profile fixed to the velocity as measured by pPXF (Greene et al. 2020). Again, we correct the measured line flux for dust extinction using the Prospector fitting results. Finally, we used the conversion in Kennicutt (1998b) (adjusted to a Chabrier 2003 IMF) to convert our measured line flux to a SFR. Error bars on the SFR were obtained using 1,000 bootstrap realizations of the measured line flux.
Figure 13 shows the SFR estimated from both H (left) and [O ii] (right) as a function of the Prospector SFR (Section 3). Again, our mock recovery tests indicate that Prospector SFRs do not have significant constraining power below . We see that, while the line-based SFRs generally correlate with the Prospector SFRs, there is a large amount of scatter, particularly at the low-SFR end. H SFRs are typically higher than Prospector SFRs at low SFRs, likely because the H fluxes in this regime are dominated by spectral noise. At high SFR, H SFRs are offset lower than the Prospector SFRs; this could be due to the fact that the Prospector SFRs do not assume a constant SFH and solar metallicity, as the Kennicutt (1998b) conversion does. Median [O ii] SFRs are offset slightly from Prospector SFRs at all SFRs. This difference is largest at the lowest SFRs, likely due to an increasing fraction of [O ii] flux originating from LINER emission. For all three SFR indicators, there are a small fraction () of SQuIGGE galaxies that have high SFRs consistent with the star-forming main sequence. Because of the effects of both LINER emission and dust, we take the Prospector SFRs as the most reliable SFR indicator available for the full SQuIGGE sample (see also, e.g., Belli et al. 2021). However, we note that no matter which SFR indicator is used— Prospector, H, or [O ii]— the median SFRs of all galaxies in the SQuIGGE sample is an order of magnitude or more below the main sequence.
5 Comparison to other samples of PSBs
Here, we place the SQuIGGE sample in the context of existing large samples of post-starburst galaxies. As discussed in Section 2, a myriad of studies have selected recently-quenched galaxies across redshift by their spectral line strengths, spectral shapes, or colors. The largest spectroscopic samples of post-starburst galaxies come from the low-redshift universe, , where large spectroscopic surveys such as the SDSS allow for the identification of rare recently-quenched galaxies (e.g., Zabludoff et al. 1996; Quintero et al. 2004; French et al. 2015; Alatalo et al. 2016). While post-starburst galaxies are common at (e.g., Whitaker et al. 2012a; Wild et al. 2016; Belli et al. 2019), spectroscopic samples tend to be smaller due to the difficulty of high-redshift spectroscopy. The only other large intermediate-redshift spectroscopic sample of post-starburst galaxies comes from Pattarakijwanich et al. (2016), who also select from the SDSS & BOSS surveys. In Section 5.1, we compare SQuIGGE to lower- and higher-redshift samples; in Section 5.2, we compare SQuIGGE to the Pattarakijwanich et al. (2016) sample at the same redshift.
5.1 Comparison to post-starburst samples across redshift
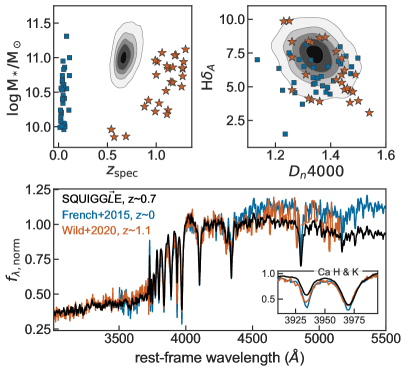
Figure 14 shows the SQuIGGE sample in context of one low-redshift (French et al. 2015) and one high-redshift (Wild et al. 2020) sample of post-starburst galaxies. The French et al. (2015) sample was selected by their high H and low H equivalent widths, while the Wild et al. (2020) sample was selected using a PCA technique. Figure 14 shows that SQuIGGE galaxies lie at intermediate redshift, and tend to have higher stellar masses than many of the French et al. (2015) or Wild et al. (2020) galaxies. The lack of low-mass galaxies in SQuIGGE compared to lower-redshift studies is likely a selection effect (e.g., Malmquist bias): the galaxies our sample must have had high mass in order to fall into the SDSS spectroscopic sample and exceed our S/N cut. While the three populations of post-starburst galaxies overlap significantly in H - space, the bulk of the SQuIGGE galaxies lie at slightly higher H values than the French et al. (2015) or Wild et al. (2020) samples. Because stellar age typically increases towards the lower right of this diagram, this indicates that SQuIGGE galaxies are slightly younger on average than either of these samples. This is confirmed by SFH modeling: both Wild et al. (2020) and French et al. (2018) found older post-burst ages for their samples than we find in Section 3. However, it is difficult to directly compare the inferred values because each study uses a slightly different SFH parameterization and definition of .
The bottom panel of Figure 14 shows a stack of the spectra in all three samples. Both the SQuIGGE and French et al. (2015) stacks are created using public SDSS data. As in Figure 3, all individual spectra are normalized using the flux between 4150 and 4250 Å. Spectra from the Wild et al. (2020) sample come from both the UDSz ESO Large Programme (PI: Almaini) and Maltby et al. (2016); Maltby et al. in prep. provides further details about the spectroscopic data reduction. In addition to normalizing the Wild et al. (2020) spectra (again, between 4150 and 4250 Å), we smooth the stack using a nine-pixel median filter past Å, where fewer than 15 spectra have wavelength coverage. We do not show the Wild et al. (2020) stacked spectrum past Å, where fewer than five individual spectra have wavelength coverage.
We see two notable differences in the stacked spectra shown in Figure 14: the depth of the absorption lines, and the spectral shape redward of Å. The calcium H & K lines are deep and nearly symmetric for the French et al. (2015) stack, while they are shallower and much more asymmetric in the SQuIGGE stack (because the CaH line is more significantly contaminated by H). These spectral differences indicate that SQuIGGE galaxies are younger than the French et al. (2015) galaxies. We also find that the French et al. (2015) spectra have nearly a flat slope redward of Å, while (by construction) the SQuIGGE stack shows a relatively blue slope. These differences could be caused by differences in the sample selection technique, redshift evolution in the post-starburst population (e.g., Whitaker et al. 2012a; Wild et al. 2016; Rowlands et al. 2018; Belli et al. 2019) or both. The Wild et al. (2020) stack has a slope intermediate between the French et al. (2015) and SQuIGGE samples. This difference in slope indicates that both the French et al. (2015) and Wild et al. (2020) samples contain galaxies with larger contributions from old stars. For the French et al. (2015) sample, this aligns with expectations from the SFH fitting in French et al. (2018): these galaxies have best-fit burst mass fractions that are often %, lower than the SQuIGGE burst mass fractions shown in Figure 11. However, Wild et al. (2020) finds burst mass fractions that are often , above the median burst mass fractions for the SQuIGGE sample. This difference is likely primarily caused by differences in the fitting methodology and definition of “burst mass fraction” used in Wild et al. (2020) and this paper. Furthermore, the Wild et al. (2020) stack shown in Figure 14 is dominated by low-redshift, lower galaxies at these longer wavelengths.
5.2 Comparison to the Pattarakijwanich et al. (2016) sample
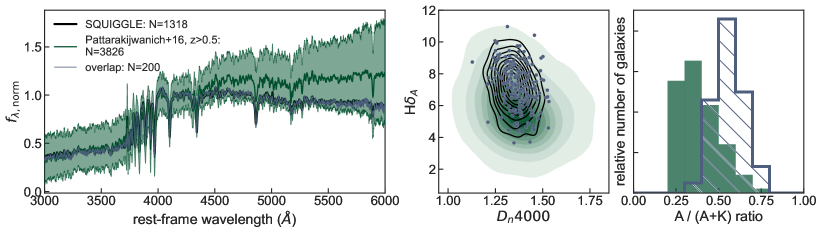
In Figure 15, we compare the SQuIGGE sample to the Pattarakijwanich et al. (2016) sample. This study also selected post-starburst galaxies from SDSS spectroscopy. Unlike SQuIGGE, Pattarakijwanich et al. (2016) used a template-fitting approach to find post-starburst galaxies: galaxies were fit with a sum of both an old (‘K’) component and a young (‘A’) component, then identified as post-starburst if the light-weighted A/(A+K) ratio exceeded 0.25. Pattarakijwanich et al. (2016) selected spectra from both the SDSS and BOSS surveys, including galaxies with redshifts as low as . In Figure 15, to facilitate a direct comparison with SQuIGGE we show only galaxies with . The median stacked spectrum of the Pattarakijwanich et al. (2016) sample has significantly more flux at longer wavelengths; again, this indicates older stellar ages. However, the 16-84% confidence interval of the Pattarakijwanich et al. (2016) encompasses a large range of spectral slopes. The lower 16% interval encompasses the SQuIGGE stack, indicating that the Pattarakijwanich et al. (2016) sample includes some post-starburst galaxies as young as those in SQuIGGE. This larger median age and wider age spread is also reflected in the – values: the median value of the Pattarakijwanich et al. (2016) sample is offset from the SQuIGGE median, but the distribution is broad and overlaps significantly with SQuIGGE.
We find that 210 post-starburst galaxies are selected both by SQuIGGE and Pattarakijwanich et al. (2016). These galaxies reflect the full distribution of SQuIGGE galaxies: they trace the SQuIGGE contours in – space, and their stacked spectrum is indistinguishable from the full SQuIGGE sample. This relatively small number of overlapping galaxies is primarily due to the fact that Pattarakijwanich et al. (2016) selected galaxies from SDSS DR9, whereas the SQuIGGE selection is performed on SDSS DR14. Nearly half of SQuIGGE-identified post-starburst galaxies were observed after DR9, and thus could not have been included in Pattarakijwanich et al. (2016).
The right panel of Figure 15 shows the A/(A+K) ratio as calculated by Pattarakijwanich et al. (2016), both for the full Pattarakijwanich et al. (2016) sample and the galaxies selected by both Pattarakijwanich et al. (2016) and SQuIGGE. SQuIGGE galaxies have a higher median A/(A+K) ratio than the full Pattarakijwanich et al. (2016) sample, indicating that we are generally selecting more burst-dominated galaxies.
In summary, the SQuIGGE sample is smaller and more targeted than the Pattarakijwanich et al. (2016) sample: SQuIGGE consists of uniformly young post-starburst galaxies with a narrow spread in H- space. The Pattarakijwanich et al. (2016) sample includes a wider range of stellar ages, but does not include the majority of young SQuIGGE galaxies which were observed after DR9.
6 SQuIGGE science objectives
The large sample of bright, intermediate-redshift, recently-quenched galaxies in SQuIGGE enables a wide range of studies into the rapid quenching process. Most of these science cases rely on the stellar population synthesis modeling presented in this paper in combination with other multi-wavelength datasets. SQuIGGE is not intended to be a complete sample of post-starburst galaxies at these redshifts: the selection function is complex, and not conducive to number density studies. Instead, SQuIGGE was designed to select the brightest, most massive, most burst-dominated post-starburst galaxies at intermediate redshifts. These galaxies serve as laboratories to conduct detailed multi-wavelength dives into the processes responsible for shutting down star formation. Here, we briefly summarize the primary science objectives of SQuIGGE.
6.1 Molecular Gas Reservoirs
Theoretical quenching mechanisms generally rely on processes which remove the available fuel for star formation by depleting, heating, or ejecting cold molecular gas reservoirs. One of the primary science objectives of SQuIGGE is to directly test this assumption. An initial ALMA study of the CO(2–1) emission of two SQuIGGE post-starburst galaxies revealed abundant gas reservoirs despite low ongoing star formation rates (Suess et al. 2017). This result indicates that— contrary to expectations— quenching does not require the total removal of molecular gas. Massive gas reservoirs have also been found in local K+A galaxies (e.g., Rowlands et al. 2015; French et al. 2015; Alatalo et al. 2016; Smercina et al. 2018) as well as several young quiescent galaxies at (Williams et al. 2021; Belli et al. 2021). These results have prompted theoretical studies into why star formation is suppressed in post-starburst galaxies (e.g., Davis et al. 2019; Salim et al. 2020).
We are currently conducting an ALMA survey of the molecular gas content of eleven additional SQuIGGE post-starburst galaxies (R. Bezanson et al., in prep.). This study will allow us to test whether these abundant gas reservoirs are common after quenching, and whether the gas fraction depends on other galaxy properties such as time since quenching (Section 3).
These molecular gas measurements, in combination with SFRs, will allow us to place these galaxies on the Kennicutt-Schmidt relation and investigate how efficiently they are forming stars (e.g., Kennicutt 1998a). As part of this work, we are in the process of obtaining other robust estimators of the SFR in these galaxies. In particular, we are using the VLA to investigate possible highly-obscured SFR, and using Keck/NIRES to calculate Balmer decrement-corrected H SFRs.
6.2 Morphologies & Sizes
Some studies predict that quenching can be triggered by a gas-rich major merger: in this scenario, the merger funnels gas to the galaxy’s center where it is consumed in an intense starburst (e.g., Hopkins et al. 2006; Wellons et al. 2015). Deep, high-resolution imaging of SQuIGGE galaxies will allow us to quantify the fraction of recently-quenched galaxies that show signs of recent mergers (including tidal features and asymmetric morphologies). Sazonova et al. (2021) suggests that these disturbed morphologies are common for post-starburst galaxies at . Our team has obtained Hubble Space Telescope WFC3/F125W imaging for three SQuIGGE galaxies targeted as part of our ALMA survey (Figure 16). These galaxies are clearly disturbed: J2202-0033 has a large tidal feature to the west, and both J0027+0129 and J0912+1523 have nearby companions which may be physically associated. The image of J0912+1523 also reveals that it has a spheroidal component embedded within a disk.
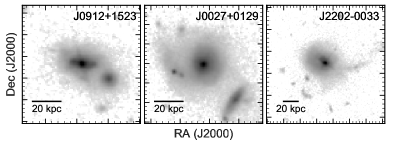
Some previous studies have found that post-starburst galaxies have extremely compact sizes, and may be smaller than their older quiescent counterparts (e.g., Whitaker et al. 2012a; Yano et al. 2016; Almaini et al. 2017). Suess et al. (2020) suggests that these size differences may be primarily caused by the effects of radial color gradients (see also Maltby et al. 2018; Setton et al. 2020). In either case, differences in the sizes and/or color gradients of post-starburst galaxies and older quiescent galaxies could provide clues both to the formation mechanisms for post-starburst galaxies and the processes contributing to evolution along the quiescent sequence. Deep, high-resolution images such as those shown in Figure 16 will allow us to calculate the sizes of SQuIGGE post-starburst galaxies and compare them to a mass-matched sample of older quiescent galaxies.
While the images presented in Figure 16 shed light on the morphologies and sizes of a few individual SQuIGGE galaxies, obtaining HST imaging for a statistical sample of post-starburst galaxies is prohibitively expensive. A much larger set of deep, high-resolution images comes from the overlap of the SQuIGGE sample and the public Hyper SuprimeCam survey (Aihara et al. 2018). One of our major science objectives is to use the high-quality HSC images of SQuIGGE galaxies to investigate the sizes, morphologies, and merger fractions of these recently-quenched galaxies (D. Setton et al., in prep.).
6.3 Kinematics
In general, star-forming galaxies tend to be rotationally-supported disks, while quiescent galaxies are more likely to be kinematically hot and supported by random motions (e.g., Emsellem et al. 2011). However, it is still not understood why a cessation of star formation correlates with a change in kinematics. Furthermore, it is unclear whether this kinematic transition occurs before, after, or at the same time as star formation shuts down. The bright, recently-quenched SQuIGGE galaxies provide an ideal testbed for IFU studies to directly probe the kinematics of galaxies just after quenching. An early result for one SQuIGGE target (J0912+1523, also shown in Figure 16) revealed that the galaxy is a rotating disk (Hunt et al. 2018). A larger followup study of five additional SQuIGGE galaxies showed that only half of post-starburst galaxies show clear velocity gradients, while the other half are dominated by random motions (Setton et al. 2020).
6.4 Resolved Stellar Populations
Studying the spatially-resolved properties of post-starburst galaxies could provide additional clues to the quenching process. Radial age or sSFR gradients can be used to help determine whether quenching proceeded inside-out or outside-in (e.g., Tacchella et al. 2018; Woo & Ellison 2019); radial metallicity gradients can help distinguish between in- and ex-situ components, important when mergers are suggested as a trigger for quenching (e.g., Greene et al. 2015; Chan et al. 2016; Woo & Ellison 2019). Our preliminary study of six SQuIGGE galaxies shows that they have flat age gradients as probed by H (Setton et al. 2020). In the absence of strong radial dust or metallicity gradients, these flat age gradients are consistent with the flat color gradients that Maltby et al. (2018) and Suess et al. (2020) find for post-starburst galaxies. Setton et al. (2020) find that these six post-starburst galaxies have young light-weighted ages at all radii, implying that star formation shut off uniformly throughout the galaxy. In the future, we plan to expand the sample size of SQuIGGE post-starburst galaxies with spatially-resolved stellar population measurements; facilities like JWST would be useful to perform these studies further in the infrared, where it is easier to break the age-dust-metallicity degeneracy.
6.5 AGN Incidence
One popular theoretical mechanism for quenching galaxies invokes strong feedback from AGN (e.g., Di Matteo et al. 2005; Hopkins et al. 2006). This feedback, possibly induced by a major merger (Springel et al. 2005; Hopkins et al. 2006; Wellons et al. 2015), could heat the interstellar medium and/or drive molecular gas from the galaxy, removing the fuel for star formation (Alatalo et al. 2015). Establishing a direct causal connection between AGN activity and star formation suppression has unfortunately proven difficult, in part because AGN vary dramatically on much shorter timescales than star formation. A large number of AGN surveys have shown that AGN activity depends on star formation rate and mass (e.g., Hickox et al. 2014). The SQuIGGE sample allows us to ask how many recently-quenched galaxies show AGN activity, and test whether certain types of post-starburst galaxies are more likely to host AGN. Greene et al. (2020) used SQuIGGE to show that the incidence of AGN depends strongly on : recently-quenched galaxies from SQuIGGE are ten times more likely to host an optical AGN than a mass-matched sample of older quiescent galaxies. This hints that AGN activity is indeed correlated with the quenching process in these massive galaxies.
6.6 IR properties
As shown in Figure 12, SQuIGGE galaxies have puzzlingly high W4 fluxes. At the redshift of SQuIGGE, W4 corresponds to rest-frame m. Previous studies at have found that the mid-infrared spectra of post-starburst galaxies are influenced by emission from AGN, TP-AGB stars, and strong PAH features (e.g., Alatalo et al. 2017; Smercina et al. 2018). In future studies, we will perform stacking analyses of the WISE imaging for SQuIGGE galaxies to understand the nature of this excess W4 emission. Additionally, the mid-infrared capabilities of JWST may allow us to understand the origin of this emission. These infrared studies can be paired with studies of the molecular gas reservoirs in order to obtain a more complete picture of the interstellar medium (ISM) conditions as galaxies cease forming stars.
7 Discussion & Conclusions
In this paper, we present the sample selection, stellar population properties, star formation histories, and objectives of the SQuIGGE survey of post-starburst galaxies. We select bright, intermediate-redshift, recently-quenched galaxies from the SDSS spectroscopic sample using a simple color-based selection criterion. Using just two rest-frame color cuts, we are able to isolate 1,318 post-starburst galaxies at . These galaxies all have high H equivalent widths, low values, and BV/A-star dominated spectra indicating young stellar ages. These recently-quenched galaxies serve as laboratories to study the processes responsible for shutting down star formation in galaxies: the signatures of the quenching process should still be imprinted on their morphologies, kinematics, and gas properties.
We use the Prospector spectral energy distribution fitting code to recover the stellar population parameters and star formation histories of all SQuIGGE galaxies. We find that these galaxies are very massive— nearly all SQuIGGE galaxies have — and have relatively low dust attenuation values. Our fitting also shows that these galaxies are indeed quenched: the median SFRs recovered from our SED fitting are more than an order of magnitude below the star-forming main sequence (Whitaker et al. 2012b). The quenched nature of this sample is consistent with SFR estimates based on both the H and [O ii] spectral lines: while these SFRs are likely less reliable than the SED SFRs due to the competing effects of LINER emission and dust (see also, e.g., Belli et al. 2021), the median H and [O ii] SFRs also lie well below the main sequence. Longer-wavelength data would be required to fully rule out the possibility of highly dust-obscured star formation. While many galaxies in SQuIGGE host obscured (type II) AGN (Greene et al. 2020), because we mask the [O ii] and [O iii] lines we do not expect our SED fitting results to be dominated by AGN emission.
Our SED fitting also allow us to quantify the properties of the recent burst. By using non-parametric SFHs, our SED fitting methodology accurately recovers both how long these galaxies have been quenched () and the fraction of the total stellar mass formed in the recent burst (). We find that SQuIGGE galaxies quenched their star formation extremely recently, with a median value of just 175 Myr. Galaxies which quenched longer ago, up to Myr before the time of observation, are also included in SQuIGGE; however, these older post-starburst galaxies are only selected if they also have relatively high burst mass fractions. The distribution of SQuIGGE galaxies peaks at around % of the total stellar mass being formed in the recent burst. We note that due to our conservative choice of priors, we likely underestimate for the most extreme and burst-dominated objects. Despite this choice, we find that 20% of the galaxies in SQuIGGE formed a majority of their total stellar mass during the recent burst.
We find that these extreme objects are younger and more burst-dominated than samples of “K+A” or “E+A” post-starburst galaxies at : SQuIGGE galaxies have higher median H equivalent width, lower values, and bluer spectral slopes than the French et al. (2015) sample of local post-starburst galaxies. This difference is also confirmed by the SFH fitting in French et al. (2018): many local post-starburst galaxies have burst mass fractions %, in contrast to the higher burst mass fractions we find for SQuIGGE galaxies. While SQuIGGE galaxies may have slightly lower average burst mass fractions than post-starburst galaxies from Wild et al. (2020), SQuIGGE galaxies are on average younger than the Wild et al. (2020) post-starburst galaxies. Together, these results indicate that our selection was able to identify the rare intermediate-redshift tail of the peak epoch of quenching at : SQuIGGE galaxies recently and rapidly shut down a major burst of star formation. By targeting these bright, intermediate-redshift galaxies, SQuIGGE is able to strike a balance between low enough redshift that follow-up observations are feasible, and high enough redshifts that we can use these galaxies to understand how galaxies shut down their major star-forming epoch.
This large sample of recently-quenched galaxies opens a wide range of future studies. Different theoretical quenching mechanisms predict qualitatively different morphologies, age gradients, kinematics, AGN incidence, and ISM conditions. We have already begun to use this sample of galaxies to constrain the mechanisms responsible for quenching. We have found that, in contrast to theoretical predictions, quenching does not require the total removal of molecular gas (Suess et al. 2017). Furthermore, we have found that these recently-quenched galaxies can have a range of different kinematic structures, but tend to have flat age gradients indicating that the recent starburst was not purely centrally-concentrated (Hunt et al. 2018; Setton et al. 2020). We have also shown that AGN likely play an important role in quenching: SQuIGGE galaxies are more than ten times more likely to host an optical AGN than a mass-matched sample of older quiescent galaxies, and the AGN fraction is even higher in the youngest SQuIGGE galaxies (Greene et al. 2020). These studies represent just the beginning of the insights that the SQuIGGE sample will provide into the mechanisms responsible for transforming galaxies from disky blue star-formers to quiescent red ellipticals.
References
- Abolfathi et al. (2018) Abolfathi, B., Aguado, D. S., Aguilar, G., et al. 2018, ApJS, 235, 42
- Aihara et al. (2018) Aihara, H., Arimoto, N., Armstrong, R., et al. 2018, PASJ, 70, S4
- Akins et al. (2021) Akins, H. B., Narayanan, D., Whitaker, K. E., et al. 2021, arXiv e-prints, arXiv:2105.12748
- Alatalo et al. (2015) Alatalo, K., Lacy, M., Lanz, L., et al. 2015, ApJ, 798, 31
- Alatalo et al. (2016) Alatalo, K., Cales, S. L., Rich, J. A., et al. 2016, ApJS, 224, 38
- Alatalo et al. (2017) Alatalo, K., Bitsakis, T., Lanz, L., et al. 2017, ApJ, 843, 9
- Almaini et al. (2017) Almaini, O., Wild, V., Maltby, D. T., et al. 2017, MNRAS, 472, 1401
- Astropy Collaboration et al. (2013) Astropy Collaboration, Robitaille, T. P., Tollerud, E. J., et al. 2013, A&A, 558, A33
- Astropy Collaboration et al. (2018) Astropy Collaboration, Price-Whelan, A. M., Sipőcz, B. M., et al. 2018, AJ, 156, 123
- Balogh et al. (1999) Balogh, M. L., Morris, S. L., Yee, H. K. C., Carlberg, R. G., & Ellingson, E. 1999, ApJ, 527, 54
- Barro et al. (2013) Barro, G., Faber, S. M., Pérez-González, P. G., et al. 2013, ApJ, 765, 104
- Barro et al. (2014) —. 2014, ApJ, 791, 52
- Becker et al. (1995) Becker, R. H., White, R. L., & Helfand, D. J. 1995, ApJ, 450, 559
- Behroozi et al. (2019) Behroozi, P., Wechsler, R. H., Hearin, A. P., & Conroy, C. 2019, MNRAS, 488, 3143
- Belli et al. (2019) Belli, S., Newman, A. B., & Ellis, R. S. 2019, ApJ, 874, 17
- Belli et al. (2021) Belli, S., Contursi, A., Genzel, R., et al. 2021, ApJ, 909, L11
- Bezanson et al. (2013) Bezanson, R., van Dokkum, P., van de Sande, J., Franx, M., & Kriek, M. 2013, ApJ, 764, L8
- Blanton et al. (2003) Blanton, M. R., Hogg, D. W., Bahcall, N. A., et al. 2003, ApJ, 594, 186
- Brown et al. (2009) Brown, M. J. I., Moustakas, J., Caldwell, N., et al. 2009, ApJ, 703, 150
- Byler et al. (2017) Byler, N., Dalcanton, J. J., Conroy, C., & Johnson, B. D. 2017, ApJ, 840, 44
- Calzetti et al. (2000) Calzetti, D., Armus, L., Bohlin, R. C., et al. 2000, ApJ, 533, 682
- Cappellari (2017) Cappellari, M. 2017, MNRAS, 466, 798
- Cappellari & Emsellem (2004) Cappellari, M., & Emsellem, E. 2004, PASP, 116, 138
- Carnall et al. (2019) Carnall, A. C., Leja, J., Johnson, B. D., et al. 2019, ApJ, 873, 44
- Carnall et al. (2018) Carnall, A. C., McLure, R. J., Dunlop, J. S., & Davé, R. 2018, MNRAS, 480, 4379
- Chabrier (2003) Chabrier, G. 2003, PASP, 115, 763
- Chan et al. (2016) Chan, J. C. C., Beifiori, A., Mendel, J. T., et al. 2016, MNRAS, 458, 3181
- Choi et al. (2016) Choi, J., Dotter, A., Conroy, C., et al. 2016, ApJ, 823, 102
- Conroy & Gunn (2010) Conroy, C., & Gunn, J. E. 2010, ApJ, 712, 833
- Conroy et al. (2009) Conroy, C., Gunn, J. E., & White, M. 2009, ApJ, 699, 486
- Couch & Sharples (1987) Couch, W. J., & Sharples, R. M. 1987, MNRAS, 229, 423
- Davis et al. (2019) Davis, T. A., van de Voort, F., Rowlands, K., et al. 2019, MNRAS, 484, 2447
- Dawson et al. (2013) Dawson, K. S., Schlegel, D. J., Ahn, C. P., et al. 2013, AJ, 145, 10
- Di Matteo et al. (2005) Di Matteo, T., Springel, V., & Hernquist, L. 2005, Nature, 433, 604
- Dotter (2016) Dotter, A. 2016, ApJS, 222, 8
- Draine & Li (2007) Draine, B. T., & Li, A. 2007, ApJ, 657, 810
- Dressler & Gunn (1983) Dressler, A., & Gunn, J. E. 1983, ApJ, 270, 7
- Dressler et al. (1999) Dressler, A., Smail, I., Poggianti, B. M., et al. 1999, ApJS, 122, 51
- Emsellem et al. (2011) Emsellem, E., Cappellari, M., Krajnović, D., et al. 2011, MNRAS, 414, 888
- Evans et al. (2010) Evans, I. N., Primini, F. A., Glotfelty, K. J., et al. 2010, ApJS, 189, 37
- Falcón-Barroso et al. (2011) Falcón-Barroso, J., Sánchez-Blázquez, P., Vazdekis, A., et al. 2011, A&A, 532, A95
- Feldmann et al. (2011) Feldmann, R., Carollo, C. M., & Mayer, L. 2011, ApJ, 736, 88
- Forrest et al. (2018) Forrest, B., Tran, K.-V. H., Broussard, A., et al. 2018, ApJ, 863, 131
- French (2021) French, K. D. 2021, PASP, 133, 072001
- French et al. (2015) French, K. D., Yang, Y., Zabludoff, A., et al. 2015, ApJ, 801, 1
- French et al. (2018) French, K. D., Yang, Y., Zabludoff, A. I., & Tremonti, C. A. 2018, ApJ, 862, 2
- Gallazzi et al. (2005) Gallazzi, A., Charlot, S., Brinchmann, J., White, S. D. M., & Tremonti, C. A. 2005, MNRAS, 362, 41
- Goto (2005) Goto, T. 2005, MNRAS, 357, 937
- Greene et al. (2015) Greene, J. E., Janish, R., Ma, C.-P., et al. 2015, ApJ, 807, 11
- Greene et al. (2020) Greene, J. E., Setton, D., Bezanson, R., et al. 2020, ApJ, 899, L9
- Hickox et al. (2014) Hickox, R. C., Mullaney, J. R., Alexander, D. M., et al. 2014, ApJ, 782, 9
- Hopkins et al. (2006) Hopkins, P. F., Somerville, R. S., Hernquist, L., et al. 2006, ApJ, 652, 864
- Hubble (1926) Hubble, E. P. 1926, ApJ, 64, 321
- Hunt et al. (2018) Hunt, Q., Bezanson, R., Greene, J. E., et al. 2018, ApJ, 860, L18
- Johnson & Leja (2017) Johnson, B., & Leja, J. 2017, Bd-J/Prospector: Initial Release, v.v0.1, Zenodo, doi:10.5281/zenodo.1116491
- Johnson et al. (2020) Johnson, B. D., Leja, J., Conroy, C., & Speagle, J. S. 2020, arXiv e-prints, arXiv:2012.01426
- Kauffmann et al. (2003) Kauffmann, G., Heckman, T. M., White, S. D. M., et al. 2003, MNRAS, 341, 54
- Kaviraj et al. (2007) Kaviraj, S., Kirkby, L. A., Silk, J., & Sarzi, M. 2007, MNRAS, 382, 960
- Kennicutt (1998a) Kennicutt, Robert C., J. 1998a, ApJ, 498, 541
- Kennicutt (1998b) Kennicutt, Jr., R. C. 1998b, ARA&A, 36, 189
- Kocevski et al. (2011) Kocevski, D. D., Lemaux, B. C., Lubin, L. M., et al. 2011, ApJ, 737, L38
- Kriek & Conroy (2013) Kriek, M., & Conroy, C. 2013, ApJ, 775, L16
- Kriek et al. (2010) Kriek, M., Labbé, I., Conroy, C., et al. 2010, ApJ, 722, L64
- Lee et al. (2010) Lee, S.-K., Ferguson, H. C., Somerville, R. S., Wiklind, T., & Giavalisco, M. 2010, ApJ, 725, 1644
- Lee et al. (2009) Lee, S.-K., Idzi, R., Ferguson, H. C., et al. 2009, ApJS, 184, 100
- Leja et al. (2019a) Leja, J., Carnall, A. C., Johnson, B. D., Conroy, C., & Speagle, J. S. 2019a, ApJ, 876, 3
- Leja et al. (2017) Leja, J., Johnson, B. D., Conroy, C., van Dokkum, P. G., & Byler, N. 2017, ApJ, 837, 170
- Leja et al. (2019b) Leja, J., Johnson, B. D., Conroy, C., et al. 2019b, ApJ, 877, 140
- Lemaux et al. (2010) Lemaux, B. C., Lubin, L. M., Shapley, A., et al. 2010, ApJ, 716, 970
- Lower et al. (2020) Lower, S., Narayanan, D., Leja, J., et al. 2020, ApJ, 904, 33
- Maddox (2018) Maddox, N. 2018, MNRAS, 480, 5203
- Maltby et al. (2018) Maltby, D. T., Almaini, O., Wild, V., et al. 2018, MNRAS, 480, 381
- Maltby et al. (2016) —. 2016, MNRAS, 459, L114
- Maraston et al. (2010) Maraston, C., Pforr, J., Renzini, A., et al. 2010, MNRAS, 407, 830
- Martig et al. (2009) Martig, M., Bournaud, F., Teyssier, R., & Dekel, A. 2009, ApJ, 707, 250
- Noeske et al. (2007) Noeske, K. G., Weiner, B. J., Faber, S. M., et al. 2007, ApJ, 660, L43
- Pattarakijwanich et al. (2016) Pattarakijwanich, P., Strauss, M. A., Ho, S., & Ross, N. P. 2016, ApJ, 833, 19
- Paxton et al. (2011) Paxton, B., Bildsten, L., Dotter, A., et al. 2011, ApJS, 192, 3
- Paxton et al. (2013) Paxton, B., Cantiello, M., Arras, P., et al. 2013, ApJS, 208, 4
- Paxton et al. (2015) Paxton, B., Marchant, P., Schwab, J., et al. 2015, ApJS, 220, 15
- Quintero et al. (2004) Quintero, A. D., Hogg, D. W., Blanton, M. R., et al. 2004, ApJ, 602, 190
- Rowlands et al. (2015) Rowlands, K., Wild, V., Nesvadba, N., et al. 2015, MNRAS, 448, 258
- Rowlands et al. (2018) Rowlands, K., Wild, V., Bourne, N., et al. 2018, MNRAS, 473, 1168
- Salim et al. (2020) Salim, D. M., Alatalo, K., Federrath, C., Groves, B., & Kewley, L. J. 2020, ApJ, 893, 26
- Sánchez-Blázquez et al. (2006) Sánchez-Blázquez, P., Peletier, R. F., Jiménez-Vicente, J., et al. 2006, MNRAS, 371, 703
- Sazonova et al. (2021) Sazonova, E., Alatalo, K., Rowlands, K., et al. 2021, arXiv e-prints, arXiv:2105.09956
- Schawinski et al. (2014) Schawinski, K., Urry, C. M., Simmons, B. D., et al. 2014, MNRAS, 440, 889
- Setton et al. (2020) Setton, D. J., Bezanson, R., Suess, K. A., et al. 2020, ApJ, 905, 79
- Shen et al. (2003) Shen, S., Mo, H. J., White, S. D. M., et al. 2003, MNRAS, 343, 978
- Smercina et al. (2018) Smercina, A., Smith, J. D. T., Dale, D. A., et al. 2018, ApJ, 855, 51
- Speagle (2020) Speagle, J. S. 2020, MNRAS, 493, 3132
- Springel et al. (2005) Springel, V., Di Matteo, T., & Hernquist, L. 2005, ApJ, 620, L79
- Suess et al. (2017) Suess, K. A., Bezanson, R., Spilker, J. S., et al. 2017, ApJ, 846, L14
- Suess et al. (2020) Suess, K. A., Kriek, M., Price, S. H., & Barro, G. 2020, ApJ, 899, L26
- Tacchella et al. (2018) Tacchella, S., Carollo, C. M., Förster Schreiber, N. M., et al. 2018, ApJ, 859, 56
- Tacchella et al. (2021) Tacchella, S., Conroy, C., Faber, S. M., et al. 2021, arXiv e-prints, arXiv:2102.12494
- van der Wel et al. (2016) van der Wel, A., Noeske, K., Bezanson, R., et al. 2016, ApJS, 223, 29
- Waskom (2021) Waskom, M. L. 2021, Journal of Open Source Software, 6, 3021
- Wellons et al. (2015) Wellons, S., Torrey, P., Ma, C.-P., et al. 2015, MNRAS, 449, 361
- Whitaker et al. (2012a) Whitaker, K. E., Kriek, M., van Dokkum, P. G., et al. 2012a, ApJ, 745, 179
- Whitaker et al. (2012b) Whitaker, K. E., van Dokkum, P. G., Brammer, G., & Franx, M. 2012b, ApJ, 754, L29
- Wild et al. (2016) Wild, V., Almaini, O., Dunlop, J., et al. 2016, MNRAS, 463, 832
- Wild et al. (2014) Wild, V., Almaini, O., Cirasuolo, M., et al. 2014, MNRAS, 440, 1880
- Wild et al. (2020) Wild, V., Taj Aldeen, L., Carnall, A., et al. 2020, MNRAS, 494, 529
- Williams et al. (2021) Williams, C. C., Spilker, J. S., Whitaker, K. E., et al. 2021, ApJ, 908, 54
- Woo & Ellison (2019) Woo, J., & Ellison, S. L. 2019, MNRAS, 487, 1927
- Wu et al. (2018) Wu, P.-F., van der Wel, A., Bezanson, R., et al. 2018, ApJ, 868, 37
- Wuyts et al. (2011) Wuyts, S., Förster Schreiber, N. M., Lutz, D., et al. 2011, ApJ, 738, 106
- Yan et al. (2006) Yan, R., Newman, J. A., Faber, S. M., et al. 2006, ApJ, 648, 281
- Yano et al. (2016) Yano, M., Kriek, M., van der Wel, A., & Whitaker, K. E. 2016, ApJ, 817, L21
- Zabludoff et al. (1996) Zabludoff, A. I., Zaritsky, D., Lin, H., et al. 1996, ApJ, 466, 104