Now you see it, now you don’t: Star formation truncation precedes the loss of molecular gas by 100 Myr in massive post-starburst galaxies at z0.6
Abstract
We use ALMA observations of CO(2–1) in 13 massive () post-starburst galaxies at to constrain the molecular gas content in galaxies shortly after they quench their major star-forming episode. The post-starburst galaxies in this study are selected from the Sloan Digital Sky Survey spectroscopic samples (DR14) based on their spectral shapes, as part of the SQuIGGE program. Early results showed that two post-starburst galaxies host large reservoirs despite their low inferred star formation rates. Here we expand this analysis to a larger statistical sample of 13 galaxies. Six of the primary targets (45%) are detected, with . Given their high stellar masses, this mass limit corresponds to an average gas fraction of , or using lower stellar masses estimates derived from analytic, exponentially declining star formation histories. The gas fraction correlates with the spectral index, suggesting that the cold gas reservoirs decrease with time since burst, as found in local K+A galaxies. Star formation histories derived from flexible stellar population synthesis modeling support this empirical finding: galaxies that quenched Myr prior to observation host detectable CO(2-1) emission, while older post-starburst galaxies are undetected. The large reservoirs and low star formation rates in the sample imply that the quenching of star formation precedes the disappearance of the cold gas reservoirs. However, within the following 100-200 Myrs, the SQuIGGE galaxies require the additional and efficient heating or removal of cold gas to bring their low star formation rates in line with standard scaling relations.
1 Introduction
The process by which star-forming massive disk galaxies shut off their on-going star formation and join the older population of quiescent elliptical galaxies is one of the most poorly understood aspects of galaxy evolution. The dominance of ellipticals and the relative inefficiency of star formation as measured by abundance-matching of the dark matter halo and galaxy mass functions above has led to the need to introduce additional “feedback” into the galaxy formation process. At the massive end, this feedback is generally attributed to active galactic nuclei (AGN) (e.g., Croton et al., 2006). Most modern cosmological simulations that form realistic populations of massive galaxies introduce some mode of energy-injection that is attributed to supermassive black holes (e.g., Crain et al., 2015; Schaye et al., 2015; Weinberger et al., 2017; Anglés-Alcázar et al., 2017; Pillepich et al., 2018; Davé et al., 2019; Rodríguez Montero et al., 2019), but in other cases, the inefficiency to accrete and replenish the cold gas supplies of the most massive systems is tied to the halo mass (e.g., Feldmann & Mayer, 2015; Davé et al., 2017; Feldmann et al., 2017). In all cases, the link between cold and on-going star formation is a built-in assumption. These expectations are empirically well-motivated at large scales by the relatively gas-rich nature of galaxies with on-going star formation (e.g., Saintonge et al., 2011a, b, 2012; Tacconi et al., 2013, 2018) and at small scales by the strong correlation between the surface density of active star formation and the density of molecular hydrogen (e.g, Kennicutt, 1998; Schruba et al., 2011). Although reservoirs in dynamically hot elliptical galaxies appears to be less efficient at fueling their low-level star formation, this effect is secondary; in the local Universe quiescent galaxies are extremely gas-depleted (e.g., Young et al., 2011; Davis et al., 2011, 2013).
Empirical studies suggest that the majority of massive elliptical galaxies formed their stars in early, short-lived episodes - indicating the importance of a rapid mode of quenching (e.g. Thomas et al., 2005; Pacifici et al., 2016; Tacchella et al., 2021). It is therefore interesting to investigate the properties of post-starburst galaxies, sometimes referred to as E+A or K+A galaxies, which are selected to be the direct products of a fast-track of quenching that shut off a dramatic episode of star formation within Gyr (Dressler & Gunn, 1983; Zabludoff et al., 1996). This truncation produces characteristic spectral signatures originating from A-stars111We note that strong Balmer absorption features are also apparent in BV and later-type stars, but adopt the convention of referring to these signatures as A-type signatures. This becomes important for some galaxies in the SQuIGGE survey for which inferred post-quenching ages are shorter than the lifetimes of A stars. that dominate after more massive stars have died combined with a lack of signatures of instantaneous star formation (e.g., [OII] or H emission lines). If indeed these galaxies are in transition and star formation has already been shut down a reasonable expectation would be that their gas reservoirs already resemble those of older quiescent galaxies.
In this context, it is surprising that post-starburst galaxies have been demonstrated to host enigmatic and significant reservoirs ( up to ) even after their star formation stops abruptly. The majority of studies of in post-starburst galaxies have been limited to the local Universe, where such galaxies are extremely rare, but detailed studies are relatively accessible (e.g., French et al., 2015; Rowlands et al., 2015; Alatalo, 2015; Alatalo et al., 2016). Given that the most massive galaxies have the oldest stellar populations and therefore quenched at the earliest epochs (e.g., Thomas et al., 2005; McDermid et al., 2015), these low redshift relics of the late-time quenching process do not necessarily reflect the processes that shut off star formation at early times. Intriguingly, in local post-starburst galaxies has been demonstrated to disappear on short (100 Myr) timescales (French et al., 2018). However, no similar tests have been conducted beyond the local Universe.
Pushing observations of the possible link – or lack thereof – between quenching and the availability of to an epoch when galaxies are shutting down their primary episodes of star formation is a critical test of the theoretical models that could form the most massive galaxies in the Universe. Only a handful of quiescent galaxies at have been targeted for using CO lines, yielding only four detections and/but deep non-detections of (older) quiescent galaxies at “cosmic noon” () (Sargent et al., 2015; Spilker et al., 2018; Bezanson et al., 2019; Belli et al., 2021; Williams et al., 2021). In a pilot study of two massive post-starburst galaxies at that were spectroscopically selected to have recently shut down a major episode of star formation, Suess et al. (2017) reported both retained significant molecular gas reservoirs ().
In this paper we expand upon that work with a larger sample of 13 galaxies from the SQuIGGE (Studying QUenching at Intermediate-z Galaxies: Gas, anguar momentum, and Evolution) survey. This enables an investigation of trends between and the spectroscopic properties of massive post-starburst galaxies at , immediately after they quench their dominant episode of star formation. In §2, we briefly describe the SQuIGGE sample and the ALMA CO(2–1) observations. §3 discusses the reservoirs implied by the CO(2–1) fluxes and puts the sample in the context of other studies of star-forming and post-starburst galaxies. Finally §4 provides a discussion of the results and avenues for future study. Throughout this paper we assume a concordance cosmology with , and km s-1, a Chabrier (2003) initial mass function, and quote AB magnitudes.
2 Data
2.1 The SQuIGGE Sample
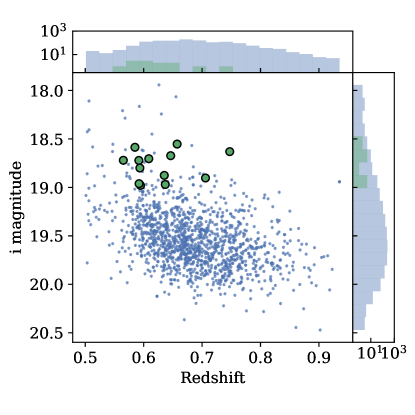
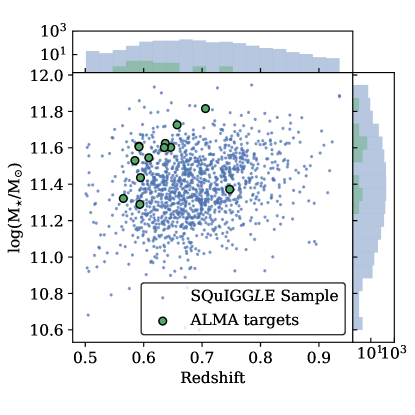
The SQuIGGE sample is selected from the Sloan Digital Sky Survey DR14 spectroscopic database (Abolfathi et al., 2018) to have strong Balmer breaks and blue slopes redward of the break using rest-frame filters, following Kriek et al. (2010). For a detailed description of the spectroscopic identification and stellar populations of SQuIGGE galaxies, we refer the reader to the survey paper (K. Suess et al., submitted). In summary, for all objects in the database with , each spectrum is integrated within three medium-width synthetic rest-frame filters (, , and ), which span the Balmer/4000 break and the spectral shape just redward of the break. We only include galaxies with in the and fluxes and colors similar to those of A-type stars ( and ). This selection yields a sample of 1318 unique objects, which span . Figure 1 shows the distribution of the full SQuIGGE sample in i magnitude (left) and stellar mass (right) versus redshift.
For this work, we rely on two sets of stellar population synthesis modeling, which we use in different contexts. The first set of models uses Prospector (Johnson & Leja, 2017; Leja et al., 2017; Johnson et al., 2021) to fit the SDSS and WISE (3.4m and m) photometry and spectra (Abolfathi et al., 2018; Schlafly et al., 2019) with a custom set of “non-parametric” star formation histories (SFHs), assuming a Kriek & Conroy (2013) dust law. These star formation histories are similar to default continuity prior non-parametric models from Leja et al. (2019), with three fixed duration, variable star formation rate (SFR) bins prior to 2 Gyrs of lookback time, five equal-mass bins with variable edges that follow, and a unique final bin with flexibility in timing and SFR normalization. Without this final bin, the default continuity assumptions could be too strict to allow for dramatic bursts or quick truncation in star formation as one might expect for post-starburst galaxies, effectively blurring out SFHs and biasing instantaneous SFRs to higher values. While conducting extensive recovery testing of stellar population properties using Prospector, we found that our adopted flexible star formation histories provide excellent recovery of instantaneous star formation rate (interpolated over the last 1 Myr) for sufficient SFR (), below which the measured star formation rates were poorly constrained by the existing spectra-photometric dataset (K. Suess et al. in prep). Therefore, when making comparisons to scaling relations, we set the star formation rates to a floor value of and label those points as upper limits.
We note that the low SFRs are consistent with follow-up Keck/LRIS spectroscopy targeting H (K. Suess et al., in prep). Although SFRs derived from H luminosity are less uncertain than e.g. [OII] luminosity-based SFRs used in Suess et al. (2017), due to dust and other contaminating ionizing sources, H-based SFRs are insensitive to heavily dust-obscured star formation. We see no strong evidence for such extreme obscuration e.g., in the 2mm continuum data presented in this paper, but will return to this in §4.
This Prospector spectral energy distribution (SED) modeling is designed to accurately recover SFHs and SFRs, particularly immediately before quenching. However, often these histories are more extended then a more standard exponentially declining or delayed exponential analytic SFH, yielding significantly higher stellar masses. This dex offset is a generic consequence of “non-parametric” SED modeling (see e.g. Leja et al., 2019; Lower et al., 2020) and is perhaps more extreme for the post-starburst galaxies in this sample. While we expect that the higher stellar masses likely reflect the intrinsic properties of the galaxies, we also fit the SDSS spectra and photometry with delayed exponential star formation histories (as described in Setton et al., 2020) assuming similar Chabrier (2003) IMF, Bruzual & Charlot (2003) libraries, and a Calzetti (1997) dust law using FAST++, an implementation of the FAST (Fitting and Assessment of Synthetic Templates) software (Kriek et al., 2009). The stellar masses derived from these fits () are an average of 0.38 dex lower than the stellar masses derived in the default fits. We plan to expand upon these differences in an upcoming paper (K. Suess et al. in prep), but in this work adopt the lower values to place SQuIGGE galaxies on scaling relations for consistency. Regardless of the technique used to calculate stellar masses, galaxies in the SQuIGGE Survey are generally bright and massive (), which is primarily driven by the spectroscopic signal-to-noise cut.
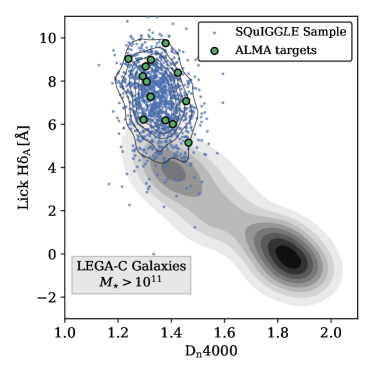
Although these selection criteria are designed to identify galaxies immediately following the truncation of a significant episode of star formation based on the shape of their SEDs, it almost exclusively includes galaxies that would also be designated as post-starbursts based on strong H absorption (98% of the sample has Lick H). For a comprehensive review of the range of post-starburst galaxy identification methods, we refer the reader to French (2021). Figure 2 shows the SQuIGGE sample as small blue points in Lick H versus parameter space, which is commonly used to study the demographics of broad galaxy populations (see e.g., Kauffmann et al., 2003). All indications from weak [O II] emission and full spectral modeling indicate that galaxies in the SQuIGGE sample would pass cuts designed to identify objects without significant ongoing star formation, but the traditional SFR indicator is redshifted out of the spectral wavelength coverage for the full dataset. For comparison, we show the distribution of similarly massive () galaxies at a similar epoch () from the third data release (DR3) of the Large Early Galaxy Astrophysics Census (LEGA-C) (van der Wel et al., 2016; Straatman et al., 2017; van der Wel et al., 2021) in gray contours. As demonstrated in Wu et al. (2018), massive galaxies at this epoch tend to have relatively old stellar populations as evidenced by weak Balmer absorption and strong 4000 breaks, corresponding to high spectral indices. This is in stark contrast with the recently-quenched post-starburst galaxies in the SQuIGGE survey; the LEGA-C galaxy distribution only barely reaches the low end of the SQuIGGE range in H indices. Although these samples probe similar redshifts, this lack of overlap is primarily an effect of survey volume. The 1.6 square degree section of the COSMOS field that was targeted by LEGA-C is relatively large for an extragalactic field, but it probes a vastly smaller volume than the BOSS Survey (10,000 square degrees) (Dawson et al., 2013).
| ID | RA | Dec | ALMA program | Observation Date | Integration Time | Angular Resolution |
|---|---|---|---|---|---|---|
| [degrees] | [degrees] | [s] | [] | |||
| SDSS_J0912+1523 | 138.17821 | 15.38479 | 2016.1.01126.S | 2017-01-08 | 5866.56 | 1.57 |
| SDSS_J2202-0033 | 330.60121 | -0.55955 | 2016.1.01126.S | 2017-03-07 | 5685.12 | 2.00 |
| SDSS_J1448+1010 | 222.19133 | 10.16960 | 2017.1.01109.S | 2018-03-12 | 5999.616 | 0.74 |
| SDSS_J0753+2403 | 118.43406 | 24.06005 | 2017.1.01109.S | 2018-03-20 | 5987.52 | 0.72 |
| SDSS_J1203+1807 | 180.98548 | 18.13016 | 2017.1.01109.S | 2018-03-14 | 5927.04 | 0.70 |
| SDSS_J1007+2330 | 151.80432 | 23.51530 | 2017.1.01109.S | 2018-03-15 | 5927.04 | 0.75 |
| SDSS_J1053+2342 | 163.44737 | 23.70956 | 2017.1.01109.S | 2018-03-16 | 5987.52 | 0.77 |
| SDSS_J0233+0052 | 38.49722 | 0.87734 | 2017.1.01109.S | 2018-04-04 | 5987.52 | 1.35 |
| SDSS_J1302+1043 | 195.70387 | 10.71748 | 2017.1.01109.S | 2018-03-21 | 5987.52 | 0.67 |
| SDSS_J1109-0040 | 167.38393 | -0.66774 | 2017.1.01109.S | 2018-04-10 | 5927.04 | 1.11 |
| SDSS_J0046-0147 | 11.66247 | -1.78856 | 2017.1.01109.S | 2018-04-15 | 5987.52 | 1.02 |
| SDSS_J0027+0129aaThis galaxy was also observed as part of 2016.1.01126.S, but those observations did not pass quality assessment (QA). | 6.85600 | 1.49942 | 2017.1.01109.S | 2018-04-10 | 5927.04 | 1.11 |
| SDSS_J2258+2313 | 344.52365 | 23.22115 | 2017.1.01109.S | 2018-05-01 | 5987.52 | 1.17 |
2.2 ALMA CO(2–1) Observations
We have targeted a subset of the SQuIGGE sample for extensive multi-wavelength follow-up studies, preliminary results of which have been published in several articles. In Suess et al. (2017) we published ALMA CO(2–1)-based detections of vast reservoirs (, or % and 4%)222We note that in Suess et al. (2017) we used delayed tau SFHs; the stellar masses based on flexible SFHs yield higher values and therefore lower measurements of 14.5% and 1% for the same galaxies. in two galaxies. These results suggest that the cold molecular gas is common in massive, recently quenched galaxies at , but are far from conclusive. In the current paper, we present the demographics of (as probed by CO(2–1)) in a larger sample of 13 galaxies, adding 11 galaxies to those presented in Suess et al. (2017). The targeted subset is indicated by the green circles and histograms in Figures 1 and 2. We note specifically that the subset of galaxies selected for ALMA follow-up (green points) span the range of stellar populations of the full SQuIGGE sample in this parameter space. Properties of the observations including program numbers, observation dates, integration times, and spatial resolution of the data are included in Table 1 and physical properties of the sample are also enumerated in Table 2. Because we chose this subsample for follow-up observations, our selection is biased towards brighter galaxies (in the i band) that can be observed by ALMA in the southern hemisphere. These targets are brighter due to a combination of slightly lower redshifts and higher masses than the full SQuIGGE selection. However, we note that the spectral diversity of the full SQuIGGE dataset, e.g., as probed by H and in Figure 2, is well-sampled by the ALMA targets.
Following the strategy of our pilot study (Suess et al., 2017, ALMA Program #2016.1.01126.S, PI: Bezanson), we targeted CO(2–1) in 11 additional galaxies using ALMA band 4 in Cycle 5 (PI: Bezanson, Program# 2017.1.01109.S). All targets were observed in two 80 minute observing blocks with the full 12m array. Total on-source integration times were hours and the angular resolution of the resulting datacubes ranges from 0.7–2″(see Table 1).
| Galaxy ID | Plate-MJD-Fiber | SFR | Lick H | |||||||
|---|---|---|---|---|---|---|---|---|---|---|
| [] | [] | [] | [] | [kpc] | ||||||
| SDSS_J1448+1010 | 5475-56011-379 | 0.6462 | 11.60 | 1.06 | 7.280.34 | 1.320.02 | 0.820.05 | 4.820.30 | 1.50.6 | 10.290.03 |
| SDSS_J0753+2403 | 4466-55857-198 | 0.5652 | 11.32 | 0.10 | 8.990.21 | 1.320.01 | 0.09 | 0.42 | 9.22 | |
| SDSS_J1053+2342 | 6417-56308-55 | 0.6370 | 11.62 | 0.29 | 6.010.44 | 1.410.02 | 0.15 | 0.86 | 9.54 | |
| SDSS_J0027+0129 | 4302-55531-482 | 0.5851 | 11.53 | 1.44 | 8.230.34 | 1.290.02 | 0.12 | 0.59 | 9.38 | |
| SDSS_J2202-0033 | 1105-52937-311 | 0.6573 | 11.73 | 1.99 | 8.680.27 | 1.300.01 | 0.270.03 | 1.620.21 | 8.7 | 9.810.06 |
| SDSS_J2258+2313 | 6308-56215-977 | 0.7058 | 11.82 | 0.94 | 6.210.53 | 1.300.02 | 1.860.08 | 13.100.56 | 12.40.9 | 10.720.02 |
| SDSS_J0233+0052 | 705-52200-614 | 0.5918 | 11.61 | 0.01 | 8.390.41 | 1.420.02 | 0.11 | 0.56 | 9.35 | |
| SDSS_J0046-0147 | 4370-55534-762 | 0.6088 | 11.55 | 0.14 | 9.760.30 | 1.380.02 | 0.12 | 0.61 | 9.39 | |
| SDSS_J1109-0040 | 278-51900-193 | 0.5935 | 11.29 | 2.33 | 7.970.36 | 1.310.02 | 0.780.06 | 3.850.30 | 5.70.9 | 10.190.03 |
| SDSS_J1203+1807 | 2595-54207-459 | 0.5946 | 11.44 | 0.02 | 7.070.42 | 1.460.02 | 0.09 | 0.45 | 9.26 | |
| SDSS_J1007+2330 | 6458-56274-501 | 0.6353 | 11.60 | 0.89 | 5.150.54 | 1.460.03 | 0.15 | 0.85 | 9.53 | |
| SDSS_J0912+1523 | 2438-54056-396 | 0.7473 | 11.37 | 0.81 | 9.030.33 | 1.240.01 | 1.070.05 | 8.470.36 | 6.20.8 | 10.530.02 |
| SDSS_J1302+1043aaThis target was included in an early generation of the SQuIGGE sample based on the SDSS DR12 spectra, but the spectral shape differs slightly in the DR14 spectrum, causing the rest-frame colors to fall out of the SQuIGGE selection cuts. We include this galaxy in all further analysis. | 5421-55980-512 | 0.5921 | 11.61bbThe Prospector modeling for this galaxy is unable to reproduce the WISE m flux, driving the fit against the edges of the priors for dust. We expect that this is due to AGN, AGB, or neighboring light that is not accounted for in the model parameter space. Therefore, we exclude WISE band 2 in for this object and the fit converges well. | 0.26 | 6.180.93 | 1.380.04 | 0.780.09 | 3.850.42 | 3.30.7 | 10.190.05 |
Note. — Upper limits for the undetected sources are 3, and assume an 800 km s-1line width.
Continuum images at 2 mm were created using the full bandwidth of the ALMA data, excluding 500 km s-1 around the expected frequency of the redshifted CO(2–1) line. The data reach continuum sensitivities 6-10 Jy. Continuum emission was detected in one target, SDSS_J0753+2403; the flux ratio between the upper and lower sidebands of the ALMA data and a detection at 1.4GHz (Greene et al., 2020) make clear that this is non-thermal synchrotron emission from AGN activity. Following Suess et al. (2017), the non-detections of the other sources imply upper limits on the presence of any highly obscured star formation, SFR 50 /yr, assuming a standard modified blackbody function and a dust temperature K. These limits are highly uncertain due to the unknown dust temperature because observed-frame 2 mm is far from the peak of the dust SED, but are sufficient to rule out very high obscured SFRs.
All CO(2–1) spectra are extracted by fitting circular Gaussian models to the visibilities using uvmultifit (Martí-Vidal et al., 2014). We generate spectra at effective velocity resolutions of 50, 100, and 200 km s-1. In the sources where CO is clearly detected, we often find evidence of velocity gradients and/or marginally-resolved source sizes in individual channels. We allow the position and size of the spatial Gaussian components to be free parameters across the line profiles, and fix them to the phase center and the median size for line-free channels. In undetected sources, we simply fix the centroid to the phase center and the size to 2” in all cases, a value typical of the detected sources.
Integrated line fluxes are estimated by fitting extracted spectra, using one (spectral) Gaussian
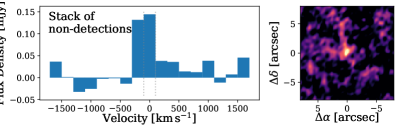
(SDSS_J2202-0033, SDSS_J1109-0400, SDSS_J13202+1043, and SDSS_J0912+1523) or two Gaussians (SDSS_J1488-1010 and SDSS_J2258-2312) to the CO(2–1) line profiles. For undetected galaxies, the upper limits on CO(2–1) line flux are conservatively estimated using a single 800 km s-1 wide channel; upper limits on the line fluxes for these sources scale as for alternative choices of the velocity width . We stack the integrated spectra of the seven galaxies that are individually undetected using the 200 km s-1spectra, finding a detection of CO(2–1) in the stacked spectrum. We verify this detection with a simple image-plane stack of the CO data cubes, but stress that this is merely for visualization purposes due to the varying spatial resolution of the input data cubes. We estimate the spatial extent of CO(2–1) emission in each detected galaxy by fitting 2D Gaussians in the image plane. Circularized half-width-half-max (HWHM) values are quoted in Table 2 in physical units (kpc).
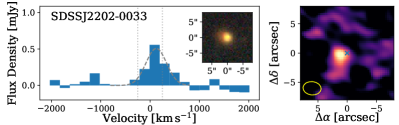
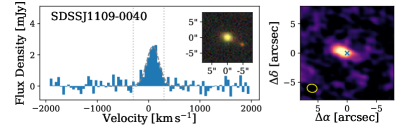
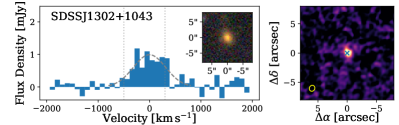
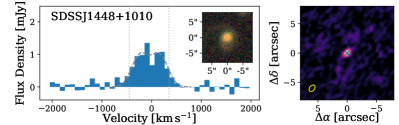
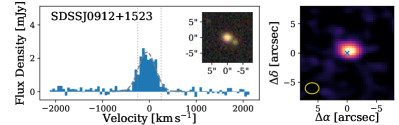
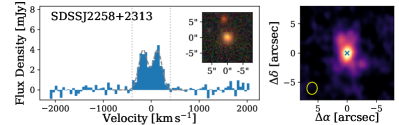
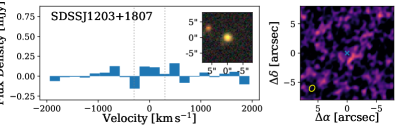
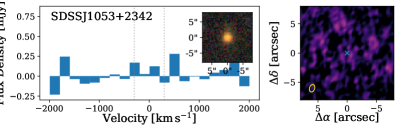
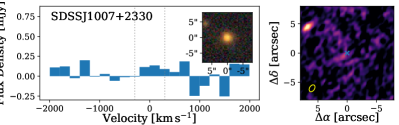
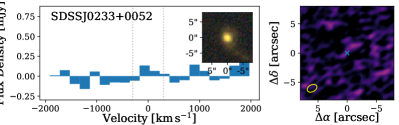
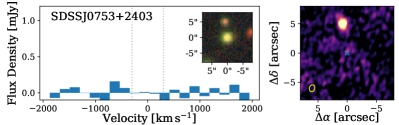
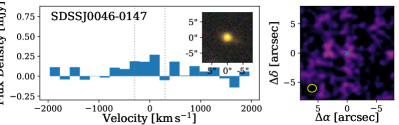
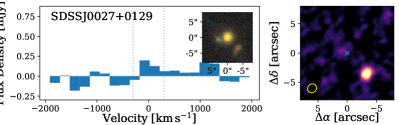
Of the 13 targeted galaxies, CO(2–1) emission was detected in six. The CO(2–1) spatially integrated spectra and line maps for the detected SQuIGGE galaxies are included in Figure 4 and undetected galaxies are included in Figure 4. Spectral Gaussian fits are included as dashed lines and vertical lines indicate the regions used to generate the linemaps. Optical images (grz) are included from the DESI Legacy Survey (Dey et al., 2019) as insets to the CO(2–1) spectra. We note that of the seven galaxies that are undetected in CO(2–1), three datacubes include significantly detected lines in close physical and kinematic proximity to the SQuIGGE galaxies. We interpret these as representing CO(2–1) emission from the cold gas reservoirs of neighboring galaxies. We note that due to the high stellar masses of the galaxies in this sample, we expect them to reside in dense environments, but defer the analysis of these nearby sources to future work. We detect non-thermal continuum emission in SDSS_J0753+2403, which we subtract from the spectrum in Figure 4.
Of the 6 detected galaxies, CO(2–1) is largely spatially coincident with the optical centroid of the galaxies, as determined from the SDSS imaging, with the exception of SDSS_J1109-0040 and SDSS_J2202-0033 (also in Suess et al., 2017). In SDSS_J2202-0033 the 1” offset from the optical centroid is not significant given the resolution and signal-to-noise of the data; we note that the optical image of this galaxy appears to be slightly asymmetric. The CO(2–1) emission in SDSS_J1109-0040 is spatially offset by ; it is possible that this galaxy is in the process of a close, late-stage merger for which only one galaxy is detected in CO. A possible companion galaxy is visible in the optical image, on the opposite side than the direction of elongation. Alternatively we may be detecting an especially strong CO outflow. In either case the emission is not especially broad ( km s-1) in comparison to the other detected sources. In two additional sources, SDSS_J1448+1010 and SDSS_J2258+2313, the CO emission appears to extend beyond the optical extent of the galaxies, reaching distances up to 4-5” from the center. These two objects may similarly be exhibiting late-stage mergers or molecular outflows in which a significant fraction of the molecular gas has been removed, or the gas may be associated with low surface-brightness stellar light not apparent in the SDSS imaging. These offset and extended sources are targets of follow-up ALMA observations that will be presented in future work. For this work we assume that all CO(2–1) emission detected is physically associated with the SQuIGGE post-starburst galaxies.
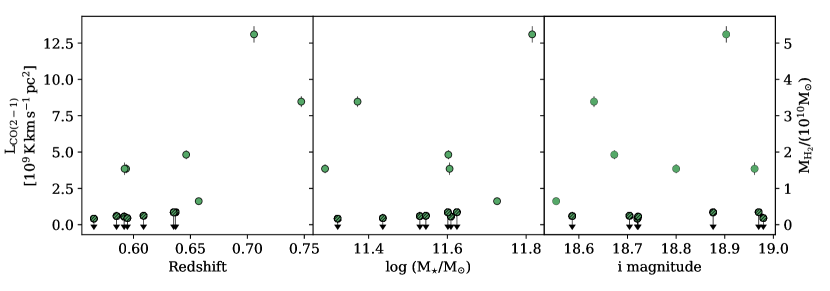
Figure 5 shows the CO(2–1) luminosity versus redshift (left), stellar mass (center), and i magnitude. To calculate masses from CO(2–1) we assume , making the conservative assumption of thermalized emission, (e.g., Combes et al., 2007; Dannerbauer et al., 2009; Young et al., 2011) and a Milky Way-like CO-H2 conversion factor of (Bolatto et al., 2013, and references within). We note that these assumptions are unlikely to lead to significant uncertainties in the implied properties. could only be lower than assumed, which would increase the . Higher values of would require either cooler and lower velocity dispersion gas (increasing the CO line opacity) or lower metallicities (decreasing the CO abundance) than in the Milky Way, both of which are unlikely. Lower could arise from hotter gas or higher velocity dispersions than typical giant molecular clouds in the Milky Way, which may be realistic in this sample. However, a factor of reduction in would be counteracted by any decrease in if the gas is not thermalized (e.g., Narayanan et al., 2012). Implied masses are indicated on the right axis in this figure. In the left panel there is a weak trend indicating that the higher redshift galaxies in the SQuIGGE sample are more likely to be detected in CO(2–1), which is possibly suggestive of an evolutionary sequence, however we emphasize that the selection criteria are fairly narrow. CO(2–1) luminosity and are independent of stellar mass or magnitude.
3 reservoirs of SQuIGGE galaxies
3.1 and Scaling Relations
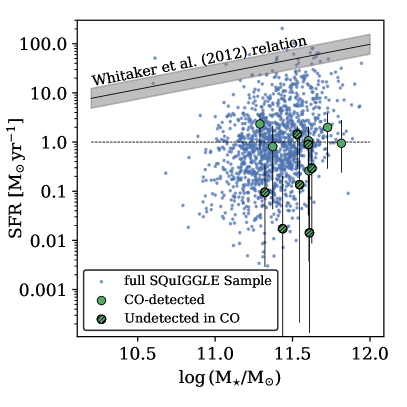
In this section we compare the enigmatic reservoirs of SQuIGGE galaxies to the scaling relations defined by “normal” star-forming galaxies at high and low-redshift and to other samples of sub-main sequence galaxies. In Figure 6, we show the SFRs of the SQuIGGE galaxies in blue (full sample) and green symbols for the ALMA targets. We include the “star-forming main sequence” scaling relation for star-forming galaxies at the average redshift of SQuIGGE (Whitaker et al., 2012b). The SQuIGGE sample lies significantly below this relation, although many have comparable gas reservoirs to coeval star forming galaxies. The SFRs for the CO-detected SQuIGGE galaxies (green circles) are on average systematically higher by a factor of than the undetected counterparts (hatched circles). However, we emphasize that measuring very low SFRs (SFRyr-1, dashed line) is extremely challenging.
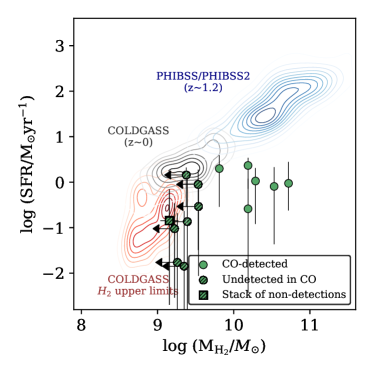
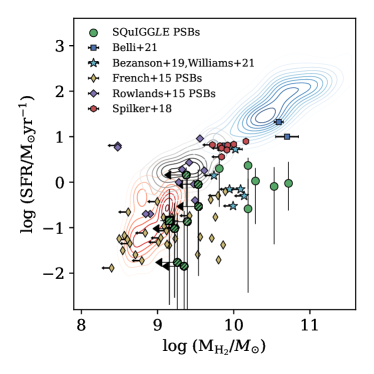
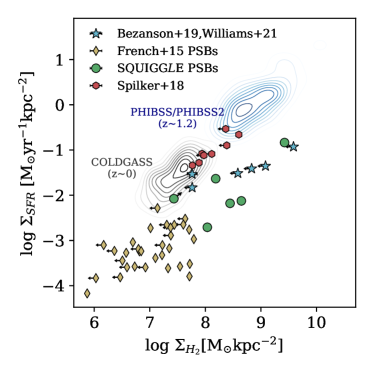
Figure 7 shows the SFR versus gas mass for the SQuIGGE post-starburst galaxies (green symbols). The empirical scaling relation for CO-based measurements is traced by colored contours. At lower SFR, massive galaxies at from COLDGASS (Saintonge et al., 2011a, b, 2012) are shown by black (for galaxies with detected CO(1–0) lines) and red (upper limits on CO(1–0)) contours. Star-forming galaxies at from PHIBSS/PHIBSS2 surveys (Tacconi et al., 2010; Genzel et al., 2015; Freundlich et al., 2019) are shown by blue contours. In the left panel, only individual SQuIGGE galaxies and the SQuIGGE stack are included. Detected galaxies are offset by dex in , while the stack of non-detections (hatched square) is consistent with the upper limits of galaxies with low SFRs in the local Universe. In the right panel we include other samples of galaxies with SFRs that place them below the main sequence of star-forming galaxies (e.g. Noeske et al., 2007). This panel includes post-starburst galaxies at from the SDSS (French et al., 2015; Rowlands et al., 2015). Much like the galaxies in SQuIGGE , post-starburst galaxies from French et al. (2015) (yellow diamonds) exhibit a range of reservoirs, which places some galaxies dex more gas rich than the upper limits of local low-SFR galaxies. Post-starburst galaxies from Rowlands et al. (2015) (purple diamonds) have higher quoted SFRs and lower , lying well within the distribution of galaxies in the COLDGASS sample. At higher redshift we also include galaxies at a roughly coeval from Spilker et al. (2018) as maroon hexagons, which are selected from the LEGA-C survey (van der Wel et al., 2016) to be sub-main sequence, but have optical spectra that suggest more gradual star formation histories than post-starburst galaxies. Finally we include CO-based measurements of for nine quiescent galaxies at (four detections and five upper limits), including two with post-starburst spectral signatures (strong Balmer absorption lines) (Bezanson et al., 2019; Belli et al., 2021; Williams et al., 2021). The reservoirs of the galaxies detected by Belli et al. (2021) (blue squares) are comparable to those of the SQuIGGE galaxies, however their higher SFRs (likely due to the fact that they are observed at higher redshift) place them closer to the coeval star-forming galaxies in the PHIBSS/PHIBSS2 survey (Tacconi et al., 2013, 2018).
It is useful to examine the SFR and masses in the more traditional projection of the Kennicutt-Schmidt relation (e.g. Kennicutt, 1998), as the density of cold gas is a more direct tracer of the fueling of star formation. As the galaxies are also unresolved in the existing ground-based imaging, we adopt circularized sizes derived from the CO(2–1) emission. Figure 8 shows the versus for SQuIGGE galaxies that are detected in CO(2–1) and other samples with reliable size measurements, using the same symbols as Figure 7. We note that all other samples are included using sizes estimated from stellar effective radii. Given the uncertainty in spatial extent that impacts both surface densities, detected SQuIGGE galaxies can only come closer to the tight Kennicutt-Schmidt relation if their CO(2-1) emission is more extended than the spatial distribution of any residual star formation.
A number of groups have investigated additional integrated scaling relations between gas reservoirs and the fueling of star formation and star formation efficiency in galaxies (e.g. Lilly et al., 2013; Tacconi et al., 2013; Scoville et al., 2017; Tacconi et al., 2018, 2020). In part motivated by the time evolution of the characteristic SFR() of galaxies, some papers advocate for redshift-evolving multivariate regressions that minimize the scatter, quantifying e.g. . The majority of the observational constraints on these scaling relations rely on galaxies that are near, on, or above the star-forming main sequence at any epoch. As a result, this sample provides a useful tool to probe the scatter about these relations at low SFRs. As motivated in §2, we adopt slightly different definitions for stellar mass and SFR in Figures 9 and 10. These definitions are more consistent with those used to derive the scaling relations. We use , from delayed exponential SFHs, for the former and treat SFRyr-1 as a floor for derived values, below which SFRs are plotted as upper limits.
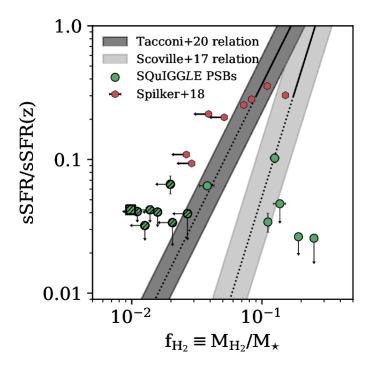
Figure 9 shows the specific SFR (sSFR), normalized relative to the star forming main sequence, versus gas fractions for the sample of post-starburst galaxies presented in this paper. We also include a coeval sample of massive and sub-main sequence galaxies from Spilker et al. (2018). These individual measurements can be contrasted with extensions of two redshift-dependent scaling relations from Scoville et al. (2017) (dark gray band) and Tacconi et al. (2020) (light gray band), plotted assuming the average redshift and stellar mass of the SQuIGGE ALMA sample. For each scaling relation the quoted scatter is indicated by the gray band and the scaling relation is indicated by a solid gray or black line where the relation is calibrated and dotted lines to indicate where each is extrapolated. Although there is some agreement between the galaxies with higher sSFR and the scaling relations, at lower specific star formation rates, where the two relations diverge, it is clear that there is a significant offset between the -detected SQuIGGE galaxies (green circles) and the undetected counterparts (hatched green symbols) - individually or in the stack (square). Detected galaxies would need to have vastly underestimated star formation rates (by at least an order of magnitude) to be consistent with either scaling relation. Such high SFRs are disfavored by e.g., the non-detection of 2mm dust continuum emission in any source.
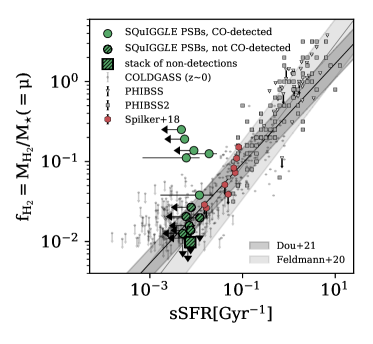
It is also possible to define more inclusive scaling relations, along the lines of e.g., the fundamental metallicity relation (e.g., Mannucci et al., 2010), that encompass the redshift-evolution of the galaxy population by spanning the range of properties through which galaxies evolve. In addition to being easier to graphically depict, the simplicity of such scaling relations is appealing because it does not require relying on evolving physics. One such parameter space is the relation between gas fraction (typically denoted as or ) and specific star formation rate, as shown in Figure 10. In this figure we can include galaxies at a number of cosmic times, spanning from (Saintonge et al., 2011a, b, 2012) to (Tacconi et al., 2013). At different redshifts, normal star-forming galaxies (all indicated by gray points) fall along a similar relation, but occupy varying regimes in sSFR. We show two such parameterizations of this integrated scaling from Feldmann (2020) and Dou et al. (2021). In this projection, we note that quiescent galaxies from Spilker et al. (2018) and the stacked non-detections no longer fall outside of the scatter, rather they lie near lower-redshift star-forming counterparts. However, the -rich galaxies in this sample remain dramatic outliers in this projection of gas fueling as well. We note that post-starburst galaxies from the French et al. (2018) sample lie in a similarly offset location, but we omit them from the diagram for clarity of presentation. This offset from all other samples of galaxies suggests that the deviation is temporary, but whether the H2-rich galaxies rejuvenate at SFRs that correspond to their gas reservoirs or lose, heat, or deplete H2 and quench permanently cannot be determined.
3.2 Star Formation Histories and Reservoirs
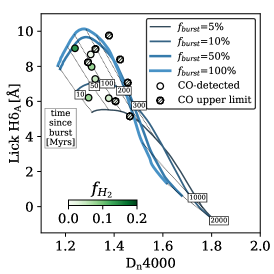
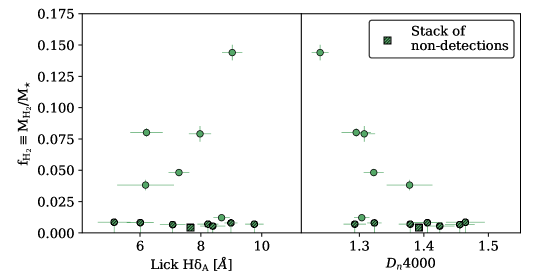
Finally, we investigate the relationship between the stellar populations of the galaxies in this sample and the residual gas fractions in Figure 11. In Figure 11a, we show SQuIGGE galaxies on the H versus space, colored by . Tracks were generated using Flexible Stellar Population Synthesis (FSPS) (Conroy et al., 2009; Conroy & Gunn, 2010), assuming two top hat star formation histories, , and solar metallicity. Lines of constant age are indicated by thin dotted lines, and time since burst in Myr is labeled in rectangular boxes. Galaxies with the highest gas fractions (circular symbols) are located towards the left, or low , portion of this panel, and galaxies that are undetected at the survey depths (, hatched circles) have higher values. This corresponds to roughly an inverse relationship between the existence of a gas reservoir and time since burst, with the majority of detectable gas in galaxies that quenched in the last Myr.
Trends between molecular gas fraction and stellar continuum indices are shown in the center and right panels of Figure 11: versus H (Figure 11b) and (Figure 11c). There is no significant trend with H (Figure 11b). This suggests that residual gas reservoirs are independent of the fraction of mass that was formed during the major burst, which primarily drives the maximum . The analysis of this trend is complicated by the fact that this parameter is double-valued in its time evolution. The trend with is much more apparent; the majority (5 of 7) of galaxies with have , while at higher values only one galaxy has detectable CO(2–1) emission. The average implied by the stacked CO(2–1) flux from individually undetected galaxies is consistent with the decreasing trend in with . Unlike H, increases monotonically with age; the trend we observe corresponds to declining H2 reservoirs after the end of the starburst event. After about a hundred Myr the molecular gas fractions dwindle below .
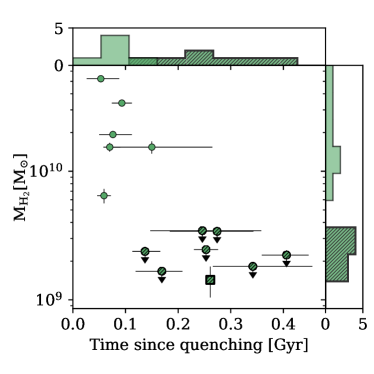
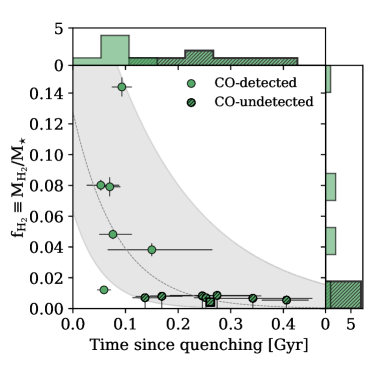
The Prospector stellar population synthesis modeling used to determine e.g., the stellar masses and SFR of galaxies in the sample also provides flexible star formation histories. From these star formation histories, we compute the time between rapid quenching of star formation and the time of observation, which we refer to as the time since quenching (; see Suess et al.2021 subm.). In Figure 12, we show that the gas masses (left) and fractions (right) are even more strongly correlated with than with the empirical indices. This is likely driven by the fact that these derived star formation histories are based on the full suite of spectral indices, essentially incorporating complex combinations of features that vary on different timescales (see e.g., Figure 11a). It is immediately clear that the -rich versus -poor bimodality is statistically significant; only galaxies with Myr retain . We note that the single galaxy that is detected in H2, but has a slightly longer such that it overlaps with the H2-poor subset is the single object that falls out of the DR14 spectroscopic S/N cuts. This may explain the relatively large uncertainty on , however we include this potentially discrepant object in our analysis to avoid introducing a confirmation bias. We perform a student T test on the full sample and verify that the detected and 3 limits on are not drawn from the same distribution, with p=0.02. In addition to the bimodality, we quantify the implied exponential decay timescale by fitting versus , including the detected galaxies and the stack of undetected targets using Orthogonal distance regression with scipy.ODR. The resulting fit and confidence interval are included on 12b as dashed line and gray band. This analysis yields an exponential depletion timescale of 8445 Myr, a remarkably rapid decline in the H2 reservoirs post-quenching, as we discuss further below.
4 Discussion
The primary result of this paper is that nearly half of the massive, post-starburst galaxies at in the SQuIGGE sample retain significant reservoirs (), building upon our pilot study of two galaxies (Suess et al., 2017). Timing derived from stellar population synthesis modeling suggests that this disappears rapidly; no CO(2–1) emission is detected in galaxies observed 150 Myrs after their star formation truncated. The existence of similar enigmatic molecular gas reservoirs has also been reported in a number of samples of post-starburst galaxies in the local Universe (e.g. French et al., 2015; Rowlands et al., 2015; Alatalo et al., 2016). Moreover, we find a striking difference in the molecular gas properties of young vs. old post-starbursts, suggesting that the cold gas rapidly disappears 100-200 Myr post-quenching. Intriguingly, a detailed study of the star formation histories of the local sample found a similar anti-correlation between and the reservoirs, finding an exponential depletion timescale of 117-230 Myrs (French et al., 2018). Those local samples span a much larger range in stellar masses than SQuIGGE (). At low-redshift, similarly massive (11) z0 galaxies tend to be products of less extreme (10% mass fractions) bursts. Regardless, the similarity with the maximum beyond which no SQuIGGE galaxies are detected in CO(2–1) is striking, suggesting the two populations experience similar ties between quenching and cold gas depletion in the 200 Myrs after quenching.
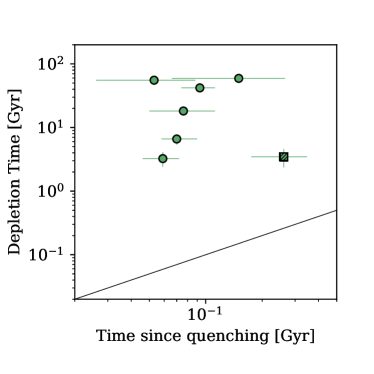
We emphasize that the depletion times due to ongoing star formation for the SQuIGGE galaxies are very long ( Gyr) given their large reservoirs and low unobscured star formation rates. In Figure 13 we show the star formation depletion times () for SQuIGGE targets (green symbols) and stack of non-detections (square) versus . It is immediately clear that the younger SQuIGGE galaxies have insufficient residual star formation for the observed reservoirs to deplete, especially if we assume that this trend corresponds to an evolutionary sequence. The exponential depletion time calculated for this sample (8445 Myrs) is comparable (within 1) to the depletion timescale found by French et al. (2018) in low-redshift post-starburst galaxies. French et al. (2018) argue convincingly that such a rapid depletion timescale cannot be explained by on-going minimal star formation, extreme variations in stellar populations (e.g., the initial mass function), stellar winds or supernova feedback, pointing to this as possible smoking gun evidence for AGN feedback. We emphasize that we cannot rule out the possibility that star formation is only temporarily halted in the -rich SQuIGGE galaxies, which are caught in the opposite transition, immediately prior to rejuvenation. In that case, the two halves of the SQuIGGE sample (gas-rich and gas-poor) may represent two different populations altogether depending on whether or not they will resume star formation in the future.
Another possible explanation for the large reservoirs that do not appear to fuel star formation could be that these galaxies harbor heavily dust-obscured star formation, causing depletion time estimates to be severely underestimated. We do not see evidence of continuum emission due to dust-obscured star formation in these galaxies in the 2mm ALMA data presented in this work333As noted in §2.1, one galaxy, SDSS_J0753+2403 has detected non-thermal synchrotron emission, which we attribute to AGN activity, placing a limit of SFR 50 . Although a number of galaxies in the SQuIGGE dataset are detected by the Very Large Array (VLA) Faint Images of the Sky at Twenty-Centimeters (FIRST) survey (Becker et al., 1995), those data are too shallow to be sensitive to realistic levels of radio emission due to on-going star formation (such fluxes would correspond to ). Instead we interpret those detections as originating from AGN activity and explore that connection in a separate paper (Greene et al., 2020). In general, estimating the SFR for post-starburst galaxies is challenging. An analysis of local E+A galaxies found significant scatter amongst different indicators, concluding that total infrared luminosity provides overestimates of the intrinsic SFRs (Smercina et al., 2018). This implies that if SFR under standard assumptions, the true upper limit would be even stronger. We note that even if the SFRs are underestimated by an order of magnitude, the depletion times for the most extreme, youngest SQuIGGE would still be closer to Gyr, which is much longer than the range in probed by this sample. Therefore, if we assume that the trend in Figure 12 is a time sequence, 2 dex of dust-obscured star formation would be needed to deplete the , which we would expect to see in continuum emission in the Band 4 ALMA data.
Interestingly, this empirical finding of large reservoirs in the youngest SQuIGGE galaxies is suggestively similar to an observed trend in the AGN occurrence rates within the same sample (Greene et al., 2020). This is especially clear for AGN identified via optical emission lines (high [O III] ratios), which are times more common in the youngest SQuIGGE galaxies. Although the parent sample is the same for both studies, only one galaxy (SDSS_J1448+1010) with strong [O III] emission, indicating the presence of an AGN, is included in this ALMA sample. Therefore, we cannot make any robust claims about a possible causal correlation between the presence of an actively accreting supermassive black hole and the removal, heating, or destruction of within or surrounding these massive post-starburst galaxies.
While post-starburst galaxies remain a subdominant population of galaxies for the past Gyrs, observational studies of massive galaxies of the high-redshift universe have begun to demonstrate that around the general population of massive () galaxies is in the process of rapidly quenching their primary episode of star formation (Whitaker et al., 2012a; Muzzin et al., 2013; Tomczak et al., 2014; Davidzon et al., 2017). Spectroscopic samples of such distant, massive galaxies indicate that post-starburst stellar populations are common (e.g. van de Sande et al., 2011, 2013; Bezanson et al., 2013; Belli et al., 2015; Carnall et al., 2019; Kriek et al., 2019; Wild et al., 2020; Tacchella et al., 2021), suggesting that many massive galaxies undergo a dramatic truncation of star formation. Which physical processes are responsible for driving those quenching events that can also concurrently destroy, deplete, or heat their molecular gas reservoirs is poorly constrained empirically. Bezanson et al. (2019) placed stringent upper limits in a galaxy and similarly Williams et al. (2021) expanded the sample to include five additional galaxies. From the overall low fractions in that sample, Williams et al. (2021) conclude the need for rapid ( Gyr) depletion. We note that this timescale cannot be compared directly to the parameter used in this study, which starts specifically after star formation shuts down. The galaxies in those samples were significantly older, with a post-burst age closer to Gyr than the SQuIGGE galaxies that are detected in CO(2–1). Therefore, although the galaxies at that epoch are generally more gas-rich than local galaxies (e.g., Tacconi et al., 2013, 2018; Freundlich et al., 2019; Belli et al., 2021), we would not have predicted that they would be detected based on the results presented in this paper. Therefore, while the striking similarity between studies of post-starburst galaxies at and the more extreme cases at presented in this paper is suggestive that quenching does not necessarily coincide with the elimination of the reservoirs, direct studies of galaxies during the primary quenching epoch will be critical in strengthening our understanding of the quenching mechanisms at play.
While no model includes the existence of after star formation shuts down by construction, the rapid disappearance of these cold gas reservoirs in post-starburst galaxies is easily consistent with the gas-poor nature of older quiescent galaxies (e.g., Young et al., 2011, 2014). As they stand, these data present a challenge to galaxy formation models. Larger, more statistical studies of reservoirs in this and similar populations of recently quenched galaxies could precisely time the disappearance of . We anticipate that spatially resolved maps may provide clues as to the distribution and kinematics of the , which may help explain how it is stabilized against collapse. Initial studies of the stellar kinematics of this sample have revealed a range of rotational support (Setton et al., 2020) and, in one case, that the CO(2–1) kinematics follow the stellar motion (Hunt et al., 2018). French et al. (2018) found a smooth exponential depletion of gas over time to provide the best fit for local galaxies. Deeper observations of individually undetected galaxies could assess how smooth the transition from -rich is for our intermediate-redshift galaxies, as the current observations seem to reveal a more discontinuous distribution.
Theoretical and observational studies have pointed out that dynamical support against H2 collapse could also stem from turbulent pressure in the gas. For example, slightly lower star formation efficiency is observed in morphologically classified local early type galaxies; the same molecular gas reservoirs form 2.5 times fewer stars in ellipticals than spiral galaxies (e.g., Davis et al., 2014). Similarly, quiescence below the main sequence is driven by both depleted gas reservoirs and diminished star formation efficiency (e.g., Piotrowska et al., 2020). This effect is often attributed to relatively deep gravitational wells and increased disordered orbits, “morphological quenching” (Martig et al., 2009), but could also be driven by streaming motions (Meidt et al., 2013). Gensior et al. (2020) found that the existence of compact, spheroidal structures can indeed drive turbulent pressure, pointing towards the feasibility of morphological quenching. This could be especially relevant given that the sizes of post-starburst galaxies are often compact, even with respect to older quiescent galaxies (e.g., Yano et al., 2016; Wu et al., 2020, D. Setton, in prep.). It has been demonstrated the turbulent motions in the interstellar medium, perhaps induced by a combination of shocks and magnetic fields, could support H2 against collapse (e.g., Federrath, 2015). Simulations of relativistic jets can drive shocks that diminish star formation rates by a factor of (e.g. Mandal et al., 2021), but not all specific implementations of jet astrophysics can effectively quench star formation (e.g., Su et al., 2021). Furthermore, given that most of these processes can decrease star formation efficiency by only a modest factor of a few, it remains unclear whether even combined these models could explain the order of magnitude offsets in star formation efficiency exhibited by the youngest SQuIGGE galaxies. Perhaps further analysis of systematic suites of simulations (e.g., Su et al., 2021) could use the immediate decrease in star formation efficiency and subsequent rapid ( Myr) disappearance of H2 to differentiate amongst feedback models. Such studies could be especially constrained by extracting observed quantities matched to the SQuIGGE dataset. In particular, Su et al. (2021) showed the promising efficiency of cosmic ray jets, which rapidly shut off star formation on a similar timescale; a more careful comparison would be needed to assess whether the depletion time lag is also consistent.
Although the similarity of the French et al. (2018) results at and the more extreme post-starbursts at intermediate redshifts presented in this paper suggests a fundamental challenge to galaxy formation models, the strongest test will come from earlier times, at the peak epoch of galaxy quenching and transformation (e.g. Wild et al., 2016). In this paper, we focus on CO-based measurements of , however recent studies have suggested elevated average cold gas reservoirs in quiescent galaxies at cosmic noon based on stacked far-infrared dust continuum emission (e.g. Gobat et al., 2018; Magdis et al., 2021), in apparent contradiction with low or absent in individual galaxies (e.g. Caliendo et al., 2021; Williams et al., 2021; Whitaker et al., 2021). One possible interpretation is that these stacks include a subset of -rich recently quenched ( Myr) galaxies averaged with a depleted majority. Identifying these young galaxies requires spectroscopic data of sufficient quality to precisely measure star formation histories. Although current spectroscopic samples of galaxies at cosmic noon are somewhat rare, in the coming years massively multiplexed spectrographs with NIR capabilities, like the Prime Focus Spectrograph on Subaru (Takada et al., 2014) or MOONS (Multi-Object Optical and Near-infrared Spectrograph)) (Maiolino et al., 2020), will produce hundreds of recently quenched targets at this critical epoch. Follow-up studies of their reservoirs, either with CO or dust-based estimates, will ultimately determine the timescale and simultaneity of quenching and the disappearance of in massive quiescent galaxies.
References
- Abolfathi et al. (2018) Abolfathi, B., Aguado, D. S., Aguilar, G., et al. 2018, ApJS, 235, 42
- Alatalo (2015) Alatalo, K. 2015, ApJ, 801, L17
- Alatalo et al. (2016) Alatalo, K., Lisenfeld, U., Lanz, L., et al. 2016, ApJ, 827, 106
- Anglés-Alcázar et al. (2017) Anglés-Alcázar, D., Faucher-Giguère, C.-A., Quataert, E., et al. 2017, MNRAS, 472, L109
- Astropy Collaboration et al. (2013) Astropy Collaboration, Robitaille, T. P., Tollerud, E. J., et al. 2013, A&A, 558, A33
- Becker et al. (1995) Becker, R. H., White, R. L., & Helfand, D. J. 1995, ApJ, 450, 559+
- Belli et al. (2015) Belli, S., Newman, A. B., & Ellis, R. S. 2015, ApJ, 799, 206
- Belli et al. (2021) Belli, S., Contursi, A., Genzel, R., et al. 2021, ApJ, 909, L11
- Bezanson et al. (2019) Bezanson, R., Spilker, J., Williams, C. C., et al. 2019, ApJ, 873, L19
- Bezanson et al. (2013) Bezanson, R., van Dokkum, P., van de Sande, J., Franx, M., & Kriek, M. 2013, ApJ, 764, L8
- Bolatto et al. (2013) Bolatto, A. D., Wolfire, M., & Leroy, A. K. 2013, ARA&A, 51, 207
- Bruzual & Charlot (2003) Bruzual, G., & Charlot, S. 2003, MNRAS, 344, 1000
- Caliendo et al. (2021) Caliendo, J. N., Whitaker, K. E., Akhshik, M., et al. 2021, ApJ, 910, L7
- Calzetti (1997) Calzetti, D. 1997, AJ, 113, 162
- Carnall et al. (2019) Carnall, A. C., McLure, R. J., Dunlop, J. S., et al. 2019, MNRAS, 490, 417
- Chabrier (2003) Chabrier, G. 2003, PASP, 115, 763
- Combes et al. (2007) Combes, F., Young, L. M., & Bureau, M. 2007, MNRAS, 377, 1795
- Conroy & Gunn (2010) Conroy, C., & Gunn, J. E. 2010, , , ascl:1010.043
- Conroy et al. (2009) Conroy, C., Gunn, J. E., & White, M. 2009, ApJ, 699, 486
- Crain et al. (2015) Crain, R. A., Schaye, J., Bower, R. G., et al. 2015, MNRAS, 450, 1937
- Croton et al. (2006) Croton, D. J., Springel, V., White, S. D. M., et al. 2006, MNRAS, 365, 11
- Dannerbauer et al. (2009) Dannerbauer, H., Daddi, E., Riechers, D. A., et al. 2009, ApJ, 698, L178
- Davé et al. (2019) Davé, R., Anglés-Alcázar, D., Narayanan, D., et al. 2019, MNRAS, 486, 2827
- Davé et al. (2017) Davé, R., Rafieferantsoa, M. H., Thompson, R. J., & Hopkins, P. F. 2017, MNRAS, 467, 115
- Davidzon et al. (2017) Davidzon, I., Ilbert, O., Laigle, C., et al. 2017, A&A, 605, A70
- Davis et al. (2011) Davis, T. A., Alatalo, K., Sarzi, M., et al. 2011, MNRAS, 417, 882
- Davis et al. (2013) Davis, T. A., Alatalo, K., Bureau, M., et al. 2013, MNRAS, 429, 534
- Davis et al. (2014) Davis, T. A., Young, L. M., Crocker, A. F., et al. 2014, MNRAS, 444, 3427
- Dawson et al. (2013) Dawson, K. S., Schlegel, D. J., Ahn, C. P., et al. 2013, AJ, 145, 10
- Dey et al. (2019) Dey, A., Schlegel, D. J., Lang, D., et al. 2019, AJ, 157, 168
- Dou et al. (2021) Dou, J., Peng, Y., Renzini, A., et al. 2021, ApJ, 907, 114
- Dressler & Gunn (1983) Dressler, A., & Gunn, J. E. 1983, ApJ, 270, 7
- Federrath (2015) Federrath, C. 2015, MNRAS, 450, 4035
- Feldmann (2020) Feldmann, R. 2020, Communications Physics, 3, 226
- Feldmann & Mayer (2015) Feldmann, R., & Mayer, L. 2015, MNRAS, 446, 1939
- Feldmann et al. (2017) Feldmann, R., Quataert, E., Hopkins, P. F., Faucher-Giguère, C.-A., & Kereš, D. 2017, MNRAS, 470, 1050
- French (2021) French, K. D. 2021, arXiv e-prints, arXiv:2106.05982
- French et al. (2015) French, K. D., Yang, Y., Zabludoff, A., et al. 2015, ApJ, 801, 1
- French et al. (2018) French, K. D., Yang, Y., Zabludoff, A. I., & Tremonti, C. A. 2018, ApJ, 862, 2
- Freundlich et al. (2019) Freundlich, J., Combes, F., Tacconi, L. J., et al. 2019, A&A, 622, A105
- Gensior et al. (2020) Gensior, J., Kruijssen, J. M. D., & Keller, B. W. 2020, MNRAS, 495, 199
- Genzel et al. (2015) Genzel, R., Tacconi, L. J., Lutz, D., et al. 2015, ApJ, 800, 20
- Gobat et al. (2018) Gobat, R., Daddi, E., Magdis, G., et al. 2018, NatureAst., 2, 239
- Greene et al. (2020) Greene, J. E., Setton, D., Bezanson, R., et al. 2020, ApJ, 899, L9
- Hunt et al. (2018) Hunt, Q., Bezanson, R., Greene, J. E., et al. 2018, ApJ, 860, L18
- Johnson & Leja (2017) Johnson, B., & Leja, J. 2017, Bd-J/Prospector: Initial Release, vv0.1, Zenodo, doi:10.5281/zenodo.1116491
- Johnson et al. (2021) Johnson, B., Foreman-Mackey, D., Sick, J., et al. 2021, dfm/python-fsps: python-fsps v0.4.0, vv0.4.0, Zenodo, doi:10.5281/zenodo.4577191
- Kauffmann et al. (2003) Kauffmann, G., Heckman, T. M., Tremonti, C., et al. 2003, MNRAS, 346, 1055
- Kennicutt (1998) Kennicutt, R. C. 1998, ARA&A, 36, 189
- Kriek & Conroy (2013) Kriek, M., & Conroy, C. 2013, ApJ, 775, L16
- Kriek et al. (2009) Kriek, M., van Dokkum, P. G., Labbé, I., et al. 2009, ApJ, 700, 221
- Kriek et al. (2010) Kriek, M., Labbé, I., Conroy, C., et al. 2010, ApJ, 722, L64
- Kriek et al. (2019) Kriek, M., Price, S. H., Conroy, C., et al. 2019, ApJ, 880, L31
- Leja et al. (2017) Leja, J., Johnson, B. D., Conroy, C., van Dokkum, P. G., & Byler, N. 2017, ApJ, 837, 170
- Leja et al. (2019) Leja, J., Johnson, B. D., Conroy, C., et al. 2019, ApJ, 877, 140
- Lilly et al. (2013) Lilly, S. J., Carollo, C. M., Pipino, A., Renzini, A., & Peng, Y. 2013, ApJ, 772, 119
- Lower et al. (2020) Lower, S., Narayanan, D., Leja, J., et al. 2020, ApJ, 904, 33
- Magdis et al. (2021) Magdis, G. E., Gobat, R., Valentino, F., et al. 2021, A&A, 647, A33
- Maiolino et al. (2020) Maiolino, R., Cirasuolo, M., Afonso, J., et al. 2020, The Messenger, 180, 24
- Mandal et al. (2021) Mandal, A., Mukherjee, D., Federrath, C., et al. 2021, MNRAS, arXiv:2109.13654
- Mannucci et al. (2010) Mannucci, F., Cresci, G., Maiolino, R., Marconi, A., & Gnerucci, A. 2010, MNRAS, 408, 2115
- Martí-Vidal et al. (2014) Martí-Vidal, I., Vlemmings, W. H. T., Muller, S., & Casey, S. 2014, A&A, 563, A136
- Martig et al. (2009) Martig, M., Bournaud, F., Teyssier, R., & Dekel, A. 2009, ApJ, 707, 250
- McDermid et al. (2015) McDermid, R. M., Alatalo, K., Blitz, L., et al. 2015, MNRAS, 448, 3484
- Meidt et al. (2013) Meidt, S. E., Schinnerer, E., García-Burillo, S., et al. 2013, ApJ, 779, 45
- Muzzin et al. (2013) Muzzin, A., Marchesini, D., Stefanon, M., et al. 2013, ApJ, 777, 18
- Narayanan et al. (2012) Narayanan, D., Krumholz, M. R., Ostriker, E. C., & Hernquist, L. 2012, MNRAS, 421, 3127
- Noeske et al. (2007) Noeske, K. G., Weiner, B. J., Faber, S. M., et al. 2007, ApJ, 660, L43
- Pacifici et al. (2016) Pacifici, C., Kassin, S. A., Weiner, B. J., et al. 2016, ApJ, 832, 79
- Pillepich et al. (2018) Pillepich, A., Springel, V., Nelson, D., et al. 2018, MNRAS, 473, 4077
- Piotrowska et al. (2020) Piotrowska, J. M., Bluck, A. F. L., Maiolino, R., Concas, A., & Peng, Y. 2020, MNRAS, 492, L6
- Rodríguez Montero et al. (2019) Rodríguez Montero, F., Davé, R., Wild, V., Anglés-Alcázar, D., & Narayanan, D. 2019, MNRAS, 490, 2139
- Rowlands et al. (2015) Rowlands, K., Wild, V., Nesvadba, N., et al. 2015, MNRAS, 448, 258
- Saintonge et al. (2011a) Saintonge, A., Kauffmann, G., Kramer, C., et al. 2011a, MNRAS, 415, 32
- Saintonge et al. (2011b) Saintonge, A., Kauffmann, G., Wang, J., et al. 2011b, MNRAS, 415, 61
- Saintonge et al. (2012) Saintonge, A., Tacconi, L. J., Fabello, S., et al. 2012, ApJ, 758, 73
- Sargent et al. (2015) Sargent, M. T., Daddi, E., Bournaud, F., et al. 2015, ApJ, 806, L20
- Schaye et al. (2015) Schaye, J., Crain, R. A., Bower, R. G., et al. 2015, MNRAS, 446, 521
- Schlafly et al. (2019) Schlafly, E. F., Meisner, A. M., & Green, G. M. 2019, ApJS, 240, 30
- Schruba et al. (2011) Schruba, A., Leroy, A. K., Walter, F., et al. 2011, AJ, 142, 37
- Scoville et al. (2017) Scoville, N., Lee, N., Vanden Bout, P., et al. 2017, ApJ, 837, 150
- Setton et al. (2020) Setton, D. J., Bezanson, R., Suess, K. A., et al. 2020, ApJ, 905, 79
- Smercina et al. (2018) Smercina, A., Smith, J. D. T., Dale, D. A., et al. 2018, ApJ, 855, 51
- Spilker et al. (2018) Spilker, J., Bezanson, R., Barišić, I., et al. 2018, ApJ, 860, 103
- Straatman et al. (2017) Straatman, C. M. S., Glazebrook, K., Kacprzak, G. G., et al. 2017, ApJ, 839, 57
- Su et al. (2021) Su, K.-Y., Hopkins, P. F., Bryan, G. L., et al. 2021, MNRAS, 507, 175
- Suess et al. (2017) Suess, K. A., Bezanson, R., Spilker, J. S., et al. 2017, ApJ, 846, L14
- Tacchella et al. (2021) Tacchella, S., Conroy, C., Faber, S. M., et al. 2021, arXiv:2102.12494
- Tacconi et al. (2020) Tacconi, L. J., Genzel, R., & Sternberg, A. 2020, ARA&A, 58, 157
- Tacconi et al. (2010) Tacconi, L. J., Genzel, R., Neri, R., et al. 2010, Nature, 463, 781
- Tacconi et al. (2013) Tacconi, L. J., Neri, R., Genzel, R., et al. 2013, ApJ, 768, 74
- Tacconi et al. (2018) Tacconi, L. J., Genzel, R., Saintonge, A., et al. 2018, ApJ, 853, 179
- Takada et al. (2014) Takada, M., Ellis, R. S., Chiba, M., et al. 2014, PASJ, 66, R1
- Thomas et al. (2005) Thomas, D., Maraston, C., Bender, R., & Mendes de Oliveira, C. 2005, ApJ, 621, 673
- Tomczak et al. (2014) Tomczak, A. R., Quadri, R. F., Tran, K.-V. H., et al. 2014, ApJ, 783, 85
- van de Sande et al. (2011) van de Sande, J., Kriek, M., Franx, M., et al. 2011, ApJ, 736, L9
- van de Sande et al. (2013) —. 2013, ApJ, 771, 85
- van der Wel et al. (2016) van der Wel, A., Noeske, K., Bezanson, R., et al. 2016, ApJS, 223, 29
- van der Wel et al. (2021) van der Wel, A., Bezanson, R., D’Eugenio, F., et al. 2021, arXiv e-prints, arXiv:2108.00744
- Virtanen et al. (2020) Virtanen, P., Gommers, R., Oliphant, T. E., et al. 2020, Nature Methods, 17, 261
- Waskom (2021) Waskom, M. L. 2021, Journal of Open Source Software, 6, 3021. https://doi.org/10.21105/joss.03021
- Weinberger et al. (2017) Weinberger, R., Springel, V., Hernquist, L., et al. 2017, MNRAS, 465, 3291
- Whitaker et al. (2012a) Whitaker, K. E., Kriek, M., van Dokkum, P. G., et al. 2012a, ApJ, 745, 179
- Whitaker et al. (2012b) Whitaker, K. E., van Dokkum, P. G., Brammer, G., & Franx, M. 2012b, ApJ, 754, L29
- Whitaker et al. (2021) Whitaker, K. E., Williams, C. C., Mowla, L., et al. 2021, Nature, in press, arXiv:2109.10384
- Wild et al. (2016) Wild, V., Almaini, O., Dunlop, J., et al. 2016, MNRAS, 463, 832
- Wild et al. (2020) Wild, V., Taj Aldeen, L., Carnall, A., et al. 2020, MNRAS, 494, 529
- Williams et al. (2021) Williams, C. C., Spilker, J. S., Whitaker, K. E., et al. 2021, ApJ, 908, 54
- Wu et al. (2018) Wu, P.-F., van der Wel, A., Gallazzi, A., et al. 2018, ApJ, 855, 85
- Wu et al. (2020) Wu, P.-F., van der Wel, A., Bezanson, R., et al. 2020, ApJ, 888, 77
- Yano et al. (2016) Yano, M., Kriek, M., van der Wel, A., & Whitaker, K. E. 2016, ApJ, 817, L21
- Young et al. (2011) Young, L. M., Bureau, M., Davis, T. A., et al. 2011, MNRAS, 414, 940
- Young et al. (2014) Young, L. M., Scott, N., Serra, P., et al. 2014, MNRAS, 444, 3408
- Zabludoff et al. (1996) Zabludoff, A. I., Zaritsky, D., Lin, H., et al. 1996, ApJ, 466, 104