e-mail: eugenio.carretta@inaf.it, angela.bragaglia@inaf.it
Metallicity of the globular cluster NGC 6388 from high resolution spectra of more than 160 giant stars††thanks: Based on observations collected at ESO telescopes under programmes 073.D-0211, and 073.D-0760, 381.D-0329, 095.D-0834. ††thanks: Full Tables 2 and 3 are only available at the CDS via anonymous ftp to cdsarc.u-strasbg.fr (130.79.128.5) or via http://cdsarc. u-strasbg.fr/viz-bin/cat/J/A+A/??/??
NGC 6388 is one of the most massive Galactic globular clusters (GC) and it is an old, metal-rich, Galactic bulge cluster. By exploiting previous spectroscopic observations we were able to bypass the uncertainties in membership related to the strong field stars contamination. We present the abundance analysis of 12 new giant stars with UVES spectra and 150 giants with GIRAFFE spectra acquired at the ESO-VLT. We derived radial velocities, atmospheric parameters and iron abundances for all stars. When combined to previous data, we obtain a grand total of 185 stars homogeneously analysed in NGC 6388 from high-resolution spectroscopy. The average radial velocity of the 185 stars is 81.2, rms 9.4 km s-1. We obtain an average metallicity [Fe/H] dex, dex (35 stars) and [Fe/H] dex, dex (150 stars) from the UVES and GIRAFFE samples, respectively. Comparing these values to internal errors in abundance, we exclude the presence of a significant intrinsic metallicity spread within the cluster. Since about a third of giants in NGC 6388 is claimed to belong to the “anomalous red giants” in the HST pseudo-colour map defining the so-called type-II GCs, we conclude that either enhanced metallicity is not a necessary requisite to explain this classification (as also suggested by the null iron spread for NGC 362) or NGC 6388 is not a type-II globular cluster.
Key Words.:
Stars: abundances – Stars: atmospheres – Stars: Population II – Galaxy: globular clusters: general – Galaxy: globular clusters: individual (NGC 6388)1 Introduction
The metal-rich and massive bulge globular cluster (GC) NGC 6388 ([Fe/H]=-0.44111We adopt the usual spectroscopic notation, [X]= log(X) log(X)⊙ for any abundance quantity X, and log (X) = log (NX/NH) + 12.0 for absolute number density abundances., Carretta et al. 2007a; =-9.41 mag, Harris 1996, 2010 web edition) certainly deserves attention due to its many peculiar features: a) beside the red horizontal branch (HB) typical of old, metal-rich GCs, NGC 6388 shows an extended blue HB, i.e., we see the second parameter at work within the same cluster. The He enrichment in the second generation stars (as suggested by D’Antona & Caloi 2004; see also Gratton et al. 2010), is likely the explanation, as shown by NGC 6388 participating to the strong correlation between extension of the Na-O anti-correlation and maximum temperature on the HB (Carretta et al. 2007b); b) NGC 6388 is a local counterpart of old, metal-rich populations found in distant elliptical galaxies, and its relevant population of hot HB stars is a likely contributor to the UV-upturn phenomenon (e.g. Yi et al. 1998); c) NGC 6388 is a pivotal cluster to probe the existence of intermediate-mass black holes (IMBH ) whose evidence in this GC is controversial (Lanzoni et al. 2013, hereinafter L13; Lutzgendorf et al. 2015); d) NGC 6388 has been classified, on the basis of HST photometry pseudo-colours (the so-called “chromosome map”, ChM, Milone et al. 2017) as an example of a sub-class dubbed type-II GCs, i.e., GCs showing not only a separation between putative first and second populations, but also an additional “anomalous” population. According to Milone et al. (2017), a type-II GC is characterised by at least one of the following features: presence of separate subgiant and red giant branches (SGB, RGB), variation in C+N+O content (and/or age), enhanced heavy elements abundances (iron and neutron-capture elements).
In our project on NGC 6388 we concentrate on the last point, spectroscopically studying a large sample of cluster stars. We successfully bypassed the problem of the heavy field contamination affecting this GC by exploiting a large mass of spectroscopic data acquired for various purposes and contained in the ESO archive. By forecasting high probability members from their radial velocity, we were able to derive an homogeneous chemical characterisation of a large sample of cluster stars using high resolution spectroscopy of individual targets. We tackle the problem of a possible metallicity dispersion, which seems to be a common requisite for so called type-II GCs. We present here the full set of atmospheric parameters (temperature, gravity, and metallicity) while abundances of light and heavy elements will be presented in a forthcoming paper.
NGC 6388 is generally classified as a bulge GC, not only from its current location in the Galaxy (Galactocentric distance 3.1 kpc, 1.2 kpc below the Galactic plane, Harris 1996, 2010 edition), but also because it follows an highly bound orbit, with apocenter at less than 3.5 kpc (e.g. Massari et al. 2019). It is an old GC (Ortolani et al. 1995) and its high metallicity places the cluster among a near uniform old age group in the age-metallicity relation (AMR). Based on the location on the AMR and in the integral of motion space, Forbes (2020) assigns NGC 6388 to the in situ group of Milky Way GCs, confirming the classification by Massari et al. (2019; but see Myeong et al. 2019 and Minelli et al. 2021 for a different view). All this confirms the interest of the cluster, which merits in-depth study, both of its chemical and astrometric properties.
The existence of a possible metallicity spread in NGC 6388 is controversial. From an apparent, qualitative resemblance of the colour-magnitude diagram (CMD) with that of Cen, Piotto et al. (1997) raised the suspicion of a metallicity spread to explain both the spread in colour of the RGB and the peculiar HB of NGC 6388. However, Raimondo et al. (2002) found that a large spread in metal abundance could not be reconciled with the CMD features. From Washington photometry, Hughes et al. (2007) were able to put an upper limit to the metallicity spread, estimated to be less than 0.2 dex, supporting the abundance analysis of only eight cool giants by Wallerstein et al. (2007), who derived a root mean square (r.m.s.) scatter of 0.1 dex.
We were the first to obtain spectra of many stars in NGC 6388, using FLAMES (Carretta et al. 2007a, 2009b), but, before Gaia and other spectroscopic surveys on this cluster, the pointing of potential targets was forcefully a shot in the dark. In fact, NGC 6388 is strongly contaminated by disk and bulge stars. While use of precise astrometry could have helped the target selection even in this very crowded and difficult field, the spectra were acquired long before Gaia Data Release 2 (which went public on April 2018) and we could measure Fe, O, and Na only in 32 member stars, almost the lowest number in our FLAMES survey of GCs (Carretta et al. 2006, 2009a,b, 2010a). Clearly, this needed to be corroborated by more robust statistics.
We then decided to take advantage of the huge potential of the ESO archive. First results based only on UVES spectra of 24 new member stars were presented in Carretta and Bragaglia (2018). We measured Fe and 15 other elements, finding no spread in metallicity. We also confirmed the normal light elements anti-correlations found in all GCs, with clearly defined groups of primordial, intermediate, and extreme composition stars (P, I, and E as defined in Carretta et al. 2009b). However, if part of the cluster population is distinct by some difference in abundance, the fraction can be even small. For instance, in NGC 362 Carretta et al. (2013) found a secondary giant branch containing only about 6% of RGB stars, more Ba-rich of the bulk of normal RGB giants.
Hence, it is important to analyse samples as large as possible. L13 presented metallicities for about 280 NGC 6388 giants, partly from direct analysis of iron equivalent widths (EWs) and partly from the infrared calcium triplet (CaT) method. They did not found significant metallicity spread, but the detailed abundance analysis was not published. Recently, the discussion on a possible spread in metal abundance for NGC 6388 was resumed following the studies by Mészáros et al. (2020, hereinafter M20) from infrared APOGEE spectra and Husser et al. (2020, from now H20) from low resolution MUSE spectra.
Here we present the whole sample of archive and new data acquired to give a clear-cut answer to the issue of the intrinsic metallicity spread (or the lack of it) in NGC 6388, exploiting a large sample of stars with high resolution spectra analysed in the most homogeneous way. We then provide abundances of iron for individual stars as well as the atmospheric parameters derived on the same scale as in our previous works on more than 25 GCs. These values will be used in a forthcoming paper devoted to fully explore the chemical characterisation of multiple population in NGC 6388, their link with the dynamics, the clues from chemistry on the origin of this GCs, and other issues. The present paper is organised as follows: the data sets are described in Sect. 2 and the analysis in Sect. 3. Results on the metallicity distribution and comparison with literature data are presented in Sect. 4; a discussion of NGC 6388 in the context of type-II GCs is in Sect. 5; finally, a summary is given in Sect. 6.
2 Sample selection, observations and previous data
| Programme | sample | Obs date | Obs time | setups |
|---|---|---|---|---|
| 073.D-0211 (PI Carretta) | C09 | May to July 2004 | 19.6 hr | HR11, HR13, U580 |
| 099.D-0047 (PI Carretta) | us | April to August 2017 | 11.9 hr | HR13, HR21, U580 |
| 073.D-0760 (PI Catelan) | CAT | July 2004 | 3 hr | HR13, U580 |
| 381.D-0329 (PI Lanzoni) | L13 | June to July 2008 | 3 hr | HR21, U580 |
| 095.D-0834 (PI Henault-Brunet) | H-B | June 2015 | 3.8 hr | HR13, U580 |
-
Wavelength coverage -
HR11: 5597-5840; HR13: 6120-6405; HR21: 8484-9001; U580: 4800-6800 Å. The GIRAFFE setups prior and later than February 2015 have slightly different resolutions, see ESO web pages.
The choice of targets in our latest observing programme (099.D-0047) was helped by the existing data sets available in the ESO archive, providing membership. This was our starting point, a key step to avoid wasting telescope time on contaminating field stars whose density is very high toward NGC 6388 and which plagued our original programme (073.D-0211).
To ensure an optimal return from the observing time spent on targets we considered three main data sets present in the ESO archive of advanced data products (see Table 1). All spectra considered were acquired with FLAMES (Pasquini et al. 2000). There are 539 GIRAFFE spectra taken with the high-resolution setup HR21 (R=18000, wavelength coverage Å) for 398 stars from L13 (ESO programme 381.D-0329). From ESO programme 95.D-0834 (P.I. Henault-Brunet, hereinafter H-B sample) we retrieved 1112 GIRAFFE HR13 spectra (R=24000, spectral range Å) for 113 stars. Finally, from the programme 073.D-0760 (P.I. Catelan; hereinafter CAT sample) we found 113 GIRAFFE HR13 spectra.
To select member stars we adopted the range in radial velocity (RV) as given in L13, whose large sample was designed to study the velocity dispersion in NGC 6388. Restricting the RVs to the interval 50-110 km s-1 (as in L13) we obtained 276, 65, and 53 candidate member stars from L13, H-B, and CAT, respectively. This was the original pool from which to cull our final targets.
A posteriori, we cross-matched our total 185 targets with the table of membership probability by Vasiliev & Baumgardt (2021), based on Gaia Early Data Release 3 results (Gaia Collaboration et al. 2021), We found 176 stars in common. For 90% of them the astrometric membership probability is in agreement with the one based on RV: 152 stars out of 176 have probability larger than 0.9, and 7 more have probability between 0.5 and 0.9. Given the different methods and the still not optimal performance of Gaia in dense fields, we deem this a successful comparison.
The criteria for configuring the pointings were driven by the available archive material as well as by our main purposes: to derive a clearcut answer on the intrinsic metallicity distribution in NGC 6388 and to obtain a detailed chemical characterisation of the multiple stellar populations hosted in this GC. Our observing strategy was then set as follow. For the stars observed only with HR21 we can derive Al abundances, so we need to complement them with HR13 spectra to derive also O, Na, Mg, beside metallicity and atmospheric parameters in a homogeneous way. For stars with HR13 spectra only, we want to add HR21 spectra to derive also Al abundances to obtain the complete set of proton-capture elements involved in (anti-)correlations defining multiple stellar populations in GCs.
Taking the sample by L13 as main source of targets, we counter-identified the 276 member stars with HR21 spectra with the the photometry obtained with the Wide Field Imager (WFI) at the ESO 2.2m telescope, used for our previous analysis and described in Carretta et al. (2007a). We selected only stars with to avoid excessively long exposure times. To these we added stars from the H-B sample with low S/N in their HR13 spectra. Ten one-hour exposures were obtained in Service Mode by ESO personnel in 2017 (see Table 1).
As a complementary data set we considered stars that had HR13 observations but lacked HR21 spectra to define a second configuration for the observations with the HR21 setup. Two exposures (3160 sec each) were obtained on 24 and 28 July 2017.
Finally, FLAMES/UVES fibres were put on the brightest giants to obtain the full pattern of the chemical composition, from the lightest to the heaviest (neutron-capture) species (using the 580 setup). During the previously described exposures we then observed 12 member stars at R and with wavelength coverage from about 4800 to 6800 Å.
The observations with the setup HR13 were combined, if feasible, with archival data or spectra for the limited sample of stars used in Carretta et al. (2009b). From the latter, we only considered the HR13 setup, to achieve the maximum possible degree of homogeneity. Most of the the Fe i and Fe ii lines to derive the metal abundance fall in the spectral range of HR13 spectra, as well as transitions of the O, Mg, Si, Ca, and Sc species. Neglecting the HR11 setup, where the Na doublet at 5682-88 Å lies, has no consequences, as the weaker lines of Na at 6154-60 Å are strong enough to secure precise abundances of this element at the high metallicity of NGC 6388.
| star | sample | S/N | RA | DEC | V(wfi) | B(wfi) | K(2ma) | wfi | RV |
|---|---|---|---|---|---|---|---|---|---|
| n63a | UVES | 30 | 264.080826 | -44.733165 | 14.968 | 16.511 | 10.078 | 1 | 75.54 |
| n63b | UVES | 30 | 264.089261 | -44.728379 | 15.18 | 9.733 | 0 | 62.66 | |
| n63c | UVES | 40 | 264.096031 | -44.745935 | 14.99 | 16.995 | 9.618 | 1 | 85.77 |
| n63d | UVES | 50 | 264.073095 | -44.744597 | 14.804 | 16.616 | 9.694 | 1 | 88.10 |
| n63e | UVES | 50 | 264.094481 | -44.75657 | 15.188 | 17.097 | 10.394 | 1 | 105.47 |
| n63f | UVES | 60 | 264.045909 | -44.750423 | 15.14 | 17.009 | 10.381 | 1 | 81.56 |
| n63g | UVES | 40 | 264.143672 | -44.71806 | 15.252 | 17.384 | 9.57 | 1 | 72.48 |
| n63h | UVES | 50 | 264.129650 | -44.72916 | 15.071 | 17.04 | 9.954 | 1 | 79.72 |
| n63i | UVES | 65 | 264.069704 | -44.706032 | 15.161 | 17.095 | 10.218 | 1 | 71.44 |
| n63l | UVES | 45 | 264.047492 | -44.766651 | 15.233 | 17.033 | 10.707 | 1 | 76.80 |
| n63m | UVES | 55 | 264.215366 | -44.728741 | 15.18 | 10.115 | 0 | 80.39 | |
| n63n | UVES | 30 | 264.033217 | -44.736818 | 14.757 | 16.678 | 9.731 | 1 | 83.65 |
| l63p001 | H-B | 60 | 263.972502 | -44.765736 | 16.832 | 18.329 | 13.366 | 1 | 89.83 |
| l63p002 | H-B | 49 | 263.863453 | -44.752747 | 17.064 | 18.469 | 13.745 | 1 | 96.12 |
| l63p003 | C09 | 90 | 263.952259 | -44.750931 | 17.701 | 19.061 | 14.457 | 1 | 87.29 |
| l63p004 | H-B | 58 | 263.940325 | -44.717125 | 16.701 | 18.139 | 13.21 | 1 | 83.73 |
| l63p006 | us | 20 | 263.962607 | -44.686058 | 17.717 | 19.106 | 14.212 | 1 | 74.61 |
| l63p007 | H-B | 134 | 263.958385 | -44.677128 | 15.279 | 17.180 | 10.68 | 1 | 92.17 |
| l63p008 | H-B | 52 | 263.869447 | -44.646568 | 16.701 | 18.291 | 12.676 | 1 | 68.01 |
| l63p010 | us | 45 | 264.168471 | -44.787724 | 17.62 | 18.981 | 1 | 79.07 | |
| l63p011 | C09 | 120 | 264.016210 | -44.786659 | 16.574 | 18.029 | 12.934 | 1 | 79.13 |
| l63p012 | H-B | 70 | 264.024788 | -44.783100 | 16.48 | 17.955 | 12.756 | 1 | 76.54 |
| l63p013 | H-B | 53 | 264.088182 | -44.782795 | 17.053 | 18.429 | 13.622 | 1 | 67.41 |
| l63p014 | C09 | 120 | 264.090260 | -44.774242 | 17.556 | 18.876 | 14.408 | 1 | 74.66 |
| l63p015 | CAT+H-B | 112 | 264.124013 | -44.766060 | 15.985 | 17.613 | 11.931 | 1 | 82.63 |
| l63p017 | H-B | 55 | 264.163561 | -44.733860 | 16.944 | 18.423 | 13.195 | 1 | 83.42 |
| l63p018 | C09 | 130 | 264.163546 | -44.733825 | 16.582 | 18.143 | 1 | 88.95 |
-
Note 1:
star n63n is star A04 in Carretta and Bragaglia (2018)
-
Note 2:
sample: us=this work, new observations, H-B=Henault-Brunet, C09=Carretta et al. (2009b) CAT=Catelan, L13=Lanzoni et al. (2013)
-
Note 3:
wfi=1 (0) if the star is present (absent) in the WFI catalogue (see text).
In Table 2 we list the relevant information to identify all stars in our sample. Since the naming convention is different in each sub-sample (L13, CAT, H-B) we used our unique code (column 1) to identify each star. The coordinates RA and DEC easily allow the cross-identification among all the sub-samples. The source for the spectra used for each stars and the estimated S/N ratio are listed in columns 2 and 3. We also provide in Table 2 optical magnitudes obtained with the WFI (see Carretta et al. 2007a). Near infrared magnitudes are from 2MASS (Skrutskie et al. 2006). A magnitude derived from a versus calibration based on all stars with both magnitudes available was assigned to stars not present in the WFI photometry (flag=0 in the last column of Table 2).
The total sample of the present work includes 150 stars with GIRAFFE HR13 spectra and 12 with UVES spectra. To it, we can also add the 24 stars with UVES spectra homogeneously analysed in Carretta and Bragaglia (2018). Our final sample in NGC 6388 is then composed by 185 giants (star n63n in the present study is also star A04 in Carretta and Bragaglia 2018).
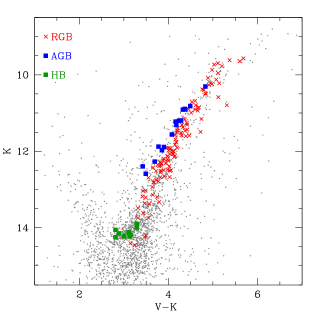
Differently from other GCs studied in our FLAMES survey, where we selected stars lying near the RGB ridge line, in NGC 6388 we followed selection criteria based on RV, so that the final sample contains small sub-samples of stars in other evolutionary stages. From the position in the CMDs we identified 17 stars on the asymptotic giant branch (AGB) and 10 stars on the red horizontal branch (RHB). Together with the bulk of RGB stars in our sample, they are plotted on the colour magnitude diagram in Fig. 1.
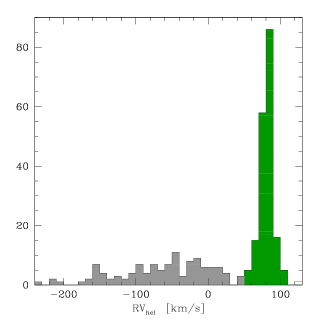
The histogram of the RV (measured using the iraf task rvidlines) of these 185 stars is shown in Fig. 2, together with the distribution of non members from the archive data and our original observations. The average radial velocity of the 185 stars considered cluster members is 81.2, rms 9.4 km s-1. Finally, we cross-matched our targets with the table of individual stellar radial velocities of stars in the fields of globular clusters available at Holger Baumgardt’s web page222https://people.smp.uq.edu.au/HolgerBaumgardt/globular/, finding 159 stars in common. A plot of the differences in RV is shown in Fig. 3, where two stars with differences larger than 10 km s-1 are omitted. Without them, the average offset is -1.72 (rms 0.98) km s-1. Star l63p154, in particular, shows a difference km s-1 and a possible explanation is that the star is a binary. Our observations, taken in a short time interval, do not display significant changes around +85 km s-1; however, the value listed at Baumgardt’s web page is 17.46 km s-1 while L13 have 2.8 km s-1. A more detailed comparison is outside the main goal of our paper and we do not proceed further.

3 Abundance analysis and error budget
The derivation of metallicity and of atmospheric parameters for all stars in our sample are based on s of neutral and singly ionised iron lines. We measured s with the package ROSA (Gratton 1988) as described in Bragaglia et al. (2001). The line list is the same used in all the papers of our FLAMES survey to study the Na-O anti-correlation in GCs (presented in Carretta et al. 2006, 2010a). The solar reference abundances are from Gratton et al. (2003). We recall here that the solar value for iron (the only element discussed in the present paper) is log (Fe)=7.54 for Fe i and 7.49 for Fe ii. For comparison, other reference solar values for iron commonly used are, for instance, 7.50 (Grevesse & Sauval 1998), 7.45 (Grevesse et al. 2007), and 7.50 (Asplund et al. 2009).
The s measured on the GIRAFFE HR13 spectra were converted to the scale of s measured on high resolution UVES spectra using lines measured on stars observed with both spectrographs (four, five, and four stars in our new observations and from CAT and H-B samples, respectively). UVES spectra are taken from Carretta et al. (2007a), Carretta and Bragaglia (2018) and from the present work.
The procedure to derive the atmospheric parameters is the same adopted for the other works in our FLAMES survey, so that the derived abundances are on a strictly homogeneous scale. Effective temperatures (Teff) were obtained from a calibration between magnitudes and values of Teff from de-reddened colours. The latter temperatures were derived from the Alonso et al. (1999, 2001) relation. For NGC 6388 we used magnitudes. that are less affected by reddening than colours. The rationale for this approach, aimed at reducing the star-to-star errors, is discussed in detail in Gratton et al. (2007) for NGC 6441, another bulge cluster heavily affected by extinction.
Surface gravities were obtained from the above temperatures, adopting distance modulus and reddening from Harris (1996, 2010 on line edition), bolometric corrections from Alonso et al. (1999), masses of 0.90 and . The relations , , and are taken from Cardelli et al. (1989).
We minimised the slope of the relation between abundances of Fe i and expected line strength (see Magain 1984) to derive the values of the microturbulent velocity . From the Kurucz (1993) grid we selected the model whose abundance was equal to the average abundances from Fe i lines. Adopted atmospheric parameters and derived abundances of Fe are listed in Table 3 (only an excerpt is shown, the entire Table will be available on line at CDS). The listed rms scatter is the line-to-line scatter. On average, we measured 100 Fe i and 13 Fe ii lines from the UVES spectra and 20 Fe i and 3 Fe ii from the GIRAFFE HR13 spectra.
| Star | [A/H] | nr | [Fe/H]i | nr | [Fe/Hii | |||||
|---|---|---|---|---|---|---|---|---|---|---|
| (K) | (dex) | (dex) | (km s-1) | (dex) | (dex) | |||||
| n63a | 3772 | 0.80 | 0.48 | 1.30 | 125 | 0.476 | 0.214 | 11 | 0.492 | 0.194 |
| n63b | 3727 | 0.61 | 0.51 | 0.27 | 73 | 0.509 | 0.314 | 5 | 0.483 | 0.199 |
| n63c | 3714 | 0.58 | 0.54 | 1.35 | 77 | 0.552 | 0.220 | 12 | 0.569 | 0.262 |
| n63d | 3722 | 0.63 | 0.57 | 1.17 | 83 | 0.573 | 0.177 | 18 | 0.543 | 0.239 |
| n63e | 3820 | 0.93 | 0.59 | 1.78 | 122 | 0.494 | 0.151 | 18 | 0.454 | 0.200 |
| n63f | 3818 | 0.93 | 0.54 | 1.54 | 101 | 0.543 | 0.130 | 14 | 0.484 | 0.152 |
| n63g | 3708 | 0.52 | 0.44 | 0.76 | 73 | 0.436 | 0.216 | 10 | 0.487 | 0.290 |
| n63h | 3755 | 0.73 | 0.54 | 1.61 | 100 | 0.536 | 0.184 | 14 | 0.520 | 0.234 |
| n63i | 3793 | 0.85 | 0.53 | 1.63 | 113 | 0.528 | 0.142 | 16 | 0.498 | 0.167 |
| n63l | 3874 | 1.07 | 0.49 | 1.66 | 126 | 0.489 | 0.166 | 15 | 0.447 | 0.145 |
| n63m | 3777 | 0.80 | 0.47 | 1.46 | 106 | 0.468 | 0.186 | 13 | 0.481 | 0.206 |
| n63n | 3727 | 0.65 | 0.50 | 1.69 | 100 | 0.499 | 0.173 | 10 | 0.432 | 0.137 |
| l63p001 | 4576 | 2.23 | 0.49 | 1.63 | 21 | 0.488 | 0.106 | 3 | 0.524 | 0.077 |
| l63p002 | 4712 | 2.40 | 0.51 | 1.53 | 24 | 0.513 | 0.121 | 3 | 0.391 | 0.201 |
| l63p003 | 4991 | 2.69 | 0.41 | 1.82 | 16 | 0.413 | 0.135 | 3 | 0.474 | 0.116 |
| l63p004 | 4522 | 2.16 | 0.50 | 1.31 | 15 | 0.504 | 0.094 | 3 | 0.435 | 0.104 |
| l63p006 | 4892 | 2.56 | 0.45 | 2.23 | 19 | 0.449 | 0.105 | 4 | 0.468 | 0.119 |
We estimated star-to-star errors due to uncertainties in the adopted atmospheric parameters and in measurement using our usual procedure, amply described in Carretta et al. (2009a) for UVES and Carretta et al. (2009b) for GIRAFFE. The results for the present work are tabulated in Table 4 and Table 5 for errors in iron abundances derived from UVES and GIRAFFE spectra, respectively.
In the main body of these tables we list the sensitivities of abundance ratios [Fe/H] to changes in the atmospheric parameters, obtained by changing each of the parameters at the time for all stars, then taking the average. The amount of the variation is listed in the first row of each table. In the second and third row, the star-to-star (internal) errors and the systematic errors in each parameter are listed. In the second column we report the average number of lines used. Finally, in the last two columns, we show the total internal and systematic errors, derived by summing in quadrature the contributions of individual error sources.
| Element | Average | Teff | [A/H] | EWs | Total | Total | ||
| n. lines | (K) | (dex) | (dex) | kms-1 | (dex) | Internal | Systematic | |
| Variation | 50 | 0.20 | 0.10 | 0.10 | ||||
| Internal | 6 | 0.04 | 0.04 | 0.12 | 0.02 | |||
| Systematic | 17 | 0.06 | 0.02 | 0.04 | ||||
| Fe/Hi | 100 | 0.027 | +0.041 | +0.023 | 0.044 | 0.016 | 0.058 | 0.024 |
| Fe/Hii | 13 | 0.119 | +0.122 | +0.040 | 0.030 | 0.045 | 0.072 | 0.055 |
| Element | Average | Teff | [A/H] | EWs | Total | Total | ||
| n. lines | (K) | (dex) | (dex) | kms-1 | (dex) | Internal | Systematic | |
| Variation | 50 | 0.20 | 0.10 | 0.10 | ||||
| Internal | 6 | 0.04 | 0.04 | 0.22 | 0.03 | |||
| Systematic | 57 | 0.06 | 0.02 | 0.01 | ||||
| Fe/Hi | 20 | +0.014 | +0.032 | +0.022 | 0.060 | 0.027 | 0.067 | 0.020 |
| Fe/Hii | 3 | 0.079 | +0.118 | +0.040 | 0.018 | 0.070 | 0.079 | 0.097 |
4 Results and comparison with other studies
The first result of the present work is that the metallicity of NGC 6388 is [Fe/H] dex ( dex, 12 stars) on our metallicity scale defined by the high resolution UVES spectra (Carretta et al. 2009c). This result is strongly corroborated by the metal abundance derived from the very large sample of stars with GIRAFFE HR13 spectra: [Fe/H] dex ( dex, 150 stars), where the first and second term refer to statistical and systematic errors, respectively. We plot in Fig. 4 iron abundances in NGC 6388 as a function of the effective temperatures for the present sample, to which we added the stars analysed in Carretta and Bragaglia (2018).
It should be noted that the observed star-to-star scatter in iron abundance is actually smaller than the estimate of the random errors (see previous Section). Hence the present data do not support the existence of a metal abundance spread in NGC 6388. This is the first conclusion from our homogeneous and ample data set and will be further discussed below.
Abundances from Fe ii are in good agreement with results from neutral transitions. We found [Fe/H] dex, dex from the 12 stars with UVES spectra, and [Fe/H] dex, dex from 149 stars with GIRAFFE spectra. Again, the estimates of the internal errors are consistent with no significant intrinsic spread in metallicity.
Finally, we can combine the UVES sample of the present work to the sample in Carretta and Bragaglia (2018), analysed exactly with the same procedure. We obtain an average metallicity of [Fe/H] dex, for the total sample of 35 stars with UVES spectra, in excellent agreement with the results from GIRAFFE spectra.
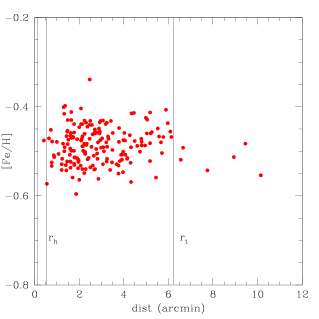
In Fig. 5 we show the distribution of [Fe/H] values for our total sample of 35+150 stars in NGC 6388 as a function of the radial distance from the cluster centre. The bulk of our sample is enclosed between the half-mass radius ( arcmin, Harris 1996) and the tidal radius ( arcmin). Only six stars, members according to their RV, are found beyond this limit. However, it is not automatic to call them extra-tidal, as the value for is not univocal and may be larger. In fact, Dalessandro et al. (2008) give 7.57 arcmin (29 pc) and Baumgardt et al. (2018) have a value about 3 times larger (based on a tidal radius of 85.6 pc; the very large difference comes from the different methods in estimating the cluster profile, since they also use dynamical information in their modelling). We identified five of the six stars with the Vasiliev & Baumgardt (2021) catalog of membership in Galactic GCs based on Gaia EDR3 and only one, the closest to the centre, is considered member. Currently, the Gaia astrometry has not yet reached its full potentiality, especially in crowded fields as those in GCs. On the other hand, RVs and metallicities for these five stars are indistinguishable from the bulk cluster values, hence we consider these stars as cluster members, with the cautionary flag that they may deserve further investigation. However, their membership issue does not influence the main result of our work.
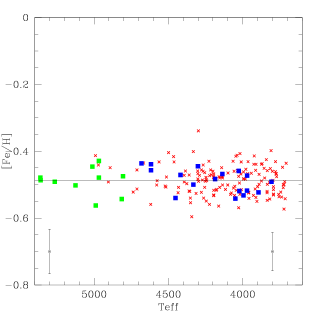
We show in Fig. 6 (upper panel) the narrow [Fe/H] distribution in our sample, which displays no trend with Teff. The lower panel shows the histograms of the [Fe/H] values in our work and L13, M20, and H20, for comparison. We also indicate the number of stars considered in the average and the rms scatter obtained in each analysis. The information is summarised in Table 6 where we report also the type of spectra used in each analysis and their spectral resolution. Further details are discussed in the following sub-sections.
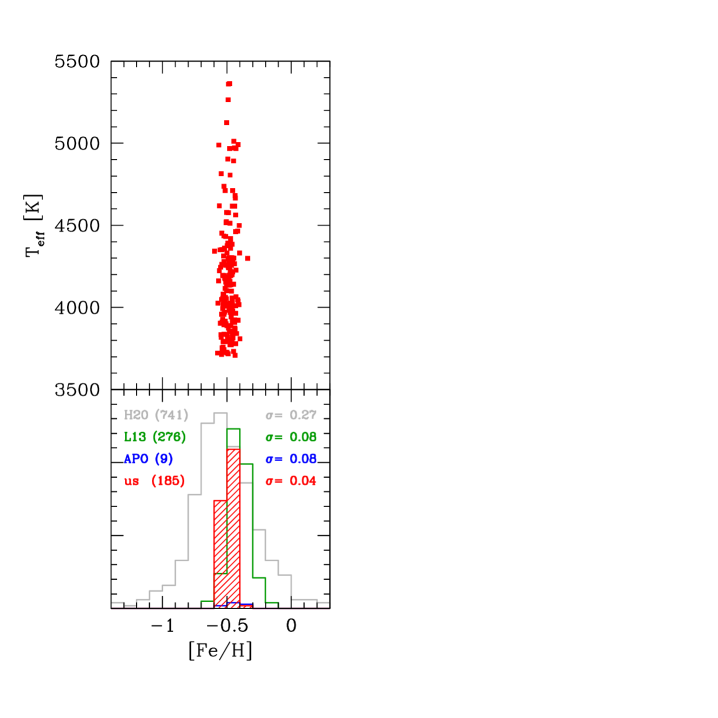
| Sample | [Fe/H] | rms | Nr | Resol | Note |
|---|---|---|---|---|---|
| us | 0.488 | 0.040 | 150 | 26400 | GIRAFFE HR13 |
| 0.480 | 0.045 | 35 | 47000 | UVES | |
| L13 | 0.401 | 0.078 | 276 | 18000 | GIRAFFE HR13,HR21 |
| M20 | 0.407 | 0.164 | 24 | 22500 | APOGEE,all stars |
| 0.436 | 0.077 | 9 | APOGEE, SNR70 | ||
| H20 | 0.43 | 0.48 | 4098 | 2800 | MUSE; their tab.7 |
| 0.52 | 0.27 | 741 | HB method, see text |
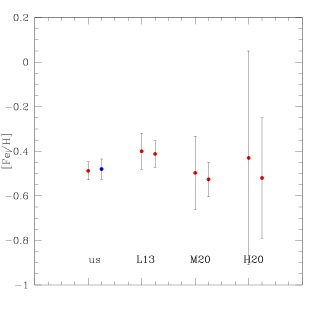
Mean [Fe/H] values and associated rms scatters from the present work and from literature studies are plotted for NGC 6388 in Fig. 7. For the present work we distinguish the metallicity obtained from UVES (right blue point) and GIRAFFE (left red point) spectra. For the analysis by M20, the [Fe/H] value and the scatter on the right are from the selected sample of stars with S/N (see below). For H20, the rightward value is the one derived from their HB method (see below).
4.1 Comparison with L13
Lanzoni et al. (2013) were mostly concerned with the kinematics of the cluster, for which they acquired SINFONI low resolution, near-IR spectra in the innermost part and FLAMES spectra (GIRAFFE setup HR21, plus UVES 580) in the external regions, adding also FLAMES archive data. However, to better cull out non-member stars, they also derived metallicities for a limited number of giants in their sample. The classical abundance analysis with EWs was used for spectra available in the ESO archive at the epoch (UVES and GIRAFFE HR11, HR13), whereas for the larger number of stars with HR21 spectra, metal abundances were obtained from a calibration of the CaT method. The average value of [Fe/H] from 276 stars is dex, with dex. Unfortunately, not many details nor an error budget were provided concerning the abundance analysis, so that a formal conclusion about the metallicity spread is not possible. However, we note that L13 did not claim that an intrinsic spread was present in NGC 6388.
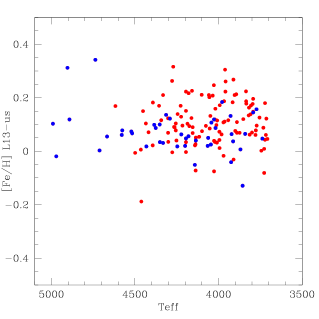
In Fig. 8 we plot the difference in [Fe/H] (in the sense L13-us) as a function of effective temperature for 151 stars present in both studies. The mean difference is 0.098 dex, with an rms scatter 0.086 dex. Although scarcely significant, this offset can be ascribed to a number of reasons, including a difference in the solar reference abundance, not provided in L13.
However, we were able to identify 43 stars that were analysed by L13 using methods similar to those adopted by us, with temperature and gravity from photometry and EWs measured on high or intermediate resolution UVES and GIRAFFE HR11, HR13 spectra. Those are stars whose spectra were in the ESO archive in 2013, essentially those analysed in Carretta et al. (2007a, 2009b) plus a few stars from the program by Catelan, recently studied by Carretta and Bragaglia (2018). We indicate them with blue symbols in Fig. 8 and we can immediately see that the set of these stars defines a sequence with a lower scatter with respect to the whole sample, apart from three outliers. We found an average difference in [Fe/H] = 0.064 dex (L13-us), with dex from 40 stars, which have a mean metallicity of -0.412 dex in L13, with dex. This scatter is in good agreement with our findings, it leaves no space for an intrinsic spread in metal abundance, and it suggests that large part of the difference and scatter shown in Fig. 8 has to be ascribed to stars whose metallicity was obtained from HR21 GIRAFFE spectra using the CaT method.
4.2 Comparison with M20
Mészáros et al. (2020) published results based on APOGEE DR16 for 31 GCs; for NGC 6388 there are 24 stars observed, but only 9 stars (of which 7 in common with us) pass their suggested quality cuts, i.e., S/N and T K. Average values for them are given in Table 6. In particular, for the high-quality sample, the average value is [Fe/H] dex with a spread of 0.077 dex, to be compared to an internal error of 0.152 dex (M20). Again, no indication of iron spread is present. We recall that M20 detected a significant iron spread only for Cen; they did not find metallicity variations for any of the iron-complex GCs (type-II GCs) in their sample, i.e. NGC 362, NGC 7089, NGC 6388 and, notably, NGC 1851 and M 22 (NGC 6656).
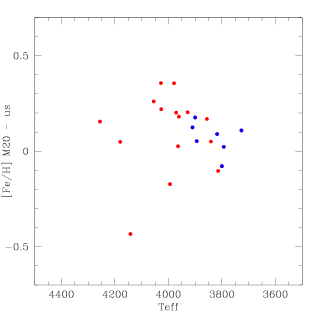
For NGC 6388 we found 22 stars in common between the present work and M20. The difference in [Fe/H] (in the sense M20 - us) is plotted in Fig. 9 as a function of the effective temperature. The average difference is 0.092 dex ( dex, 22 stars). On the other hand, if we consider only stars that pass the quality criteria recommended by M20 (indicated by blue symbols in Fig. 9), the difference is almost unaltered (0.072 dex), but the dispersion is more than halved ( dex, 7 stars). This comparison suggests that using lower S/N spectra may result into an artificially larger spread, despite using the same method of abundance analysis. The average metallicity derived from the seven stars in common, with S/N spectra in APOGEE, is [Fe/H] dex. Taking into account the -0.09 dex offset due to different solar reference abundances, the value corresponds to [Fe/H] dex on our abundance scale, in excellent agreement with the results obtained in the present work. The points for M20 in Fig. 7 were also shifted to our scale of solar abundance by using the above offset.
4.3 Comparison with H20
The case of H20 is intricate, as they found a complex structure in the metallicity distribution and a large dispersion (even larger than for Cen, before taking into account the errors, see below). They employed MUSE on RGB stars in 25 MW GCs, among which NGC 6388, to derive their metallicity. The low-resolution MUSE spectra were acquired in the central parts, i.e. the same covered by the HST UV Survey (see below), and were used to derive metallicity through the CaT method. This technique requires a calculation of , the so-called reduced EWs, which are then used to calibrate a relation with metallicity, using literature reference values. Husser et al. (2020) used four different methods to calculate , which they indicated as ’HB’ (using only stars brighter than V(HB)+0.2 and a linear relation with V-V(HB); this is generally used in literature), ’all’ (using all RGB stars and a quadratic relation with V-V(HB)), ’M’ (same as ’all’, but using the absolute magnitude in the F606W band), and ’lum’ (same as previous ones, but using the luminosity), see H20 for more details.
For NGC 6388, H20 cite an average value [Fe/H] dex for the whole cluster (4098 stars), and we calculated ) for the 741 stars for which is calculated with the HB method. As they were studying the GCs in the multiple populations scenario, they also calculated the metallicity separately for what they indicate as population P1, P2 (P and I+E in the Carretta et al. 2009b division) and P3, which is the “anomalous” component, on the red RGB (see Milone et al. 2017 and below). The values for mean [Fe/H] and are -0.45, 0.45 dex for 579 P1 stars, -0.44, 0.42 dex for 1203 P2 stars, and -0.25, 0.39 dex for 411 P3 stars (note that these numbers sum up to 2193, i.e., not all the sample was assigned to a given component). We caution, however, that the fraction of the P3 component in H20 (411/2193=0.187) is quite different from the estimate by Milone et al. (2017) for NGC 6388 (0.299). Husser et al. also claim to find indications of metallicity variations among P1 stars for NGC 6388 and the other type-II GCs observed, but they do not consider it definitely proved.
The large dispersion and the difference in metallicity between P1,P2 and P3 are taken with caution by H20, who comment that the errors are large for NGC 6388 and its so-called twin NGC 6441, due to a combination of crowding affecting the photometry, differential reddening, and high metallicity. For comparison, Cen, with a well documented wide metallicity dispersion and a much clearer structure and separation both in the CMDs and in the chromosome map (see next section), has a similar dispersion, but with a smaller associated error. From Fig. 17 in H20, the uncertainty in [Fe/H] has a peak value of more than 0.15 dex and a very broad, asymmetric distribution for NGC 6388, compared to about 0.10 dex or less and a more peaked distribution for most of the other GCs. In fact, once taken into account the uncertainties, the intrinsic metallicity distribution for Cen has a of about 0.4 dex (from their Fig. 18), while for NGC 6388 we read a value slightly more than 0.2 dex. At variance with the other studies, a real spread seems present, according to H20. However, we note that, due to the problematic photometry of this heavily contaminated bulge cluster, affecting spectra extraction from MUSE data cubes, Pfeffer et al. (2021) concluded that NGC 6388 has no spread in iron.
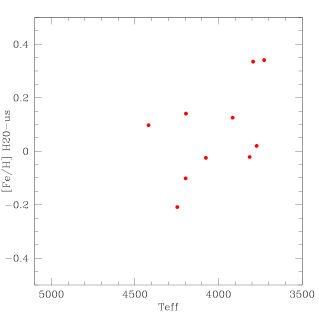
Since the MUSE observations cover only the very central part of the cluster, the intersection with our FLAMES data is small. We found only 11 stars in common (10, considering the HB method) and we compared the metallicity results in Fig. 10. Since H20 only published EWs and corresponding metallicitis, we used our values of Teff in the figure, as in previous comparisons with L13 and M20. The mean difference in metallicity between our values and H20 is 0.070 dex (in the sense H20 minus us), with , but a clear trends is visible in the figure. At higher temperatures, the metallicities from H20 are lower than ours, whereas at lower temperatures they find higher metal abundances with respect to our values. Given the small number of stars in common, we cannot pursue the comparison further and draw firm conclusions.
Finally, if we compare Fig. 20 in H20 with Fig. 27 in Marino et al. (2019), we note a possible discrepancy in the arrow describing the effect of a change in metallicity of 0.15 dex in the position in the ChM. In both cases an increase in metallicity produces an increase in the pseudocolour, but while in the first case the arrow is directed upward, in the second it is almost orthogonal and directed downward.
4.4 No metallicity spread in NGC 6388
The comparisons in the above sections point out the risks related to using low resolution or low S/N spectra. In particular when dealing with metal-rich stars, there is the danger to introduce a spuriously enhanced spread which is not an intrinsic feature, but in part an artefact of the analysis.
On the other hand, the dispersion associated to the [Fe/H] values from our present analysis, based on high resolution spectra, excludes the existence of a noticeable intrinsic metallicity spread in the large sample of analysed stars in NGC 6388, when coupled to the estimate of internal errors. Two further tests were performed to confirm this result.
First, we used the algorithm illustrated by Mucciarelli et al. (2012, kindly made available to us) to estimate the mean and intrinsic spread of an elemental ratio ([Fe/H] in our case) by maximising the likelihood function defined as in their Section 2.1. For NGC 6388 we obtained an average value of -0.484 dex and a zero intrinsic dispersion for the metallicity of the 185 stars in our sample ().
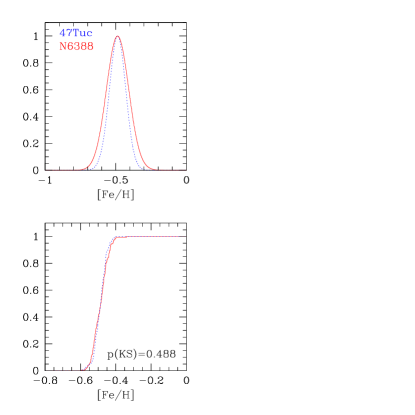
Furthermore, we compare the generalised histograms for NGC 6388 from the present work and for 47 Tuc from Carretta et al. (2009a,b) in Fig. 11 (upper panel). The GC 47 Tuc was selected because it is analysed exactly in the same way as NGC 6388, its sample is almost as large (147 stars) as the present sample, and it is the most metal-rich GC in our homogeneous FLAMES survey, beside NGC 6388. Last but not least, 47 Tuc is one of the best representative of the class of monometallic GCs, never suspected to host a metallicity dispersion (see Carretta et al. 2004, Carretta et al. 2009a,b, Cordero et al. 2014). The sigma of the gaussian centered at each data point used to generalise the histogram was chosen equal to the error on each point, namely 0.067 dex for NGC 6388 (from Table 5) and 0.047 dex for 47 Tuc (from Carretta et al. 2009b). These values correspond to the internal errors derived for stars with GIRAFFE spectra, representing the vast majority in the samples.
After applying an offset of 0.255 dex to account for the difference in the mean metallicity of the two GCs, the histograms are superimposed in the upper panel of Fig. 11. The metallicity distribution for each cluster is well described by a single symmetric Gaussian curve. This comparison reveals only a negligible difference in the spread, that can be fully ascribed to the different internal errors associated to the analyses. A two-tail Kolmogorov-Smirnov test (lower panel of Fig. 11) clearly indicates that the null hypothesis (the two distribution are extracted from the same parent population) cannot be rejected.
Our analysis, the above tests, and the comparison with other literature data (see above) allow to conclude that in NGC 6388 there is no evidence for an intrinsic metallicity dispersion. This is an important information for a type-II GC.
5 Discussion
The so called “anomalous” RGB stars should be subjected to further investigation to clarify their nature and role in defining a separate class of GCs. In the next Sections we will associate the metallicities we obtain from our large sample to the UV HST photometry and we will discuss some properties of the so called type-II GCs.
5.1 Chromosome map and metallicity
Neither Piotto et al. (2015) nor Milone et al. (2017) published a classification of individual stars in their full GC sample into FG, SG, and red-RGB stars. These data only exist for six GCs out of 58 objects, and unfortunately NGC 6388 (or any other type-II GC) is not among them.
We then downloaded the available HUGS catalogue (Nardiello et al. 2018a)333https://archive.stsci.edu/prepds/hugs/, who published the photometry uncorrected for reddening and without distinction between stars of different populations. Starting from these data we followed the necessary steps to produce the pseudo-colours maps used in that survey to single out different populations in GCs. However, we did not apply corrections for differential reddening, which is outside the goal of the present study and which is not indispensable to establish the lack of any metallicity variation among stellar populations in NGC 6388.
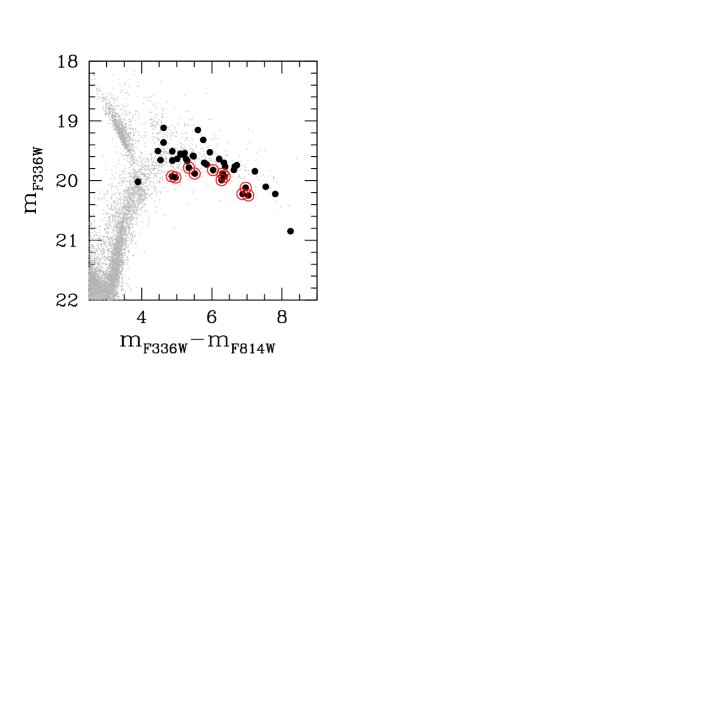
From the CMD shown in Fig. 12 we identified stars in common between our spectroscopic sample and the HST photometry by Nardiello et al (2018a). A few stars along the redder part of the RGB have been highlighted (red circles) in the plot to reproduce Fig. 16 in Milone et al. (2017). These red-RGB stars also show up in a given region of the ChM only in type-II GCs.
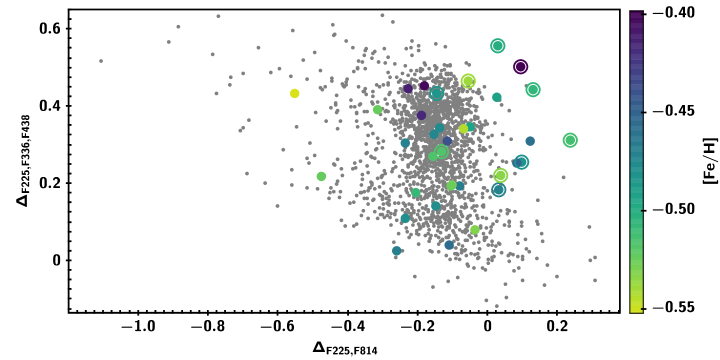
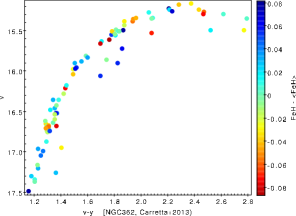
Following the discussion in Nardiello et al. (2018a), we kept only stars with good quality photometry. In particular we excluded stars with the sharpness parameters outside the range in any of the filters; no cut on error was applied, as all the stars involved in the ChM are giants and the corresponding errors are very small and uniform. As in Milone et al. (2017) we used stars in the magnitude range , computed the colours and pseudo-colours and , and defined lines describing the limits of the RGB stars in the corresponding plots. Finally, we computed the values for and from eqs. 1, 2 in Milone et al. and using the RGB widths in their Table 2). The resulting two-pseudocolours diagram is shown in Fig. 13, which reproduces sufficiently well the plot in Fig. 3 of Milone et al. (2017) and the location of the different populations: FG stars, SG stars and the region where the “anomalous” red-RGB stars are arranged in this diagram. Further refinement is outside the main goal of the paper and we await the publication of the ChM by the group who has produced them homogeneously for further discussion.
In Fig. 13 we have identified the few stars selected on the redder RGB with concentric open circles. Milone et al. (2017) claim that all evidence supports that stars in the red-RGB are enhanced in C+N+O, in s-process elements, and in iron. This is for instance true for NGC 1851, where we detected both a small iron spread and an enhancement in s-process elements on the red-RGB we defined using Strömgren filters (Carretta et al. 2010, 2011; see also below). However, we do not find a significant spread in Fe in NGC 6388, and in particular we do not find a metallicity enhancement for the red-RGB stars (see Fig. 13). We stress that this conclusion is not strictly related to our method of reproducing the ChM, which shows resemblance both to the one in M17 and to that recomputed by H20. Milone et al. (2017) list a fraction of type-II stars with respect to the total number of analysed stars in NGC 6388, while H20 have a lower value. A third (or about one fifth, as in H20) of stars with enhanced metal abundance would have been easily discerned in the distribution of [Fe/H] values (considering that we observed stars also on the red-RGB), resulting in a clearly detectable iron spread. From our data, this is not the case.
5.2 What really is a type-II cluster?
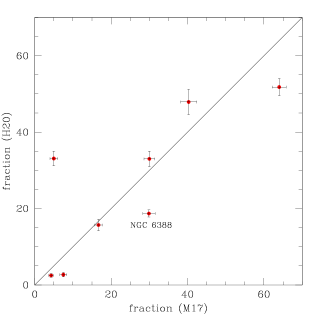
With the present large sample of stars analysed spectroscopically, we can add NGC 6388 as a good test to compare spectroscopy and UV photometry concerning the classification of GCs. When discussing the type-II GCs as a separate class, one must first note that the fraction of ’peculiar’ stars deduced from the ChM and photometric methods has some degree of subjectivity, as evident from Table 7 and Fig. 14, where we compare the fraction of the so called type-II stars for eight GCs analysed by two groups starting from the same HST photometry. Values of the fractions and associated errors for M17 are taken from their Table 2 (for NGC 1851 we use the fraction corrected for a misprint as in Gratton et al. 2019, their Table 5). To those, we added the corresponding value for NGC 7078 (M 15) from Nardiello et al. (2018b) who considered also this GC as a type-II cluster from the analysis of its pseudo-colour diagrams. For H20, we computed the ratios using the fraction of their P3 stars over the total of P1+P2+P3 populations from their Table 7. For the very complex cluster Cen, we adopted as type-II stars the sum of the populations from P4 to P9, as a visual comparison with M17 showed that the normal stars are only restricted to population P1+P2+P3. The error bars are assumed from the Poisson statistics.
| GC | fraction | fraction |
|---|---|---|
| H20 | M17 | |
| 362 | ||
| 1851 | ||
| 5139 | ||
| 5286 | ||
| 6388 | ||
| 6656 | ||
| 7078 | ||
| 7089 |
-
a
from Gratton et al. (2019)
-
b
from Nardiello et al. (2018b)
Figure 14 shows that the estimates of the fractions are more or less distributed around the equality line, but in a few cases the values can be very different, although the underlying photometric database is the same. The only GC for which there is a formal agreement within one Poisson error bar is NGC 5286. In other cases, such as NGC 362, NGC 1851, and Cen, the discrepancies are not large. On the other hand, NGC 7078 (M 15) and NGC 6388 have the largest differences in the estimated fractions. This indicates that a more objective criterion to separate the so called type-II stars is required.
Milone et al. (2017) state that a type-II GC is identified by (at least) one of the following properties: split SGB even in optical photometric bands, multiple sequences in the ChM, and wide range in heavy elements, including iron and extending to the species produced by process. The sample of so called type-II GCs seems to be, however, a heterogeneous class. This motley group contains the two most massive GCs of our Galaxy, that most probably were the nuclear star clusters of past dwarf galaxies later incorporated in the Milky Way, namely NGC 5139 ( Cen) and NGC 6715 (M 54, see e.g. Bekki and Freeman 2003, Bellazzini et al. 2008, Carretta et al. 2010b; see also Massari et al. 2019 who associate the first to Gaia-Enceladus and confirm the association with Sagittarius of the second, using Gaia data). Both GCs probably experienced multiple bursts of star formation over their entire life (see e.g. Johnson and Pilachowski 2010, Siegel et al. 2007). In both cases, the metal-rich component according to the spectroscopy represents a fraction of the total mass roughly in agreement with the estimated fraction of type-II stars from photometry, with evidence of enhancement also in process elements.
However, to the same group also belong two smaller GCs, less luminous by two orders of magnitude: NGC 1261 and NGC 6934. Small spreads in [Fe/H] (0.1-0.2 dex) were detected for these lower mass GCs attributed to the type-II class, (Muñoz et al. 2021, Marino et al. 2021 for NGC 1261 and Marino et al. 2021 for NGC 6934). These results are based on samples of limited size, much smaller than for the GCs discussed above. Marino et al. (2021) also note that for both clusters no enhancement in process elements is found and suggest this is due to the low mass of these GCs. A comparison of the fractions determined by photometry and spectroscopy would be meaningless, since only 8-14 stars in NGC 1261 and 13 stars in NGC 6934 were observed with high resolution spectroscopy.
Coming to the intermediate-mass GCs, the existence of a secondary, redder RGB sequence in a few GCs (besides Cen) is known since more than one decade (it was discovered in NGC 1851 by Han et al. 2009 for the first time, using the U and I filters). Carretta et al. (2011, 2013) discussed the cases for NGC 1851 and NGC 362 using Strömgren photometry and their own spectroscopic results. In NGC 362 Carretta et al. (2013) discovered that in the Strömgren colour the RGB is clearly split, with a minority of stars () defining a secondary, redder sequence only populated by Ba-rich stars (roughly corresponding in size to the type-II component claimed from UV photometry in M17). The same phenomenon was also traced by Carretta et al. (2011) in NGC 1851, where the redder colour was attributed most likely to large enhancement in N (see also Carretta et al. 2014 and Villanova et al. 2010).
Both GCs are now classified as type-II clusters. However, in NGC 362 no spread in [Fe/H] was detected above the small level (0.041 dex) fully explained by internal uncertainties in the abundance analysis. This is well shown in Fig. 15 where the CMD of NGC 362 in Strömgren photometry is coloured by the difference in iron with respect to the average [Fe/H] value in this GC. However, the trickling of stars in this red sequence does not present any enhanced [Fe/H] distribution with respect to the other giant stars.
In NGC 1851, instead, a small metallicity dispersion was found; however, the best results were obtained from a cluster analysis using a mean algorithm and the run of [Fe/H] as a function of [Ba/H] as representative of the process elements (Carretta et al. 2011). With this technique, two stellar component were unveiled, the most metal-rich being also more rich in Ba and process elements, with Strömgren photometric indices consistent with an overabundance in carbon. The fraction of this component from spectroscopy is roughly compatible with the fraction of type-II stars from the HST photometry, both from M17 and H20.
The largest fraction of type-II stars, excluding Cen and M 54, belongs to NGC 6656 (M 22), which has an iron spread of about 0.14 dex according to Marino et al. (2011), besides all other characteristics of type-II clustes. As a caveat, the metallicity spread has been questioned by Mucciarelli et al. (2015) who attributed the result to the adoption of surface gravities derived from spectroscopy. Those values correspond to unrealistic low stellar masses, whereas using photometric values no evidence of spread was found from singly ionised iron, at variance with Fe i. Mucciarelli et al. concluded that this pattern could be explained by non-LTE effects, namely overionisation, lowering abundances from Fe i while leaving unaltered those from Fe ii. The surface gravity values used in our present analysis for NGC 6388 (the fourth in line for type-II stars fraction, according to M17) were derived from photometry and we did not find evidence of different iron abundances in the large fraction of stars dubbed as type-II, as discussed above.
To conclude, in a fraction of GCs classified as type-II no metallicity spread is detected over large sample of stars. Some GCs show an enhancement in process elements but not in iron (e.g. NGC 362). In other cases, such as NGC 1261 and NGC 6934, the contrary is observed. Finally, for M 15 the large dispersion measured for neutron-capture elements is known to be originated by the process (e.g. Sneden et al. 2000, Sobeck et al. 2011, Worley et al. 2013, Kirby et al. 2020) and not by the the process, as found for some other type-II GCs. Models of fast rotating massive stars (also called “spinstar”, Frischknecht et al. 2016, Limongi and Chieffi 2018) would show an increase of process yields, but would provide also alterations in light-elements, that are not seen correlated to abundance variations in neutron-capture elements in M 15 or other GCs (e.g. Roederer 2011). Moreover, no evidence of a spread in iron is claimed on the basis of extant high resolution spectroscopy (e.g. Carretta et al. 2009a,b).
All the above considerations were based on the metallicity spreads (or their absence) derived in the original studies. For a more homogeneous approach, we evaluated the iron dispersion of each type-II GC using the same method (see Sect. 4.4) we employed for NGC 6388, i.e. by maximization of the likelihood function as defined by Mucciarelli et al. (2012), that estimates the intrinsic spread by taking into account also the errors. In addition to the GCs listed as type-II in M17 and Nardiello et al. (2018b), we also added NGC 6273, as done in Gratton et al. (2019). This GC was not classified by M17 as a type-II because it lacks the UV HST photometry, however it clearly shows a large iron variation among its stellar populations (Johnson et al. 2015, 2017). Results are given in Table 8, where we list the adopted internal error for the metallicities of the individual stars, the derived intrinsic spread and the associated uncertainty, the number of stars, and the reference for the abundance analysis. To keep on the safe side, we conservatively chose to use the internal errors derived for stars with GIRAFFE spectra (usually larger than those for stars with UVES spectra) for NGC 6388 and the other GCs from our group (NGC 362, NGC 1851, NGC 6715, NGC 7078).
| NGC | error | stars | Ref | ||
|---|---|---|---|---|---|
| 362 | 0.041 | 0.000 | 0.014 | 92 | Carretta et al. 2013 |
| 1261 | 0.060 | 0.098 | 0.034 | 8 | Muñoz et al. 2021 |
| 0.090 | 0.000 | 0.030 | 14 | Marino et al. 2021 | |
| 1851 | 0.043 | 0.026 | 0.006 | 124 | Carretta et al. 2011 |
| 5139 | 0.117 | 0.247 | 0.007 | 855 | Johnson & Pilachowski 2010 |
| 5286 | 0.075 | 0.078 | 0.013 | 62 | Marino et al. 2015 |
| 6273 | 0.026 | 0.181 | 0.018 | 51 | Johnson et al. 2017 |
| 6388 | 0.067 | 0.000 | 0.008 | 185 | this paper |
| 6656 | 0.100 | 0.000 | 0.112 | 35 | Marino et al. 2011 |
| 6715 | 0.026 | 0.184 | 0.015 | 76 | Carretta et al. 2010c |
| 6934 | 0.090 | 0.089 | 0.035 | 13 | Marino et al. 2021 |
| 7078 | 0.040 | 0.042 | 0.008 | 52 | Carretta et al. 2009a,b |
| 7089 | 0.072 | 0.268 | 0.054 | 14 | Yong et al. 2014 |
From this Table we see that the procedure confirms the zero intrinsic metallicity spread for NGC 362, and the large iron spreads in NGC 5139, NGC 6273, NGC 6715, and NGC 7089. Smaller but robust spreads are derived in NGC 6286 and NGC 6934. A few GCs merit further comments. The case of NGC 1851 was already discussed above: the best separation of populations requires both [Fe/H] and the [Ba/H] abundances, but a small spread is still confirmed by iron abundances only.
The case of NGC 1261 is more uncertain. For this GC, two studies, both resting on small samples, give different results, although in both the original papers the quoted spread is the same (about 0.1 dex). The cause is probably related to the smaller internal error estimated in Muñoz et al. (2021), whereas the one in Marino et al. (0.09 dex) is almost the same of the observed iron spread.
The null spread for NGC 6656 is prima facie surprising. M 22 seems to be a genuine type-II GC, showing all the required features; however, the rather large internal error from Marino et al. (2011), that we derived from an average of all values associated to spectra from different telescopes, may reconcile the present finding with the usually assumed value of about 0.15 dex spread in the cluster. Finally, with this method also NGC 7078 seems to have a (small) intrinsic iron spread, contrarily to what derived from a simple comparison of observed spread and internal errors in the analysis. However, M 15 is the most metal-poor GC in our FLAMES survey, and the analysis of GIRAFFE spectra was rather difficult. Conservatively, for the value derived in Table 8 we retained only stars with at least six measured Fe lines. This cluster surely deserves merits further attention and a larger data set of good quality spectra. A paper on a new abundance analysis in M 15 is in preparation.
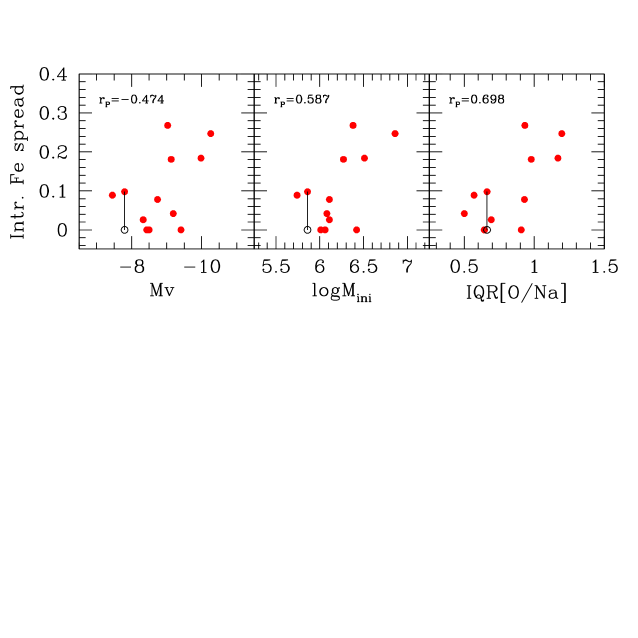
The intrinsic iron spread does not show a significant correlation with the GC present-day masses (as represented by the model-independent total absolute luminosity ), as shown in the left panel of Fig. 16. The probability associated to the Pearson linear regression coefficient is only . We thus confirm the findings by Muñoz et al. (2021) who found no trend with the mass, although using a more heterogeneous set of observed spreads. In Fig. 16, a solid line connects the two different values derived for NGC 1261, but all the regressions are computed using the non-null spread for this GC from Muñoz et al. (2021). A marginally significant () trend is observed as a function of the initial total cluster mass (central panel of Fig. 16, estimated by Baumgardt et al. (2018). This correlation is probably due to the fraction of SN ejecta retained in type-II GCs being a function of the (original) cluster mass, as discussed e.g. by Renzini et al. (2015) and Gratton et al. (2019).
Finally, in the right panel of Fig. 16 we plot a relation with a high level of significance () showing that the intrinsic spread is well correlated to IQR[O/Na], the interquartile range of the [O/Na] abundance ratio, from Carretta (2019). This quantity is a measure of the extent of the Na-O anti-correlation. It may seem odd to see this quantity connected to the iron spread in GCs, as none of the early producers of the alterations in light elements is predicted to pollute the cluster environment with additional iron. However, we remind that each of the involved quantities is a strong function of the GC total mass (see e.g. Carretta 2006, 2019, M17) and this occurrence well explains the above correlation.
To conclude this discussion, the evidence suggests that either the group of GCs called type-II is heterogeneous or NGC 6388 is not a genuine type-II GC. Together with previous analysis, the present results for NGC 6388 would require to explain the origin of the red-RGB sequence and their position in the ChM, as well as the discrepant fractions found for some GCs by different groups, which claims for a less subjective definition or more published data.
6 Summary
We present a large sample of homogeneous metallicities derived for giant stars in the massive bulge GC NGC 6388. We combined new observations with archival data and previously published data obtained with intermediate and high resolution spectroscopy for a total of 150 stars with spectra from GIRAFFE (high resolution HR13 setup) and 35 stars with spectra from UVES/FLAMES at the ESO-VLT UT2 telescope. Radial velocities, atmospheric parameters and resulting abundances of [Fe/H] were homogeneously obtained with the same methodology and on the same scale used for the other GCs in our FLAMES survey (e.g. Carretta et al. 2006, 2010a).
The most important result we found is that NGC 6388 does not show any intrinsic metallicity dispersion, at odds with what found by H20 using low-resolution MUSE spectra. The values obtained from the 35 stars with UVES spectra and 150 stars with GIRAFFE spectra are 0.045 dex and 0.040 dex, respectively, fully compatible with the uncertainties of the analysis. Our result confirms the absence of a significant metallicity spread found by all other previous works based on spectra with sufficiently high resolution and S/N: Carretta et al. 2007a, Carretta et al. 2009b, Carretta & Bragaglia 2018, L13 from GIRAFFE spectra; Mészáros et al. 2020 from APOGEE spectra).
We discussed our findings also in connection with the ChM of NGC 6388 and other type-II GCs. About a third of giant stars in NGC 6388 is supposed to be located in the region populated by red-RGB, “anomalous” stars defining the nature of type-II GCs according to the UV pseudo-colour diagram. However, no difference in metallicity is noticeable among these stars in NGC 6388 from our large sample studied with high resolution spectra. We conclude that either an intrinsic metallicity dispersion is not a necessary requisite for type-II GCs or NGC 6388 does not belong to this group. In the latter case, it would be necessary to understand the origin of the red-RGB stars on the ChM for this GC, as well as for M 15 and NGC 362 where an intrinsic metallicity dispersion is not found from spectroscopic analysis of large samples of stars.
The homogeneous data presented in this paper are also the necessary first step for a complete characterisation of the chemistry of multiple stellar populations in NGC 6388, their relation with the cluster dynamics (e.g. rotation in the individual sub-populations), and its use to better define the origin of this massive GC in the context of the GC population of the Milky Way. All these issues will be explored in detail in a forthcoming paper.
Acknowledgements.
We made extensive use of the ESO archive and we thank the personnel maintaining it and developing and applying the instrument pipelines. This research made use of observations made with the NASA/ESA Hubble Space Telescope obtained from the Space Telescope Science Institute, which is operated by the Association of Universities for Research in Astronomy, Inc. under NASA contract NAS 5-26555 We warmly thank Raffaele Gratton for useful discussion and Michele Bellazzini for sharing his code to measure intrinsic spreads. This research made use of the SIMBAD database (in particular Vizier), operated at CDS, Strasbourg, France, of the NASA Astrophysical Data System, of IRAF, and of TOPCAT (http://www.starlink.ac.uk/topcat/, Taylor 2005).References
- (1) Alonso, A., Arribas, S., Martinez-Roger, C. 1999, A&AS, 140, 261
- (2) Alonso, A., Arribas, S., Martinez-Roger, C. 2001, A&A, 376, 1039
- (3) Asplund, M., Grevesse, N., Sauval, A. J., et al. 2009, ARA&A, 47, 481
- (4) Baumgardt, H., Hilker, M., Sollima, A., Bellini, A. 2018, MNRAS, 482, 5138
- (5) Bekki, K., Freeman, K.C. 2003, MNRAS, 346, L11
- (6) Bellazzini, M., Ibata, R.A., Chapman, S.C. et al. 2008, AJ, 136, 1147
- (7) Bragaglia, A., Carretta, E., Gratton, R.G. et al. 2001, AJ, 121, 327
- (8) Cardelli, J.A., Clayton, G.C., Mathis, J.S. 1989, ApJ, 345, 245
- (9) Carretta, E. 2006, AJ, 131, 1766
- (10) Carretta, E. 2019, A&A, 624, A24
- (11) Carretta, E., Bragaglia, A. 2018, A&A, 614, A109
- (12) Carretta, E., Gratton R.G., Bragaglia, A., Bonifacio, P., Pasquini, L. 2004, A&A, 416, 925
- (13) Carretta, E., Bragaglia, A., Gratton, R.G. et al. 2006, A&A, 450, 523
- (14) Carretta, E., Bragaglia, A., Gratton, R.G. et al. 2007a, A&A, 464, 967
- (15) Carretta, E., Recio-Blanco, A., Gratton, R.G., Piotto, G., Bragaglia, A. 2007b, ApJ, 671, L125
- (16) Carretta, E., Bragaglia, A., Gratton, R.G., Lucatello, S. 2009a, A&A, 505, 139
- (17) Carretta, E., Bragaglia, A., Gratton, R.G. et al. 2009b, A&A, 505, 117
- (18) Carretta, E., Bragaglia, A., Gratton, R.G., D’Orazi, V., Lucatello, S. 2009c, A&A, 508, 695
- (19) Carretta, E., Bragaglia, A., Gratton, R.G. et al. 2010a, A&A, 516, 55
- (20) Carretta, E., Bragaglia, A., Gratton, R.G. et al. 2010b, ApJ, 714, L7
- (21) Carretta, E., Bragaglia, A., Gratton, R.G. et al. 2010c, A&A, 520, 95
- (22) Carretta, E., Lucatello, S., Gratton, R.G., Bragaglia, A., D’Orazi, V. 2011, A&A, 533, 69
- (23) Carretta, E., Bragaglia, A., Gratton, R.G. et al. 2013, A&A, 557, A138
- (24) Carretta, E., D’Orazi, V., Gratton, R.G., Lucatello, S. 2014, A&A, 563, 32
- (25) Cordero, M.J., Pilachowski, C.A., Johnson C.I., McDonald, I., Zijlstra, A.A., Simmerer, J. 2014, ApJ, 780, 94
- (26) Dalessandro, E., Lanzoni, B., Ferraro, F. R., et al. 2008, ApJ, 677, 1069. doi:10.1086/529028
- (27) D’Antona, F., Caloi, V. 2004, ApJ, 611, 871
- (28) Forbes, D.A. 2020, MNRAS, 493, 847
- (29) Frischknecht, U., Hirschi, R., Pignatari, M. et al. 2016, MNRAS, 456, 1803
- (30) Gaia Collaboration, Brown, A. G. A., Vallenari, A., et al. 2021, A&A, 649, A1. doi:10.1051/0004-6361/202039657
- (31) Gratton, R.G. 1988, Rome Obs. Preprint Ser., 29
- (32) Gratton, R.G., Carretta, E., Claudi, R., Lucatello, S., Barbieri, M. 2003, A&A, 404, 187
- (33) Gratton, R.G., Lucatello, S., Bragaglia, A. et al. 2007, A&A, 464, 953
- (34) Gratton, R.G., Carretta, E., Bragaglia, A., Lucatello, S., D’Orazi, V. 2010, A&A, 517, 81
- (35) Gratton, R.G., Bragaglia, A., Carretta, E. et al. 2019, A&ARv, 27, 8
- (36) Grevesse, N. & Sauval, A. J. 1998, SSRv, 85, 161
- (37) Grevesse, N., Asplund, M., & Sauval, A. J. 2007, SSRv, 130, 105
- (38) Han, S.-I., Lee, Y.-W., Joo, S.-J., Sohn, S.T., Yoon, S.-J., Kim, H.S., Lee, J.-W. 2009, ApJ, 707, L190
- (39) Harris, W. E. 1996, AJ, 112, 1487
- (40) Hughes, J., Wallerstein, G., Covarrubias, R., Hays, N. 2007, AJ, 134, 229
- (41) Husser, T.-O., Latour, M., Brinchmann, J. et al. 2020, A&A, 635, A114 (H20)
- (42) Johnson, C.I., Pilachowski, C.A. 2010, ApJ, 722, 1373
- (43) Johnson, C.I., Rich, M.R., Pilachowski, C.A. et al. 2015, AJ, 150, 63
- (44) Johnson, C.I., Caldwell, N., Rich, M.R. et al. 2017, ApJ, 836, 168
- (45) Kirby, E.N,, Duggan, G., Ramirez-Ruiz, E., Macias, P. 2020, ApJ, 891, L13
- (46) Kurucz, R.L. 1993, CD-ROM 13, Smithsonian Astrophysical Observatory, Cambridge
- (47) Lanzoni, B., Mucciarelli, A., Origlia, L. et al. 2013, ApJ, 769, 107 (L13)
- (48) Limongi, M., Chieffi, A. 2018, ApJS, 237, 13
- (49) Lützgendorf, N., Gebhardt, K., Baumgardt, H., et al. 2015, A&A, 581 A1
- (50) Magain, P. 1984, A&A, 134, 189
- (51) Marino, A.F., Sneden, C., Kraft, R.P. et al. 2011, A&A, 532, A8
- (52) Marino, A.F., Milone, A.P., Karakas, A.I. et al. 2015, MNRAS, 450, 815
- (53) Marino, A.F., Milone, A.P., Renzini, A. et al. 2019, MNRAS, 487, 3815
- (54) Marino, A.F., Milone, A.P., Renzini, A. et al. 2021, arXiv:2106.15978
- (55) Massari, D., Koppelman, H.H., Helmi, A. 2019, A&A, 630, L4
- (56) Mészáros, S., Masseron, T., García-Hernández, D.A. et al. 2020, MNRAS, 492, 1641 (M20)
- (57) Milone, A.P., Piotto, G., Renzini, A. et al. 2017, MNRAS, 464, 3636 (M17)
- (58) Minelli, A., Mucciarelli, A., Massari, D., et al. 2021, ApJL, 918, L32. doi:10.3847/2041-8213/ac2156
- (59) Mucciarelli, A., Bellazzini, M., Ibata, R. et al. 2012, MNRAS, 426, 2889
- (60) Mucciarelli, A., Lapenna, E., Massari, D. et al. 2015, ApJ, 809, 128
- (61) Muñoz, C., Geisler, D., Villanova, S. et al. 2021, MNRAS, 506, 4676
- (62) Myeong, G.C., Vasiliev, E., Iorio, G. 2019, MNRAS, 488, 1235
- (63) Nardiello, D., Libralato, M., Piotto, G. et al. 2018a, MNRAS, 481, 3382
- (64) Nardiello, D., Milone, A.P., Piotto, G. et al. 2018b, MNRAS, 477, 2004
- (65) Ortolani, S., Renzini, A., Gilmozzi, R. et al. 1995, Nature, 377, 701
- (66) Pasquini, L., Avila, G., Allaert, E., et al. 2000, Proc. SPIE, 4008, 129. doi:10.1117/12.395491
- (67) Pfeffer, J., Lardo, C., Bastian, N., Saracino, S., Kamann, S. 2021, MNRAS, 500, 2514
- (68) Piotto, G., Sosin, C., King, I.R. 1997, in Advances in Stellar Evolution, ed. R.T.Rood & A.Renzini (Cambridge: Cambridge Univ.Press),84
- (69) Piotto, G., Milone, A.P., Bedin, L.R., et al. 2015, AJ, 149, 91
- (70) Raimondo, G., Castellani, V., Cassisi, S., Brocato, E., Piotto, G. 2002, ApJ, 569, 975
- (71) Renzini, A., D’Antona, F., Cassisi, S. et al. 2015, MNRAS, 454, 4197
- (72) Roederer, I.U. 2011, ApJ, 732, L17
- (73) Siegel, M.H., Dotter, A., Majewski, S.R. et al. 2007, ApJ, 667, L57
- (74) Skrutskie, M.F., Cutri, R.M., Stiening, R. et al. 2006, AJ, 131, 1163
- (75) Sneden, C., Johnson, J., Kraft, R.P. et al. 2000, ApJ, L85
- (76) Sobeck, J.S., Kraft, R.P., Sneden, C. et al. 2011, AJ, 141, 175
- (77) Taylor, M. B. 2005, Astronomical Data Analysis Software and Systems XIV, 347, 29
- (78) Vasiliev, E., & Baumgardt, H. 2021, Catalogue of stars in Milky Way globular clusters from Gaia EDR3 [Data set]. Zenodo. https://doi.org/10.5281/zenodo.4891252
- (79) Villanova, S., Geisler, D., Piotto, G. 2010, ApJ, 722, l18
- (80) Wallerstein, G., Kovtyukh, V.V., Andrievsky, S.M. 2007, AJ, 133, 1373
- (81) Worley, C.C., Hill, V., Sobeck, J., Carretta, E. 2013, A&A, 553, A47
- (82) Yi, S., Demarque, P., Oemler, A.Jr. 1998, ApJ, 492, 480
- (83) Yong, D., Roederer, I.U., Grundahl, F. et al. 2014, MNRAS, 441, 3396