High-resolution ALMA observations of V4046 Sgr: a circumbinary disc with a thin ring
Abstract
The nearby V4046 Sgr spectroscopic binary hosts a gas-rich disc known for its wide cavity and dusty ring. We present high resolution (20 mas or 1.4 au) ALMA observations of the 1.3 mm continuum of V4046 Sgr which, combined with SPHERE–IRDIS polarised images and a well-sampled spectral energy distribution (SED), allow us to propose a physical model using radiative transfer (RT) predictions. The ALMA data reveal a thin ring at a radius of 13.150.42 au (Ring13), with a radial width of 2.460.56 au. Ring13 is surrounded by a 10 au-wide gap, and it is flanked by a mm-bright outer ring (Ring24) with a sharp inner edge at 24 au. Between 25 and 35 au the brightness of Ring24 is relatively flat and then breaks into a steep tail that reaches out to 60 au. In addition, central emission is detected close to the star which we interpret as a tight circumbinary ring made of dust grains with a lower size limit of 0.8 mm at 1.1 au. In order to reproduce the SED, the model also requires an inner ring at 5 au (Ring5) composed mainly of small dust grains, hiding under the IRDIS coronagraph, and surrounding the inner circumbinary disc. The surprisingly thin Ring13 is nonetheless roughly 10 times wider than its expected vertical extent. The strong near-far disc asymmetry at 1.65 points at a very forward-scattering phase function, and requires grain radii of no less than 0.4 .
keywords:
protoplanetary discs – submillimetre: planetary systems – radiative transfer1 Introduction
Recent observations of young circumstellar discs have transformed the current knowledge on planet formation. Among the main recent findings of resolved observations of discs is the discovery of substructures in the form of gaps, rings, cavities, and spirals, to name a few (see, Andrews, 2020, and references there in). However, the focus of resolved imaging with the Atacama Large Millimeter/submillimeter Array (ALMA) or with the current generation of high-contrast cameras has mainly been towards the brighter sources (e.g., Garufi et al., 2017). It is to address this bias that the “Discs Around T Tauri Stars with SPHERE” (DARTTS-S) programme collected differential polarization imaging (DPI) data with the Spectro-Polarimeter High-contrast Exoplanet REsearch (SPHERE Beuzit et al., 2019) for a total of 29 solar-type stars (Avenhaus et al., 2018; Garufi et al., 2020). The sample is not biased towards exceptionally bright and large discs. The DARTTS observations revealed diverse structures and morphologies in the scattering surface of these discs. This article on V4046 Sagittarii (Sgr) is the first instalment of a companion programme, the DARTTS survey with ALMA (DARTTS-A), which will present millimetre observations of nine protoplanetary discs previously imaged in polarised scattered light in DARTTS-S.
V4046 Sgr is a double-lined spectroscopic binary of K-type stars (K5 and K7) with very similar masses of 0.900.05 M☉ and 0.850.04 M☉ (Rosenfeld et al., 2012), on a close ( au), circular () orbit, with an orbital period of 2.42 days (Quast et al., 2000). It is a member of the Pictoris moving group (Zuckerman & Song, 2004), with an estimated age of 18.5 Myr (Miret-Roig et al., 2020), and its distance is 71.480.11 pc (Gaia Collaboration et al., 2021). V4046 Sgr hosts a massive (0.1 M☉) circumbinary disc extending to 300 au (Rosenfeld et al., 2013; Rodriguez et al., 2010), rich in diverse molecular lines (Kastner et al., 2018).
Previous analysis of radio observations taken with the Sub-Millimeter Array (SMA) (Rosenfeld et al., 2013) and later with ALMA (Guzmán et al., 2017; Huang et al., 2017; Bergner et al., 2018; Kastner et al., 2018), showed that the millimetre dust of the V4046 Sgr circumbinary disc features a large inner hole of 30 au and a narrow ring centred around 37 au that account for most of the dust mass. More recently, Francis & van der Marel (2020), with higher definition ALMA images, detected a structured outer disc with an inner disc in the millimetre continuum. On the other hand, by using SPHERE polarized light observations in the J- and H-band, Avenhaus et al. (2018) confirmed the double-ring morphology previously reported by Rapson et al. (2015) using GPI data. In these polarized light observations, the surface brightness presents a 10 au-wide inner cavity, a narrow ring at 14 au, and an outer ring centred at 27 au. Later, Ruíz-Rodríguez et al. (2019) elaborated on the characterisation of the observed rings in the SPHERE images, more on that in Section 2.2.
A parametric model that simultaneously fits the NIR scattered light and millimetre continuum emission links the observations to the structures in the underlying dust and gas density distributions, and sheds light on the complex processes that shaped them. In this paper, we present new ALMA observations of the continuum emission at 1.3 mm of V4046 Sgr with unprecedented angular resolution in this source, which reveal an inner ring in the disc. We also reproduce these observations with a 3D parametric model that fits all available data, including the polarized scattered light SPHERE image, the spectral energy distribution (SED), as well as the new high definition 1.3 mm continuum map. Section 2 describes the available observations that we aim to model. Section 3 describes the structural parameters of our model. A description of our parameter space exploration can be found in Appendix A. The results of our modelling are presented in Section 4, including a discussion of the main findings. Finally, in Section 5 we present our conclusions.
2 Observations
2.1 ALMA
New ALMA observations of V4046 Sgr were obtained in 2017 as part of the Cycle 5 program 2017.1.01167.S (PI: S. Perez). The observations acquired simultaneously the 1.3 mm continuum and the J = 21 line of 12CO (i.e. with a band 6 211-275 GHz correlator setup). A log of the observations is shown in Table 1. The ALMA array was in its C43-8/9 configuration, with baselines ranging from 92 to 13894 m which translate into a synthesized beam of , in natural weights. Here we focus on the continuum observations only. Francis & van der Marel (2020) included a subset of this dataset, corresponding to the C43-8 configuration, as part of a large sample of transition discs, with a focus on the statistical properties of the inner discs.
| Configuration | Execution Block | N Ant. | Date | ToS | Avg. Elev. | Mean PWV | Baseline | MRS |
|---|---|---|---|---|---|---|---|---|
| (uid://A002/) | (sec) | (deg) | (mm) | (m) | (") | |||
| C43-8/9 | Xc6b674/X44f | 48 | 2017-11-10 | 507 | 50.9 | 1.0 | 113.0 - 13894.4 | 0.571 |
| C43-8 | Xc72427/X34f2 | 43 | 2017-11-23 | 507 | 45.2 | 0.4 | 91.6-8547.6 | 0.8 |
Image synthesis of the ALMA continuum was performed with the uvmem package (Casassus et al., 2006; Cárcamo et al., 2018), which fits a non-parametric model image to the data by comparing the observed and model visibilities, and , using a least-squares figure of merit :
| (1) |
where are the visibility weights and is a dimensionless parameter that controls the relative importance of the regularization term .
The chosen regularization term for this case was the standard image entropy, or
| (2) |
where is the default pixel intensity value and is set to times the theoretical noise of the dirty map (as inferred from the visibility weights ). Here we set . Similar applications of uvmem in the context of protoplanetary discs can be found, for example, in Casassus et al. (2013, 2018, 2019a); Pérez et al. (2019) and in Pérez et al. (2020) using long baseline data. An advantage of uvmem compared to more traditional imaging strategies, such as provided by the tclean task in CASA, is that the effective angular resolution of the model image is 3 times finer than the natural weights clean beam (Cárcamo et al., 2018), giving us a new approximate uvmem resolution of 00. This angular resolution is comparable to uniform or super-uniform weights in tclean, but it preserves the natural-weights point-source sensitivity. The RMS noise of the uvmem image is 26 Jy per resolution beam, at a frequency of 237 GHz.
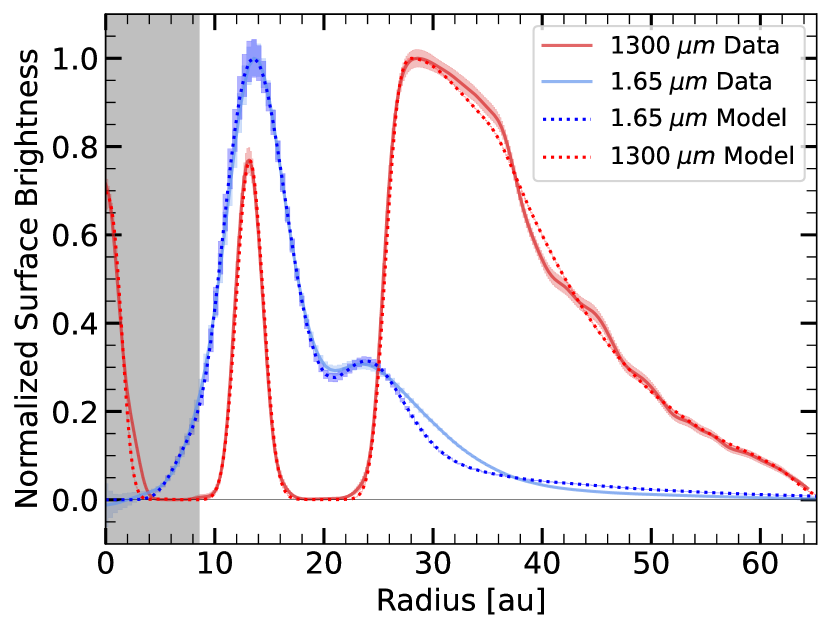
The resulting uvmem image shown in the top right panel of Fig. 1 reveals new substructure of the disc, in the form of two rings of large dust grains with a broad gap between them, i.e. Ring13 at around 13 au and Ring24 starting at around 24 au (see below for a precise estimation). The wide and bright Ring24 reaches its peak intensity at 30 au, continues relatively flat and then breaks at 35 au into a steeper tail. While this is the first observation of Ring13, Ruíz-Rodríguez et al. (2019) anticipated its existence as their ALMA continuum image showed a distinct excess between 10 and 17 au.
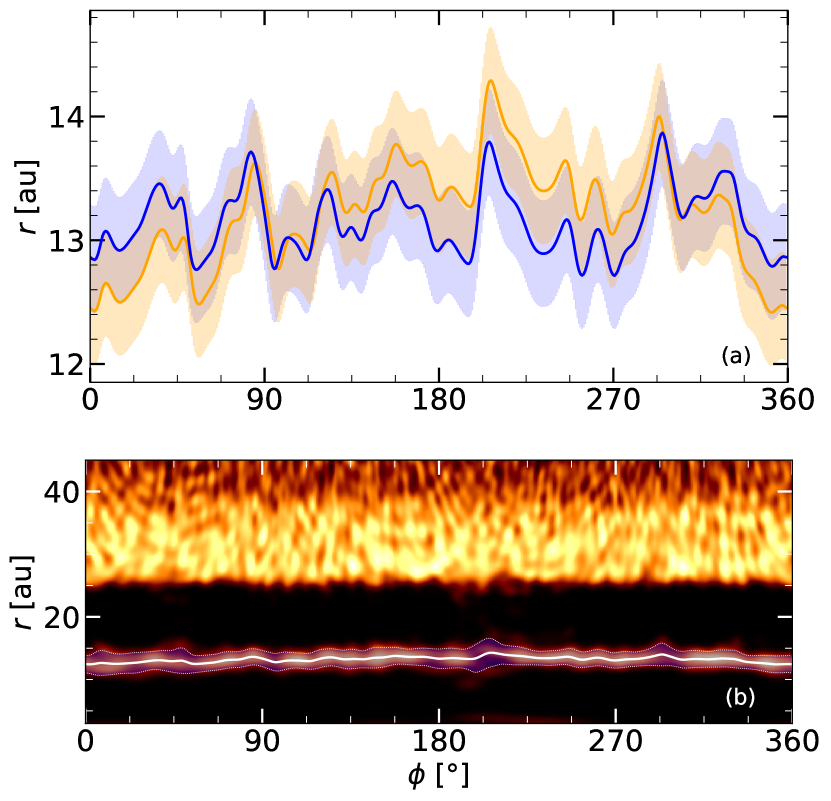
Ring13 is surprisingly narrow and seems to be off-centred relative to the Gaia stellar position, at the origin of coordinates in Fig. 1. We determined the centre of the ring and its orientation using the MPolarMaps package described in Casassus et al. (2021), which minimises the dispersion of the intensity radial profiles between two given radii and returns the optimal values for the disc position angle (PA), inclination, and disc’s centre. In an initial optimization we focus on the orientation of Ring13, and choose a radial range from 6 to 18 au, which covers Ring13 but excludes Ring24. The resulting disc orientation is set at a PA of 257.310.03 deg (east of north), with an inclination of 147.040.02 deg, and the optimal ring centre is at mas mas relative to the Gaia position of the stars. The offset of the centre of the cavity and the nominal stellar positions are coincident within the pointing accuracy of ALMA, which is 5 mas for the signal to noise ratio of our image (calculated using the ALMA Technical Handbook).
In a second optimization of the disc orientation, but this time aiming for Ring24 with a radial domain from 20 au to 70 au (fully including Ring24 and excluding Ring13), we obtained a PA of 256.860.02 deg, with an inclination of 146.080.01 deg and a centre at mas mas relative to the stars. We see that both Ring13 and Ring24 share a very similar orientation and centre, given the errors and the pointing accuracy. However, see that there are some hints for a somewhat different orientation in the azimuthal profiles for the ring radii, which may nonetheless be accounted for by the joint effect of all these small differences in disc orientation. This is summarised in Fig. 2a, which characterises the radial position and width of Ring13 as a function of azimuth by using radial Gaussian fits at each azimuth. The radial centroids for both disc orientation overlap within the errors, but there is a systematic trend for the difference between the two. It may be that this small difference reflects a finite intrinsic eccentricity of one or both rings. Deeper imaging is required to progress on this question.
On average, we obtained a radial FWHM for Ring13 of 2.830.50 au, and a stellocentric radius of 13.150.42 au (see Fig. 2b). As the uvmem model image has an approximate uvmem beam of 00 (or 1.4 au at 71.48 pc), we see that Ring13 is resolved. After subtraction of the uvmem beam, the ring width is 2.460.56 au.
Interestingly, the ALMA image also detects 1.3 mm continuum emission near the stellar positions (see the inset in Fig. 1). Since this central emission is larger than the angular resolution, it is probably stemming from thermal emission from large dust grains rather than directly from the stars. The peak intensity of this dust structure is at an estimated distance of only , or 0.850.14 au from the binary system, and, estimating its form as a Gaussian ellipse, it has a mean FWHM of 1.43 au.
2.2 VLT/SPHERE–IRDIS
V4046 Sgr was observed in DPI mode with SPHERE–IRDIS on March 13, 2016 (see Avenhaus et al., 2018, for details). Here we use a new reduction of the band data produced with the IRDAP pipeline (van Holstein et al., 2020), which can separate stellar and instrumental polarization. The polarized signal is consistent with the previous image in Avenhaus et al. (2018). The degree of linear polarization of the central and unresolved signal in V4046 Sgr is only 0.13%, with a systematic uncertainty of 0.05% due to time-varying atmospheric conditions during the exposures. The angle of polarization is aligned with the disc major axis, as expected given that the target has an extinction of Av=0.0 (McJunkin et al., 2016) and the entire polarization is dominated by circumstellar rather than inter-stellar material.
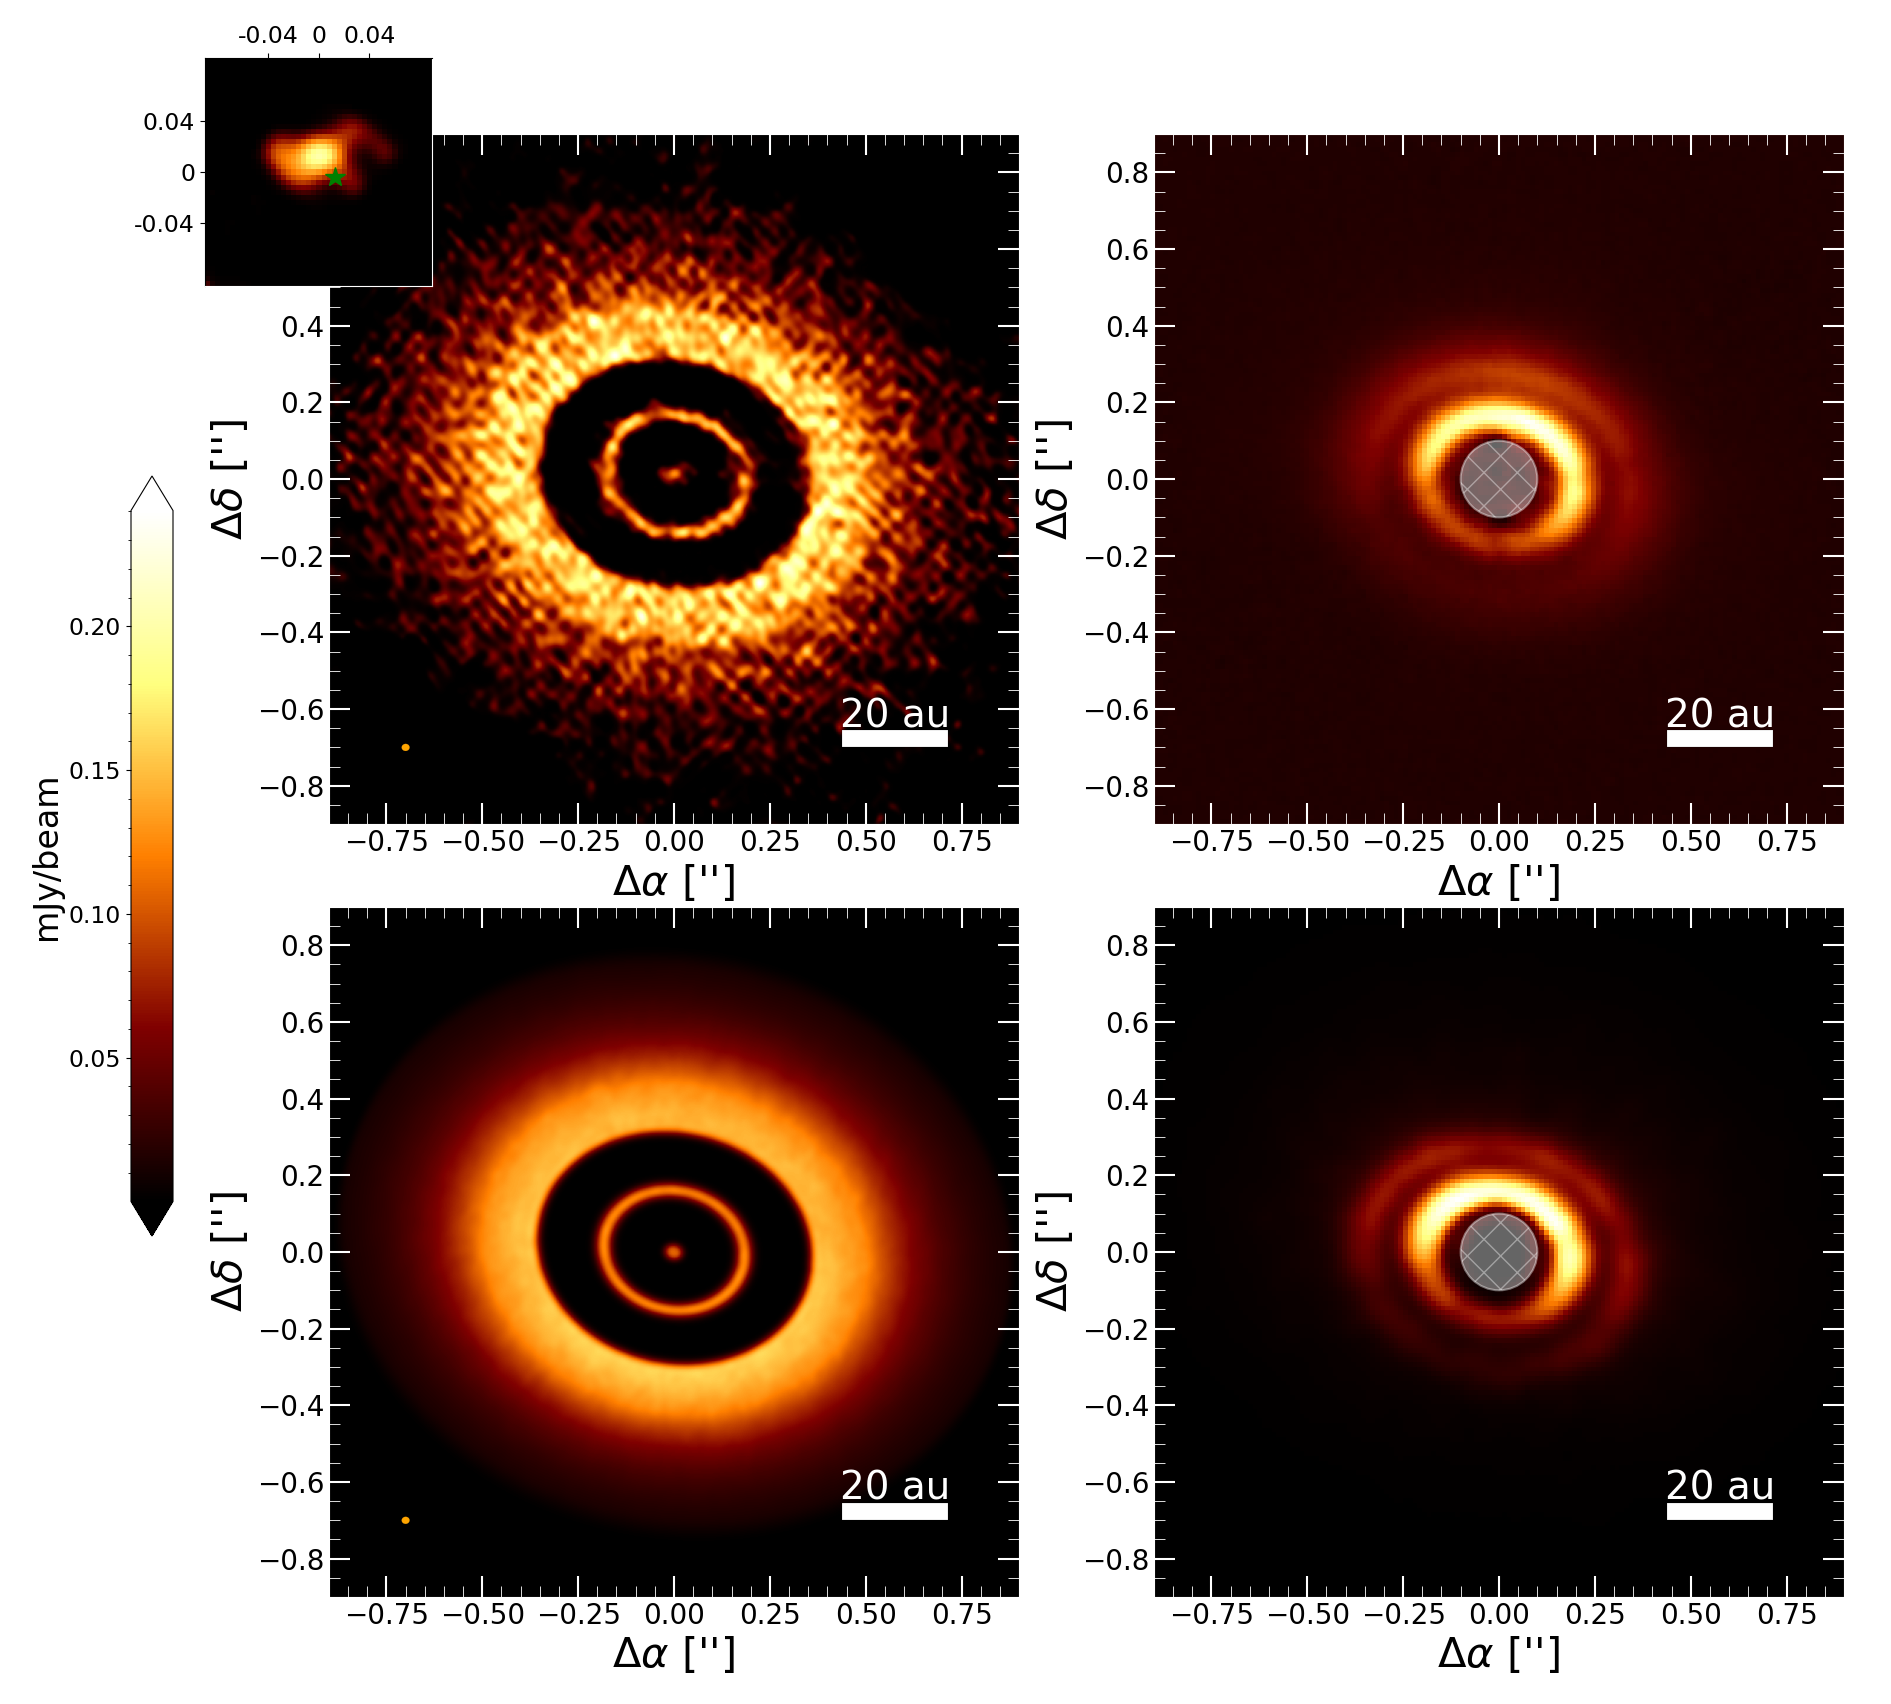
The scattered light image in the top left panel of Fig. 1 also shows a double ring structure in the micron-sized dust distribution. The observed morphology presents an inner cavity of 10 au in radius and two rings located at 14.100.01 au, coincident with Ring13, and 24.620.08 au, coincident with the inner wall of Ring24, with a small gap between them at 20 au (Ruíz-Rodríguez et al., 2019). Two other important features that are present in the image are: the near-far brightness asymmetry, and the shadows projected on the disc by the close binary system as they eclipse each other, discovered by D’Orazi et al. (2019).
The binary phase reported by D’Orazi et al. (2019) in the scattered light observation is at a PA of 265 deg, east of north. Using this measurement, the binary phase was calculated at the time of the ALMA observation at a PA of 80 deg.
2.3 Spectral energy distribution
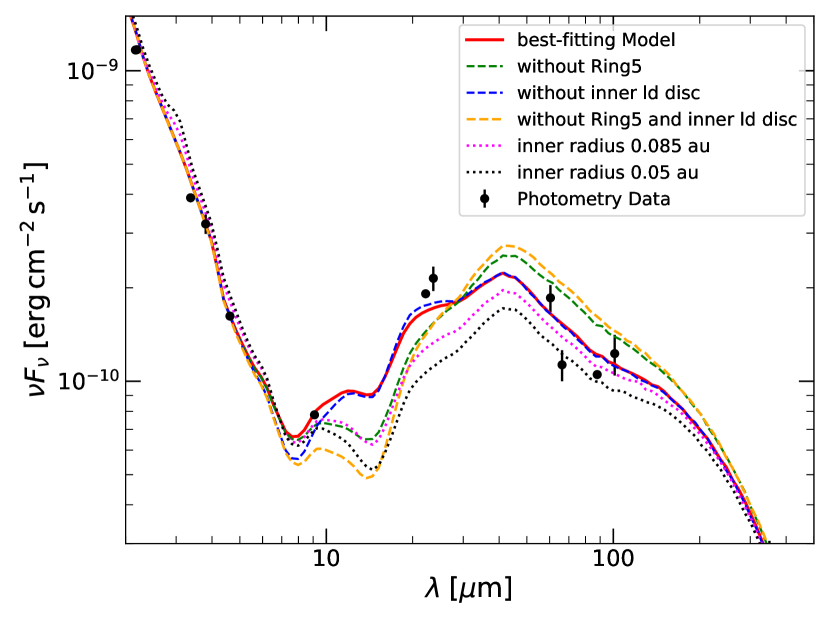
The observed SED was collected from data in the literature (Helou & Walker, 1988; Hutchinson et al., 1990; Jensen & Mathieu, 1997; Høg et al., 2000; Kharchenko, 2001; Cutri et al., 2003; Murakami et al., 2007; Ofek, 2008; Ishihara et al., 2010; Cutri & et al., 2012), available online in vizier. We also used archival Spitzer IRS spectroscopic data available in the CASSIS database (Lebouteiller et al., 2015). The data is displayed in Fig. 3 along with the resulting SED of the radiative transfer model presented in the next section (more on the resulting SED in Sec. 4). The SED exhibits the dip near 10 characteristic of transition discs, as described by Rosenfeld et al. (2013). Jensen & Mathieu (1997) concluded that these data matched that of a extended circumbinary disc truncated at 0.2 au, as the interior would also be expected to be cleared by dynamical effects of the central binary (Artymowicz & Lubow, 1994).
3 Parametric radiative transfer model
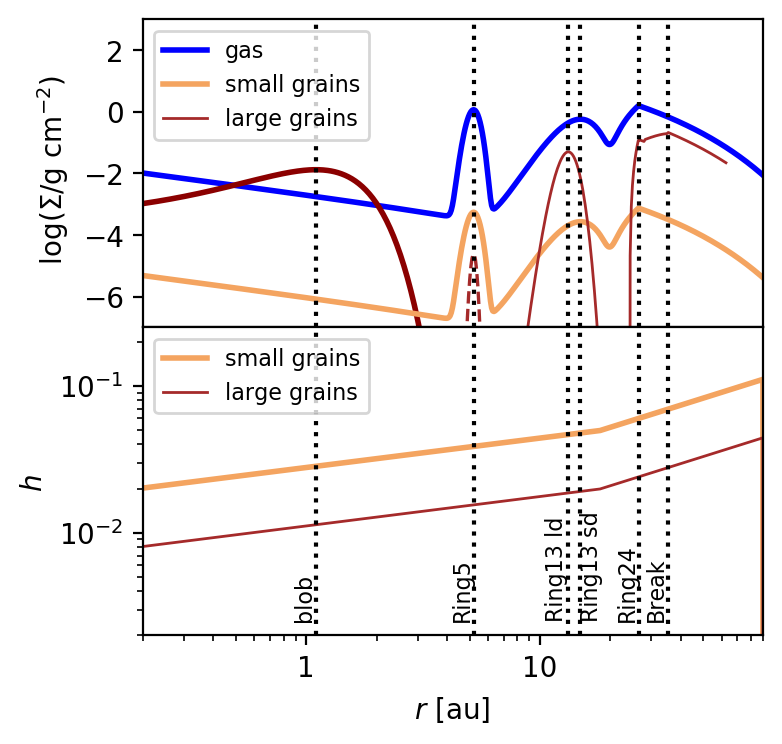
The multi-frequency data can be interpreted in terms of a physical structure using radiative transfer predictions, for which we used the radmc3d package (version 2.0, Dullemond et al., 2012). The general framework of the parametric model that we developed is similar to that in Casassus et al. (2018) for DoAr 44, and the initial model values were inspired from those in Rosenfeld et al. (2013), Ruíz-Rodríguez et al. (2019) and Qi et al. (2019). A high-resolution radiative transfer model that reproduces multi-frequency imaging and the SED, is a solution to a highly degenerate problem, so a full parameter exploration requires a level of computation and time that exceeds our capabilities and the scope of this paper. Consequently, our approach was to find through trial and error a set of values for the parameters that closely fit the available data, and then, improve this fit by implementing one dimensional least squared optimizations for some key parameters (more on this in Sec. 4). The final structure of the parametric model is summarised in Fig. 4, where we show on the top panel the surface density profiles for gas and dust grains populations, and in the lower panel the respective aspect ratio profile.
3.1 General setup
The stars were modelled using two Kurucz photosphere models (Kurucz, 1979; Castelli et al., 1997), with T 4350 K, R 1.064 R☉, M 0.90 M☉ and T 4060 K, R 1.033 R☉, M 0.85 M☉, respectively and with an accretion rate of 9.3 for both cases to include excess UV due to stellar accretion (Donati et al., 2011). The stars were placed at a mutual separation of 0.041 au, so that their centre of mass coincides with the origin. Their PA was set to 250 deg, so that the secondary lies to the NW from the primary, thus casting the same shadow as observed by D’Orazi et al. (2019).
Reproducing the radial and vertical structure of the V4046 Sgr disc turned out to be challenging. We built the model in terms of the gas distribution, and with two main dust populations: large grains with radii from 0.3 to 10 mm that are vertically settled and dominate the total dust mass, and a population of smaller grains with radii ranging from 0.3 to 1.5 that are uniformly mixed with the gas and reach higher regions above the mid-plane.
We take a three dimensional model in a cylindrical reference frame with coordinates (, , ). The inner radius of the model grid was set to 0.1 au, and the outer radius to 100 au, which is large enough for the dust disc to be undetectable. We set the values of the inclination and disc position angle to the same as obtained from the ALMA observation in Section 2, such that the model has an inclination of i = 147.04 deg and a P.A. = 257.31 deg. The model was set at a distance of d = 71.48 pc (Gaia Collaboration et al., 2021).
3.2 Radial structure: gas & small dust grains
Given the cylindrical coordinates (, , ), the gas density () distribution follows
| (3) |
where is the scale height profile and is the gas surface density profile.
Although both ALMA and SPHERE–IRDIS images display two-ringed morphologies, we propose a three-ringed structure plus an inner disc to reproduce the observations. This bold decision is due the major fit improvement in the SED and the polarize image (more on this in Sec. 4 and Appendix A.2). We separate the gas disc into four individual regions: an inner disc with a power-law profile and three rings named Ring5, Ring13, and Ring24, as they are located at 5, 13, and 24 au respectively. The combined gas surface density profile is then given by:
| (4) |
First, the inner disc model follows a power-law function defined by
| (5) |
where is a characteristic radius and is the surface density power-law index. We used = 16 au, and a fixed = 1 as it is a typical value for discs (Andrews et al., 2009, 2010). The gas in our model extends from = 0.2 au outwards, consistent with the inner edge radius inferred from the SED data (see Appendix A.2).
Secondly, due to the thin nature of Ring5 and Ring13, we chose to use Gaussian profiles to parametrize them,
| (6) |
where we define constants that correspond to the centroid radii { au, au}, ring widths { au, au}, and normalizations { , } for both components separately.
Thirdly, for Ring24 we used the same power-law as for the inner disc but scaled by an empirically obtained factor, and by , a parameter that allows us model a smoother inner edge of the outer ring:
| (7) |
with for au and zero for lower radii, and
| (8) |
where and respectively mark the inner edge and the location of maximum density of the outer ring. We used = 18 au and = 26.4 au.
Finally, the total dust-to-gas mass ratio is taken to be (as in Rosenfeld et al., 2013). The small dust grains are assumed to only make up for a fraction of of the total dust mass. As small dust is typically tightly coupled to the gas dynamics, its density profile is expected to follow the gas density. Then the density of small dust can be calculated as:
| (9) |
3.3 Radial structure: large dust grains
Since the large dust grains are less coupled to the gas, their distribution has some important differences that require a special parameterisation, such as a larger inner cavity, a larger gap between Ring13 and Ring24, and a break in the outer ring. We only included a low density of large grains within Ring5, just underneath the detection limit of the ALMA observation, as it does not show any visible signature. The surface density profile of the large dust grains is then defined by the sum of its three components
| (10) |
For Ring5 and Ring13, we chose Gaussian profiles parameterized with centroid radii au and au, ring widths of au and au, and normalizations and . For Ring24 we used a similar profile as for the gas (a power-law function). The surface density for large dust grains in the outer ring is thus given by
| (11) |
where for the smoothing factor we used = 24.2 au and , resulting in an inner wall of Ring24 at larger radii for the large dust but a peak at the same location than that of the small dust. In an effort to recreate the break seen in the outer ring, we used
| (12) |
and
| (13) |
Then the final density of large dust can be calculated as
| (14) |
Following the observation, this profile is truncated at 63 au.
3.3.1 Reproducing the central emission
For whole purpose of reproducing the central emission in the ALMA image, we introduce a third and special dust population of larger grains with a distribution tightly confined to the stellar vicinity. This dust is distributed only on a very close-in Gaussian ring parameterized by au, au and , and it is composed of grains with radii ranging from 0.8 to 10 mm, same upper limit as the large dust but is depleted of small grains. With this distinctive size range we avoid creating a NIR excess in the SED, and we can be consistent with previous mass estimates (see Appendix A.1 and Sec. 4).
3.4 Vertical structure
The parametric scale height profiles for the gas and for each dust population are
| (15) |
where is the scale height at = , is the flaring index and is a scaling factor (in the range ) that mimics dust settling. In hydrostatical equilibrium, dust diffusion and settling are expected to balance each other, leading to a settling factor of (Dubrulle et al., 1995). Here, is a dimensionless parameter that informs about the level of diffusivity (it is typically assumed to be similar to the level of turbulence for the particle sizes regarded here Youdin & Lithwick, 2007). The Stokes number,
| (16) |
summarises the dynamical behaviour of a particle in a given environment (where represents a dust particle’s material density). By definition, the gas has no settling, and the small dust grains settling is negligible, so that . As we do not know the level of diffusivity in the disc (this will be a topic of interest in Section 4), nor the exact value of , we infer the scaling factor for large dust, , from the width of Ring13. In the radial profile this ring is observed two to three times wider in the gas-tracing NIR than in the fluxes received from larger grains by ALMA. We assume that the same ratio holds in the vertical direction (due to the settling of larger grains towards the mid-plane of the disc), leading to . This is analogous to assuming equal radial and vertical turbulent diffusions.
For the vertical structure, D’Orazi et al. (2019) found flaring angles (i.e. height of the ring over the disc midplane divided by the radius of the ring), of = 6.20.6 deg for the inner ring and = 8.51.0 deg for the outer one. Our model aims to reproduce those values by using two different flaring indices, and . The separation between the two values was set at au with for Ring5 and Ring13, and for Ring24. The scale height is set to au at au. This vertical structure is consistent with the measurements made by D’Orazi et al. (2019), as the model flaring angles are = 6.4 deg and = 7.6 deg. This is summarized in the bottom panel of Fig. 4 that shows the aspect ratio profile .
3.5 Image synthesis and SED computation
To take the simulated images we computed the dust opacities using the bhmie code provided in the radmc3d package. The two main populations are taken to be composed by a mix of 60% silicate, 20% graphite and 20% ice. Differently, for the special population of larger grains, as the ring is extremely proximate to the binary system, the dust will not have any traces of ice, so we used a composition mix of 70% silicate and 30% graphite.
For the reproduction of the ALMA observation, we create an image using ray-tracing preceded by a Monte Carlo run that gives the simulated image at 1250 , the rest wavelength of the real observation. This image is then convolved with Gaussian blur using the uvmem beam of 00 to syntesize the final image displayed in Fig. 1. The SED is computed in a similar manner by taking the spectra at 200 wavelengths between 0.1 and 2000 .
In order to reproduce the H-band image, we take a different approach. As the observed asymmetry between the near side and the far side of the disc in the DPI image is suggestive of a strongly forward-scattering phase function, we used much larger grains than typically used in the RT modelling of such NIR data (e.g., Casassus et al., 2018). For the computation of this particular image, we implemented a different grain size distribution, where we centred a Gaussian at = 0.4 with = 0.12 (smeared out by 30%), and distributed the dust over 20 bins within the range of . This distribution applies only to generate the NIR image and not the ALMA image or the SED. To produce this image we performed a linear combination of the two orthogonal linear polarizations U and Q, following Avenhaus et al. (2017), which gives a representation of an unbiased estimate of the polarized intensity image. The simulated DPI image at 1.65 in Fig. 1 was obtained with the scattering matrix calculated by the makeopac.py, script provided in the radmc3d package.
Finally, as mentioned before, the model presented here gives a solution to a highly degenerative problem, and the RT calculation for each set of parameters is very intensive in computational power and time, so a MCMC optimization or similar methods of parameter exploration are impossible to carry out. Nevertheless, as a way to improve the fit and obtain a rough measure of the accuracy of our model, we made one dimensional explorations of the parameter space and found uncertainties of some relevant parameters that will be useful for the discussion (see Appendix A.1). We can estimate uncertainties for the scale height at = 18 au with au and for the width of the gas in Ring13 with au.
4 Model results and discussion
The observed SED reveals a small near-infrared (NIR) excess of 0.93.7 % (Francis & van der Marel, 2020), this low emission would be primarily emanating from micron-sized dust grains at the hot inner dust wall of a low-mass inner disc. On the other hand, the mm-bright central emission suggests a massive inner dust ring. The faint near-IR excess contrast with the bright mm emission, and could point to a lack of micron-sized dust in the central ring, that could be due to efficient dust growth or due to the ring having an inner radius well beyond the sublimation radius. In order to reproduce the low NIR and simultaneous bright central mm emission, we extended the radius of an inner cavity to significantly exceed both the sublimation radius and the zone that is expected to be cleared by dynamical binary-disc interaction (see Appendix A.2). A possible explanation for this wider cavity is the presence of an additional effect of truncation, like an unseen companion planet in the very inner part of the disc (Francis & van der Marel, 2020). At the same time, the central emission is also well reproduced in the ALMA image with the inclusion of a Gaussian ring at 1.1 au. This inner ring produces a low near-IR excess only if it consists of dust grains larger than 0.3 mm (see Appendix. A.1). But we implement 0.8 mm instead as the lower limit for the dust population that composes this feature, given that this predicts a dust mass of 0.012 M⊕, which is close to that obtained by Francis & van der Marel (2020) (0.0130.002,M). They converted mm-flux into mass using the standard opacity value of =10 at 1000 GHz with an opacity power-law index of =1.0, while our mass estimates are extracted from the RT model.
The decision of including Ring5 to the observed structure relies on the fact that the SED needs a thin dust ring, made mainly of small dust grains, at a radius of 5 au to have a proper fit between 6 and 300 (see Appendix A.2). The introduced Ring5 is not visible in the simulated image at 1.65 , where it hides under the artificial coronagraph, neither in the 1.3 mm continuum simulated image, as its predicted peak intensity is around two times the noise in the ALMA image (1 Jy ). This gives us an upper limit for the total millimetre–sized dust mass present in Ring5 of 2 M⊕. The depletion of large dust grains in Ring5 is consistent with efficient dust trapping in Ring13. A zone of radially increasing gas pressure can entirely filter out large dust grains from the inner regions, while smaller grains can be able to overcome this barrier due to their strong frictional coupling to the gas accretion flow (studied in the context of planetary gaps, Rice et al., 2006; Zhu et al., 2012; Weber et al., 2018). Still, the strong depletion of large particles demands that within Ring5 dust growth is extremely inefficient or limited by fragmentation. Otherwise, the present small grains should coagulate to form detectable grain sizes in the ALMA observation in Fig. 1 (Drążkowska et al., 2019).
As the radial profiles obtained from the simulated images of the model closely resemble those deduced from the observations (Fig. 5), we can assume that the model provides a possible approximation of the disc structure, including the dimensions of Ring13. The FWHM of the gas and micron-sized dust in Ring13 in the RT model corresponds to au, as well as a radius of 14.9 au, and a scale height FWHM of 0.63 au. Meanwhile, the millimetre-sized dust in Ring13 has a FWHM of 2.00 au, a radius of 13.22 au, and a scale height FWHM of 0.25 au (). The total dust mass of Ring13 would be about 0.7 M⊕. The model predictions for the millimetre-sized dust population in Ring13 are close to the measurements, with only a 1% difference in the centroid location of the ring, and a 19% difference in the width estimation. Given that the scale height FWHM of the large grains in Ring13 is 0.25 au, and that the width of Ring13 from the ALMA observations is 2.460.56 au (see Sec. 2.1), we conclude that the large dust ring is 10.01.6 times more extended radially than vertically. Looking at the rest of the disc, our model reproduces the observations of Ring24 with peak intensity at 30 au, and the break at 36 au. The whole disc contains a total dust mass of 48 M⊕.
Even though the radial spread of large dust grains in Ring13 appears to be quite thin, the width in comparison to the sub-lying gas profile speaks for the presence of considerable turbulent diffusion. Following a similar ring analysis as in Dullemond et al. (2018), we find that the ratio between the dimensionless diffusion parameter, , and the dimensionless Stokes number, St, (which parameterizes the dynamical behaviour of a grain) is roughly, . The observed signal is expected to be dominated by grains of size . The RT model, together with the dust-to-gas ratio of 0.05, prescribe a gas density of to the location of Ring13. With these values, the relevant Stokes number is approximated to be St. This yields an estimate for the level of diffusivity of . It further provides a value for the level of turbulent viscosity in Ring13, , assuming the level of turbulence to be equal to the level of diffusion (Youdin & Lithwick, 2007). We note that an observation of molecular line broadening has found no evidence for turbulent contributions, suggesting (Flaherty et al., 2020). The value inferred from our model is just within this limit. By our definition of the gas surface density profile, the value inferred for the level of turbulence is linearly proportional to the local dust-to-gas ratio. Lower values than the chosen ratio of 0.05 would, therefore, lead to an equally lower level of turbulence in the assessment. While the exact value for is not well constrained, a certain level of turbulence is required to explain the radial spread of the resolved Ring13.
The visible asymmetry in the SPHERE observations is reproduced using relatively large grains, 0.4 , as smaller grains did not result in such strong forward scattering. As Stolker, T. et al. (2016) state, the strong forward scattering that is present in the observation may indicate that the dust grains in the disc surface are relatively large, suggesting that the disc is depleted of very small grains. Alternatively, it may suggest that grains are not spherical as assumed in the calculations of opacities using Mie theory.
Another interesting feature of the simulated 1.65 image is that the model accurately shows the shadows described by D’Orazi et al. (2019) that are present in the SPHERE–IRDIS image. In contrast, there are no hints of radio decrements along Ring13 or in Ring24, in either the ALMA observations or in the simulated 1.3 mm continuum image, that would match the shadows. As noted by Casassus et al. (2019b), the diffusion of thermal radiation from the disc smooths out the decrements seen in scattered light, and in this case it is likely that the disc cooling time-scale is much slower than the that of the illumination pattern.
The general observed structure may point to the existence of planet-disc interactions within this system, where giant planets deplete their orbits of gas and dust material. A possible planetary constellation in this scenario is, therefore, the presence of two giant planets in the disc, one planet between the star and Ring13, and one planet between Ring13 and Ring24. As Ruíz-Rodríguez et al. (2019) suggest, the putative planet between Ring13 and Ring24 may be a giant planet with a mass within the range of 0.31.5 . This idea is supported by a dedicated study (Weber et al. submitted) which qualitatively reproduces the observations of this system with a hydrodynamical simulation including several giant planets.
The expected age of >20 Myr of V4046 Sgr suggests that its gas-rich disc is unconventionally old in comparison to typical circumstellar examples (e.g. Fedele et al., 2010; Williams & Cieza, 2011). The dispersal of such gas discs is typically assumed to be set by photo-evaporation (Alexander et al., 2006; Gorti & Hollenbach, 2009). While the dynamical origin of the disc’s longevity is not the subject of the present study, we would like to mention that its occurrence around such a close binary might not be coincidental. Alexander (2012) predicted that disc lifetimes should show a sharp increase around binaries separated by au. It still has to be seen whether a trend towards longer disc lifetimes in compact multiple-star systems (as recently proposed by Ronco et al., 2021) turns out to be prevalent.
5 Conclusions
We present new ALMA 1.3 mm continuum imaging of V4046 Sgr, a well-known circumbinary disc, at an unprecedented definition (00), where new features become visible. Together with the analysis of a SPHERE–IRDIS polarized image and a well-sampled SED, we aim to reproduce the observations with radiative transfer modeling, looking for a way to explain the data in terms of a physically model. The key conclusions of this analysis are as follows.
-
1.
The central emission in the ALMA image suggests the existence of an inner ring of dust grains larger than 0.8 mm. Our interpretation agrees with the mass estimation of this feature made by Francis & van der Marel (2020), with a mass of 0.012 M⊕.
-
2.
Our parametric model, which accounts for the SED of the system, predicts the presence of an inner ring at 5 au, mainly consisting of small dust grains. This additional ring lies under the coronagraph of the scattered light image and is too faint to be detected by the ALMA observation. The depletion of large dust in this ring is consistent with efficient dust trapping at larger radii, as can be expected in Ring13.
-
3.
The narrow ring in the 1.3 mm continuum, has a radius of 13.150.42 au and an estimated width of 2.460.56 au. The location of this ring is coincident with the inner ring observed in the scattered light image. From our RT modeling we can predict that this ring includes around 0.7 M⊕ of millimetre-sized grains. Using the parametric model scale height FWHM value for the large grains ( 0.25 au at 13.15 au) we find that the ring width is roughly 10 times its estimated height.
-
4.
The 1.3 mm outer ring, that starts at 24 au and has its peak intensity at 30 au, presents a visible break in the surface brightness at 36 au.
-
5.
While we can not get an exact value for , the resolved radial width of Ring13 speaks for the presence of a considerable level of turbulent viscosity.
-
6.
We interpret the asymmetry observed with SPHERE–IRDIS at 1.65 as due to strong forward-scattering, which implies that the dust population is depleted of grains smaller than 0.4 .
Acknowledgements
We thank the anonymous referee for their constructive review. R.MB., S.C., S.P., L.C., and A.Z. acknowledge support from FONDECYT grants 1211496, 1191934, 1211656 and 11190837. P.W. acknowledges support from ALMA-ANID postdoctoral fellowship 31180050. M.C. acknowledges support from ANID PFCHA/DOCTORADO BECAS CHILE/2018-72190574. This paper makes use of the following ALMA data: ADS/JAO.ALMA #2017.0.01167.S. ALMA is a partnership of ESO (representing its member states), NSF (USA) and NINS (Japan), together with NRC (Canada), MOST and ASIAA (Taiwan), and KASI (Republic of Korea), in cooperation with the Republic of Chile. The Joint ALMA Observatory is operated by ESO, AUI/NRAO and NAOJ. The National Radio Astronomy Observatory is a facility of the National Science Foundation operated under cooperative agreement by Associated Universities, Inc. This research has made use of the VizieR catalogue access tool, CDS, Strasbourg, France (DOI : 10.26093/cds/vizier). The original description of the VizieR service was published in Ochsenbein et al. (2000). This research has made use of the NASA/IPAC Infrared Science Archive, which is funded by the National Aeronautics and Space Administration and operated by the California Institute of Technology.
Data Availability
The data used in this article are presented in Fig. 1. The final images can be found in FITS format in supplementary materials while the original raw data can be downloaded directly from the ALMA archive using project code 2017.1.01167.S. The SPHERE/IRDIS data can be downloaded from the ESO archive using project code 096.C-0523(A).
References
- Alexander (2012) Alexander R., 2012, ApJ, 757, L29
- Alexander et al. (2006) Alexander R. D., Clarke C. J., Pringle J. E., 2006, MNRAS, 369, 229
- Andrews (2020) Andrews S. M., 2020, ARA&A, 58, 483
- Andrews et al. (2009) Andrews S. M., Wilner D. J., Hughes A. M., Qi C., Dullemond C. P., 2009, The Astrophysical Journal, 700, 1502
- Andrews et al. (2010) Andrews S. M., Wilner D. J., Hughes A. M., Qi C., Dullemond C. P., 2010, The Astrophysical Journal, 723, 1241
- Artymowicz & Lubow (1994) Artymowicz P., Lubow S. H., 1994, ApJ, 421, 651
- Avenhaus et al. (2017) Avenhaus H., et al., 2017, The Astronomical Journal, 154, 33
- Avenhaus et al. (2018) Avenhaus H., et al., 2018, The Astrophysical Journal, 863, 44
- Bergner et al. (2018) Bergner J. B., Guzmán V. G., Öberg K. I., Loomis R. A., Pegues J., 2018, The Astrophysical Journal, 857, 69
- Beuzit et al. (2019) Beuzit J. L., et al., 2019, A&A, 631, A155
- Cárcamo et al. (2018) Cárcamo M., Román P. E., Casassus S., Moral V., Rannou F. R., 2018, Astronomy and Computing, 22, 16
- Casassus et al. (2006) Casassus S., Cabrera G. F., Förster F., Pearson T. J., Readhead A. C. S., Dickinson C., 2006, ApJ, 639, 951
- Casassus et al. (2013) Casassus S., et al., 2013, Nature, 493, 191
- Casassus et al. (2018) Casassus S., et al., 2018, MNRAS, 477, 5104
- Casassus et al. (2019a) Casassus S., et al., 2019a, MNRAS, 483, 3278
- Casassus et al. (2019b) Casassus S., Pérez S., Osses A., Marino S., 2019b, MNRAS, 486, L58
- Casassus et al. (2021) Casassus S., et al., 2021, MNRAS, 507, 3789
- Castelli et al. (1997) Castelli F., Gratton R. G., Kurucz R. L., 1997, A&A, 318, 841
- Cutri & et al. (2012) Cutri R. M., et al. 2012, VizieR Online Data Catalog, p. II/311
- Cutri et al. (2003) Cutri R. M., et al., 2003, VizieR Online Data Catalog, p. II/246
- D’Orazi et al. (2019) D’Orazi V., et al., 2019, Nature Astronomy, 3, 167
- Donati et al. (2011) Donati J.-F., et al., 2011, Monthly Notices of the Royal Astronomical Society, 417, 1747
- Drążkowska et al. (2019) Drążkowska J., Li S., Birnstiel T., Stammler S. M., Li H., 2019, ApJ, 885, 91
- Dubrulle et al. (1995) Dubrulle B., Morfill G., Sterzik M., 1995, Icarus, 114, 237
- Dullemond et al. (2012) Dullemond C. P., Juhasz A., Pohl A., Sereshti F., Shetty R., Peters T., Commercon B., Flock M., 2012, RADMC-3D: A multi-purpose radiative transfer tool (ascl:1202.015)
- Dullemond et al. (2018) Dullemond C. P., et al., 2018, ApJ, 869, L46
- Fedele et al. (2010) Fedele D., van den Ancker M. E., Henning T., Jayawardhana R., Oliveira J. M., 2010, A&A, 510, A72
- Flaherty et al. (2020) Flaherty K., et al., 2020, The Astrophysical Journal, 895, 109
- Francis & van der Marel (2020) Francis L., van der Marel N., 2020, The Astrophysical Journal, 892, 111
- Gaia Collaboration et al. (2021) Gaia Collaboration et al., 2021, A&A, 649, A1
- Garufi et al. (2017) Garufi A., et al., 2017, A&A, 603, A21
- Garufi et al. (2020) Garufi A., et al., 2020, A&A, 633, A82
- Gorti & Hollenbach (2009) Gorti U., Hollenbach D., 2009, ApJ, 690, 1539
- Guzmán et al. (2017) Guzmán V. V., Öberg K. I., Huang J., Loomis R., Qi C., 2017, The Astrophysical Journal, 836, 30
- Helou & Walker (1988) Helou G., Walker D. W., 1988, Infrared astronomical satellite (IRAS) catalogs and atlases. Volume 7, 7
- Høg et al. (2000) Høg E., et al., 2000, A&A, 355, L27
- Huang et al. (2017) Huang J., et al., 2017, The Astrophysical Journal, 835, 231
- Hutchinson et al. (1990) Hutchinson M. G., Evans A., Winkler H., Spencer Jones J., 1990, A&A, 234, 230
- Ishihara et al. (2010) Ishihara D., et al., 2010, A&A, 514, A1
- Jensen & Mathieu (1997) Jensen E. L. N., Mathieu R. D., 1997, AJ, 114, 301
- Kastner et al. (2018) Kastner J. H., et al., 2018, The Astrophysical Journal, 863, 106
- Kharchenko (2001) Kharchenko N. V., 2001, Kinematika i Fizika Nebesnykh Tel, 17, 409
- Kurucz (1979) Kurucz R. L., 1979, ApJS, 40, 1
- Lebouteiller et al. (2015) Lebouteiller V., Barry D. J., Goes C., Sloan G. C., Spoon H. W. W., Weedman D. W., Bernard-Salas J., Houck J. R., 2015, The Astrophysical Journal Supplement Series, 218, 21
- McJunkin et al. (2016) McJunkin M., France K., Schindhelm E., Herczeg G., Schneider P. C., Brown A., 2016, ApJ, 828, 69
- Miret-Roig et al. (2020) Miret-Roig N., et al., 2020, A&A, 642, A179
- Murakami et al. (2007) Murakami H., et al., 2007, PASJ, 59, S369
- Ochsenbein et al. (2000) Ochsenbein F., Bauer P., Marcout J., 2000, A&AS, 143, 23
- Ofek (2008) Ofek E. O., 2008, PASP, 120, 1128
- Pérez et al. (2019) Pérez S., Casassus S., Baruteau C., Dong R., Hales A., Cieza L., 2019, AJ, 158, 15
- Pérez et al. (2020) Pérez S., et al., 2020, ApJ, 889, L24
- Qi et al. (2019) Qi C., et al., 2019, ApJ, 882, 160
- Quast et al. (2000) Quast G. R., Torres C. A. O., de La Reza R., da Silva L., Mayor M., 2000, IAU Symposium, 200, 28
- Rapson et al. (2015) Rapson V. A., Kastner J. H., Andrews S. M., Hines D. C., Macintosh B., Millar-Blanchaer M., Tamura M., 2015, The Astrophysical Journal, 803, L10
- Rice et al. (2006) Rice W. K. M., Armitage P. J., Wood K., Lodato G., 2006, MNRAS, 373, 1619
- Rodriguez et al. (2010) Rodriguez D. R., Kastner J. H., Wilner D., Qi C., 2010, The Astrophysical Journal, 720, 1684
- Ronco et al. (2021) Ronco M. P., Guilera O. M., Cuadra J., Miller Bertolami M. M., Cuello N., Fontecilla C., Poblete P., Bayo A., 2021, ApJ, 916, 113
- Rosenfeld et al. (2012) Rosenfeld K. A., Andrews S. M., Wilner D. J., Stempels H. C., 2012, The Astrophysical Journal, 759, 119
- Rosenfeld et al. (2013) Rosenfeld K. A., Andrews S. M., Wilner D. J., Kastner J. H., McClure M. K., 2013, The Astrophysical Journal, 775, 136
- Ruíz-Rodríguez et al. (2019) Ruíz-Rodríguez D., Kastner J. H., Dong R., Principe D. A., Andrews S. M., Wilner D. J., 2019, The Astronomical Journal, 157, 237
- Stolker, T. et al. (2016) Stolker, T. Dominik, C. Min, M. Garufi, A. Mulders, G. D. Avenhaus, H. 2016, A&A, 596, A70
- Weber et al. (2018) Weber P., Benítez-Llambay P., Gressel O., Krapp L., Pessah M. E., 2018, ApJ, 854, 153
- Williams & Cieza (2011) Williams J. P., Cieza L. A., 2011, ARA&A, 49, 67
- Youdin & Lithwick (2007) Youdin A. N., Lithwick Y., 2007, Icarus, 192, 588
- Zhu et al. (2012) Zhu Z., Nelson R. P., Dong R., Espaillat C., Hartmann L., 2012, ApJ, 755, 6
- Zuckerman & Song (2004) Zuckerman B., Song I., 2004, Annual Review of Astronomy and Astrophysics, 42, 685
- van Holstein et al. (2020) van Holstein R. G., et al., 2020, A&A, 633, A64
Appendix A Parameter–space exploitation
A.1 Parameter space partial exploration
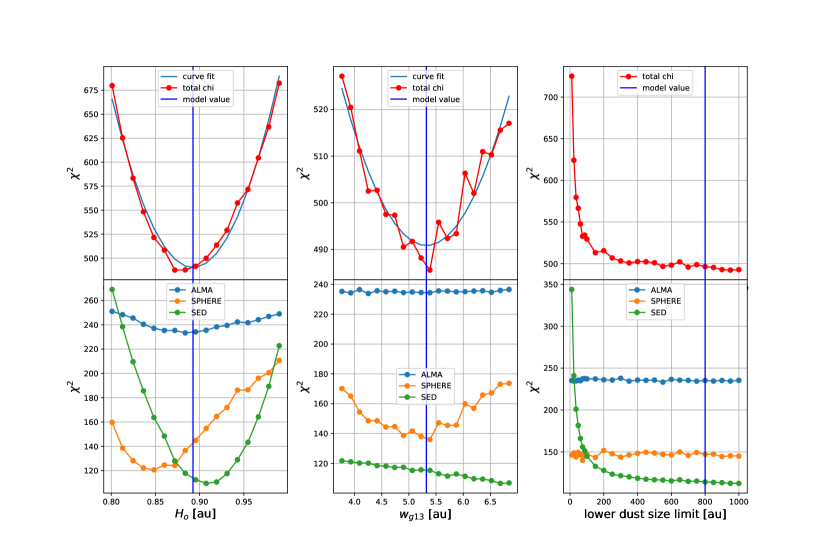
As a way to compute a measure of goodness of fit and to try to quantify the model uncertainties, we performed a partial exploration of the parameter space.
We explore space in the vicinity of the model values (obtained by trial and error, see Sec. 3) for the scale height at (), the width of the gas component of Ring13 , and around the lower limit of the grain sizes in the central blob. The parameter space exploration is shown in Fig. 6. Our model fits the SED and two images, so the total value for a given model is composed of the sum of the values for each of the three fits.
| (17) |
For and , we find that the values of the parameters in our model are at a minimum in each one dimensional space, the uncertainties (up and down) will be those that correspond to , where is the local minimum value. We approximated the vicinity of the local minimum in these 1D cuts with a quadratic fit.
For the lower grain size limit, we found that despite that our chosen value seems to minimise , the shape that follows the curve is more suggestive of a border condition. So there is a threshold around 300 where the SED starts to deviate strongly from the typical value. That point represents where the NIR excess becomes significantly larger that the observed.
A.2 Comparison between different models
A compact inner hole in the dust distribution around a binary can typically be produced by sublimation of solids or dynamical clearing of the central stars. The sublimation radius of the system is expected to be at 0.05 au ( au, Francis & van der Marel, 2020), and the edge of the zone cleared by dynamical interactions between the near-circular binary and the circumbinary disc is estimated to be at 0.085 au (, Artymowicz & Lubow, 1994). On the other hand, for V4046 Sgr, Jensen & Mathieu (1997) required to implement a cavity to 0.2 au to fit the SED flux around the silicate feature at 10 . We find that the latter value significantly improves the SED fit when compared to a disc extending to the inner radius predicted by dynamical clearing in the SED fit (see Fig. 7), therefore, the inner radius of the disc in our best-fitting model lies at 0.2 au.
The final structure of our proposed disc also includes additional features that are necessary to fit both the SED and the images. These features are a cut-off of the inner density accumulation of large dust grains outside of 1.1 au (to fit the central emission in the ALMA image), and the thin Gaussian ring made mainly of small dust grains at 5.2 au (Ring5, demanded by mid-infrared excess in the SED). The first one is visible in the ALMA image so we are forced to include it, but Ring5 is not detected in the ALMA continuum and was included because of its contribution to the 10 flux is required by the SED. Fig. 7 works as a summary as it shows a comparison between our best-fitting model and five models with changes on their structures: one without Ring5, one without the inner large-dust disc, one without both of those structures, another with an inner edge of the disc at 0.085 au, and a last one with an inner edge of the disc at 0.05 au. All these models diverge from the SED data somewhere in the 6-300 range.