The Type Icn SN 2021csp:
Implications for the Origins of the Fastest Supernovae and the Fates of Wolf-Rayet Stars
Abstract
We present observations of SN 2021csp, the second example of a newly-identified type of supernova (Type Icn) hallmarked by strong, narrow, P Cygni carbon features at early times. The SN appears as a fast and luminous blue transient at early times, reaching a peak absolute magnitude of within 3 days due to strong interaction between fast SN ejecta ( km s-1) and a massive, dense, fast-moving C/O wind shed by the WC-like progenitor months before explosion. The narrow line features disappear from the spectrum 10–20 days after explosion and are replaced by a blue continuum dominated by broad Fe features, reminiscent of Type Ibn and IIn supernovae and indicative of weaker interaction with more extended H/He-poor material. The transient then abruptly fades days post-explosion when interaction ceases. Deep limits at later phases suggest minimal heavy-element nucleosynthesis, a low ejecta mass, or both, and imply an origin distinct from that of classical Type Ic supernovae. We place SN 2021csp in context with other fast-evolving interacting transients, and discuss various progenitor scenarios: an ultrastripped progenitor star, a pulsational pair-instability eruption, or a jet-driven fallback supernova from a Wolf-Rayet star. The fallback scenario would naturally explain the similarity between these events and radio-loud fast transients, and suggests a picture in which most stars massive enough to undergo a WR phase collapse directly to black holes at the end of their lives.
1 Introduction
Progenitor detections, hydrodynamic models, and basic rate calculations all suggest that most single stars born with initial masses of 8–20 explode as red supergiants and produce Type IIP supernovae (SNe; Smartt, 2009), but the fates of more-massive stars ( 25 ) remain an open question. Such stars lose a significant fraction of their hydrogen (H) envelopes on the main sequence via line-driven winds even as single stars (e.g., Vink et al., 2001), and they are also more likely to undergo strong binary interaction (Sana et al., 2012). In either case, a predicted consequence is that many such stars will be deficient in H by the time of core collapse. Prior to explosion, these stars will appear as Wolf-Rayet (WR) stars; the explosion itself will then manifest as a supernova (SN) of spectroscopic Type IIb, Ib, or Ic (a stripped-envelope SN; for reviews, see Filippenko 1997 and Gal-Yam 2017).
This straightforward picture faces a number of challenges, however. First, hydrodynamic models suggest that the masses ejected by typical SNe Ib/c are only a few , much lower than predicted for exploding WR stars (e.g., Dessart et al., 2012). Second, no WR star has yet been identified at the site of a SN in pre-explosion imaging: the handful of reported SN Ib/c progenitor candidates are too optically luminous to be WR stars (Cao et al., 2013; Eldridge & Maund, 2016; Van Dyk et al., 2018; Kilpatrick et al., 2018, 2021), and upper limits on the remainder are in marginal tension with the luminosity distribution of the Galactic WR population (Eldridge et al. 2013, although cf. Maund 2018 and Sander et al. 2019). Third, SNe Ib/c are too abundant (by a factor of ) to originate solely from the WR population (Smith et al., 2011).
For these reasons, binary evolution involving pairs of lower-mass stars undergoing a common-envelope phase has increasingly been seen as the most likely pathway for explaining most of the SN Ib/c population. If so, the final outcome of stellar evolution for more-massive stars () remains unclear. One possibility is that very massive stars do not explode at all, and instead collapse directly to black holes with minimal emission of electromagnetic radiation (O’Connor & Ott, 2011; Sukhbold & Woosley, 2014; Smartt, 2015; Zapartas et al., 2021). This remains controversial. Some very massive stars probably explode while still in possession of their H envelope to produce SNe IIn (Gal-Yam et al., 2007; Gal-Yam & Leonard, 2009; Smith et al., 2011; Mauerhan et al., 2013; Smith et al., 2014), although this does not resolve the question of the fates of those massive stars that do undergo a WR phase. Some atypical SNe Ib/c do appear to be consistent with massive WR progenitors: specifically, about 25% of broad-lined SNe Ic (Ic-BL) show ejecta masses consistent with explosions of very massive stars (Taddia et al., 2019), and the progenitors of superluminous SNe are also likely to be quite massive (Gal-Yam et al., 2009; Nicholl et al., 2015; Jerkstrand et al., 2017; Blanchard et al., 2020).
Another rare stripped-envelope SN subtype that has been suggested to be related to very massive stars is the class of Type Ibn SNe. The velocities inferred from the widths of the hallmark narrow helium (He) lines of these systems — attributed to dense circumstellar matter (CSM) surrounding the progenitor star — are comparable to those seen in Local Group WR stars, suggesting that WR stars may indeed be their progenitors (Foley et al., 2007; Pastorello et al., 2008). However, the pre-explosion mass-loss rates inferred from observations of SNe Ibn are much higher than those seen in normal WR winds, implying that any WR progenitor must enter a short evolutionary phase of greatly enhanced mass loss prior to the explosion.
The list of stripped-envelope SN subtypes continues to expand. Gal-Yam et al. (2021b) recently presented a detailed observational study of SN 2019hgp, a fast and luminous transient with no known literature precedent. Early-time spectra of this event are dominated by narrow lines with profiles similar to those seen in SNe Ibn but originating from carbon (C), oxygen (O), and other alpha elements rather than He, defining a new class of “Type Icn” SNe that previously was only theoretical (Smith, 2017a; Woosley, 2017). In their analysis of this object, Gal-Yam et al. (2021b) point out that the distinction between SNe Ibn and SNe Icn closely mirrors that of the WR spectroscopic subtypes (He/N-rich WN versus He-poor, C-rich WC stars). On this basis, they postulate that SNe Ibn/Icn represent the true outcomes of the explosions of WR stars.
Gal-Yam et al. (2021b) also note that the properties of SN 2019hgp (fast-rising, hot, and luminous) show some resemblance to the population of rare, fast-evolving transients identified in photometric surveys (Drout et al. 2014; Arcavi et al. 2016; Tanaka et al. 2016; Pursiainen et al. 2018; Inserra 2019; Ho et al. 2021a), sometimes referred to as fast blue optical transients (FBOTs) or rapidly evolving transients (RETs), indicating a possible link with this previously poorly-explored group of objects. However, SN 2019hgp would not itself have been classified as an FBOT/RET by the criteria typically employed in earlier works.
In this paper, we present observations of the second SN Icn to be discovered, SN 2021csp. The properties of this object are qualitatively similar to those of SN 2019hgp but even more extreme. SN 2021csp is faster and more luminous, and a far more extensive observational campaign was possible. These observations strengthen the basic model presented by Gal-Yam et al. (2021b) but also allow us to further extend it, with important implications for the fates of very massive stars of all types. Indeed, we argue that the distinction between SNe Ibn/Icn and “normal” SNe Ib/Ic may involve not only the mass and evolutionary history of the progenitor, but also the nature of the underlying explosion and the type of compact remnant that is left behind.
The paper is organized as follows. Section 2 presents the discovery of SN 2021csp and our extensive observational campaign. We perform a more detailed analysis of the light curve, spectra, and host galaxy in §3 to infer some basic properties of the explosion and pre-explosion system. In §4 we discuss the results of the analysis in the context of the physical nature of the progenitor, its evolutionary state prior to explosion, and the nature of the explosion itself. Section 5 discusses the implications of these results for progenitor models, and §6 summarizes our conclusions. We use a standard cosmological model with H km s-1 Mpc-1, , and , corresponding to a distance modulus of mag at the redshift of SN 2021csp (; §2.3.1). UT dates are used throughout, and times of observations are referenced to an estimated explosion date of MJD 59254.5 (§3.1.1) and expressed in the rest frame. Apparent magnitudes are reported in the text in the AB system (Oke & Gunn, 1983) without an extinction correction, but for analysis and in our figures we correct for Galactic extinction assuming a reddening of mag (Schlafly & Finkbeiner, 2011).
2 Observations
2.1 Palomar 48-inch Discovery and Photometry
The Zwicky Transient Facility (ZTF; Bellm et al. 2019a; Graham et al. 2019) is a combined public and private time-domain optical sky survey, using a 47 deg2 field-of-view camera (Dekany et al., 2020) on the refurbished Samuel Oschin 48-inch Schmidt telescope (P48) at Palomar Observatory. The ZTF observing and alert system are described in previous works (Masci et al., 2019; Patterson et al., 2019; Mahabal et al., 2019; Duev et al., 2019).
SN 2021csp (internally designated ZTF21aakilyd) was first detected in an -band image obtained on 2021-02-11 (MJD 59256.4766) as part of the ZTF high-cadence survey (Bellm et al., 2019b) and confirmed with a second observation in the band the same night. The last nondetection was two days prior. It was identified as a candidate of interest the following morning during daily scanning of our custom alert filter (Ho et al., 2020a; Perley et al., 2021b), owing to the fast rise ( mag in two days), blue colors ( mag), and coincidence with an extended object (the host galaxy), motivating a substantial follow-up campaign (§2.2–2.4).
We used the IPAC forced-photometry pipeline (Masci et al., 2019) to obtain final P48 photometry and pre-explosion upper limits, reported in Table 1. A long sequence of ultra-high-cadence imaging from 2021-02-18 (100 consecutive 30 s exposures, followed by another 26 consecutive 30 s exposures) has been averaged together into two measurements.
| Telescope | MJD | Filter | AB Mag | unc. |
|---|---|---|---|---|
| (days) | ||||
| P48 | 59250.4258 | r | 21.09 | |
| P48 | 59250.4648 | g | 21.27 | |
| P48 | 59252.4141 | i | 20.72 | |
| P48 | 59252.5195 | r | 21.75 | |
| P48 | 59254.4219 | r | 20.79 | |
| P48 | 59254.5273 | g | 21.50 | |
| P48 | 59256.4766 | i | 19.05 | 0.06 |
| P48 | 59256.5078 | g | 18.11 | 0.03 |
| LT | 59257.1992 | g | 17.92 | 0.03 |
| LT | 59257.1992 | r | 18.25 | 0.03 |
| LT | 59257.2031 | u | 17.53 | 0.03 |
| LT | 59257.2031 | i | 18.59 | 0.03 |
| LT | 59257.2031 | z | 18.84 | 0.03 |
| UVOT | 59257.9570 | UVW1 | 17.43 | 0.06 |
| UVOT | 59257.9688 | UVW2 | 17.36 | 0.07 |
| UVOT | 59257.9766 | UVM2 | 17.27 | 0.05 |
| LT | 59258.1367 | g | 17.82 | 0.03 |
| LT | 59258.1406 | i | 18.43 | 0.03 |
| LT | 59258.1406 | u | 17.52 | 0.03 |
| LT | 59258.1406 | r | 18.09 | 0.03 |
| LT | 59258.1445 | z | 18.62 | 0.05 |
Note. — Magnitudes are not corrected for Galactic extinction. Only the first few entries are provided here: a complete machine-readable table is available online.
We also conducted a more extensive search of the pre-explosion P48 data (extending back to the start of the ZTF survey in 2018, 3 yr prior to the explosion time) to search for precursor outbursts, following the procedure described by Strotjohann et al. (2021). No significant detections prior to the explosion date were found, to typical (median) limits of mag ( absolute magnitude) in 1 day bins or to mag ( absolute magnitude) in bins up to 90 days in width. Previously-observed outbursts prior to interacting SNe Ibn and SNe IIn have ranged in luminosity between and mag (Strotjohann et al., 2021), with only five previously-reported cases of outbursts more luminous than mag among 143 SNe of these types searched using this procedure. These limits therefore rule out only the most luminous potential outbursts.
2.2 Imaging
2.2.1 Liverpool Telescope
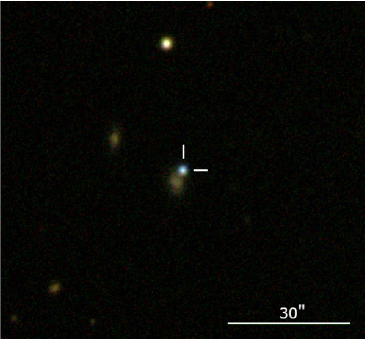
We obtained imaging using the Infrared/Optical Imager (IO:O) on the 2 m robotic Liverpool Telescope (LT; Steele et al. 2004) starting from the first night following the discovery and continuing until the object faded below detection (55 days later). Data were processed by the IO:O automatic pipeline and obtained in reduced form from the LT archive. We subtracted reference imaging from Pan-STARRS ( bands) or from the Sloan Digital Sky Survey (SDSS; band) using a custom IDL subtraction pipeline, and performed seeing-matched aperture photometry. A color image of the field is shown in Figure 1.
2.2.2 Palomar 60-inch Telescope
2.2.3 Swift Ultraviolet/Optical Telescope
We observed the field of SN 2021csp with the Ultraviolet/Optical Telescope (UVOT; Roming et al. 2005) on board the Neil Gehrels Swift Observatory (Gehrels et al., 2004) beginning 2021-02-12 and continuing until the flux from the transient faded below detectability a month later. An additional set of observations between 2021-03-31 and 2021-04-21 were acquired to constrain the host-galaxy flux. The brightness in the UVOT filters was measured with UVOT-specific tools in the HEAsoft111https://heasarc.gsfc.nasa.gov/docs/software/heasoft/ version 6.26.1 (Blackburn, 1995). Source counts were extracted from the images using a circular aperture of radius . The background was estimated over a significantly larger area close to the SN position. The count rates were obtained from the images using the Swift tool uvotsource. They were converted to AB magnitudes using the UVOT photometric zero points of Breeveld et al. (2011) and the UVOT calibration files from September 2020. To remove the host emission from the transient light curves, we used templates formed from our final observations in April and from archival UVOT observations of the field from 2012. We measured the host contribution using the same source and background apertures, and subtracted this contribution from the transient flux measurements.
2.2.4 Nordic Optical Telescope
We obtained five epochs of imaging with the Alhambra Faint Object Spectrograph and Camera (ALFOSC) on the 2.56 m Nordic Optical Telescope (NOT). Observations were obtained on 2021-04-03, 2021-04-18, 2021-04-20, 2021-05-07, and 2021-07-01. For the first two epochs, observations were obtained; for the last three epochs only deep -band observations were acquired. All observations were taken under clear skies and subarcsecond seeing except the data from 2021-04-18 which were affected by thin clouds and relatively poor seeing (). Data were reduced with the Python package PyNOT222https://github.com/jkrogager/PyNOT (v0.9.7).
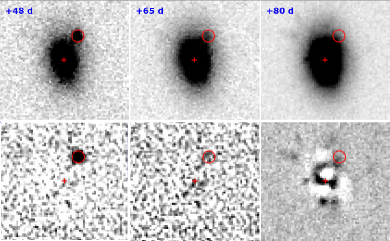
For the three sets of observations taken in April, we employ Pan-STARRS templates for subtraction using the same methods used for the LT photometry. By the time of the observation in May, the transient had faded to a very faint level and this method was no longer sufficient. While a secure limit of mag can be obtained from the Pan-STARRS subtraction, this is limited entirely by the depth of the reference (the true 3 limiting magnitude of this image, measured away from the galaxy, is mag). Instead, we employ the software utility GALFIT (Peng et al., 2002, 2010) to model the disk of the galaxy as a Sérsic profile (convolved with the point-spread function) and remove it from our images. The model provides only incomplete removal of the inner galaxy light, and the inner spiral pattern and H II regions are visible as residuals in the subtracted image. However, the immediate vicinity around the location of the transient does not show any major residuals (Fig. 2), including any evidence of light from the transient. Forced photometry at the transient location gives mag, although the flux is probably dominated by light from an unsubtracted H II region centered just outside the aperture. As a conservative upper limit, we report mag in our photometry table (corresponding to 5 above the forced-photometry value in flux units).
The observation from July is not as deep as the one obtained in May, and so is not individually constraining. To confirm the accuracy of our GALFIT subtraction, we carried out image subtraction between the May and July observations and obtained an upper limit (difference magnitude) of mag (3). However, since we cannot rule out the possibility that a small amount of flux is present in the July observation, we will generally use the more conservative GALFIT-based approach.
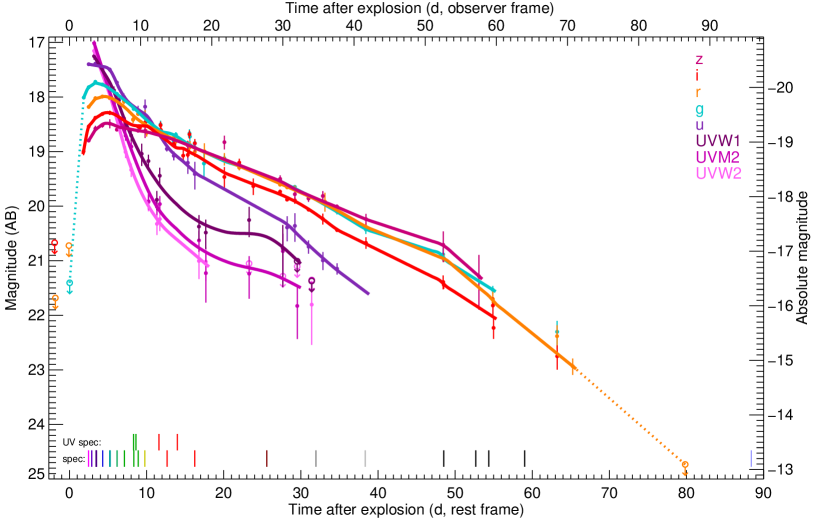
A light curve showing the P48, LT, P60, NOT, and UVOT photometry of SN 2021csp is shown in Figure 3.
2.3 Spectroscopy
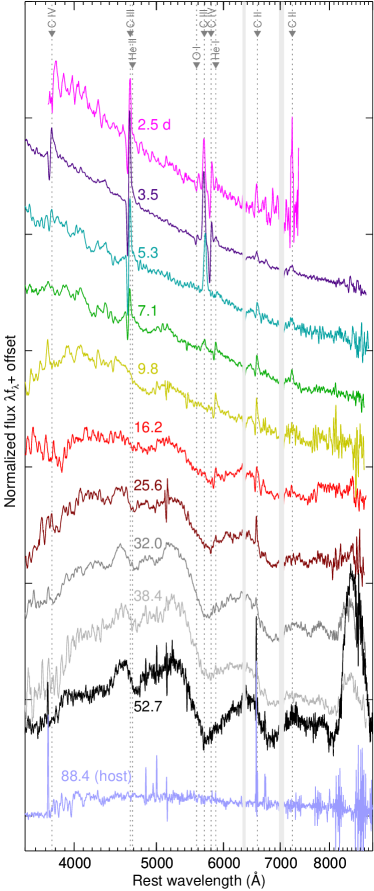
We obtained an extensive series of optical spectra beginning prior to the peak of the SN and extending until 80 days post-explosion in the rest frame. A log of all spectroscopic observations, 25 epochs in total, is provided in Table 2 and the spectra will be uploaded to WISEREP333https://www.wiserep.org (Yaron & Gal-Yam, 2012). Details of the observations are provided below. In addition, we use our - and -band light curves to perform an absolute calibration and color-correction on each spectrum. We calculate synthetic magnitudes of each (flux-calibrated, pre-corrected) spectrum in both filters and apply a rescaling (to match the absolute fluxes) followed by a power-law correction (to match the colors). At late times ( days) we apply only the absolute scaling with no color correction. A time series including many of the spectral observations is displayed in Figure 4.
| Observation date | MJD | Phase | Facility | Exp. time | Grism/Grating | Slit width | Range |
|---|---|---|---|---|---|---|---|
| (UTC) | (days) | (days) | (s) | (arcsec) | (Å) | ||
| 2021 Feb 12 04:23:54 | 59257.183 | 2.475 | LT/SPRAT | Blue | 1.8 | 4020–7994 | |
| 2021 Feb 12 15:07:38 | 59257.630 | 2.888 | Gemini/GMOS | B600 | 1.0 | 3641–6878 | |
| 2021 Feb 13 05:36:01 | 59258.233 | 3.444 | LT/SPRAT | Blue | 1.8 | 4000–8000 | |
| 2021 Feb 13 06:18:33 | 59258.263 | 3.471 | NOT/ALFOSC | 1800 | Grism#4 | 1.0 | 3852–9681 |
| 2021 Feb 13 07:18:40 | 59258.305 | 3.510 | VLT/FORS2 | 300V | 1.0 | 4400–9200 | |
| 2021 Feb 14 03:54:36 | 59259.163 | 4.302 | LT/SPRAT | Blue | 1.8 | 4000–8000 | |
| 2021 Feb 15 03:30:05 | 59260.146 | 5.208 | LT/SPRAT | Blue | 1.8 | 4000–8000 | |
| 2021 Feb 15 05:17:55 | 59260.221 | 5.277 | NOT/ALFOSC | Grism#4 | 1.3 | 3501–9635 | |
| 2021 Feb 16 04:40:52 | 59261.195 | 6.176 | LT/SPRAT | Blue | 1.8 | 4000–8000 | |
| 2021 Feb 17 05:24:30 | 59262.225 | 7.127 | NOT/ALFOSC | Grism#4 | 1.3 | 3504–9635 | |
| 2021 Feb 18 12:09:43 | 59263.507 | 8.309 | HST/STIS | 2100 | G230L | 0.2 | 1570–3180 |
| 2021 Feb 18 13:12:00 | 59263.550 | 8.349 | Lick/Kast | 600/4310 | 2.0 | 3632–10340 | |
| 300/7500 | |||||||
| 2021 Feb 18 20:05:29 | 59263.837 | 8.614 | HST/COS | 4243 | G140L | 3.0 | 1230–2050 |
| 2021 Feb 19 03:57:39 | 59264.165 | 8.916 | LT/SPRAT | Blue | 1.8 | 4000–8000 | |
| 2021 Feb 20 02:16:36 | 59265.095 | 9.774 | NOT/ALFOSC | Grism#4 | 1.3 | 3501–9631 | |
| 2021 Feb 22 01:58:28 | 59267.082 | 11.607 | HST/STIS | 2030 | G230L | 0.2 | 1570–3180 |
| 2021 Feb 23 05:15:11 | 59268.219 | 12.656 | LT/SPRAT | Blue | 1.8 | 4000–8000 | |
| 2021 Feb 24 15:58:17 | 59269.665 | 13.990 | HST/COS | 4003 | G140L | 3.0 | 1230–2050 |
| 2021 Feb 27 02:19:35 | 59272.097 | 16.233 | NOT/ALFOSC | Grism#4 | 1.0 | 3753–9683 | |
| 2021 Mar 09 05:19:36 | 59282.222 | 25.574 | NOT/ALFOSC | Grism#4 | 1.3 | 3752–9620 | |
| 2021 Mar 16 03:18:45 | 59289.138 | 31.954 | NOT/ALFOSC | Grism#4 | 1.0 | 3701–9683 | |
| 2021 Mar 23 01:48:34 | 59296.075 | 38.354 | NOT/ALFOSC | Grism#4 | 1.0 | 4001–9685 | |
| 2021 Apr 03 02:42:56 | 59307.113 | 48.536 | NOT/ALFOSC | Grism#4 | 1.0 | 4003–9677 | |
| 2021 Apr 07 14:32:41 | 59311.606 | 52.681 | Keck/LRIS | 850+750 | B600/4000 | 1.0 | 3134–10284 |
| 750+670 | R400/8500 | ||||||
| 2021 Apr 09 10:28:48 | 59313.437 | 54.370 | Palomar/DBSP | B600 | 1.5 | 3400–10000 | |
| R316 | |||||||
| 2021 Apr 14 11:32:20 | 59318.481 | 59.023 | Keck/LRIS | B400/3400 | 1.0 | 3000–10306 | |
| R400/8500 | |||||||
| 2021 May 10 10:56:35 | 59344.456 | 82.985 | Keck/LRIS | B400/3400 | 1.0 | 3000–10306 | |
| R400/8500 | |||||||
| 2021 May 16 07:52:14 | 59350.328 | 88.402 | Keck/LRIS | B400/3400 | 1.0 | 3000–10306 | |
| R400/8500 |
Note. — The phase is calculated with respect to MJD 59254.5 (the estimated explosion date) and is given in the rest frame.
2.3.1 Liverpool Telescope
We obtained seven sets of spectra (each 2600 s) spanning the first two weeks after explosion using the Spectrograph for the Rapid Acquisition of Transients (SPRAT; Piascik et al. 2014). We use the default reduction and extraction provided by the SPRAT pipeline (Barnsley et al., 2012). The first LT spectrum immediately established the redshift and unusual nature of this transient on the basis of the detection of several strong C features at a common redshift of (Perley et al., 2021a). The only known previous event sharing these features is SN 2019hgp (Gal-Yam et al., 2021b), although a third event (SN 2021ckj, also discovered using ZTF data) was reported a few days later (Pastorello et al., 2021). The strong similarities between these events (and their H/He-free narrow-line spectra at maximum light) motivated us to propose these three events as the prototypical members of the new class of Type Icn SNe (Gal-Yam et al., 2021a).
2.3.2 Gemini-North
One spectrum was obtained on 2021-02-12 with the Gemini Multi-Object Spectrograph (GMOS; Hook et al. 2004) mounted on the Gemini North 8 m telescope at the Gemini Observatory on Maunakea, Hawaii. Two 900 s exposures were obtained with the B600 grating. The GMOS data were reduced using PypeIt (Prochaska et al., 2020).
2.3.3 Nordic Optical Telescope
We obtained nine separate epochs of spectroscopy with the ALFOSC on the NOT spanning from 2021-02-13 until 2021-04-03 (Table 2). Observations were taken using Grism #4, providing wavelength coverage over most of the optical spectral range (typically 3700–9600 Å). The slit was aligned with the parallactic angle (Filippenko, 1982), except in the last three observations when it also included the host, and an atmospheric dispersion corrector was used. Reduction and calibration were performed using PypeIt.
2.3.4 Very Large Telescope
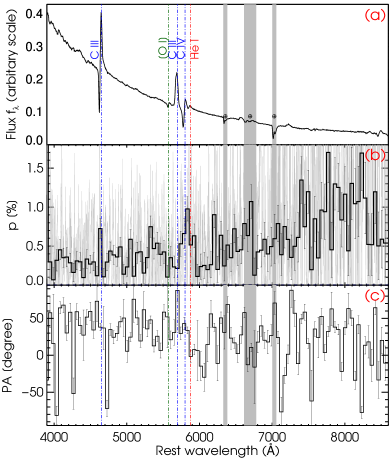
Spectropolarimetry of SN 2021csp was conducted with the FOcal Reducer and low dispersion Spectrograph (FORS2; Appenzeller & Rupprecht 1992) on Unit Telescope 1 (UT1, Antu) of the ESO Very Large Telescope (VLT). The observations were carried out in the Polarimetric Multi-Object Spectroscopy (PMOS) mode on 2021-02-13. Two sets of data were obtained, each consisting of four 750 s exposures with the retarder oriented at angles of 0, 22.5, 45 and 67.5 degrees. The 300V grism and the wide slit were used, yielding a spectral resolving power of at the central wavelength of 5849 Å. The GG435 order-separation filter was used to minimize second-order contamination at redder wavelengths. This configuration provided a wavelength coverage of about 4400–9200 Å in the observer frame. The total Stokes spectrum was flux calibrated based on the observation of a spectrophotometric standard star with the polarimetric optics in place, and the retarder plate set to .
The data were bias subtracted and flat-field corrected. For each individual exposure, the ordinary (o) and extraordinary (e) beams were extracted and wavelength-calibrated separately following standard procedures within IRAF (Tody, 1986). After removing the instrumental polarization of FORS2 (Cikota et al., 2017), we derived the Stokes parameters, the bias-corrected polarization, and the associated uncertainties using our own routines, following the procedures of Patat & Romaniello (2006), Maund et al. (2007), Simmons & Stewart (1985), and Wang et al. (1997). A detailed description of the reduction of FORS spectropolarimetry is given by Yang et al. (2020, their Appendix A).
The Stokes parameters computed for each set of four exposures are consistent with each other. We further combined the two beams for o-ray and e-ray at each retarder angle and derived the Stokes parameters. The intensity-normalized Stokes parameters (, , ) are in 50 Å wide bins ( pixels) to further increase the signal-to-noise ratio (S/N). The results are presented in Figure 5.
2.3.5 Lick 3 m Telescope
A single optical spectrum of SN 2021csp was obtained with the Kast double spectrograph (Miller & Stone, 1993) mounted on the 3 m Shane telescope at Lick Observatory. The spectrum was taken at or near the parallactic angle (Filippenko, 1982) to minimize slit losses caused by atmospheric dispersion. Data were reduced following standard techniques for CCD processing and spectrum extraction (Silverman et al., 2012) utilizing IRAF routines and custom Python and IDL codes444https://github.com/ishivvers/TheKastShiv. Low-order polynomial fits to arc-lamp spectra were used to calibrate the wavelength scale, and small adjustments derived from night-sky lines in the target frames were applied. Observations of appropriate spectrophotometric standard stars were used to flux calibrate the spectra.
2.3.6 Hubble Space Telescope
We obtained two sets of observations of SN 2021csp with the Hubble Space Telescope (HST), using both the Cosmic Origins Spectrograph (COS; Green et al. 2012) and the Space Telescope Imaging Spectrograph (STIS; Woodgate et al. 1998)555program ID GO#16212 (PI Perley). The COS observations employed the G140L grating and the STIS observations used the G230L grating. The first set of observations was taken at 8.31 and 8.61 rest-frame days after our assumed explosion time (for STIS and COS, respectively); the second set was taken at 11.61 days (STIS) and 13.99 days (COS).
We use the pipeline reductions from the HST archive. The first STIS spectrum has S/N about a factor of 10 lower than expected, likely due to a guiding problem. This problem is not seen in the second STIS exposure or with COS. The UV spectra are shown alongside optical spectra obtained at similar times in Figure 6.
2.3.7 Palomar 200-inch Telescope
One spectrum of SN 2021csp was acquired with the Double Beam Spectrograph (DBSP; Oke & Gunn 1982) on the 5 m Hale telescope at Palomar Observatory (P200). Observations were taken on 2021-04-09, using the 600/4000 grating on the blue side and the 316/7150 grating on the red side. Data were reduced using the DBSP-DRP fully-automated pipeline666https://github.com/finagle29/dbsp_drp.
2.3.8 Keck Observatory
Spectra of SN 2021csp were acquired on four separate occasions with the Low Resolution Imaging Spectrometer (LRIS; Oke et al. 1995) on the Keck I 10 m telescope. The first observation was obtained on 2021-04-07 using the B600/4000 blue-side grism and the R400/8500 red-side grating; the remaining three observations (on 2021-04-14, 2021-05-10, and 2021-05-16) were taken with the B400/3400 grism and the R400/8500 grating. Weather conditions were generally good except for the observation on 2021-05-10, which was taken under clear skies but very poor seeing (2–3). Because of the different readout times, the exposure durations on LRIS vary between the red and blue sides; in Table 2 we represent the individual exposures with average exposure time (over all exposures on both sides) for simplicity.
All spectra were reduced with LPipe (Perley, 2019). The two LRIS spectra in May do not show any discernible trace from the SN in the two-dimensional (2D) frames. For the spectrum taken on 2021-05-16, we determine the position of the SN along the slit via its offset from the host nucleus (this slit was oriented across the nucleus at a PA of ) and extract the flux at this location. We also separately extract the flux of the entire host galaxy along the slit for spectroscopic analysis of the host. (For the observation on 2021-05-10, the seeing is too poor to attempt separate site and host extractions, so we simply extract the host, but we do not use this spectrum in our subsequent analysis.)
2.4 Multiwavelength
2.4.1 Swift/XRT
We observed the field with Swift’s onboard X-ray Telescope (XRT; Burrows et al. 2005) in photon-counting mode, simultaneously with each set of UVOT observations (§ 2.2.3). There is no detection of the SN in any of these observations. Using the online tool777 http://www.swift.ac.uk/user_objects/ provided by the UK Swift team (Evans et al., 2007, 2009), we infer a median upper limit of per epoch at confidence. Stacking all data decreases the upper limit to . Assuming a Galactic neutral hydrogen column density of (HI4PI Collaboration et al., 2016) and a power-law spectrum with a photon index of 2, the count rates correspond to an unabsorbed flux limit of (for the median visit) and (for the stacked observation) in the bandpass 0.3–10 keV. At the distance of SN 2021csp, this corresponds to luminosity and at 0.3–10 keV, respectively.
2.4.2 Very Large Array
We obtained three epochs of Very Large Array (VLA) observations of SN 2021csp: one each on 2021-02-17, 2021-03-10, and 2021-07-10888Program IDs 20B-205 and 21A-308; PI Ho using the X-band receiver. The correlator was set up in 3-bit mode with frequency coverage from 8 GHz to 12 GHz. In each observation the phase calibrator was J1430+1043 and the flux calibrator was 3C286. Data were calibrated using the automated pipeline available in the Common Astronomy Software Applications (CASA; McMullin et al. 2007) and additional flagging was performed manually. Data were imaged using the clean algorithm (Högbom, 1974) with a cell size 1/10 of the synthesized beamwidth, and a field size of the smallest magic number () larger than the number of cells needed to cover the primary beam. The three observations all resulted in no detection of the counterpart, with root-mean-square (RMS) values of 5 Jy, 5 Jy, and 7 Jy for the February, March, and July observations (respectively). The equivalent 3 limits on the source luminosity () are erg s-1 Hz-1 at 7 and at 26 rest-frame days post-explosion, and erg s-1 Hz-1 at 104 rest-frame days post-explosion.
2.4.3 High-Energy Counterpart Search
We searched the Fermi Gamma-ray Burst Monitor (GBM) Burst Catalog (Narayana Bhat et al., 2016)999https://heasarc.gsfc.nasa.gov/W3Browse/fermi/fermigbrst.html, the Fermi-GBM Subthreshold Trigger list101010https://gcn.gsfc.nasa.gov/fermigbm_subthresharchive.html, the Swift Gamma-Ray Burst (GRB) Archive111111https://swift.gsfc.nasa.gov/archive/grb_table/, the Interplanetary Network master list121212http://ipn3.ssl.berkeley.edu/masterli.txt, and the Gamma-Ray Coordinates Network archives131313https://gcn.gsfc.nasa.gov/gcn_archive.html for a GRB between the last ZTF nondetection and the first ZTF detection. The closest event was one Fermi burst (GRB 210210B) away, but the association is unlikely given the size of the localization region. There was one IceCube event in the relevant time interval, but owing to the separation we consider the association unlikely.
2.5 Host-Galaxy Photometry
We retrieved science-ready coadded images from SDSS Data Release 9 (Ahn et al., 2012), UKIRT Infrared Deep Sky Survey DR11Plus (Lawrence et al., 2007), and preprocessed WISE (Wright et al., 2010) images from the unWISE archive (Lang, 2014). The unWISE images are based on the public WISE data and include images from the ongoing NEOWISE-Reactivation mission R3 (Mainzer et al., 2014; Meisner et al., 2017). In addition to this, we use the UVOT observations that were obtained either before the explosion of SN 2021csp or after the SN had faded from visibility. The brightness in the UVOT filters was measured with UVOT-specific tools in HEAsoft. Source counts were extracted from the images using a region of radius . The background was estimated using a circular region with a radius of close to the SN position but not overlapping it. Count rates were obtained from the images using uvotsource. They were converted to AB magnitudes using the UVOT calibration file from September 2020.
We measured the brightness of the host using LAMBDAR (Wright et al., 2016), uvotsource, and the methods described by Schulze et al. (2021). Table 3 provides the measurements in the different bands.
| Survey/ | Filter | Magnitude |
|---|---|---|
| Telescope | ||
| Swift/UVOT | ||
| Swift/UVOT | ||
| Swift/UVOT | ||
| SDSS | ||
| SDSS | ||
| SDSS | ||
| SDSS | ||
| SDSS | ||
| PS1 | ||
| PS1 | ||
| PS1 | ||
| PS1 | ||
| PS1 | ||
| UKIDSS | ||
| UKIDSS | ||
| WISE | ||
| WISE |
Note. — All magnitudes are reported in the AB system and not corrected for extinction.
3 Analysis
3.1 Light Curve
3.1.1 Explosion Time
SN 2021csp was identified prior to peak brightness and upper limits shortly prior to discovery are available, permitting a reasonably tight constraint on the time of first light (defined here as the moment when optical photons in excess of the progenitor luminosity are first able to escape and travel freely toward the observer). We will refer to this as the “explosion time” for simplicity, although we emphasize that the data cannot actually separately distinguish the time of core collapse or shock breakout.
The most recent ZTF/P48 upper limit prior to the discovery is from an observation at MJD 59254.52578 ( mag, 2.5), which is 1.94 days before the first detection in the band and 1.97 days prior to the first detection in the band. Assuming an early-time flux evolution following , the earliest explosion time consistent with the -band limit is . This limit is likely to be conservative, since the flux was already turning over from a -like early behavior at the time of the initial detections.
No upper limit can be formally placed on the time of explosion other than the time of the first detection itself since the rising phase is too short and poorly sampled to be modeled effectively. The (very conservative) upper limit is thus . Given that the source was already quite bright at this time, our general expectation (supported by the blackbody modeling; §3.1.3) is that the explosion time is probably closer to the beginning of the constrained window.
Throughout the remainder of the paper we will express observation times in the rest frame relative to MJD 59254.5, the approximate time of the last upper limit and a reasonable guess of the time of explosion. Expressed in this system, our constraint on the actual time of explosion is d d.
3.1.2 Characteristic Timescale
To better quantify the rapid evolution of SN 2021csp and compare it to other optical transients, we perform a basic measurement of the characteristic evolutionary timescales.
The rise time (, defined as the rest-frame time from explosion to peak brightness) depends on the band, with redder filters showing later peaks (and therefore longer rise times). In the (observed) band where the early light curve is best sampled, the rise time is 1.8–4.0 rest-frame days, with the large uncertainty originating primarily from the uncertainty in the explosion time itself (although following the arguments in § 3.1.1, times toward the upper end of this range are likely more plausible). The rise time is day longer in and days longer in and .
For comparison to the light curves of other SNe, a standard metric is the half-maximum time (), the amount of time (rest frame) which the transient spends at a flux level more than half of its maximum in some wavelength band. This can be decomposed into separate half-rise () and half-fade () times, the intervals over which the transient rises from half-maximum to maximum brightness and fades from maximum to half-maximum brightness (respectively). The smoothed interpolation of our -band light curve gives a half-rise time of days and a half-fade time of days, for a total time above half-max of days. (The -band timescale is somewhat slower, with days).
A comparison between the characteristic timescales and luminosities of SN 2021csp and similarly-measured estimates for a variety of other “fast” transients is shown in Figure 7. SN 2021csp is much more extreme than SN 2019hgp and fits in well with the population of spectroscopically-unclassified fast and luminous optical transients from the works of Drout et al. (2014) and Pursiainen et al. (2018) (gray circles).
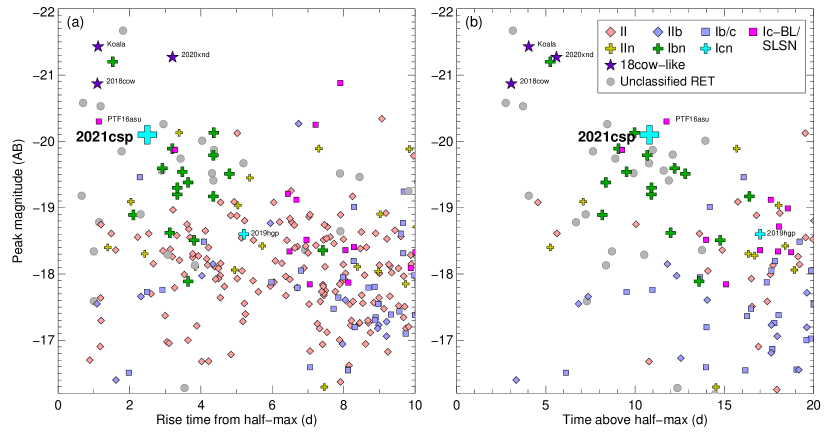
More recently, Ho et al. (2021a) compiled a large catalog of rapidly-evolving events with spectroscopic classifications from the ZTF high-cadence surveys (1 day cadence or faster), and Perley et al. (2020) produced a spectroscopically-complete catalog of events from the ZTF public Bright Transient Survey (3 day cadence). The samples from these two surveys are added to Figure 7 for comparison. Consistent with its spectroscopic properties, SN 2021csp is sited in the same region of parameter space occupied by interaction-dominated transients (primarily SNe Ibn and fast SNe IIn; see Ho et al. 2021a). However, it is among the most luminous examples of this group and also one of the fastest-rising, bringing it closer to the “Cow-like” radio-loud population in the top left of Figures 7a-b.
3.1.3 Blackbody modeling
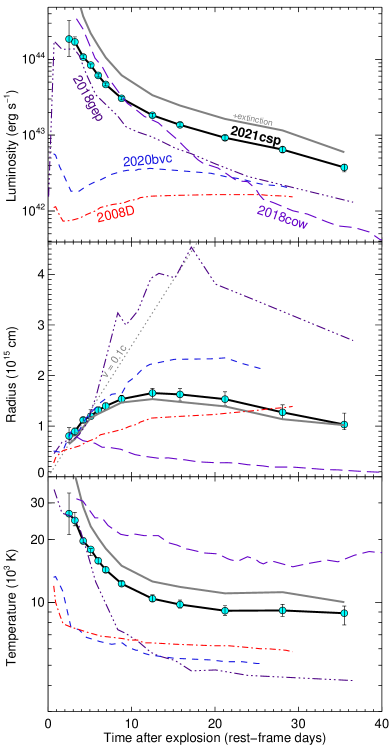
To obtain common-epoch spectral energy distributions (SEDs), we define a set of standardized epochs (chosen to be close in time to actual multiband measurements) and use a combination of local regression smoothing and spline fitting to obtain interpolated light-curve measurements for all available filters at each point. After correcting for Galactic extinction, we then fit a Planck function to each set of fluxes to determine the effective temperature, photospheric radius, and luminosity. The host-galaxy extinction is initially assumed to be zero (based on the face-on geometry of the host, the outlying location of the event, and the lack of narrow absorption lines from the interstellar medium in the spectra), but we later repeat the procedure under different assumptions about the host reddening. The SED fits are shown in Figure 8.
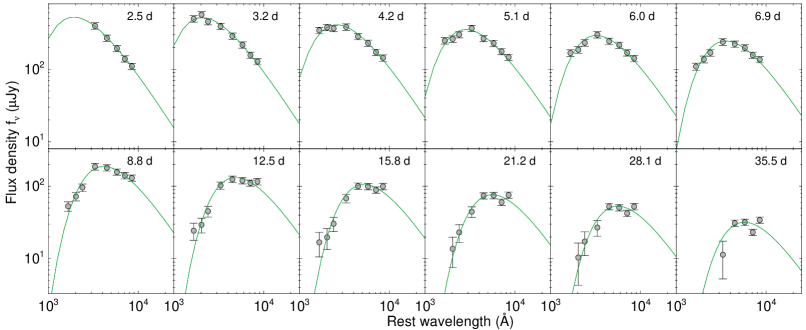
The physical parameters (blackbody luminosity, radius, and temperature) derived from these fits are shown in Figure 9 (and provided in Table 4), where they are compared with a variety of other fast and/or luminous transients measured using similar approaches. The fast rise to peak brightness implies an initial velocity that is very high (30000 km s-1), akin to what is seen in SNe Ic-BL.
| MJD | log10() | log10() | log10() | |
|---|---|---|---|---|
| (d) | (erg s | (cm) | (K) | |
| 59257.20 | 2.49 | |||
| 59258.00 | 3.23 | |||
| 59259.00 | 4.15 | |||
| 59260.00 | 5.07 | |||
| 59261.00 | 6.00 | |||
| 59262.00 | 6.92 | |||
| 59264.00 | 8.76 | |||
| 59268.00 | 12.45 | |||
| 59271.00 | 15.22 | |||
| 59285.00 | 28.14 | |||
| 59293.00 | 35.52 |
Note. — Uncertainties are statistical only and do not include systematic effects associated with the unknown host extinction ( is assumed) or deviations of the true spectral shape from a single-temperature blackbody.
The subsequent evolution is generally normal, in the sense that the luminosity and temperature decline while the photospheric radius increases, reaches a maximum, and then recedes into the cooling ejecta. The final two points should be treated with caution, since at this point the spectrum has heavily diverged from a simple blackbody (Fig. 4) and the UV emission is weak or absent.
We examined whether the possibility of host extinction would alter any of the above conclusions. For a Milky Way-like reddening law (Fitzpatrick 1999), the maximum potential extinction permitted by our SED models is mag (higher extinction values lead to poor fits at early times because the corrected fluxes become too blue for a blackbody model.) The inferred luminosity and temperature both increase significantly at early times in this scenario, but the radius measurements are affected by only 10–20% (see dotted lines in Fig. 9). For the remainder of the discussion we will continue to assume .
3.2 Spectral analysis
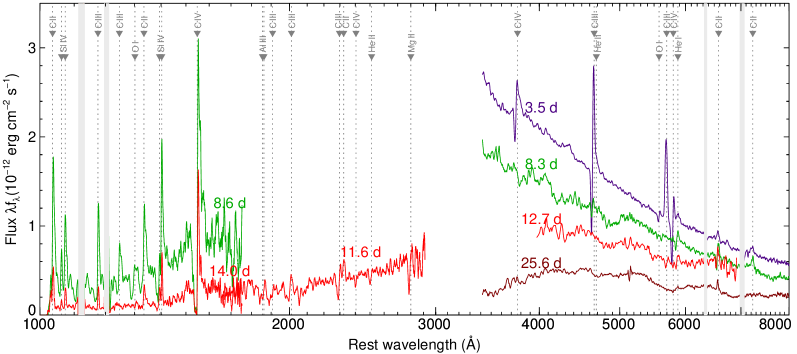
The spectroscopic sequence in Figure 4 shows two distinct regimes. At 2–10 days, the spectra are characterized by a hot, blue continuum superimposed with strong, narrow P Cygni features (“narrow phase”). After 16 days, the narrow lines have disappeared completely and a series of broad features with velocities characteristic of SN ejecta emerge instead (“broad phase”). The spectrum in between these two periods (i.e., 10–16 days) exhibits a brief transitional state in which most of the narrow optical features have vanished but C II remains and the UV P Cygni features also remain very strong, and whereas broad features are becoming evident in the spectrum they are still weak and indistinct. We summarize the key features of the two spectral regimes below.
3.2.1 Narrow-phase spectra
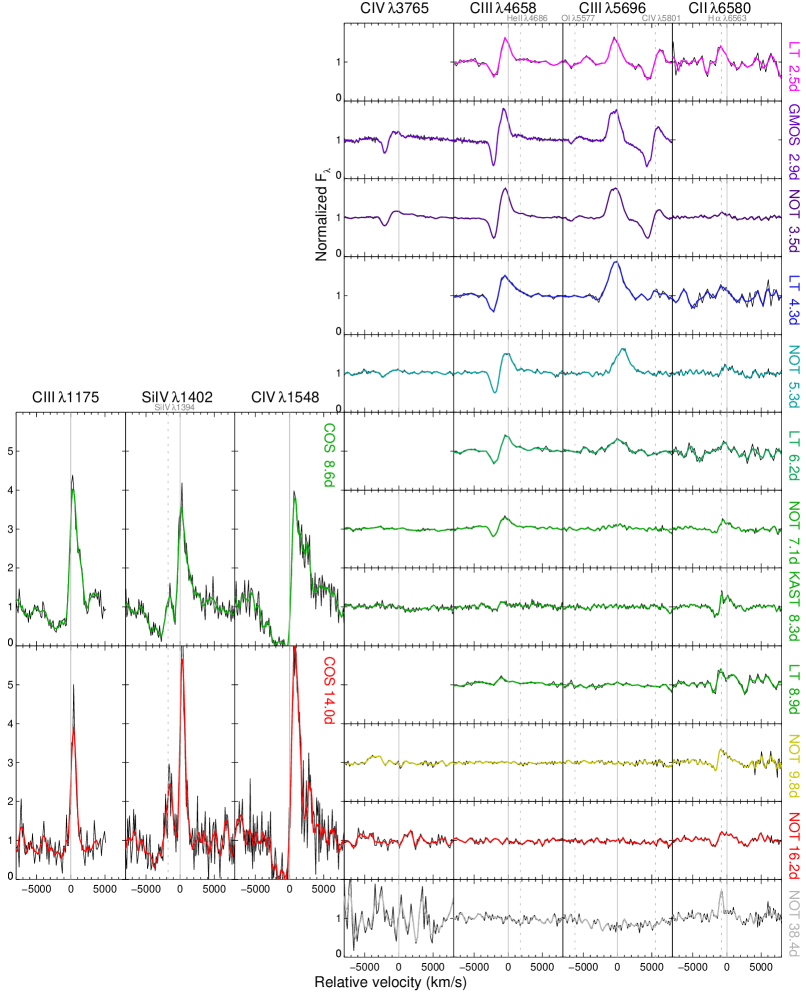
All identified strong lines spanning the UV to 8000 Å are shown in Figure 6 (and listed in Table 5), with close-up views of various strong features presented in Figure 10. Almost all of the identifiable lines are associated with oxygen, carbon, silicon, or magnesium. He II 4686 may be present in a blend with the C III 4656 feature, although because of the high velocities this cannot be conclusively established. However, He I 5876 is clearly seen. Some of the later spectra show a P Cygni feature close to the position of H 6563, although more likely this feature originates from a combination of C II 6580 (which persists longer than the other lines) and host-galaxy narrow emission. Most line profiles have a P Cygni shape, with blueshifted absorption and emission that may be either net blueshifted or net redshifted depending on the line and phase. The far-UV Si lines are seen only in emission, as is C III 5696.
| Line | Rest wavelength |
|---|---|
| (Å) | |
| C II | 1036 |
| Si IV | 1062 |
| Si IV | 1073 |
| C III | 1175.7 |
| C III | 1247.38 |
| O IaaUncertain line association | 1302 |
| C IIaaUncertain line association | 1335 |
| Si IV | 1393.76 |
| Si IV | 1402.77 |
| C IV | 1548 |
| Al III | 1854.73 |
| Al III | 1862.79 |
| C III | 1908 |
| C III | 2010.1 |
| C III | 2296.87 |
| C II | 2324 |
| C IV | 2404.77 |
| He II | 2511.4 |
| Mg II | 2800 |
| C IV | 3765 |
| C III | 4658 |
| He II | 4686 |
| O I | 5577 |
| C IV | 5801 |
| C III | 5695.92 |
| He I | 5876 |
| C II | 6580 |
| C II | 7234 |
Note. — Narrow (CSM) lines identified in the UV and optical spectra of SN 2021csp and shown in Figures.
Despite being qualitatively characterized as narrow lines, the velocities inferred from these features are quite high. The deepest point of absorption in the strong lines from the early, high-S/N optical spectra is at km s-1, with a maximum blueshift (blue edge) of km s-1. The inferred velocities in the UV (where the transitions are much stronger) are even higher; the C IV 1548 line shows almost-total absorption out to km s-1 but weaker absorption out to a maximum blueshift of approximately km s-1.
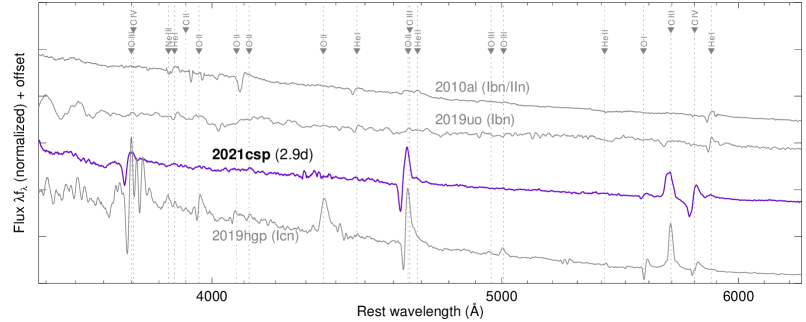
A comparison between the peak-light spectra of SN 2021csp, the prototypical Type Icn SN 2019hgp, and two SNe Ibn (SN 2019uo and SN 2010al) is displayed in Figure 11. The spectrum of SN 2019uo is the classification spectrum from the Transient Name Server (Fremling et al., 2019); the spectrum of SN 2010al is taken from Pastorello et al. (2015a). The spectrum of SN 2021csp strongly resembles that of SN 2019hgp, although it lacks some of the transitions seen in that SN (e.g., O III). The line widths in SN 2019hgp are somewhat broader. The features in the SNe Ibn originate from different transitions (mainly He I) and are much weaker than those of either SN Icn, although the line profiles are qualitatively similar.
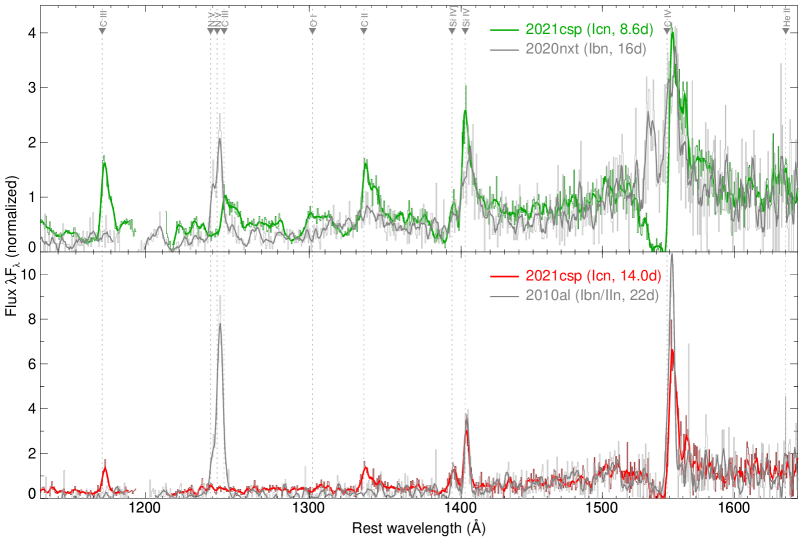
A comparison with two SNe Ibn in the UV (SN 2020nxt and SN 2010al; Fox et al. 2021, in prep.; Kirshner et al. 2010) is provided in Figure 12. Some common transitions are apparent at these wavelengths, most notably the resonance lines of Si IV 1402 and C IV 1548, which have similar strengths and profiles. The remaining features are quite different: SN 2021csp shows a number of carbon features absent in SNe Ibn, while the very strong doublet N V 1238,1242 is seen in both SNe Ibn but is absent entirely in the Type Icn SN 2021csp. Also, while the characteristic velocities are similar, the high-velocity component (4000 km s-1) in absorption and emission seen in SN 2021csp is not clearly visible in either of the SNe Ibn — although the issue is somewhat confused by contamination with other features and the different phases of the observations.
3.2.2 Broad-phase spectra
The broad lines are somewhat indistinct at 10–15 days, but by 16 days the characteristic late-time spectrum has clearly emerged. The flux is strongest in the blue, with maxima at 4600 Å, Å, and Å. The relative strength of these features increases gradually with time, but neither their shapes nor central wavelengths change much. A notable exception is the Ca II near-infrared triplet at Å: not apparent at all prior to days, it rapidly rises to become the dominant emission feature in our final spectrum at 53 days. The maximum velocity (at zero intensity) of this feature on the blueshifted side is km s-1, characteristic of nebular-phase stripped-envelope SNe.
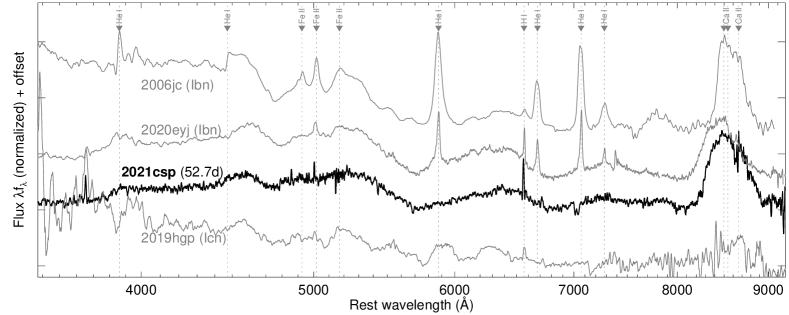
The identity of the remaining features is less clear. While the late-phase spectra show some similarities to those of SNe Ic, the strong blue and near-UV continuum differs dramatically from the line-blanketed post-peak spectra of any normal member of this class (including SNe Ic-BL). Instead, the continuum strongly resembles those of SNe Ibn at similar phases, although the narrow He I lines characteristic of SNe Ibn at these phases are absent. A comparison between SN 2021csp, SN 2019hgp, and two late-phase SNe Ibn (SN 2006jc from Pastorello et al. 2007 and SN 2020eyj from Kool et al. 2021, in prep.) is shown in Figure 13. The blue pseudocontinuum seen in SNe Ibn has been attributed to a forest of blended Fe II lines provided by fluorescence in the inner wind or post-shock gas (Foley et al., 2007; Chugai, 2009; Smith et al., 2009; Pastorello et al., 2015b), and its presence here suggests that strong CSM interaction is continuing even after the narrow lines have faded.
3.3 Polarimetry
An upper limit on the interstellar polarization (ISP) induced by dichroic extinction of Milky Way-like dust grains is given by (Serkowski et al., 1975). Therefore, we set an upper limit on the ISP from the Galactic component as 0.24%. We assume a host mag (§3.1.3). We evaluated a continuum polarization level of % by computing the error-weighted Stokes parameters in the optical range after excluding the prominent spectral features and telluric ranges. Therefore, without a careful determination of the ISP from the SN host, we suggest that the continuum polarization of the SN is less than %.
There is no strong polarization signal associated with any of the narrow-line features, although the wavelength bins in the vicinity of flash-ionized narrow P Cygni features of ionized C III and C IV (labeled in Fig. 5) do show a polarization excess of % above the continuum level at significance, which may be an indicator of some (limited) asymmetry in the explosion and/or CSM.
Assuming a limiting polarization of 0.5%, the axis ratio of the photosphere can be limited to assuming an ellipsoidal surface with a Thomson optical depth of 5 and a radial CSM density profile of , with an index in the range 3–5 (Höflich, 1991).
3.4 Radio Analysis
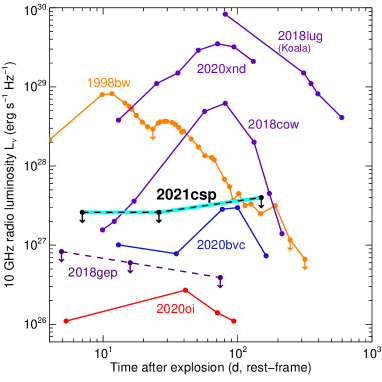
SN 2021csp was not detected in any of our radio observations. The radio limits do not rule out a light curve similar to that seen in ordinary SNe, but the luminosity limits derived from the second and third measurements are significantly below the light curves of AT 2018cow or AT 2020xnd at comparable epochs (Ho et al., 2021a). A comparison between the upper limits and some previous SN radio light curves is shown in Figure 14.
3.5 Host Galaxy
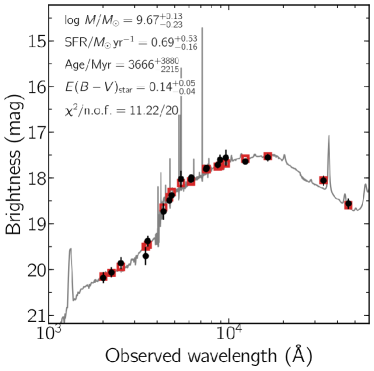
We modeled the host-galaxy SED with the software package prospector (Leja et al., 2017) using the procedures of Schulze et al. (2021). We assumed a Chabrier initial mass function (Chabrier, 2003), approximated the star-formation history (SFH) by a linearly increasing SFH at early times followed by an exponential decline at late times (functional form ), and used a Calzetti et al. (2000) attenuation law.
Figure 15 shows the observed SED and its best fit. The SED is adequately described by a galaxy template with a mass of and a star-formation rate of .
Emission-line fluxes were extracted from the late-time Keck spectrum (using the observation from 2021-05-16, which covered the host nucleus and was taken after the transient had faded; we use a custom extraction covering the entire host). We measure the following line fluxes for H, H, [O III] 5007, [O III] 4959, and [N II] 6584 of , , , , and , respectively (units of ; no extinction correction has been applied). We estimate the metallicity at the galaxy center using the O3N2 indicator with the calibration reported by Marino et al. (2013). The oxygen abundance of translates to a moderately low metallicity of (assuming a solar oxygen abundance of 8.69; Asplund et al. 2009).
3.6 Summary of Observational Properties
The key observational features of SN 2021csp are summarized below.
-
•
SN 2021csp exhibits three distinct phases. At early times ( days), the temperature is very high but rapidly cooling, and the spectra are dominated by strong, narrow P Cygni features of C and O. At 20–60 days, the spectra are dominated by broad features and there is comparatively little color evolution; the light curve declines gradually. After 60 days, the light curve fades very rapidly and the transient disappears (absolute magnitude ) by 80 days.
-
•
The spectra are dominated by C and O, with Si also evident in the UV and an Fe pseudocontinuum visible in the broad-component phase in the blue. Compared with SNe Ibn, He is weak while N and H are absent. The strength of the narrow lines is greater than in any known SN Ibn close to peak brightness, but narrow lines are lacking entirely at late times.
-
•
Several characteristic velocities are evident. The “narrow” features show maximum absorption at 2000 km s-1 with a maximum velocity of 4500 km s-1, indicative of the velocity of the CSM. The early photospheric modeling indicates the existence of a high-velocity ejecta component with 30000 km s-1. Late-phase optical spectra suggest a characteristic ejecta velocity of 10000 km s-1.
-
•
The very fast rise (3 days) and high peak luminosity ( mag) are consistent with common definitions for an “FBOT”, but these values are not unusual for SNe Ibn, many of which have also been shown to be “FBOTs” (Ho et al., 2021a).
-
•
There is no detection of a radio or X-ray counterpart. The limits rule out an AT 2018cow-like event or GRB, but not most classes of normal SNe.
-
•
The transient occurred in the outer regions of a moderately low-mass, star-forming spiral galaxy.
Key observational parameters are summarized for convenience in Table 6.
| Property | Value | Description |
|---|---|---|
| 0.084 | Redshift | |
| 1.8–4.0 days | Rise time to peakaaTimes are in the rest-frame and are in the observed -band ( Å). | |
| days | Time from half-max to peakaaTimes are in the rest-frame and are in the observed -band ( Å). | |
| days | Time to decay to half-maxaaTimes are in the rest-frame and are in the observed -band ( Å). | |
| 20.1 | Peak absolute magnitude | |
| 19.8 | Peak absolute magnitude | |
| 21044 erg s-1 | Peak observed UVOIR luminosity | |
| 1050 erg | Total UVOIR radiative output | |
| 2200 km s-1 | Velocity of deepest absorption | |
| 4500 km s-1 | Max. blueshift of narrow lines | |
| 30000 km s-1 | Photospheric expansion velocity | |
| 4.7109 | Host stellar mass | |
| SFRhost | 0.69 yr-1 | Host star-formation rate |
| 12+log[O/H] | Host oxygen abundance |
In the following section we interpret these observations in the context of the progenitor star, its CSM, and the nature of the explosion itself.
4 Discussion
4.1 A Highly Chemically-Evolved Progenitor
The spectra reveal a progenitor star that has lost all of its H, and which is also depleted in He and N. These properties describe both the narrow (CSM) features and the broad (ejecta) features, and it is clear that the SN represents the explosion of a heavily stripped star into a dense nebula of material recently expelled from its surface.
An important question is whether the weak He features indicate a qualitatively distinct composition from SNe Ibn or merely a difference in ionization. Helium can be a notoriously difficult element to interpret in SN spectra, since non-LTE effects are required for He features to be observable (Li et al., 2012; Dessart et al., 2012). The almost complete lack of N (alongside that of He) supports the case that the composition is genuinely distinct from that of SNe Ibn. In H-burning massive stars, the CNO cycle continuously converts H to He but also converts most existing C and O to N; CNO-processed material is expected to have (Gamow, 1943; Crowther, 2007). In contrast, during the He-burning phase, He is converted to C and O via the triple-alpha process, but N is simultaneously consumed by conversion to Mg and Ne, leaving it heavily depleted. The absence of detectable N in the UV provides evidence that by the time of explosion virtually the entire remaining star (including its surface, as revealed by the CSM) had experienced triple-alpha processing.
As noted by Gal-Yam et al. (2021b), the velocities and abundance patterns in SNe Ibn vs. SNe Icn strongly parallel what is seen in WR (WN vs. WC) stars. This does not guarantee that the progenitors are WR stars similar to the ones seen in the Milky Way and nearby galaxies; indeed, in §4.2 we demonstrate that the properties of the SN Ibn/Icn progenitor stars shortly before explosion must be quite different from known WR stars. However, these properties do suggest that the SN Ibn/Icn progenitors must share two essential characteristics with WR stars: surface abundance patterns from envelope stripping, and high-velocity mass loss.
4.2 Dramatically Enhanced Pre-explosion Mass Loss
The fast evolutionary timescale SN 2021csp (a very fast rise, followed by a rapid decline) can only be practically explained by CSM interaction, for reasons detailed in previous works on similarly rapid and luminous objects (e.g., Rest et al. 2018): the decline is too fast if radioactive decay of heavy elements is responsible for the heating, but the rise is too slow (and the peak too luminous) to be shock cooling of a supergiant envelope. Qualitatively, this is consistent with the spectroscopically-inferred notion of a CSM-interacting transient, and indeed our early-time observations provide some of the most direct evidence yet that fast-rising blue transients (of all spectroscopic types) do indeed result from strong CSM interaction. However, the properties of the CSM are quite extreme for a WR wind.
The SN reaches a peak luminosity of erg s-1 on a timescale of only 3 days, and over the course of the first 10 days (when interaction is the only viable source of energy deposition) the radiative energy release is erg. While this is only a few percent of the kinetic-energy budget of a typical SN, substantial CSM is required to decelerate the ejecta over this timescale.
For a SN powered by CSM interaction, the pre-SN mass-loss rate can be related to the observed bolometric luminosity in a simple way assuming basic physical principles (see also Smith 2017b). A star losing mass isotropically at a constant velocity but potentially variable mass-loss rate will produce a wind nebula with density profile . The SN shock then expands into this nebula at a speed , sweeping up matter at a rate . In the SN shock frame, this matter is suddenly decelerated and its kinetic energy is converted to heat; some fraction of this energy is then released as thermal radiation. Thus, the luminosity is related to the mass-loss rate as
For a variable mass-loss rate, the SN luminosity at post-explosion time probes the mass-loss rate at pre-explosion time .
For SN 2021csp, we have km s-1 (from early-time spectra), and km s-1 (from photospheric modeling). For these parameters the mass-loss rate is
Thus, at a time mapping to the bolometric peak of the light curve (+3 days post-explosion, probing mass loss days pre-explosion), the equivalent mass-loss rate of the star must have been close to 0.5 yr-1. This is orders of magnitude higher than what is seen in typical WR stars (e.g., Barlow et al., 1981; Smith, 2017a) — or, indeed, any stars other than luminous blue variables (LBVs) undergoing giant eruptions.
The narrow lines largely disappear by 16 days, although we have reason to believe (§4.3) that interaction continues to be the dominant power source of the light curve over the remainder of the evolution of the SN. Under the simplistic assumptions above, the mass-loss rate 1 yr prior to explosion was while 3 yr prior to explosion it was 0.005 , which is still a factor of 100 greater than for typical WR stars.
Based on this, we conclude that the dense and fast CSM indicated by our spectroscopy originates from a pre-explosion giant eruption rather than a WR wind. The very close separation in time between this eruption and the explosion ( of the lifetime of the WR phase) is unlikely to be a coincidence and suggests that the star was undergoing a period of extreme instability, possibly brought on by late stages of nuclear burning, as has been inferred indirectly from observations of a variety of SNe (Yaron et al., 2017; Bruch et al., 2021; Strotjohann et al., 2021) including at least one SN Ibn (Foley et al., 2007; Pastorello et al., 2007).
This is not in contradiction to the notion that a WR star is responsible for the explosion. The light curves and spectra of SN 2021csp show that the interaction phase is very short-lived: once the zone of CSM originating from the pre-explosion eruption has been traversed by the shock, the interaction signatures disappear and the optical luminosity plummets, consistent with the explosion expanding into a more tenuous wind from that point onward. This behavior is quite different from that of SNe IIn (which typically continue to interact with CSM for years) but similar to that of all but a few SNe Ibn.
4.3 A Low Radioactive Mass
While the spectra become dominated by broad ejecta features from 15 days and the luminosity remains high for several weeks thereafter, it is notable that the spectra during this phase do not resemble those of normal SNe Ib/c: the identifiable features are mostly in emission (not absorption) and the “temperature” (a loose concept since the spectra no longer resemble a blackbody) remains high. Similar behavior is seen in SNe Ibn, and can be interpreted as the consequence of an inversion of the usual temperature geometry: ejecta are being heated from the shock at the front (producing an emission-dominated spectrum), rather than from radioactive decay from beneath (responsible for the more typical absorption-dominated spectrum). The distinction from earlier phases is that the optical depth of the pre-shock material has dropped, and the photosphere has receded behind the shock (which may include swept-up CSM material).
This alone does not rule out the presence of radioactive heating as well: out to 60 days SN 2021csp is still quite luminous for a SN and it is easy to imagine a “typical” SN Ib/c explosion buried behind the optically thick shock photosphere — as is generally presupposed (although rarely demonstrated; Pastorello et al. 2015b) to exist in SNe Ibn. However, the late-time photometric limits provide strong constraints on radioactive heating.
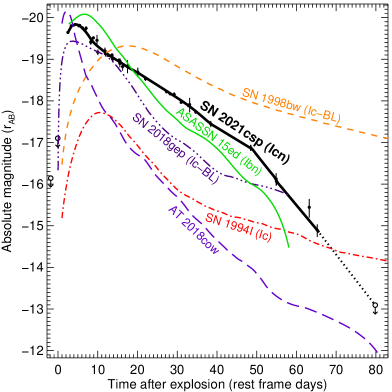
Ordinary (noninteracting, nonsuperluminous) stripped-envelope SNe exhibit two light-curve phases: optically thick and optically thin. The optically-thick phase is powered primarily by the decay of 56Ni to 56Co and manifests as a gradual rise, peak, and decay; the characteristic timescale is set by the diffusion time within the ejecta but is typically about two weeks. The optically-thin phase is typically powered by the subsequent decay of 56Co to 56Fe and follows an exponential curve (linear in time-magnitude space) set by the half-life of 56Co. The nickel-heated phase is not constrained by SN 2021csp, since it is overwhelmed by CSM interaction141414After the initial submission of this manuscript, a separate, independent paper on this event (Fraser et al., 2021) was posted, attributing the emission at days to radioactive heating from 0.4 of 56Ni within 2 of ejecta (their Figure 9). This model is ruled out by our deep late-time limits, which fall almost an order of magnitude below the prediction of their model at 80 days ( erg s-1 in their model vs. erg s-1 from our upper limit)., but the data strongly constrain the presence of a cobalt exponential-decay tail. Figure 16 plots the -band light curve of SN 2021csp versus that of a number of other stripped-envelope SNe, including the well-studied low-luminosity Type Ic SN 1994I. The light-curve limit can be seen to fall well below even SN 1994I at late times, demonstrating that SN 2021csp was quite ineffective at producing cobalt (and therefore nickel).
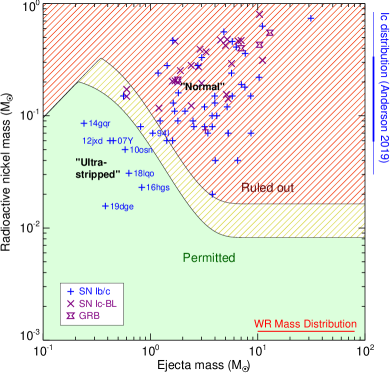
Using the empirical method of Hamuy (2003) to convert our late-time -band limit to a constraint on the radioactive mass, we estimate , which is lower than what has been inferred for virtually any well-studied SN Ic to date (Hamuy, 2003; Kushnir, 2015; Anderson, 2019; Sharon & Kushnir, 2020; Afsariardchi et al., 2021). This method assumes full gamma-ray trapping, which is not a good assumption if the ejecta mass is low. To account for this, we employ the gamma-ray trapping prescriptions from Clocchiatti & Wheeler (1997) and Sollerman et al. (1998) to calculate the luminosity at 80 days for various combinations of and , and compare this with the limiting measurement. We have assumed an opacity cm-2 g-1, a canonical kinetic energy of 1051 erg, and a bolometric correction of , characteristic of late-time stripped-envelope SNe (Lyman et al., 2016).
The result is plotted in Figure 17 (green shading denotes the allowed region). A strong constraint on the radioactive mass ( ) can be placed even if the ejecta mass is low. For ejecta masses characteristic of the successful explosion of a WR star, the conditions converge to the full-trapping approximation and the limit is much stronger ( ).
These limits are well below typical values for known Type Ib/c supernovae. For comparison in Figure 17 we plot the estimated ejecta and nickel masses for stripped-envelope SNe from a variety of literature sources (Barbarino et al. 2021; Anderson 2019; Taddia et al. 2019; Gagliano et al. 2021; Srivastav et al. 2014; Stritzinger et al. 2009; De et al. 2018a, b, 2020; Yao et al. 2020, and the compilation of Tanaka et al. 2009). Most such events are within the ruled out region of the diagram, suggesting that SN 2021csp cannot simply represent a “normal” SN Ic exploding into a dense CSM.
A few atypical SNe do have very low ejecta masses (and nickel masses) that land within the permitted region. Events of this nature have sometimes been called “ultra-stripped” SNe (e.g., De et al., 2020; Yao et al., 2020) due to the need for extremely efficient stripping by a binary companion to explain their origins in terms of a massive star. SN 2021csp could originate from such an event, although some other aspects of the explosion are not well-explained in this model: we will discuss this further in §5.1.
The limits above would be alleviated somewhat if some of the late-time luminosity were obscured by dust produced in the SN shock. Dust formation has been inferred at late times in at least one SN Ibn (SN 2006jc; Smith et al. 2008; Mattila et al. 2008) and has been appealed to as a partial explanation for the similarly faint late-time emission from that event. It is difficult to rule this scenario out entirely, as we lack late-time near-infrared photometry with which to search for dust emission that would be predicted in this scenario. However, newly-formed dust should not conceal the blue wings of the emission lines (which originate from material at the front of the ejecta). Our spectrum at 88 days shows no evidence for blueshifted Ca II emission, suggesting that the line did in fact intrinsically disappear. More generally, dust formation would have to be extremely rapid (progressing from virtually nonexistent at days to mag at 80 days) and the covering fraction would have to be very high (). We therefore argue that dust formation is unlikely to explain the late-time rapid fading.
4.4 Rate Constraints
SNe Icn are clearly rare events: the first example was identified in 2019 (SN 2019hgp, presented by Gal-Yam et al., 2021b) with only two others discovered thereafter (SN 2021csp, presented here; SN 2021ckj, Pastorello et al. 2021). SNe Ibn are not common either: only 38 are catalogued on the Transient Name Server as of July 2021, compared to 8700 SNe Ia (which have similar peak luminosities and are detectable to similar distances). Naively, this suggests that the SN Ibn rate is 0.4% of the SN Ia rate, with SN Icn rarer by at least a factor of 10. Given the relative SN Ia and core-collapse SN (CCSN) volumetric rates (e.g., Graur et al., 2011), this translates to % of all CCSNe being of Type Ibn and % of Type Icn.
This calculation neglects differences in the luminosity function and control times of the various events, as well as any bias in spectroscopic follow-up observations and reporting. A more robust limit can be calculated from the spectroscopically-complete ZTF Bright Transient Survey (Fremling et al., 2020; Perley et al., 2020). A detailed calculation of the volumetric rates of various CCSN subtypes from BTS will be presented in future work. For now, we use the methodology from Perley et al. (2020) (including new discoveries through summer 2021) to estimate the SN Ibn rate for peak absolute magnitudes brighter than to be 0.1%–0.5% of the total CCSN rate. If we assume that SNe Icn follow a similar luminosity distribution as SNe Ibn, the corresponding rate estimate for SNe Icn is %–0.05% of the total CCSN rate. Regardless of the precise numbers, SNe Ibn/Icn must be very rare explosions.
4.5 An Intermediate-Mass Host Galaxy
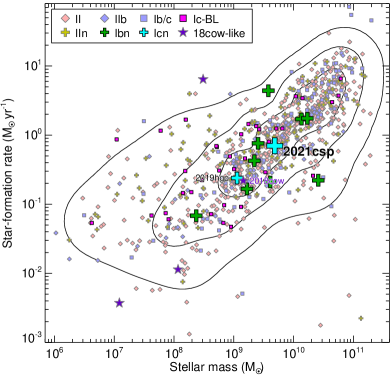
The integrated properties of the host galaxy are similar to those of the Large Magellanic Cloud (LMC) and generally typical of star-forming galaxies. Figure 18 shows basic properties (mass and star-formation rate) compared to a variety of CCSNe from the iPTF survey (Schulze et al., 2021); we have also plotted the host galaxies of all four published AT 2018cow-like events with radio detections (Perley et al., 2019; Coppejans et al., 2020; Ho et al., 2020a; Lyman et al., 2020; Perley et al., 2021b) and SN 2019hgp (Gal-Yam et al., 2021b). The host of SN 2021csp lies in the middle of the distribution on the star-forming main sequence. It is also well within the distributions of the hosts of known SNe Ibn and SNe Ic-BL. Thus, for none of these classes is there strong evidence that a highly unusual progenitor (e.g., extremely metal-poor, ultramassive, or otherwise requiring properties not present within typical massive galaxies) is required. Much larger samples of SNe Icn (and SNe Ibn) will be needed to examine the implications for the nature of the progenitors in detail.
5 Interpretation
To summarize, SN 2021csp represents the explosion of a H/He/N-depleted star into CSM produced by rapid mass loss from the progenitor at very high velocities, likely in the form of an (unobserved) pre-explosion giant eruption. The explosion itself included very fast ejecta, yet synthesized relatively little radioactive nickel: the SN is dominated at all phases by features of the interaction. Deep limits at late times rule out a “classical” massive, slower-moving component to the ejecta, showing that the explosion did not simply originate from an ordinary class of SN exploding into enhanced CSM.
Qualitatively similar characteristics were noted for SN 2019hgp (Gal-Yam et al., 2021b), and indeed for many of the prototypical SNe Ibn as well. We consider here three general progenitor scenarios that could explain the observed behavior and its distinction from the general SN Ib/c population.
5.1 A Supernova from a Highly Stripped Progenitor?
A variety of faint-and-fast transients in recent years have been interpreted as the results of particularly effective stripping from the binary companion (De et al., 2018a; McBrien et al., 2019; Yao et al., 2020). In this scenario, late-stage mass transfer is able to effectively remove the large majority of the mass of the progenitor star, leaving behind a core of only a few or less (Tauris et al., 2013). The explosion of such an object naturally produces a SN with limited amounts of ejecta, including radioactive ejecta (Kleiser et al., 2018a). Should such an explosion occur into a dense surrounding CSM shed by violent pre-explosion instabilities (not naturally predicted in these models, but plausible given the apparent ubiquity of enhanced late-stage mass loss in other SN classes; Bruch et al. 2021), the resulting transient would be generally consistent with our observations of SN 2021csp: as noted in § 4.3, our late-time limits do not rule out an “ultra-stripped” event of this nature.
Seen in the broader context of the general population of interacting transients, this interpretation is somewhat less satisfying. Many SNe Ibn retain significant amounts of hydrogen in addition to helium, and hydrogen is unlikely to persist in the progenitor of a star that has been stripped to a small fraction of its initial mass. It is possible that the origins of SNe Ibn and SNe Icn are distinct, with SNe Icn representing ultrastripped stars and SNe Ibn originating from a different mechanism. However, if this is the case, the strong similarities between the Type Ibn and Type Icn classes (regarding timescale, luminosity, CSM velocity, and late-time behavior) must be ascribed to coincidence. This, combined with the strong similarities between the spectra of Type Ibn/Icn supernovae and those of (high-mass) WR stars, leads us to consider other potential interpretations.
5.2 A Pulsational Pair-Instability Eruption?
Another potential explanation for the lack of a late-time radioactive tail is a nonterminal eruption that expels only the outer envelope of the star, leaving the remainder intact. It is already clear from the CSM properties that the star underwent an energetic eruption in the recent past. If the unstable state that led to that prior eruption subsequently produced a second, higher-velocity eruption, the collision between the two shells could produce a quite luminous transient. It is unlikely that an ordinary, LBV-style eruption would be sufficient for this, but a more exotic progenitor might produce even more luminous eruptions. In particular, late-stage pulsational pair-instability (PPI) models have been shown to reasonably reproduce the light curves of SNe Ibn (Woosley, 2017; Karamehmetoglu et al., 2021).
While the PPI eruption model cannot be strictly ruled out by any of our observations, we nevertheless disfavor this model for two reasons. First, the characteristic ejecta velocities associated with pair-instability eruptions are quite low: hundreds to a few thousand km s-1, much less than what is inferred from the early photospheric expansion rate of SN 2021csp. Second, pair-instability SNe are generally expected to occur primarily or exclusively in extremely metal-poor environments (Langer et al. 2007; Leung et al. 2019) but the host galaxies of known SNe Ibn/Icn do not appear to be strongly atypical. However, this depends on the mass-loss prescription and there may be exceptions (Woosley, 2017).
5.3 Jet Launching from a Failed Explosion of a WR Star?
The third possibility is that the progenitor of SN 2021csp (and other SNe Ibn/Icn) really is a massive Wolf-Rayet star undergoing core collapse, but the SN explosion was extraordinarily weak.
In general, one would expect more-massive progenitors to produce explosions that are both more luminous (owing to the larger cores) and more slowly evolving (owing to the more massive ejecta). There is some evidence that this is the case among “normal” SNe II with identified progenitors (Fraser et al., 2011). However, this trend is unlikely to extend to the highest masses: SN simulations suggest that above a certain mass the shock should stall, causing most or all of the star to collapse to form a black hole (O’Connor & Ott, 2011; Woosley & Heger, 2015). The lowest-luminosity SNe IIP have sometimes been attributed to marginally successful explosions suffering from substantial fallback (Zampieri et al., 2003; Moriya et al., 2010), and it is conceivable that SNe Ibn/Icn represent equivalent members of the stripped-envelope population (Kleiser et al., 2018b).
The ejecta velocities inferred from the early-time modeling of SN 2021csp are extremely high, quite unlike what would be expected from a marginally-successful explosion. The concentration of kinetic energy in a small fraction of the progenitor mass could be produced if the explosion is driven by a jet. There is ample precedent to expect jet formation from WR stars collapsing to form black holes: the original “collapsar” model for GRBs in which a rapidly-rotating compact object accelerates ultrarelativistic jets is the most famous (Woosley, 1993), but more modest jet energies and velocities can be produced under less-extreme conditions (MacFadyen et al., 2001; Piran et al., 2019). The interaction between a low-energy jet (or jet cocoon) and a dense shell of inner CSM could lead to a fast, but short-lived, interaction-driven transient of the type seen in SN 2021csp even as the bulk of the star collapses silently to a black hole.
Spectropolarimetry (§2.3.4) does not suggest a highly asymmetric photosphere, representing a potential problem for this model. Similarly, highly luminous radio emission (another possible jet-interaction signature) is ruled out by our VLA upper limits. However, the jet in this scenario is generally weaker and slower than in known jet-driven explosions, with the ejecta concealed behind the dense shocked CSM. There may also be other mechanisms (besides a fallback jet) by which a massive star can produce an incomplete high-velocity explosion.
It should be emphasized that in this model (or in any model), SNe Ibn/Icn cannot represent the typical deaths of WR stars. Given the abundance of WR stars in the Local Group (Hainich et al., 2014; Rosslowe & Crowther, 2015) and a lifetime of yr in this phase (Smith, 2014), the predicted WR death rate is 3–20% of the CCSN rate (Maoz & Badenes, 2010), at least an order of magnitude in excess of what we inferred in §4.4. This should not be surprising: the extreme properties inferred from the early-phase observations of SN 2021csp and similar events require particularly intense pre-explosion mass loss that may in practice be quite rare. In this scenario, the collapse of a high-mass star would generally produce only a relatively weak transient — consistent with the lack of good candidates for high-mass progenitors among the general SN Ib/c population — but in rare instances (perhaps 1% of the time) the explosion encounters dense surrounding CSM, leading to a fast-evolving and luminous transient.
It is interesting to note that the one class of successful SNe for which modeling does suggest a significant contribution from high-mass progenitors (SNe Ic-BL; Taddia et al. 2019) has also been connected to jets and engines. The primary difference is that the much more powerful jets in those events produce more luminous transients and SN explosions and thus do not require dense CSM to be visible. However, there is increasing evidence that some SNe Ic-BL do interact with dense surrounding material as well (Corsi et al., 2014; Whitesides et al., 2017; Chen et al., 2018; Ho et al., 2020b), raising the possibility of a continuum of WR collapse transients, with the vast range in observable properties explained by variations in the jet power, pre-explosion mass-loss history, and degree of progenitor stripping.
If this is the correct model, it would shed light on the even rarer, even faster-evolving transient population of AT 2018cow-like transients, which show a number of similarities to SNe Ibn/Icn (Fox & Smith, 2019). AT 2018cow and its analogs have also been hypothesized (Perley et al., 2019; Margutti et al., 2019) to originate from “failed” collapses based on some of the arguments presented above: the luminous early transient implies a very fast-moving early component, yet late-time observations provide deep limits on nickel production from the associated SN, demonstrating that they cannot simply represent normal (or even rare) SNe exploding into an unusually dense medium. AT 2018cow-like transients show major differences from the SN Ibn/Icn population, including a complete lack of early interaction signatures and a radio/X-ray “afterglow” that is more luminous than the limits on SNe Ibn/Icn by many orders of magnitude (Ho et al., 2019b, 2020a). This difference may be explicable in terms of the relative power and velocity of the jet and the precise geometry of the CSM, or it may be more fundamental.
6 Conclusions
The Type Icn SN 2021csp is one of the most extreme known examples of an interaction-powered fast and luminous transient and also among the best observed. Its properties, alongside those of SN 2019hgp (the first SN Icn) and the general population of SNe Ibn, provide a challenge to the basic picture of interaction-driven SNe as resulting from the explosions of otherwise ordinary SNe into dense CSM. The expansion speeds inferred from modeling the rising light curve are much higher than seen in ordinary stripped-envelope SNe, while the late-time flux is too faint for an explosion that produces significant ejecta and/or leads to significant radioactive nucleosynthesis (absent rapid dust formation).
The properties of SN 2021csp and other interacting SNe can be explained by a variety of potential models on an individual basis: a moderately-massive star highly stripped by a binary companion, or a nonterminal late-stage pair-instability eruption from an extremely massive star. However, we argue that the collective properties of this class are best explained under a scenario in which most SNe Ibn/Icn are produced by partially-successful explosions following the collapse of massive Wolf-Rayet stars. Specifically, we propose a model in which the direct collapse of a WR star to a black hole launches a subrelativistic jet that interacts with dense CSM shed by the progenitor shortly before explosion. Given that other stripped-envelope SNe now appear to originate from stars with masses too low to have classical WR progenitors, this raises the possibility that SNe Ibn/Icn, and engine-driven explosions like SNe Ic-BL and long-duration gamma-ray bursts, may actually represent the only currently-observable manifestation of the collapse of the most massive stars.
Further studies will be necessary to robustly establish whether this scenario is indeed the correct one. SN 2021csp represents one of only two published SNe Icn, fewer than five spectroscopically-confirmed AT 2018cow-like events are known, and even the SN Ibn population is only crudely mapped out (with sparingly few pre-maximum-brightness detections or deep late-time limits). Fortunately, with ZTF and a number of other wide-area surveys fully operating and with increasing community interest in the fastest transients, the sample is destined to grow (albeit slowly) in the coming years.
The Legacy Survey of Space and Time (LSST; Ivezić et al. 2019) with the Rubin Observatory will also play a vital role in this effort. While the slow cadence of the primary survey is poorly suited to the discovery of fast-evolving transients, the host-galaxy photometric redshifts will make it much more straightforward to distinguish luminous phenomena in high-cadence shallower surveys, providing important synergy with the fast wide-field surveys of the future. Meanwhile, repeated deep LSST imaging of nearby galaxies may be able to test whether WR stars disappear without a trace, better seek and identify pre-explosion progenitor eruptions in future SNe Ibn/Icn (and other SNe), and search for low-luminosity transients associated with black-hole fallback even in the absence of strong CSM interaction.
Acknowledgments— We thank Ori Fox, D. Alexander Kann, and the anonymous referee for helpful comments and suggestions. Based on observations obtained with the Samuel Oschin 48-inch telescope and the 60-inch telescope at the Palomar Observatory as part of the Zwicky Transient Facility project. ZTF is supported by the National Science Foundation (NSF) under grant AST-2034437 and a collaboration including Caltech, IPAC, the Weizmann Institute for Science, the Oskar Klein Center (OKC) at Stockholm University, the University of Maryland, Deutsches Elektronen-Synchrotron and Humboldt University, the TANGO Consortium of Taiwan, the University of Wisconsin at Milwaukee, Trinity College Dublin, Lawrence Livermore National Laboratories, and IN2P3, France. Operations are conducted by COO, IPAC, and UW. The SED Machine is based upon work supported by the NSF under grant 1106171. The ZTF forced-photometry service was funded by Heising-Simons Foundation grant #12540303 (PI Graham). The Liverpool Telescope is operated on the island of La Palma by Liverpool John Moores University in the Spanish Observatorio del Roque de los Muchachos of the Instituto de Astrofisica de Canarias with financial support from the UK Science and Technology Facilities Council. Partly based on observations made with the Nordic Optical Telescope, owned in collaboration by the University of Turku and Aarhus University, and operated jointly by Aarhus University, the University of Turku, and the University of Oslo (respectively representing Denmark, Finland, and Norway), the University of Iceland, and Stockholm University at the Observatorio del Roque de los Muchachos, La Palma, Spain, of the Instituto de Astrofisica de Canarias. These data were obtained with ALFOSC, which is provided by the Instituto de Astrofisica de Andalucia (IAA) under a joint agreement with the University of Copenhagen and NOT. Based in part on observations collected at the European Organisation for Astronomical Research in the Southern Hemisphere under ESO programme(s) 106.21U2 and 106.216C. Some of the data presented herein were obtained at the W. M. Keck Observatory, which is operated as a scientific partnership among the California Institute of Technology, the University of California, and NASA; the observatory was made possible by the generous financial support of the W. M. Keck Foundation. A major upgrade of the Kast spectrograph on the Shane 3 m telescope at Lick Observatory was made possible through generous gifts from the Heising-Simons Foundation as well as William and Marina Kast. Research at Lick Observatory is partially supported by a generous gift from Google. We thank the staffs of the various observatories where data were obtained for their assistance.
J.S., S.S., and E.K. acknowledge support from the G.R.E.A.T. research environment funded by Vetenskapsrådet, the Swedish Research Council, under project #2016-06012. The OKC’s participation in ZTF was made possible by the K.A.W. foundation. E.K. also acknowledges support from The Wenner-Gren Foundation. M.M.K. acknowledges generous support from the David and Lucille Packard Foundation. P.R. has received support from the from the European Research Council (ERC) under the European Union’s Horizon 2020 research and innovation programme (grant agreement 759194 – USNAC). The research of Y.Y. is supported through a Benoziyo Prize Postdoctoral Fellowship and a Bengier-Winslow-Robertson Fellowship. T.-W.C. acknowledges EU funding under Marie Skłodowska-Curie grant H2020-MSCA-IF-2018-842471. R.L. acknowledges support from a Marie Skłodowska-Curie Individual Fellowship within the Horizon 2020 European Union (EU) Framework Programme for Research and Innovation (H2020-MSCA-IF-2017-794467). The GROWTH Marshal (Kasliwal et al., 2019) development was supported by the GROWTH project funded by the NSF under grant 1545949. A.V.F.’s group is supported by the Christopher R. Redlich Fund, the Miller Institute for Basic Research in Science (where A.V.F. is a Miller Senior Fellow), and many individual donors. A.G.Y.’s research is supported by the EU via ERC grant No. 725161, the ISF GW excellence center, an IMOS space infrastructure grant and BSF/Transformative and GIF grants, as well as The Benoziyo Endowment Fund for the Advancement of Science, the Deloro Institute for Advanced Research in Space and Optics, The Veronika A. Rabl Physics Discretionary Fund, Minerva, Yeda-Sela and the Schwartz/Reisman Collaborative Science Program; A.G.Y. is the incumbent of the The Arlyn Imberman Professorial Chair.
IRAF is distributed by the National Optical Astronomy Observatories, which are operated by the Association of Universities for Research in Astronomy, Inc., under cooperative agreement with the NSF.
References
- dbs (2021) 2021, DBSP-DRP, GitHub. https://github.com/finagle29/dbsp_drp
- pyn (2021) 2021, PyNOT, GitHub. https://github.com/jkrogager/PyNOT
- Afsariardchi et al. (2021) Afsariardchi, N., Drout, M. R., Khatami, D. K., et al. 2021, ApJ, 918, 89, doi: 10.3847/1538-4357/ac0aeb
- Ahn et al. (2012) Ahn, C. P., Alexandroff, R., Allende Prieto, C., et al. 2012, ApJS, 203, 21, doi: 10.1088/0067-0049/203/2/21
- Anderson (2019) Anderson, J. P. 2019, A&A, 628, A7, doi: 10.1051/0004-6361/201935027
- Appenzeller & Rupprecht (1992) Appenzeller, I., & Rupprecht, G. 1992, The Messenger, 67, 18
- Arcavi et al. (2016) Arcavi, I., Wolf, W. M., Howell, D. A., et al. 2016, ApJ, 819, 35, doi: 10.3847/0004-637X/819/1/35
- Asplund et al. (2009) Asplund, M., Grevesse, N., Sauval, A. J., & Scott, P. 2009, ARA&A, 47, 481, doi: 10.1146/annurev.astro.46.060407.145222
- Barbarino et al. (2021) Barbarino, C., Sollerman, J., Taddia, F., et al. 2021, A&A, 651, A81, doi: 10.1051/0004-6361/202038890
- Barlow et al. (1981) Barlow, M. J., Smith, L. J., & Willis, A. J. 1981, MNRAS, 196, 101, doi: 10.1093/mnras/196.2.101
- Barnsley et al. (2012) Barnsley, R. M., Smith, R. J., & Steele, I. A. 2012, Astronomische Nachrichten, 333, 101, doi: 10.1002/asna.201111634
- Bellm et al. (2019a) Bellm, E. C., Kulkarni, S. R., Graham, M. J., et al. 2019a, PASP, 131, 018002, doi: 10.1088/1538-3873/aaecbe
- Bellm et al. (2019b) Bellm, E. C., Kulkarni, S. R., Barlow, T., et al. 2019b, PASP, 131, 068003, doi: 10.1088/1538-3873/ab0c2a
- Blackburn (1995) Blackburn, J. K. 1995, in Astronomical Society of the Pacific Conference Series, Vol. 77, Astronomical Data Analysis Software and Systems IV, ed. R. A. Shaw, H. E. Payne, & J. J. E. Hayes, 367
- Blagorodnova et al. (2018) Blagorodnova, N., Neill, J. D., Walters, R., et al. 2018, PASP, 130, 035003, doi: 10.1088/1538-3873/aaa53f
- Blanchard et al. (2020) Blanchard, P. K., Berger, E., Nicholl, M., & Villar, V. A. 2020, ApJ, 897, 114, doi: 10.3847/1538-4357/ab9638
- Breeveld et al. (2011) Breeveld, A. A., Landsman, W., Holland, S. T., et al. 2011, in American Institute of Physics Conference Series, Vol. 1358, American Institute of Physics Conference Series, ed. J. E. McEnery, J. L. Racusin, & N. Gehrels, 373–376, doi: 10.1063/1.3621807
- Bruch et al. (2021) Bruch, R. J., Gal-Yam, A., Schulze, S., et al. 2021, ApJ, 912, 46, doi: 10.3847/1538-4357/abef05
- Burrows et al. (2005) Burrows, D. N., Hill, J. E., Nousek, J. A., et al. 2005, Space Sci. Rev., 120, 165, doi: 10.1007/s11214-005-5097-2
- Calzetti et al. (2000) Calzetti, D., Armus, L., Bohlin, R. C., et al. 2000, ApJ, 533, 682, doi: 10.1086/308692
- Cao et al. (2013) Cao, Y., Kasliwal, M. M., Arcavi, I., et al. 2013, ApJ, 775, L7, doi: 10.1088/2041-8205/775/1/L7
- Cenko et al. (2006) Cenko, S. B., Fox, D. B., Moon, D.-S., et al. 2006, PASP, 118, 1396, doi: 10.1086/508366
- Chabrier (2003) Chabrier, G. 2003, PASP, 115, 763, doi: 10.1086/376392
- Chen et al. (2018) Chen, T. W., Inserra, C., Fraser, M., et al. 2018, ApJ, 867, L31, doi: 10.3847/2041-8213/aaeb2e
- Chugai (2009) Chugai, N. N. 2009, MNRAS, 400, 866, doi: 10.1111/j.1365-2966.2009.15506.x
- Cikota et al. (2017) Cikota, A., Patat, F., Cikota, S., & Faran, T. 2017, MNRAS, 464, 4146, doi: 10.1093/mnras/stw2545
- Clocchiatti et al. (2011) Clocchiatti, A., Suntzeff, N. B., Covarrubias, R., & Candia, P. 2011, AJ, 141, 163, doi: 10.1088/0004-6256/141/5/163
- Clocchiatti & Wheeler (1997) Clocchiatti, A., & Wheeler, J. C. 1997, ApJ, 491, 375, doi: 10.1086/304961
- Coppejans et al. (2020) Coppejans, D. L., Margutti, R., Terreran, G., et al. 2020, ApJ, 895, L23, doi: 10.3847/2041-8213/ab8cc7
- Corsi et al. (2014) Corsi, A., Ofek, E. O., Gal-Yam, A., et al. 2014, ApJ, 782, 42, doi: 10.1088/0004-637X/782/1/42
- Crowther (2007) Crowther, P. A. 2007, ARA&A, 45, 177, doi: 10.1146/annurev.astro.45.051806.110615
- De et al. (2018a) De, K., Kasliwal, M. M., Ofek, E. O., et al. 2018a, Science, 362, 201, doi: 10.1126/science.aas8693
- De et al. (2018b) De, K., Kasliwal, M. M., Cantwell, T., et al. 2018b, ApJ, 866, 72, doi: 10.3847/1538-4357/aadf8e
- De et al. (2020) De, K., Kasliwal, M. M., Tzanidakis, A., et al. 2020, ApJ, 905, 58, doi: 10.3847/1538-4357/abb45c
- Dekany et al. (2020) Dekany, R., Smith, R. M., Riddle, R., et al. 2020, PASP, 132, 038001, doi: 10.1088/1538-3873/ab4ca2
- Dessart et al. (2012) Dessart, L., Hillier, D. J., Li, C., & Woosley, S. 2012, MNRAS, 424, 2139, doi: 10.1111/j.1365-2966.2012.21374.x
- Drout et al. (2014) Drout, M. R., Chornock, R., Soderberg, A. M., et al. 2014, ApJ, 794, 23, doi: 10.1088/0004-637X/794/1/23
- Duev et al. (2019) Duev, D. A., Mahabal, A., Masci, F. J., et al. 2019, MNRAS, 489, 3582, doi: 10.1093/mnras/stz2357
- Eldridge et al. (2013) Eldridge, J. J., Fraser, M., Smartt, S. J., Maund, J. R., & Crockett, R. M. 2013, MNRAS, 436, 774, doi: 10.1093/mnras/stt1612
- Eldridge & Maund (2016) Eldridge, J. J., & Maund, J. R. 2016, MNRAS, 461, L117, doi: 10.1093/mnrasl/slw099
- Evans et al. (2007) Evans, P. A., Beardmore, A. P., Page, K. L., et al. 2007, A&A, 469, 379, doi: 10.1051/0004-6361:20077530
- Evans et al. (2009) —. 2009, MNRAS, 397, 1177, doi: 10.1111/j.1365-2966.2009.14913.x
- Filippenko (1982) Filippenko, A. V. 1982, PASP, 94, 715, doi: 10.1086/131052
- Filippenko (1997) —. 1997, ARA&A, 35, 309, doi: 10.1146/annurev.astro.35.1.309
- Fitzpatrick (1999) Fitzpatrick, E. L. 1999, PASP, 111, 63, doi: 10.1086/316293
- Foley et al. (2007) Foley, R. J., Smith, N., Ganeshalingam, M., et al. 2007, ApJ, 657, L105, doi: 10.1086/513145
- Fox & Smith (2019) Fox, O. D., & Smith, N. 2019, MNRAS, 488, 3772, doi: 10.1093/mnras/stz1925
- Fraser et al. (2011) Fraser, M., Ergon, M., Eldridge, J. J., et al. 2011, MNRAS, 417, 1417, doi: 10.1111/j.1365-2966.2011.19370.x
- Fraser et al. (2021) Fraser, M., Stritzinger, M. D., Brennan, S. J., et al. 2021, arXiv e-prints, arXiv:2108.07278. https://arxiv.org/abs/2108.07278
- Fremling et al. (2019) Fremling, C., Dugas, A., & Sharma, Y. 2019, Transient Name Server Classification Report, 2019-188, 1
- Fremling et al. (2016) Fremling, C., Sollerman, J., Taddia, F., et al. 2016, A&A, 593, A68, doi: 10.1051/0004-6361/201628275
- Fremling et al. (2020) Fremling, C., Miller, A. A., Sharma, Y., et al. 2020, ApJ, 895, 32, doi: 10.3847/1538-4357/ab8943
- Gagliano et al. (2021) Gagliano, A., Izzo, L., Kilpatrick, C. D., et al. 2021, arXiv e-prints, arXiv:2105.09963. https://arxiv.org/abs/2105.09963
- Gal-Yam (2017) Gal-Yam, A. 2017, Observational and Physical Classification of Supernovae, ed. A. W. Alsabti & P. Murdin, 195, doi: 10.1007/978-3-319-21846-5_35
- Gal-Yam & Leonard (2009) Gal-Yam, A., & Leonard, D. C. 2009, Nature, 458, 865, doi: 10.1038/nature07934
- Gal-Yam et al. (2021a) Gal-Yam, A., Yaron, O., Pastorello, A., et al. 2021a, Transient Name Server AstroNote, 76, 1
- Gal-Yam et al. (2007) Gal-Yam, A., Leonard, D. C., Fox, D. B., et al. 2007, ApJ, 656, 372, doi: 10.1086/510523
- Gal-Yam et al. (2009) Gal-Yam, A., Mazzali, P., Ofek, E. O., et al. 2009, Nature, 462, 624, doi: 10.1038/nature08579
- Gal-Yam et al. (2021b) Gal-Yam, A., Bruch, R., Schulze, S., et al. 2021b, Nature, accepted
- Gamow (1943) Gamow, G. 1943, ApJ, 98, 500, doi: 10.1086/144581
- Gehrels et al. (2004) Gehrels, N., Chincarini, G., Giommi, P., et al. 2004, ApJ, 611, 1005, doi: 10.1086/422091
- Graham et al. (2019) Graham, M. J., Kulkarni, S. R., Bellm, E. C., et al. 2019, PASP, 131, 078001, doi: 10.1088/1538-3873/ab006c
- Graur et al. (2011) Graur, O., Poznanski, D., Maoz, D., et al. 2011, MNRAS, 417, 916, doi: 10.1111/j.1365-2966.2011.19287.x
- Green et al. (2012) Green, J. C., Froning, C. S., Osterman, S., et al. 2012, ApJ, 744, 60, doi: 10.1088/0004-637X/744/1/60
- Hainich et al. (2014) Hainich, R., Rühling, U., Todt, H., et al. 2014, A&A, 565, A27, doi: 10.1051/0004-6361/201322696
- Hamuy (2003) Hamuy, M. 2003, ApJ, 582, 905, doi: 10.1086/344689
- HI4PI Collaboration et al. (2016) HI4PI Collaboration, Ben Bekhti, N., Flöer, L., et al. 2016, A&A, 594, A116, doi: 10.1051/0004-6361/201629178
- Ho et al. (2019a) Ho, A. Y. Q., Goldstein, D. A., Schulze, S., et al. 2019a, ApJ, 887, 169, doi: 10.3847/1538-4357/ab55ec
- Ho et al. (2019b) Ho, A. Y. Q., Phinney, E. S., Ravi, V., et al. 2019b, ApJ, 871, 73, doi: 10.3847/1538-4357/aaf473
- Ho et al. (2020a) Ho, A. Y. Q., Perley, D. A., Kulkarni, S. R., et al. 2020a, ApJ, 895, 49, doi: 10.3847/1538-4357/ab8bcf
- Ho et al. (2020b) Ho, A. Y. Q., Kulkarni, S. R., Perley, D. A., et al. 2020b, ApJ, 902, 86, doi: 10.3847/1538-4357/aba630
- Ho et al. (2021a) Ho, A. Y. Q., Perley, D. A., Gal-Yam, A., et al. 2021a, arXiv e-prints, arXiv:2105.08811. https://arxiv.org/abs/2105.08811
- Ho et al. (2021b) Ho, A. Y. Q., Margalit, B., Bremer, M., et al. 2021b, arXiv e-prints, arXiv:2110.05490. https://arxiv.org/abs/2110.05490
- Höflich (1991) Höflich, P. 1991, A&A, 246, 481
- Högbom (1974) Högbom, J. A. 1974, A&AS, 15, 417
- Hook et al. (2004) Hook, I. M., Jørgensen, I., Allington-Smith, J. R., et al. 2004, PASP, 116, 425, doi: 10.1086/383624
- Horesh et al. (2020) Horesh, A., Sfaradi, I., Ergon, M., et al. 2020, ApJ, 903, 132, doi: 10.3847/1538-4357/abbd38
- Inserra (2019) Inserra, C. 2019, Nature Astronomy, 3, 697, doi: 10.1038/s41550-019-0854-4
- Ivezić et al. (2019) Ivezić, Ž., Kahn, S. M., Tyson, J. A., et al. 2019, ApJ, 873, 111, doi: 10.3847/1538-4357/ab042c
- Jerkstrand et al. (2017) Jerkstrand, A., Smartt, S. J., Inserra, C., et al. 2017, ApJ, 835, 13, doi: 10.3847/1538-4357/835/1/13
- Karamehmetoglu et al. (2021) Karamehmetoglu, E., Fransson, C., Sollerman, J., et al. 2021, A&A, 649, A163, doi: 10.1051/0004-6361/201936308
- Kasliwal et al. (2019) Kasliwal, M. M., Cannella, C., Bagdasaryan, A., et al. 2019, PASP, 131, 038003, doi: 10.1088/1538-3873/aafbc2
- Kilpatrick et al. (2018) Kilpatrick, C. D., Takaro, T., Foley, R. J., et al. 2018, MNRAS, 480, 2072, doi: 10.1093/mnras/sty2022
- Kilpatrick et al. (2021) Kilpatrick, C. D., Drout, M. R., Auchettl, K., et al. 2021, MNRAS, 504, 2073, doi: 10.1093/mnras/stab838
- Kirshner et al. (2010) Kirshner, R., Blondin, S., Chevalier, R., et al. 2010, The Astronomer’s Telegram, 2513, 1
- Kleiser et al. (2018a) Kleiser, I., Fuller, J., & Kasen, D. 2018a, MNRAS, 481, L141, doi: 10.1093/mnrasl/sly180
- Kleiser et al. (2018b) Kleiser, I. K. W., Kasen, D., & Duffell, P. C. 2018b, MNRAS, 475, 3152, doi: 10.1093/mnras/stx3321
- Kulkarni et al. (1998) Kulkarni, S. R., Frail, D. A., Wieringa, M. H., et al. 1998, Nature, 395, 663, doi: 10.1038/27139
- Kushnir (2015) Kushnir, D. 2015, arXiv e-prints, arXiv:1506.02655. https://arxiv.org/abs/1506.02655
- Lang (2014) Lang, D. 2014, AJ, 147, 108, doi: 10.1088/0004-6256/147/5/108
- Langer et al. (2007) Langer, N., Norman, C. A., de Koter, A., et al. 2007, A&A, 475, L19, doi: 10.1051/0004-6361:20078482
- Lawrence et al. (2007) Lawrence, A., Warren, S. J., Almaini, O., et al. 2007, MNRAS, 379, 1599, doi: 10.1111/j.1365-2966.2007.12040.x
- Leja et al. (2017) Leja, J., Johnson, B. D., Conroy, C., van Dokkum, P. G., & Byler, N. 2017, ApJ, 837, 170, doi: 10.3847/1538-4357/aa5ffe
- Leung et al. (2019) Leung, S.-C., Nomoto, K., & Blinnikov, S. 2019, ApJ, 887, 72, doi: 10.3847/1538-4357/ab4fe5
- Li et al. (2012) Li, C., Hillier, D. J., & Dessart, L. 2012, MNRAS, 426, 1671, doi: 10.1111/j.1365-2966.2012.21198.x
- Lyman et al. (2016) Lyman, J. D., Bersier, D., James, P. A., et al. 2016, MNRAS, 457, 328, doi: 10.1093/mnras/stv2983
- Lyman et al. (2020) Lyman, J. D., Galbany, L., Sánchez, S. F., et al. 2020, MNRAS, 495, 992, doi: 10.1093/mnras/staa1243
- MacFadyen et al. (2001) MacFadyen, A. I., Woosley, S. E., & Heger, A. 2001, ApJ, 550, 410, doi: 10.1086/319698
- Mahabal et al. (2019) Mahabal, A., Rebbapragada, U., Walters, R., et al. 2019, PASP, 131, 038002, doi: 10.1088/1538-3873/aaf3fa
- Mainzer et al. (2014) Mainzer, A., Bauer, J., Cutri, R. M., et al. 2014, ApJ, 792, 30, doi: 10.1088/0004-637X/792/1/30
- Maoz & Badenes (2010) Maoz, D., & Badenes, C. 2010, MNRAS, 407, 1314, doi: 10.1111/j.1365-2966.2010.16988.x
- Margutti et al. (2019) Margutti, R., Metzger, B. D., Chornock, R., et al. 2019, ApJ, 872, 18, doi: 10.3847/1538-4357/aafa01
- Marino et al. (2013) Marino, R. A., Rosales-Ortega, F. F., Sánchez, S. F., et al. 2013, A&A, 559, A114, doi: 10.1051/0004-6361/201321956
- Masci et al. (2019) Masci, F. J., Laher, R. R., Rusholme, B., et al. 2019, PASP, 131, 018003, doi: 10.1088/1538-3873/aae8ac
- Mattila et al. (2008) Mattila, S., Meikle, W. P. S., Lundqvist, P., et al. 2008, MNRAS, 389, 141, doi: 10.1111/j.1365-2966.2008.13516.x
- Mauerhan et al. (2013) Mauerhan, J. C., Smith, N., Filippenko, A. V., et al. 2013, MNRAS, 430, 1801, doi: 10.1093/mnras/stt009
- Maund (2018) Maund, J. R. 2018, MNRAS, 476, 2629, doi: 10.1093/mnras/sty093
- Maund et al. (2007) Maund, J. R., Wheeler, J. C., Patat, F., et al. 2007, MNRAS, 381, 201, doi: 10.1111/j.1365-2966.2007.12230.x
- McBrien et al. (2019) McBrien, O. R., Smartt, S. J., Chen, T.-W., et al. 2019, ApJ, 885, L23, doi: 10.3847/2041-8213/ab4dae
- McMullin et al. (2007) McMullin, J. P., Waters, B., Schiebel, D., Young, W., & Golap, K. 2007, in Astronomical Society of the Pacific Conference Series, Vol. 376, Astronomical Data Analysis Software and Systems XVI, ed. R. A. Shaw, F. Hill, & D. J. Bell (Astronomical Society of the Pacific), 127
- Meisner et al. (2017) Meisner, A. M., Lang, D., & Schlegel, D. J. 2017, AJ, 153, 38, doi: 10.3847/1538-3881/153/1/38
- Miller & Stone (1993) Miller, J. S., & Stone, R. P. S. 1993, in Lick Obs. Tech. Rep. 66.
- Modjaz et al. (2009) Modjaz, M., Li, W., Butler, N., et al. 2009, ApJ, 702, 226, doi: 10.1088/0004-637X/702/1/226
- Moriya et al. (2010) Moriya, T., Tominaga, N., Tanaka, M., et al. 2010, ApJ, 719, 1445, doi: 10.1088/0004-637X/719/2/1445
- Narayana Bhat et al. (2016) Narayana Bhat, P., Meegan, C. A., von Kienlin, A., et al. 2016, ApJS, 223, 28, doi: 10.3847/0067-0049/223/2/28
- Nicholl et al. (2015) Nicholl, M., Smartt, S. J., Jerkstrand, A., et al. 2015, MNRAS, 452, 3869, doi: 10.1093/mnras/stv1522
- O’Connor & Ott (2011) O’Connor, E., & Ott, C. D. 2011, ApJ, 730, 70, doi: 10.1088/0004-637X/730/2/70
- Oke & Gunn (1982) Oke, J. B., & Gunn, J. E. 1982, PASP, 94, 586, doi: 10.1086/131027
- Oke & Gunn (1983) —. 1983, ApJ, 266, 713, doi: 10.1086/160817
- Oke et al. (1995) Oke, J. B., Cohen, J. G., Carr, M., et al. 1995, PASP, 107, 375, doi: 10.1086/133562
- Pastorello et al. (2007) Pastorello, A., Smartt, S. J., Mattila, S., et al. 2007, Nature, 447, 829, doi: 10.1038/nature05825
- Pastorello et al. (2008) Pastorello, A., Mattila, S., Zampieri, L., et al. 2008, MNRAS, 389, 113, doi: 10.1111/j.1365-2966.2008.13602.x
- Pastorello et al. (2015a) Pastorello, A., Benetti, S., Brown, P. J., et al. 2015a, MNRAS, 449, 1921, doi: 10.1093/mnras/stu2745
- Pastorello et al. (2015b) Pastorello, A., Prieto, J. L., Elias-Rosa, N., et al. 2015b, MNRAS, 453, 3649, doi: 10.1093/mnras/stv1812
- Pastorello et al. (2021) Pastorello, A., Vogl, C., Taubenberger, S., et al. 2021, Transient Name Server AstroNote, 71, 1
- Patat & Romaniello (2006) Patat, F., & Romaniello, M. 2006, PASP, 118, 146, doi: 10.1086/497581
- Patat et al. (2001) Patat, F., Cappellaro, E., Danziger, J., et al. 2001, ApJ, 555, 900, doi: 10.1086/321526
- Patterson et al. (2019) Patterson, M. T., Bellm, E. C., Rusholme, B., et al. 2019, PASP, 131, 018001, doi: 10.1088/1538-3873/aae904
- Peng et al. (2002) Peng, C. Y., Ho, L. C., Impey, C. D., & Rix, H.-W. 2002, AJ, 124, 266, doi: 10.1086/340952
- Peng et al. (2010) —. 2010, AJ, 139, 2097, doi: 10.1088/0004-6256/139/6/2097
- Perley et al. (2021a) Perley, D., Yao, Y., Schulze, S., et al. 2021a, Transient Name Server AstroNote, 62, 1
- Perley (2019) Perley, D. A. 2019, PASP, 131, 084503, doi: 10.1088/1538-3873/ab215d
- Perley et al. (2019) Perley, D. A., Mazzali, P. A., Yan, L., et al. 2019, MNRAS, 484, 1031, doi: 10.1093/mnras/sty3420
- Perley et al. (2020) Perley, D. A., Fremling, C., Sollerman, J., et al. 2020, ApJ, 904, 35, doi: 10.3847/1538-4357/abbd98
- Perley et al. (2021b) Perley, D. A., Ho, A. Y. Q., Yao, Y., et al. 2021b, MNRAS (submitted), arXiv:2103.01968. https://arxiv.org/abs/2103.01968
- Piascik et al. (2014) Piascik, A. S., Steele, I. A., Bates, S. D., et al. 2014, in Society of Photo-Optical Instrumentation Engineers (SPIE) Conference Series, Vol. 9147, Proc. SPIE, 91478H, doi: 10.1117/12.2055117
- Piran et al. (2019) Piran, T., Nakar, E., Mazzali, P., & Pian, E. 2019, ApJ, 871, L25, doi: 10.3847/2041-8213/aaffce
- Pritchard et al. (2021) Pritchard, T. A., Bensch, K., Modjaz, M., et al. 2021, ApJ, 915, 121, doi: 10.3847/1538-4357/ac00bc
- Prochaska et al. (2020) Prochaska, J., Hennawi, J., Westfall, K., et al. 2020, The Journal of Open Source Software, 5, 2308, doi: 10.21105/joss.02308
- Pursiainen et al. (2018) Pursiainen, M., Childress, M., Smith, M., et al. 2018, MNRAS, 481, 894, doi: 10.1093/mnras/sty2309
- Rest et al. (2018) Rest, A., Garnavich, P. M., Khatami, D., et al. 2018, Nature Astronomy, 2, 307, doi: 10.1038/s41550-018-0423-2
- Richmond et al. (1996) Richmond, M. W., van Dyk, S. D., Ho, W., et al. 1996, AJ, 111, 327, doi: 10.1086/117785
- Roming et al. (2005) Roming, P. W. A., Kennedy, T. E., Mason, K. O., et al. 2005, Space Sci. Rev., 120, 95, doi: 10.1007/s11214-005-5095-4
- Rosslowe & Crowther (2015) Rosslowe, C. K., & Crowther, P. A. 2015, MNRAS, 447, 2322, doi: 10.1093/mnras/stu2525
- Sana et al. (2012) Sana, H., de Mink, S. E., de Koter, A., et al. 2012, Science, 337, 444, doi: 10.1126/science.1223344
- Sander et al. (2019) Sander, A. A. C., Hamann, W. R., Todt, H., et al. 2019, A&A, 621, A92, doi: 10.1051/0004-6361/201833712
- Schlafly & Finkbeiner (2011) Schlafly, E. F., & Finkbeiner, D. P. 2011, ApJ, 737, 103, doi: 10.1088/0004-637X/737/2/103
- Schulze et al. (2021) Schulze, S., Yaron, O., Sollerman, J., et al. 2021, ApJS, 255, 29, doi: 10.3847/1538-4365/abff5e
- Serkowski et al. (1975) Serkowski, K., Mathewson, D. S., & Ford, V. L. 1975, ApJ, 196, 261, doi: 10.1086/153410
- Sharon & Kushnir (2020) Sharon, A., & Kushnir, D. 2020, MNRAS, 496, 4517, doi: 10.1093/mnras/staa1745
- Silverman et al. (2012) Silverman, J. M., Foley, R. J., Filippenko, A. V., et al. 2012, MNRAS, 425, 1789, doi: 10.1111/j.1365-2966.2012.21270.x
- Simmons & Stewart (1985) Simmons, J. F. L., & Stewart, B. G. 1985, A&A, 142, 100
- Smartt (2009) Smartt, S. J. 2009, ARA&A, 47, 63, doi: 10.1146/annurev-astro-082708-101737
- Smartt (2015) —. 2015, PASA, 32, e016, doi: 10.1017/pasa.2015.17
- Smith (2014) Smith, N. 2014, ARA&A, 52, 487, doi: 10.1146/annurev-astro-081913-040025
- Smith (2017a) —. 2017a, Philosophical Transactions of the Royal Society of London Series A, 375, 20160268, doi: 10.1098/rsta.2016.0268
- Smith (2017b) —. 2017b, Interacting Supernovae: Types IIn and Ibn, ed. A. W. Alsabti & P. Murdin (Springer), 403, doi: 10.1007/978-3-319-21846-5_38
- Smith et al. (2008) Smith, N., Foley, R. J., & Filippenko, A. V. 2008, ApJ, 680, 568, doi: 10.1086/587860
- Smith et al. (2011) Smith, N., Li, W., Filippenko, A. V., & Chornock, R. 2011, MNRAS, 412, 1522, doi: 10.1111/j.1365-2966.2011.17229.x
- Smith et al. (2014) Smith, N., Mauerhan, J. C., & Prieto, J. L. 2014, MNRAS, 438, 1191, doi: 10.1093/mnras/stt2269
- Smith et al. (2009) Smith, N., Silverman, J. M., Chornock, R., et al. 2009, ApJ, 695, 1334, doi: 10.1088/0004-637X/695/2/1334
- Sollerman et al. (1998) Sollerman, J., Cumming, R. J., & Lundqvist, P. 1998, ApJ, 493, 933, doi: 10.1086/305163
- Srivastav et al. (2014) Srivastav, S., Anupama, G. C., & Sahu, D. K. 2014, MNRAS, 445, 1932, doi: 10.1093/mnras/stu1878
- Steele et al. (2004) Steele, I. A., Smith, R. J., Rees, P. C., et al. 2004, in Society of Photo-Optical Instrumentation Engineers (SPIE) Conference Series, Vol. 5489, Proc. SPIE, ed. J. Oschmann, Jacobus M., 679–692, doi: 10.1117/12.551456
- Stritzinger et al. (2009) Stritzinger, M., Mazzali, P., Phillips, M. M., et al. 2009, ApJ, 696, 713, doi: 10.1088/0004-637X/696/1/713
- Strotjohann et al. (2021) Strotjohann, N. L., Ofek, E. O., Gal-Yam, A., et al. 2021, ApJ, 907, 99, doi: 10.3847/1538-4357/abd032
- Sukhbold & Woosley (2014) Sukhbold, T., & Woosley, S. E. 2014, ApJ, 783, 10, doi: 10.1088/0004-637X/783/1/10
- Taddia et al. (2019) Taddia, F., Sollerman, J., Fremling, C., et al. 2019, A&A, 621, A71, doi: 10.1051/0004-6361/201834429
- Tanaka et al. (2009) Tanaka, M., Tominaga, N., Nomoto, K., et al. 2009, ApJ, 692, 1131, doi: 10.1088/0004-637X/692/2/1131
- Tanaka et al. (2016) Tanaka, M., Tominaga, N., Morokuma, T., et al. 2016, ApJ, 819, 5, doi: 10.3847/0004-637X/819/1/5
- Tauris et al. (2013) Tauris, T. M., Langer, N., Moriya, T. J., et al. 2013, ApJ, 778, L23, doi: 10.1088/2041-8205/778/2/L23
- Tody (1986) Tody, D. 1986, in Society of Photo-Optical Instrumentation Engineers (SPIE) Conference Series, Vol. 627, Instrumentation in astronomy VI, ed. D. L. Crawford, 733, doi: 10.1117/12.968154
- Van Dyk et al. (2018) Van Dyk, S. D., Zheng, W., Brink, T. G., et al. 2018, ApJ, 860, 90, doi: 10.3847/1538-4357/aac32c
- Vink et al. (2001) Vink, J. S., de Koter, A., & Lamers, H. J. G. L. M. 2001, A&A, 369, 574, doi: 10.1051/0004-6361:20010127
- Wang et al. (1997) Wang, L., Wheeler, J. C., & Höflich, P. 1997, ApJ, 476, L27, doi: 10.1086/310495
- Whitesides et al. (2017) Whitesides, L., Lunnan, R., Kasliwal, M. M., et al. 2017, ApJ, 851, 107, doi: 10.3847/1538-4357/aa99de
- Wieringa et al. (1999) Wieringa, M. H., Kulkarni, S. R., & Frail, D. A. 1999, A&AS, 138, 467, doi: 10.1051/aas:1999312
- Woodgate et al. (1998) Woodgate, B. E., Kimble, R. A., Bowers, C. W., et al. 1998, PASP, 110, 1183, doi: 10.1086/316243
- Woosley (1993) Woosley, S. E. 1993, ApJ, 405, 273, doi: 10.1086/172359
- Woosley (2017) —. 2017, ApJ, 836, 244, doi: 10.3847/1538-4357/836/2/244
- Woosley & Heger (2015) Woosley, S. E., & Heger, A. 2015, The Deaths of Very Massive Stars, ed. J. S. Vink, Vol. 412 (Springer), 199, doi: 10.1007/978-3-319-09596-7_7
- Wright et al. (2016) Wright, A. H., Robotham, A. S. G., Bourne, N., et al. 2016, MNRAS, 460, 765, doi: 10.1093/mnras/stw832
- Wright et al. (2010) Wright, E. L., Eisenhardt, P. R. M., Mainzer, A. K., et al. 2010, AJ, 140, 1868, doi: 10.1088/0004-6256/140/6/1868
- Yang et al. (2020) Yang, Y., Hoeflich, P., Baade, D., et al. 2020, ApJ, 902, 46, doi: 10.3847/1538-4357/aba759
- Yao et al. (2020) Yao, Y., De, K., Kasliwal, M. M., et al. 2020, ApJ, 900, 46, doi: 10.3847/1538-4357/abaa3d
- Yaron & Gal-Yam (2012) Yaron, O., & Gal-Yam, A. 2012, PASP, 124, 668, doi: 10.1086/666656
- Yaron et al. (2017) Yaron, O., Perley, D. A., Gal-Yam, A., et al. 2017, Nature Physics, 13, 510, doi: 10.1038/nphys4025
- Zampieri et al. (2003) Zampieri, L., Pastorello, A., Turatto, M., et al. 2003, MNRAS, 338, 711, doi: 10.1046/j.1365-8711.2003.06082.x
- Zapartas et al. (2021) Zapartas, E., Renzo, M., Fragos, T., et al. 2021, arXiv e-prints, arXiv:2106.05228. https://arxiv.org/abs/2106.05228