The Galaxy Population of the Core of Coma Cluster
Abstract
In this paper we present the structural properties and morphology of galaxies in the central region of the Coma Cluster brighter than in the band. from the HST/ACS Coma Cluster Treasury Survey. Using mainly spectroscopic redshifts, we find 132 members from our sample of 219 galaxies. In our sample of 132 members, we find 51 non-dwarfs and 81 dwarfs and amongst our 32 non-members, we find 4 dwarfs and 28 non dwarfs. We do not have redshifts for the remaining 55 galaxies. We present bulge-disc decomposition of the sample using GALFIT and obtain parameters for our sample. Using visual inspection of residuals, we do a a morphological classification of the galaxies. We studied the relation of morphological types with Bulge to Total Light Ratio (), color magnitude relation (CMR), Sérsic index (), Kormendy relation and cross-correlations between these parameters for the bulges and galaxies. This work helps us understand important relations between various parameters like , color and as well as insights into the merger history of these galaxies in terms of their positions in the Kormendy Diagram and their Sérsic indices. Using statistical methods, we find that the there are significantly more E/SO, ESOs galaxies in the member population compared to non-members.
keywords:
galaxies: clusters: individual: Coma, galaxies: elliptical and lenticular, cD, galaxies: evolution1 Introduction
The morphology of a galaxy is the result of galaxy formation and evolution, interaction with the environment, internal perturbations and dark matter interactions (Sandage et al., 1975; Buta, 2013). Visual inspection is the primary method to classify galaxies, for example, in the Galaxy Zoo project (Lintott et al., 2008). To quantify morphology, structural properties of galaxies are found by fitting radial profiles like Sérsic, Nuker, Gaussian, King etc. to the luminosity profiles of galaxies.
The morphology-density relation (Dressler, 1980; Binney & Merrifield, 1998) suggests that the number of elliptical galaxies increases with the richness of the galaxy cluster. Hubble & Humason (1931); Fasano et al. (2000); Helsdon & Ponman (2003); Deng et al. (2009) found that early-type galaxies are more abundant in clusters while late-type galaxies are more prevalent in the field. Correlations between morphology and structural parameters like effective radius (), disk-scale length (, bulge to total light ratio () and Sérsic index () have been studied (Gutiérrez et al., 2004; Hoyos et al., 2011; Weinzirl et al., 2014; Marinova et al., 2012). Some studies have shown that high-luminosity galaxies are preferably early-type galaxies (E/SO)111Morphological types: central Dominant (cD) Elliptical/Lenticular (E/SO), Elliptical/Barred Lenticular (E/SBO), Lenticular (SO), Barred Lenticular (SBO), Spirals (Sp), Barred Spirals (SBp), Irregular (Irr). (Blanton et al., 2003; Buta, 2013). Morphological transformations can be driven by mergers both major and minor and/or gravitational interactions with neighbours.
Galaxy clusters are one of the largest structures in the universe which consists of hundreds to thousands of gravitationally bound galaxies with typical masses ranging from . There are three types of galaxy clusters: cD, spiral-rich and spiral-poor (Oemler, 1974). Clusters with cD galaxies are rich in ellipticals, spiral-rich clusters have compositions similar to that of the field and spiral-poor clusters are dominated by SO galaxies. The above paper suggested that spiral-poor clusters represent a later evolutionary state of spiral-rich clusters, but cD clusters are intrinsically different.
The Coma Cluster is a very rich and dense cluster at a redshift of 0.023 which corresponds to an approximate distance of 100 Mpc (Hammer et al., 2010). This is one of the most suitable clusters to study luminosity, environment and morphological classification of galaxies. Coma is a cD type cluster whose E:S0:Sp ratio is 3:4:2 (Oemler, 1974). Extensive work has been done on morphological studies of galaxies in the Coma Cluster (Andreon, 1996; Gerbal et al., 1997; Kashikawa et al., 1998; Mehlert et al., 2000; Komiyama et al., 2002; Gutiérrez et al., 2004; Michard, R. & Andreon, S., 2008; Weinzirl et al., 2014; Marinova et al., 2012; Head et al., 2015).
Gutiérrez et al. (2004) used data from the Issac Newton Telescope (INT) and studied galaxy properties using the IRAF ellipse task. Aguerri et al. (2004) classified galaxies based on parameter for INT data by using Monte Carlo simulations to get structural properties. Hoyos et al. (2011) and Marinova et al. (2012) have used HST-ACS data. Hoyos et al. (2011) made a comparison of the results of GALFIT and GIM2D for the complete sample using single Sérsic fits without considering membership criteria but clearly indicated GALFIT as preferable. Marinova et al. (2012) did bulge-disk and bar decomposition of galaxies using GALFIT only for members.
In this paper, we make a detailed study of galaxy morphology using visual inspection of the residuals from single Sérsic profiles as well as bulge-disk (Sérsic + exponential) decomposition. We compare the structural and photometric properties of the disc and bulge of the member and the non-member galaxy population in the central core of the Coma Cluster (within 0.5 Mpc ). Updated membership using more recent spectroscopic data has been used in this analysis. We also make a detailed study of the morphological parameters , Sérsic index , color, surface brightness and their correlations for our sample. This kind of analysis of HST-ACS data has not been done by previous authors. These results give us a deeper understanding of galaxy origin, evolution, merger history and their dependence on environment in the core of Coma Cluster.
The paper is structured as follows: Section 1 of the paper gives a brief introduction and a description of the problem. Section 2 describes the HST-ACS observations. Section 3 describes the Membership data and sample selection. Section 4 describes the two dimensional decomposition and the GALFIT results used to get structural properties of galaxies by fitting functions to the luminosity profiles. Section 5 describes the results and discussions and Section 6 presents the conclusions of our paper.
2 Observations
The Coma Cluster is one of the nearest rich clusters of galaxies and was the target of a deep two passband Å and Å imaging survey of the HST-ACS Treasury program (Carter et al., 2008).
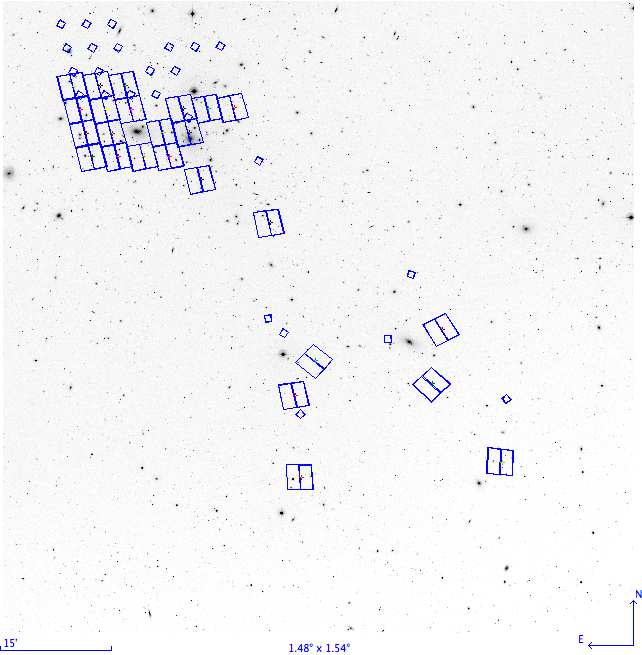
We have used publicly available data from the HST-ACS Coma Cluster Treasury Survey data release 2.1 (Carter et al., 2008). The survey was originally designed to cover an area of 740 arcmin2 in regions of varying density of both galaxies and intergalactic medium within the cluster (Fig. 1). However, due to an ACS failure on January 27th 2007, the survey is only 28% complete, with 21 ACS pointings (230 arcmin2) and partial data for a further 4 pointings (44 arcmin2). Nineteen tiles out of twenty-five are located within 0.5 Mpc and the remaining 6 tiles are located between 0.9 Mpc and 1.75 Mpc southwest of the center of Coma Cluster. NGC 4874 is the one of the cD galaxies located near the center of the cluster and is in our sample. NGC 4889 is the other cD galaxy in the cluster, but is absent in our sample as its observations were not done. The predicted survey depth for detections for optimal photometry of point sources is in filter and in the filter.
For extended sources, the predicted limits for a 1 arcsec2 region are arcsec-2 in and arcsec-2 in .
The SourceExtractor catalogs (SExtractor version 2.5; Bertin & Arnouts (1996)) for the 25 fields in and passbands and the science images are available at archive.stsci.edu/prepds/coma/datalist2.1.html. We have used data for the band, which ensures the deepest data for structural and luminosity function studies (Carter et al., 2008).
3 Membership and Sample Selection
We have used published spectroscopic and photometric data to determine membership of galaxies in our sample. Spectroscopic members were selected within the redshift range (Mobasher et al., 2001).
The number of members from various sources for which redshifts are known are: SDSS DR7 Adelman-McCarthy & et al. (2009) (72), SDSS DR12 Alam et al. (2015) (78), Mobasher et al. (2001) (68), Michard, R. & Andreon, S. (2008)(49), (Mahajan et al. (2011, 2010)) (33), Chiboucas et al. (2011) (9), (Head et al. (2014, 2015)) (59), and den Brok et al. (2011) (112) (the number in round braces shows the number matched with our sample. It may be noted that redshifts for single galaxies were obtained from more than one source. In the case of photometric redshifts, Michard, R. & Andreon, S. (2008) was used as it agrees best with spectroscopic values. We have used photometric redshift only for one member galaxy and 13 non-members in our sample.
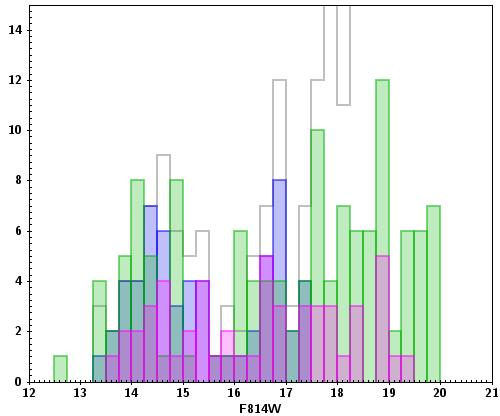
In Fig. 2, we see the available spectroscopic data as a function of magnitude and that spectroscopy can be determined for galaxies brighter than (Mobasher et al., 2001) and den Brok et al. (2014). We have used an limiting magnitude error of and hence was set as the magnitude limit for our study. The SExtractor source catalog by Hammer et al. (2010) has a total of 77,787 objects. In the catalog Hammer et al. (2010), the column called FLAG_OBJ defines the nature of the source where 0-galaxy, 1-star, 2-cosmic rays and 3-image artifacts. We found 594 sources brighter than in the band, of which 219 are galaxies (excluding half-images) with FLAG_OBJ value zero.
Of the 219 galaxies, 132 are members, 32 are non-members and 55 galaxies do not have redshift values. For the 132 cluster members, we have used spectroscopic redshifts for 131 galaxies and photometric redshift for only one galaxy222This was a bright galaxy for which decomposition results seemed reliable. (Michard, R. & Andreon, S., 2008). For 32 non-members, 19 was on the basis of spectroscopic redshift and 13 was on the basis of photometric redshifts (Michard, R. & Andreon, S., 2008).
4 GALFIT and Structural Decomposition
We have done a single Sérsic as well as a two-dimensional bulge disk decomposition using GALFIT (Peng et al., 2002) for 219 objects. We aim to study the bulge and disk properties of the galaxy sample and hence fit the radial profile functions ‘Sérsic’ and ‘Exponential’ for bulge and disk respectively (Peng et al., 2002).
Sérsic profiles are described as,
Where is the effective radius of galaxy such that half of the total flux lies within . is the pixel surface brightness at and is the Sérsic index. The relationship between and effective radius of a Sérsic profile is
where is the scale length. is defined as the radius at which intensity drops by .
Exponential disc profiles are given by,
where is the central surface brightness.
For the Sérsic fit, the index is a free parameter and for the disk, we fix .
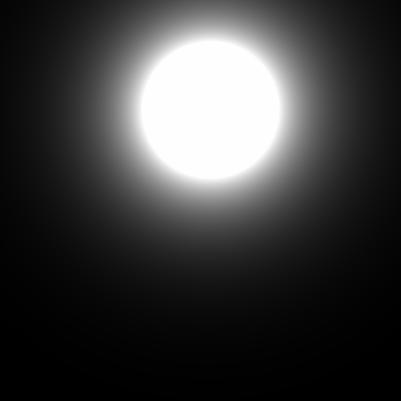
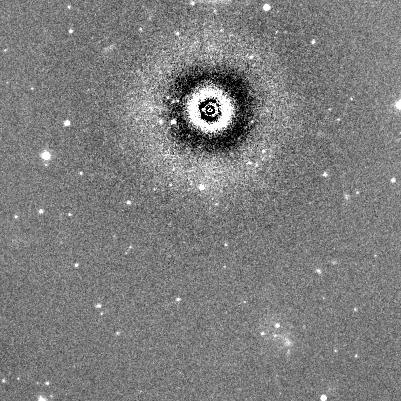
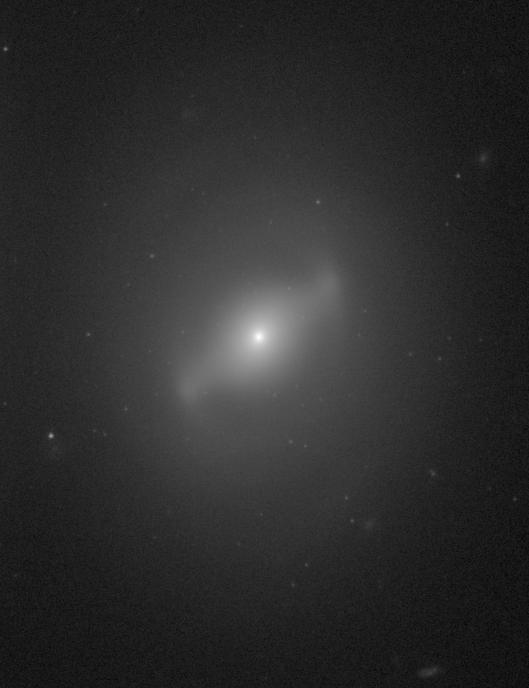
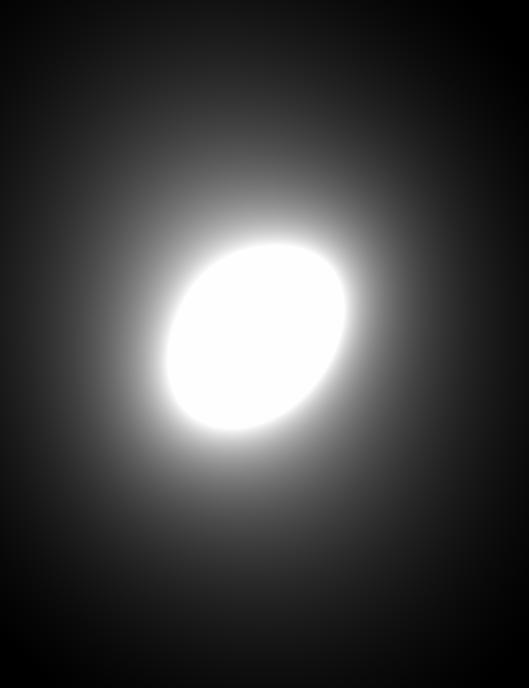
To run GALFIT, we have used input values from the SExtractor catalogues Hammer et al. (2010). These include input parameters like position, apparent magnitude, effective radius, and the positional angle. The input science images were extracted using IRAF and included the galaxy and a portion of the sky required for fitting. For the fitting region, were taken from the image header. Tinytim (Krist et al., 2011) was used to create the point-spread function (PSF) image. Masking was done for objects in the frame that did not belong to the galaxy using IRAF.
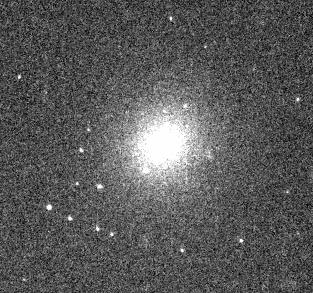
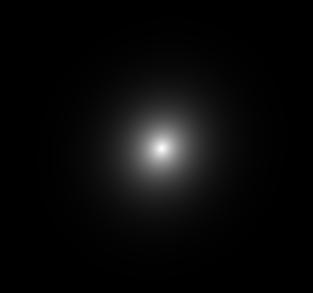
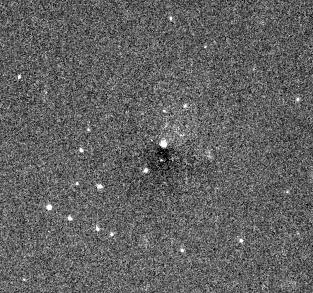
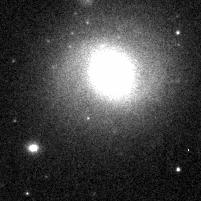
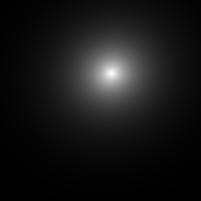
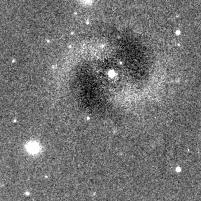
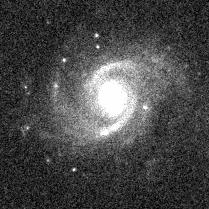
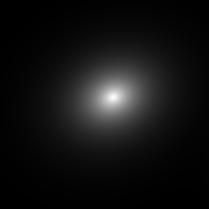
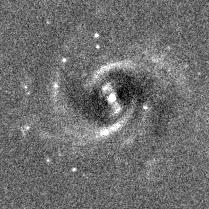
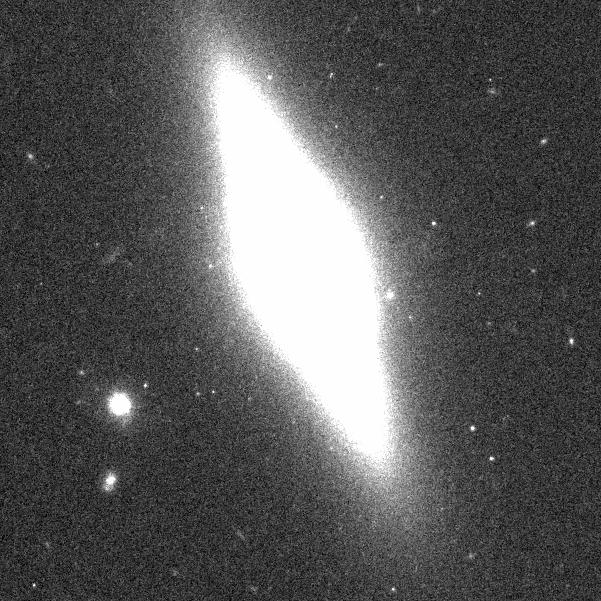
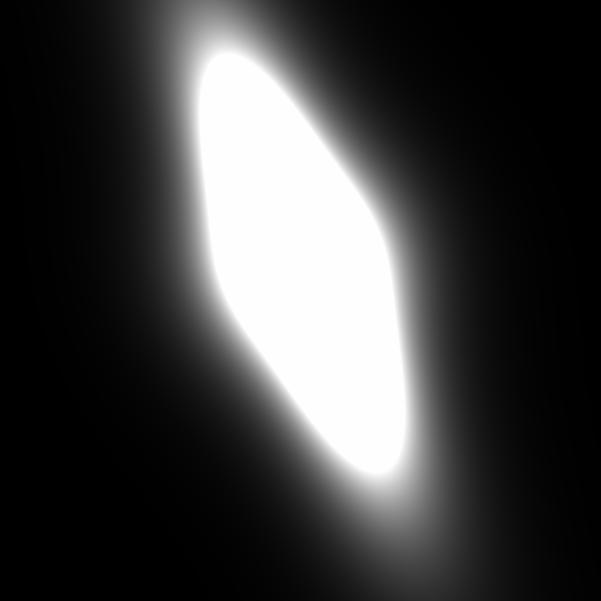
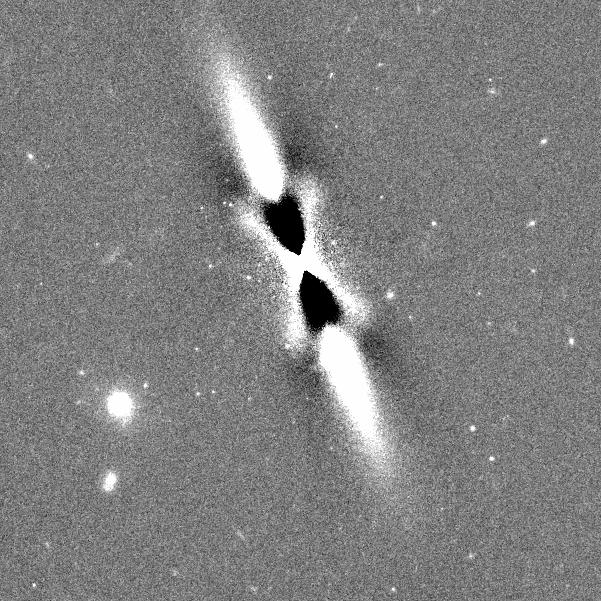
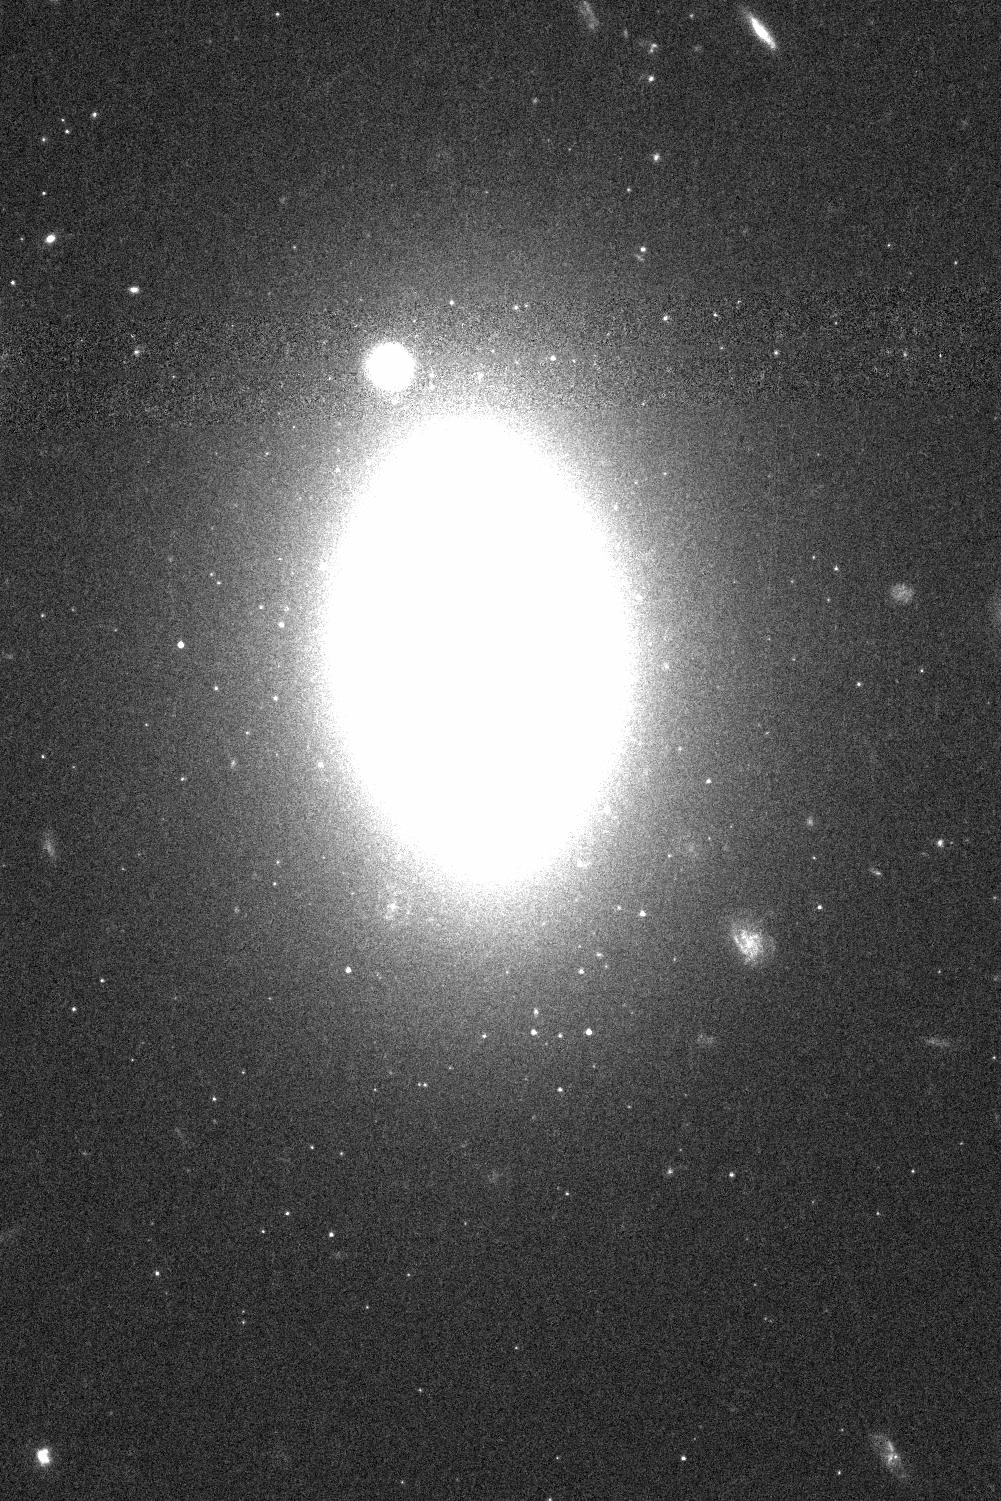
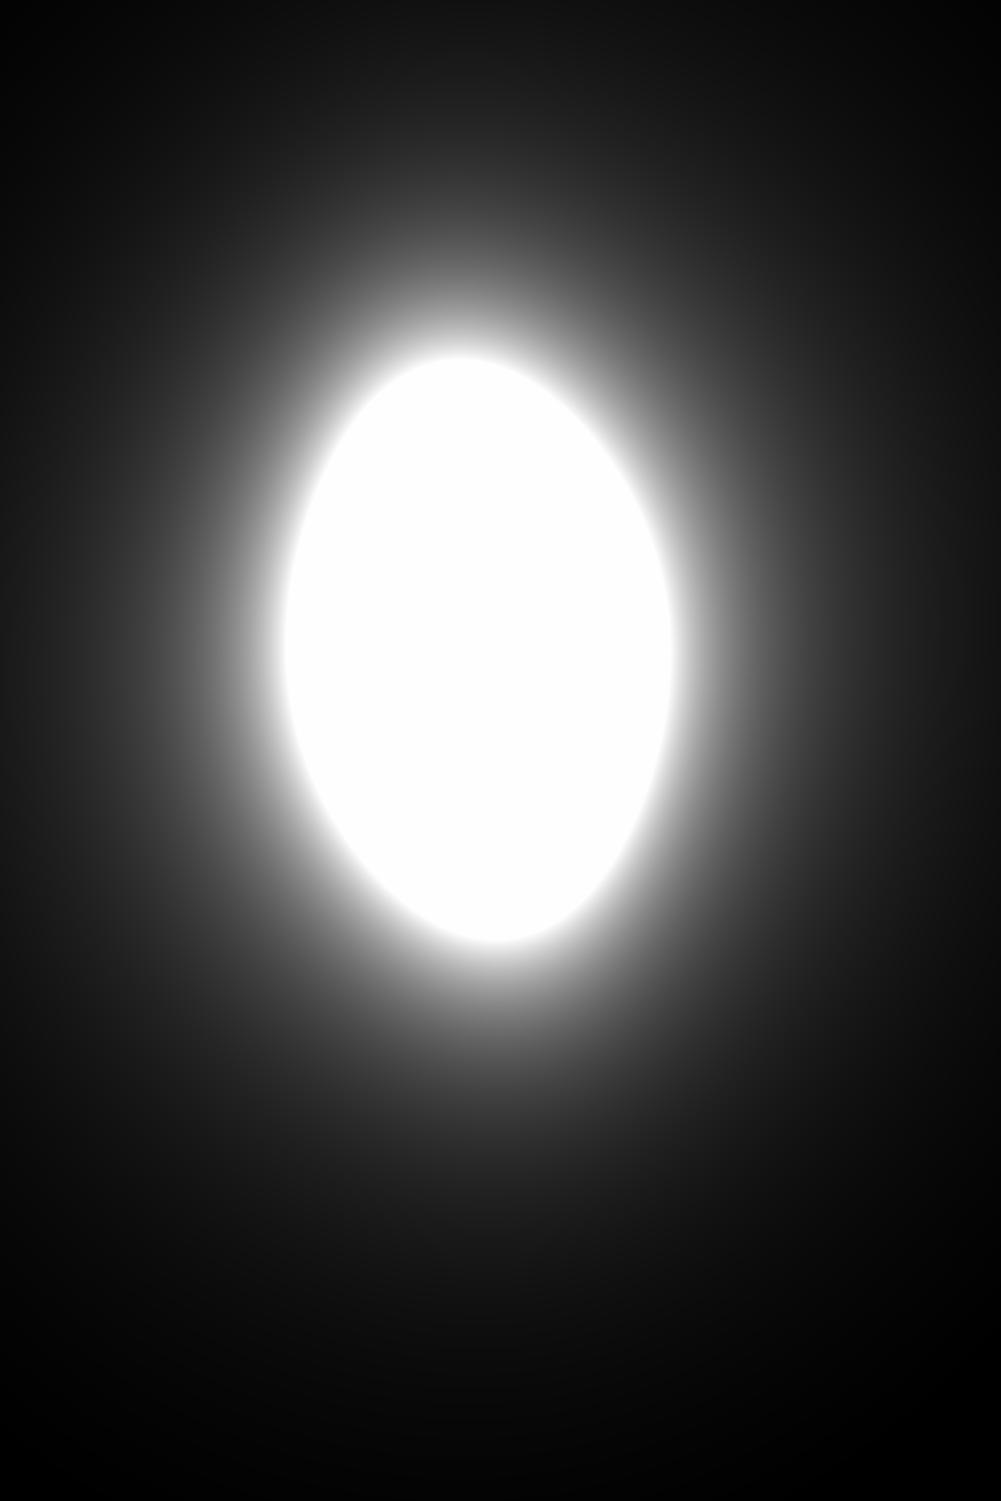
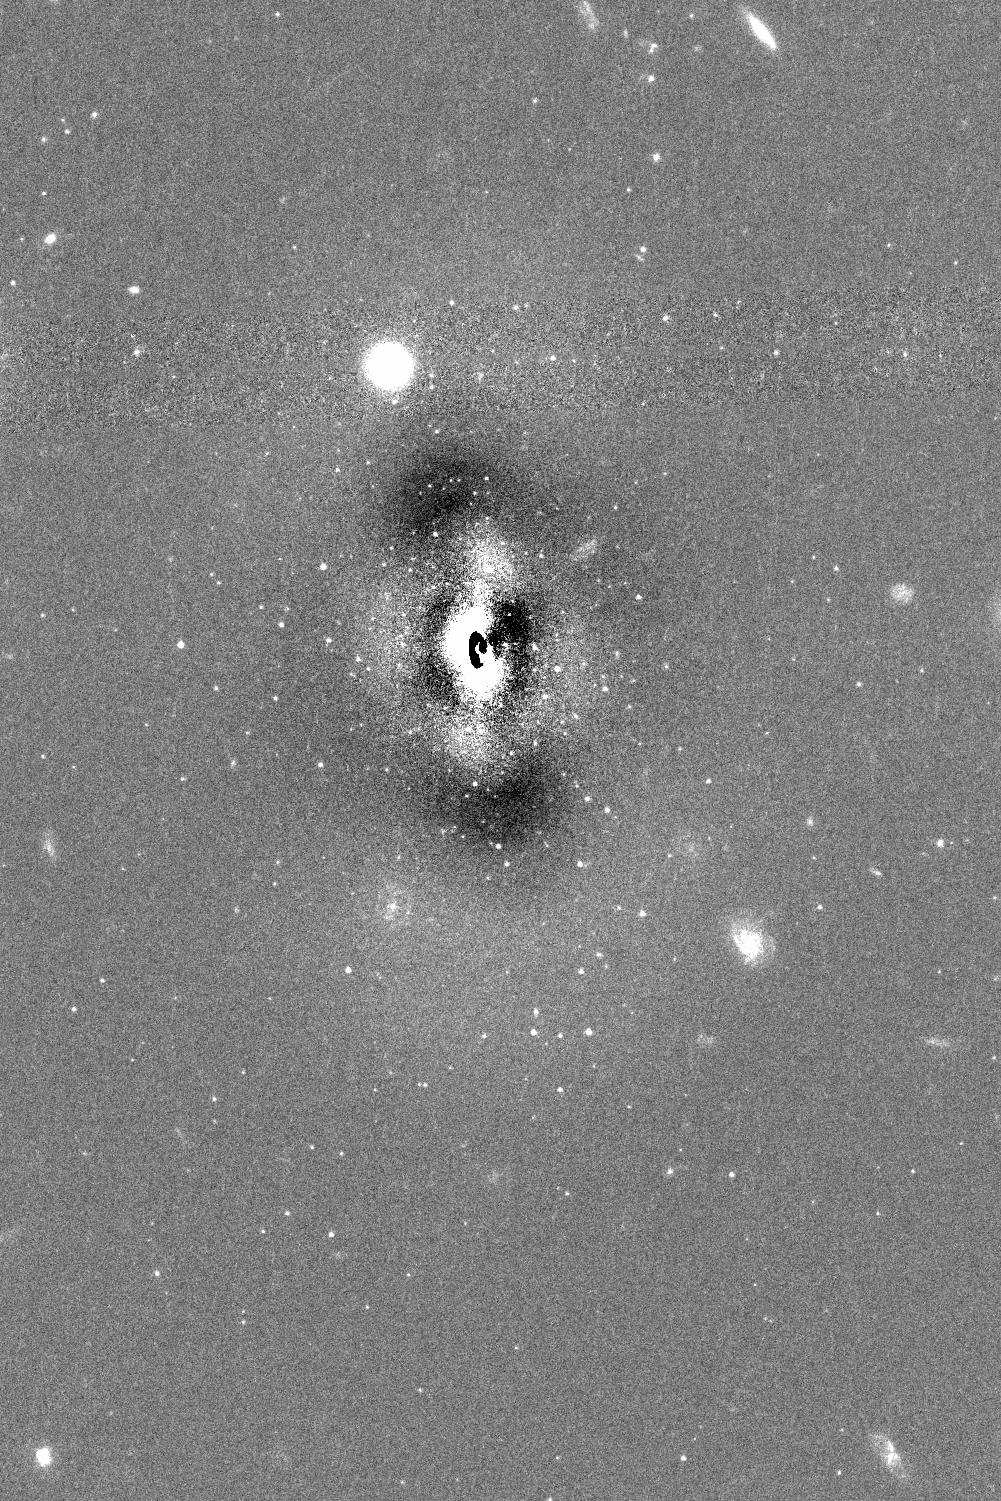
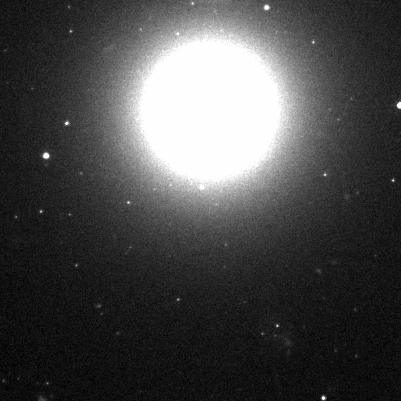
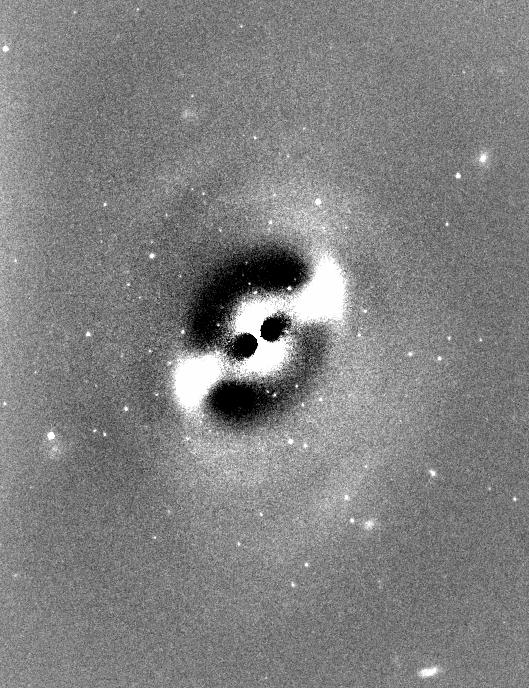
Figure 5 shows a few examples of our GALFIT results: The science image, model image and residual. The residuals are very useful to identify features of the galaxy and have been used to classify galaxies visually. Table 1 and Table 61 describes the column data from detailed analysis and the errors for our sample respectively. The complete tables will be available on request.
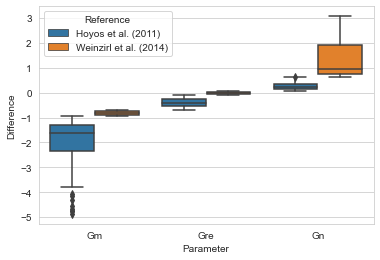
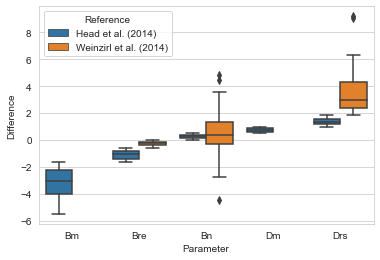
Tables 72 83 describe the comparison of results of our sample with Hoyos et al. (2011); Weinzirl et al. (2014); Head et al. (2014). We found a good agreement with Hoyos et al. (2011); Weinzirl et al. (2014) for single Sérsic fits and found a good agreement with Head et al. (2014) for bulge-disk decomposition fits. We also have added a comparison with Weinzirl et al. (2014) (multiple Sérsic fits).
Figure 3 and 4 show boxplots of the comparison of our data with Hoyos et al. (2011); Weinzirl et al. (2014) for single Sérsic fits and with Head et al. (2014) (bulge-disk decomposition) and Weinzirl et al. (2014) (multiple Sérsic fits) respectively.
 |
 |
 |
 |
 |
 |
 |
 |
 |
 |
 |
 |
 |
 |
 |
 |
 |
 |
 |
 |
 |
5 Results and Discussion
5.1 Morphology
In this section, we describe the morphological classification of our sample galaxies. We divided our sample into cluster members, non-members and unknown redshift galaxies by taking the spectroscopic redshifts described in the earlier section.
Visually, we classified the galaxies based on features in GALFIT residual images (Fig. 5) as GALFIT residuals show features like spiral arms, bars, lenticulars with and without bars and also by changing contrasts, etc. The morphological types were given based on Hubble’s scheme as elliptical (E) lenticular (SO), lenticular with bar (SB0), spirals (Sp) and Barred spirals (SBp). When the residual images were not clearly distinguishable between ellipticals and lenticulars, we classified those galaxies as E/SOs. Our sample comprises of E/SO, E/SBO, SO, SBO, Sp, SBp, Ring and Irr galaxies. Gadotti (2012) classified galaxies with boxy/peanut bulges and thick boxy bulges as barred galaxies. We followed the same scheme to classify E/SBOs. The detailed distribution in shown in Table 2. Also, we have classified dwarfs and non-dwarfs for members and non-members of the cluster based on the absolute magnitude of the galaxies (Marinova et al., 2012) and using =70 km/s/Mpc, =0.3 and =0.7 (Carter et al., 2008). To calculate absolute magnitude we have taken the distance of 100 Mpc and the distance modulus is 35 (Carter et al., 2008; Marinova et al., 2012). We found that of the 132 members, 51 are non-dwarfs and 81 are dwarfs. For the 32 non-members, 4 are dwarfs and 28 are non-dwarfs. For non-members, we have used individual redshift values to calculate absolute magnitude. For the remaining 55 galaxies, we are unable to classify dwarfs due to the absence of redshift data.
GALFIT and morphology based on visual inspection was determined for all non-dwarfs. In the case of dwarfs, GALFIT and visual morphology with a single Sérsic and/or bulge-disk components was not possible for all galaxies. For the analysis in this paper, we required parameters like , Sérsic index of the bulge and the Kormendy relation. As we could not determine these for dwarfs, we restricted our sample to non-dwarfs.
| Col | Parameter | Description |
|---|---|---|
| 1 | COMA_ID | Name of source. |
| 2 | RA (J2000) | Right ascension of source. |
| 3 | Dec. (J2000) | Declination of source. |
| 4 | Bulge magnitude | |
| 5 | Error in bulge magnitude | |
| 6 | Bulge surface brightness | |
| 7 | Bulge effective radius in arcsec | |
| 8 | Bulge Sérsic index | |
| 9 | B | Error in bulge Sérsic index |
| 10 | Bulge axis ratio | |
| 11 | Error in bulge axis ratio | |
| 12 | Bulge position angle | |
| 13 | Error in bulge position angle | |
| 14 | Disk magnitude | |
| 15 | Error in disk magnitude | |
| 16 | Disk surface brightness | |
| 17 | Disk scale length in arcsec | |
| 18 | Disk axis ratio | |
| 19 | Error in disk axis ratio | |
| 20 | Disk position angle | |
| 20 | Error in disk position angle | |
| 21 | Redshift | |
| 22 | Bulge to total light ratio | |
| 23 | Morphology | Based on visual inspection |
| 24 | Galaxy magnitude | |
| 25 | Error in Galaxy magnitude | |
| 26 | Galaxy surface brightness | |
| 27 | Galaxy effective radius in arcsec | |
| 28 | Galaxy Sérsic index | |
| 29 | Error in Galaxy Sérsic index | |
| 30 | Galaxy axis ratio | |
| 31 | Error in Galaxy axis ratio | |
| 32 | Galaxy position angle | |
| 33 | Error in Galaxy position angle |
| Morphological type | Member | Non-member | Unknown redshift |
|---|---|---|---|
| 51 | 28 | 55 | |
| E/SO | 9(18%) | 7(25%) | 7(13%) |
| cD | 1(2%) | ||
| E/SBO | 6(12%) | ||
| SO | 15(29%) | 7(25%) | 16(29%) |
| SBO | 11(22%) | 3(11%) | 7(13%) |
| Sp | 3(6%) | 7(25%) | 15(27%) |
| SBp | 3(6%) | 2(7%) | 5(9%) |
| Ring | 3(6%) | ||
| Irr | 2(7%) | 5(9%) |
5.2 Bulge to Total Light Ratio () and Morphology Relation
is related to the morphological type of galaxies and increases progressively from late-type to early-type (Hubble, 1926; Hudson et al., 2010). In this section, we investigate how the varies with morphological types for cluster members, non-members and unknown redshift galaxies.
Galaxies can be classified according to their ratio. Simien & de Vaucouleurs (1986) classified them as follows: (elliptical), (elliptical with disk), (SO). Further, they divide spirals into two categories: early-type and late-type spirals. for is defined as early-type spirals and for late-type spirals is .
Hasan (2007) classifies galaxies based on their as follows: (E/SO), (SO), (Sab) and (Sbc). This has been described in Table 3.
| Simien & de Vaucouleurs (1986) classification Bulge to Total light ratio | |
|---|---|
| Morphological type | |
| E/SO | |
| SO | |
| Early-type Sp | |
| Late-type Sp | |
| Hasan (2007) classification Bulge to Total light ratio | |
| Morphological type | |
| Ellipticals | |
| E/SO | |
| SO | |
| Sab | |
| Sbc | |
For our sample, there is a variation in the vs morphological types for cluster members, non-members and unknown redshift galaxies. This parameter is distance independent hence can be used to compare all three categories. However, for non-members and unknown redshift galaxies (with an exception of five, two non-member galaxies and three unknown redshift galaxies) they agree with the earlier classification of morphological type (Table 4).
For Coma cluster galaxies Gutiérrez et al. (2004) observed that for early-type galaxies (E & SO) and for Sp and for E. Aguerri et al. (2004) observed that for E, E/SO and for SO & Sp.
Except for one galaxy in our sample of member galaxies, we have agreement with these ratios (Table 3). Based on the residual this galaxy was classified by as SBO in spite of it having a . This classification is in agreement with Marinova et al. (2012).
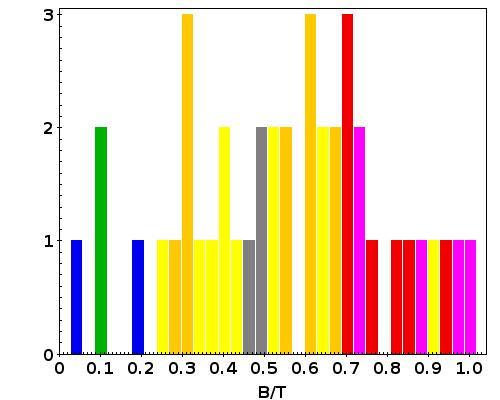
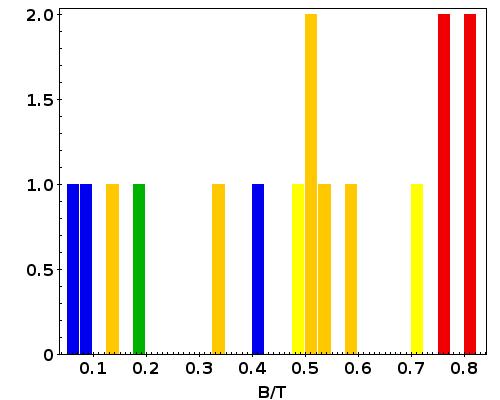
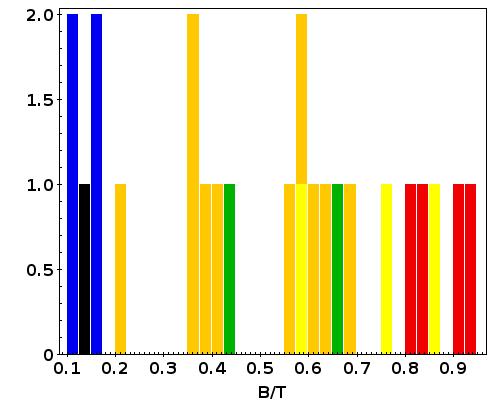
In Figure 6, we show the morphology distribution of for members, non-members and unknown redshift galaxies excluding the dwarf galaxies.
As is evident from Figure 6 our results agree with those of Gutiérrez et al. (2004); Aguerri et al. (2004) where, for Coma Cluster members, early-type (E & SO) and late-types .
We observe that in general, increases with morphological types from spirals to ellipticals.
| Visual type | Member | Non-member | Unknown redshift |
|---|---|---|---|
| E/SO | |||
| E/SBO | |||
| SO | |||
| SBO | |||
| Sp | |||
| SBp | |||
| Ring | |||
| Irr |
5.3 Color Magnitude Relation (CMR)
CMR is an important, distance-independent parameter used to study the characteristics of galaxies (Visvanathan & Sandage, 1977; Bower et al., 1992). Galaxy morphology is related to the slope and scatter of the CMR (Terlevich et al., 2001; Hammer et al., 2010).
Hammer et al. (2010) noted that in the CMR, the red sequence lies in the apparent magnitude range . In our non-dwarf sample, the majority of galaxies are E/SO, E/SBO, SO and SBO which belong to the red sequence. The exceptions are 5 galaxies, which are Sp (3) and SBp (2) and these lie below the red sequence. Figure 7 shows the CMR of the cluster members, non-members and unknown redshift galaxies as a function of morphological type. Colors () have been calculated from the SExtractor catalog. Extinction corrections have been made using values from Hammer et al. (2010). We fit a solid line of the member galaxies (excluding the SBp and Sp) and obtain the relation
A similar fit was found by (Bower et al., 1992; Terlevich et al., 2001). Members are within of the solid line.
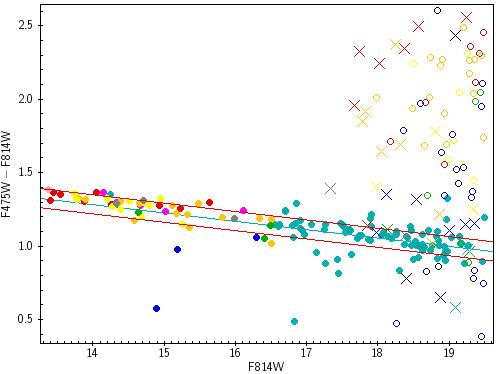
We observe that as the magnitude decreases, the color of the galaxies gets bluer. Spiral galaxies are brighter and bluer due to their high star formation rates (SFR). This is probably due to Star Formation (SF) induced by cluster tidal effects or high speed galaxy-galaxy encounters and is related to environment of cluster. (Fujita, 1998). The SBp galaxies (green) are closer to the red sequence compared to the Sp. The color variation in galaxies can be explained by differences in metallicity using stellar population models from Vazdekis et al. (1996); Worthey (1994).
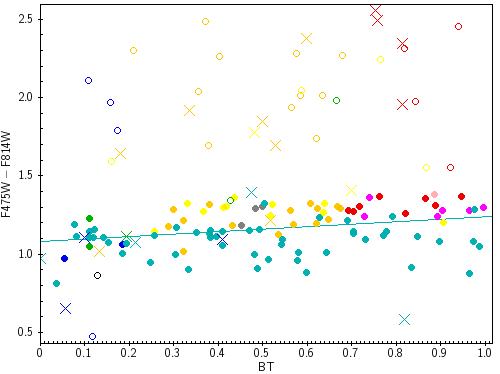
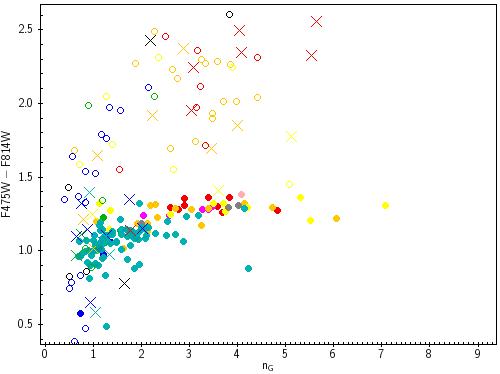
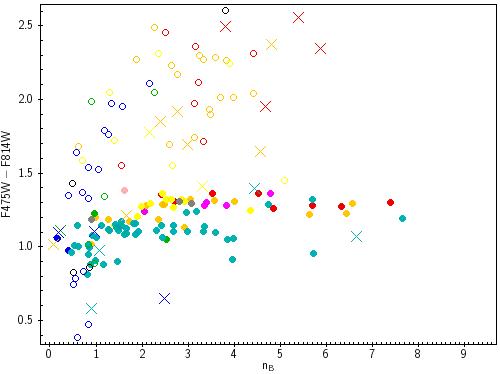
5.3.1 Relation between the color of galaxies and
In this section, we explore the color dependence of as a function of morphological type. Figure 8 shows the relation between color and for cluster members, non-members and unknown redshift galaxies. We observe that the color of galaxies gets redder with increasing except for dwarfs where the scatter is large.
Both color and are distance independent and hence can be plotted for the complete sample. Dwarfs cover a range of , but colors are limited to (including spirals) for members. Ellipticals are redder than dwarfs and the color . Spirals (Sp) have . One SBp has similar colors to SBO and the other is similar to Sp. Though we have only 3 Sp and 2 SBp galaxies, we observe that SBps have a redder color value compared to Sp.
In general, we observe that spirals are in the lower (blue) region, ellipticals are in upper (red) region and lenticulars (SO & SBO) are in between indicating a possible evolutionary sequence. In the case of unknown redshift galaxies, a few objects classified as Sp and SBp have high and behave like early-type galaxies in the CMR diagram. The GALFIT for these objects has larger errors which could explain the variation. But the red colors indicate low SFR probably due to quenching.
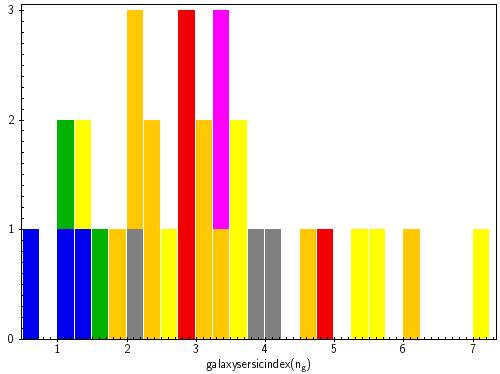
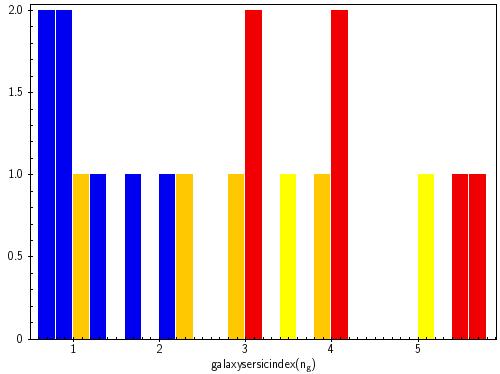
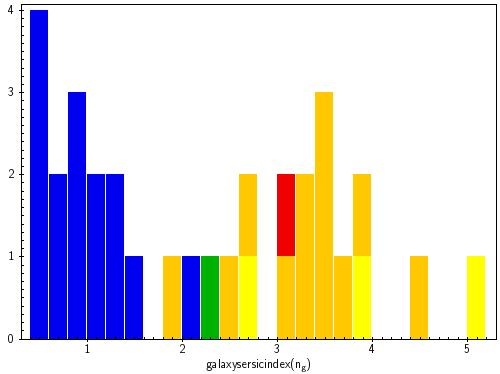
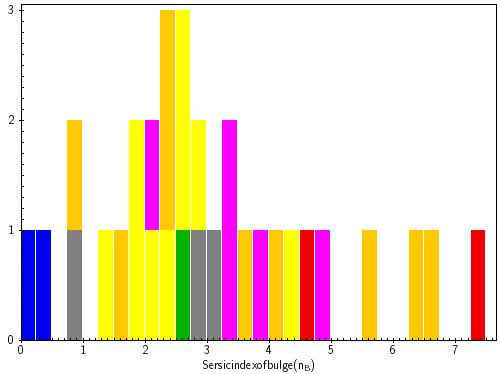
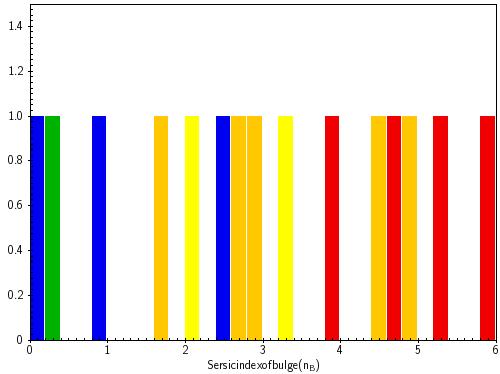
5.4 Sérsic index
Sérsic index also plays an important role in galaxy classification and is distance independent. The Sérsic index of the bulge is used to classify the bulge as classical () or pseudo () (Fisher & Drory, 2008). There can be a 20% () error in the determination of this parameter Gadotti (2009).
The Sérsic index of the galaxy can also be used to classify the galaxies as dwarfs () and giants () (Gutiérrez et al., 2004). Barden et al. (2005); van der Wel (2008) found through simulations that early-type galaxies have and late-type have .
Figure 9 shows the distribution of the bulge and galaxy Sérsic indices for cluster members, non-members and unknown redshift galaxies.
 |
 |
 |
 |
 |
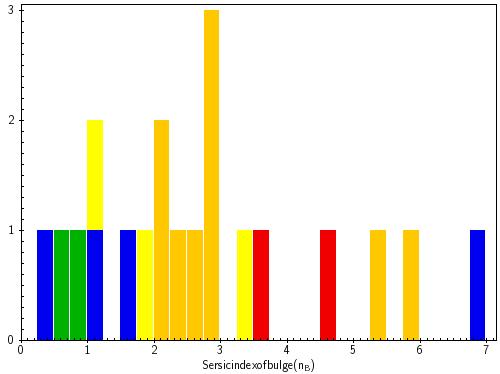 |
The Sérsic index of the galaxies agrees with previous studies where early-type have and late-type for our complete sample of 219 objects (members, non-members and unknown redshift galaxies) and is shown in Fig. 9. In the case of SOs, the fainter galaxies have and the brighter ones have which agrees with Vaghmare et al. (2013).
In the case of dwarf galaxies which have , we have 9 member dwarfs with . These could possibly be dwarfs with nuclear star clusters and ultra compact galaxies (Emsellem & van de Ven, 2008; Price et al., 2009; den Brok et al., 2014).
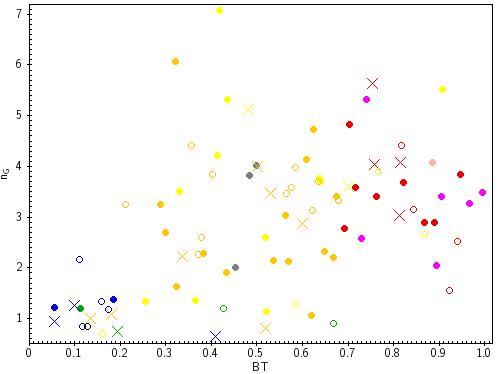
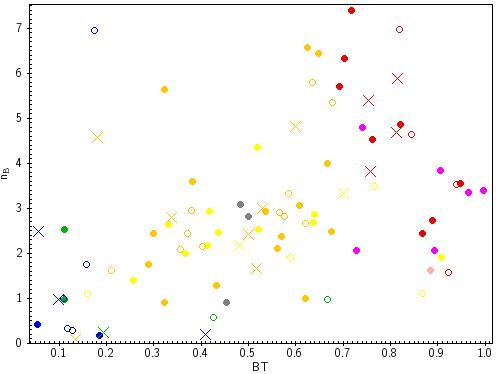
We shall now explore the relation between Sérsic index (galaxy and bulge) with and the color of galaxies. and the shape parameter of the bulge is crucial in estimating how bulges were formed in galaxies: in galaxy mergers in the hierarchical clustering, or by more slow secular evolutionary processes in galaxies. Figure 10 and 11 show the relation between Sérsic index and and clearly galaxies with larger have larger Sérsic index implying a formation due to mergers. The is also a key parameter for evaluating the importance of gas stripping in galaxies, a process by which spirals might be converted into S0s (Laurikainen et al., 2006).
These three parameters are independent of distance. In general, Sérsic index increases with and color gets redder with increasing .
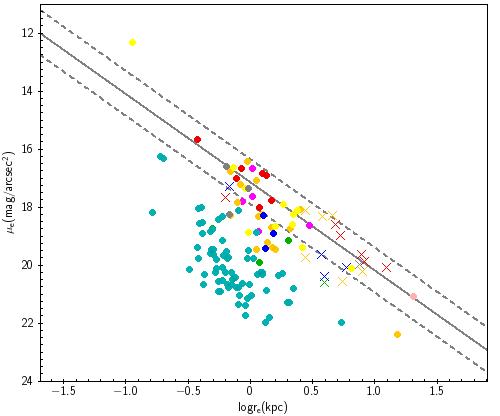
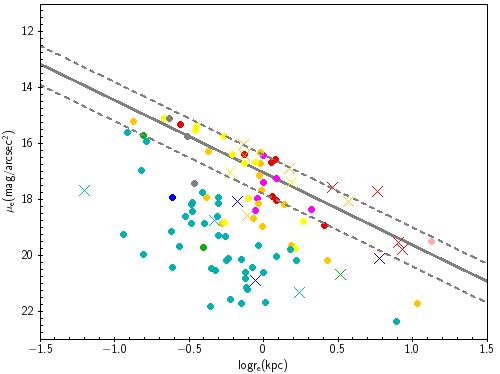
5.5 Kormendy relation
The Kormendy relation (Kormendy, 1977) is the relation between and , where is the surface brightness of the galaxy at the effective radius and can be used to classify bulges and hence infer the merger history of galaxies. Hamabe & Kormendy (1987) did a linear fit of these parameters for elliptical galaxies. Gadotti (2009) found that classical bulges occupy the same area as elliptical galaxies in the Kormendy relation. They also found that pseudo bulges lie outside the line in the Kormendy relation.
We did a linear fit of E/SO galaxies and their bulges and found a slope for galaxies and for the bulge parameters of E/SO. The lower and upper lines are the limits. Figures 12 and 13 show the Kormendy relation obtained from the Sérsic fit of the galaxy and from the Sérsic fit of the bulge component of the galaxy for different morphological types. The galaxy fits are similar to Kormendy (1977); Hamabe & Kormendy (1987) and the bulge fits are similar to Gadotti (2009); Vaghmare et al. (2013). According to Gadotti (2009) the points below the line are pseudo bulges, that implies secular evolution of spirals and dwarfs which lie in that region. In both the figures we can observe that, this relation clearly agrees with our visual classification of galaxies for cluster members and non-members. The spirals (Sp & SBp) and dwarf galaxies are located below the line which implies that they have a pseudo bulges. We can also see that the E/SO galaxies with classical bulges lie with the lines of our linear fit as described by (Gadotti, 2009; Kormendy & Kennicutt, 2004).
5.6 Statistical Analysis
We studied the data obtained in Table 2 and binned the galaxies in two categories:
-
1.
E, SO, Irr, Ring
-
2.
Sp, SBp
As shown in the Table 5
| Morphological type | Member | Non-member | Unknown Redshift |
|---|---|---|---|
| Category i | 45 | 19 | 35 |
| Category ii | 6 | 9 | 20 |
| Total | 51 | 28 | 55 |
We tested the following hypotheses:
-
•
Hypothesis 1: Are there significantly larger number of Category (i) galaxies in members than in non-members?
As per our data, in Category (i) we have members (45), non-members (19) and unknown redshift (64). Category (ii) has members (6), non-members (9), unknown red-shifts (15). Fisher’s exact test, gave . For the test, we used the statistic . The -value is 0.027171.The result is significant both with Fisher’s and tests which confirms our hypothesis and understanding that this cluster has a majority of E & SOs. This means that there is enough evidence to say that there is a difference in the distributions.
-
•
Hypothesis 2: Are there significantly larger number of E, SOs members than in the non-members and unknown redshift galaxies?
As per our data, in Category (i) we have members (45), non-members (19) and unknown redshift (35). Category (ii) has members (6), non-members(9), unknown red-shifts(20). For the test, we used the statistic . The -value is . This implies that our hypothesis is correct. We repeated this with assuming our unknown redshift galaxies to be non-members and found that our result does not change. -
•
Hypothesis 3: How does Hypothesis 2 change if we assume that our unknown redshift galaxies are members? The statistic is . The -value is . This implies that the unknown redshift galaxies are are more likely to be non-members.
-
•
Question: Which population are the unknown redshift galaxies similar to?
The statistic is . The -value is . This implies that unknown redshift galaxies are more likely non-members than members.
6 Conclusions
We have determined the morphology and structural properties of 219 galaxies from HST/ACS data of the central region of the Coma Cluster brighter with . To study the structural properties of the galaxies, we used GALFIT and did a a single Sérsic fit as well as a two dimensional bulge-disk decomposition.
We divided our sample into cluster members, non-members and unknown redshift galaxies for which we did not have redshifts. Using statistical techniques, we find that our unknown redshift galaxies are most probably non-members and hence do not affect our analysis. With the help of Marinova et al. (2012), we separated our sample into dwarfs and non-dwarfs, by putting a cut-off at absolute .
We assign morphological types by inspecting the GALFIT residuals that we get from the difference of the science image and the model images for our non-dwarf sample. We found of the 132 cluster members, 51 are non-dwarfs. For the non-Dwarfs, we have cD-1 (2%), E/SO-9 (18%), E/SBO-6 (12%), SO-15 (29%), Ring-3 (6%), SBO-11 (22%), Sp-3 (6%) , SBp-3 (6%). For the 32 nonmembers, 28 were non-dwarfs E/SO-7 (25%), SBO-3 (11%), SO-7 (25%), SBp-2 (7%), Sp-7 (25%), Irr-2 (7%). For 55 unknown redshift galaxies are E/SO-7 (13%), SBO-7 (13%), SO-16 (29%), SBp-5 (9%), Sp-15 (27%) and Irr-5 (9%). We used this classification to compare and plot the structural properties of galaxies, ratio, Kormendy relation, CMR and their correlations for cluster members, non-members and unknown redshift galaxies.
We compared ranges to our visual morphology with earlier works. The limits of vary for members, non-members and unknown redshift galaxies. Coma members are in agreement with previous studies (Gutiérrez et al., 2004; Aguerri et al., 2004) where early-type galaxies (E/SO, SO and SBO) and late-type galaxies (Sp & SBp) have a separation at . In members, only one object that we classified as SBO has . This classification is in agreement with Marinova et al. (2012). We have also compared with non-members and unknown redshift galaxies. Our morphologies with agree with Simien & de Vaucouleurs (1986) and Hasan (2007), except for two galaxies that are non-members and three galaxies that are unknown redshift galaxies. These might be because the two objects (non-members) are edge-on galaxies.
We find that non-members & unknown redshift galaxies have values similar to field galaxies compared to the member galaxies.
We have also plotted the CMR for different morphological types in our sample. For the cluster members our results are in agreement with Hammer et al. (2010). For members, E/SO, E/SBO, SO, SBO and Ring galaxies are in red sequence while Sp and SBp are in the blue region. These are much brighter and have a larger scatter from the linear fit due to their SFRs. We find that the color of the galaxy increases with . In the case of unknown redshift galaxies, a few objects classified as Sp and SBp have high and behave like early-type galaxies in the CMR diagram. The GALFIT for these objects have larger errors which could lead to incorrect s. However, these galaxies have redder colors which indicate low SFR, probably due to quenching. In general, we observe that spirals are in the lower (blue) region, ellipticals are in upper (red) region and lenticulars (SO & SBO) are intermediate region, indicating a possible evolutionary sequence.
We found that the Sérsic index of the galaxy and bulge are in agreement with values for morphological types found in previous studies for early-type and late-type galaxies. The only exceptions are 9 dwarf members. These 9 objects might be ultra compact dwarf galaxies (UCD), nucleated dwarfs (dE N) or non-nucleated dwarf (dE NN) galaxies (Emsellem & van de Ven, 2008; Price et al., 2009; den Brok et al., 2014). They lie in the same region UCDs, dE N and dE NN in the CMR of Hammer et al. (2010).
We plotted the Kormendy relation for our sample and found that the early-type galaxies with classical bulges lie within the range of the linear fits, while the late-type galaxies and dwarfs lie in the lower region away from the linear fit.
The present study shows that the majority of member galaxies in the core of Coma Cluster are E, E/SOs (classical bulges) and dwarfs (psuedo bulges) as shown by our statistical study in the earlier section. These are results of mergers as the majority (75%) of members have classical bulges, while only 25% have psuedo bulges. Coma Cluster has an age of 10 Gyr and there is a clear absence of member spiral and interacting galaxies, which indicate that interactions may have been fast and at later stages as member galaxies have high velocity dispersions of 1000 km/s (Mihos, 2003). In future papers, we shall further explore the E/SO population with an emphasis on their merger history.
Acknowledgements
The authors would like to thank the referee for very useful and important suggestions to improve the paper.
This paper is based on observations made with the NASA/ESA Hubble Space Telescope, obtained from the data archive at the Space Telescope Science Institute. STScI is operated by the Association of Universities for Research in Astronomy, Inc. under NASA contract NAS .
Data Availability
References
- Adelman-McCarthy & et al. (2009) Adelman-McCarthy J. K., et al. 2009, VizieR Online Data Catalog, p. II/294
- Aguerri et al. (2004) Aguerri J. A. L., Iglesias-Paramo J., Vilchez J. M., Muñoz-Tuñón C., 2004, AJ, 127, 1344
- Alam et al. (2015) Alam S., et al., 2015, The Astrophysical Journal Supplement Series, 219, 12
- Andreon (1996) Andreon S., 1996, A&A, 314, 763
- Barden et al. (2005) Barden M., et al., 2005, ApJ, 635, 959
- Bertin & Arnouts (1996) Bertin E., Arnouts S., 1996, A&AS, 117, 393
- Binney & Merrifield (1998) Binney J., Merrifield M., 1998, Galactic Astronomy
- Blanton et al. (2003) Blanton M. R., Eisenstein D. J., Hogg D. W., Schlegel D. J. S., Brinkmann J., Quintero A. D., Berlind A., Wherry N., 2003, in American Astronomical Society Meeting Abstracts. p. 145.01
- Bower et al. (1992) Bower R. G., Lucey J. R., Ellis R. S., 1992, MNRAS, 254, 589
- Buta (2013) Buta R. J., 2013, Galaxy Morphology. p. 155
- Carter et al. (2008) Carter D., et al., 2008, ApJS, 176, 424
- Chiboucas et al. (2011) Chiboucas K., et al., 2011, ApJ, 737, 86
- Deng et al. (2009) Deng X.-F., He J.-Z., Chen Y.-Q., Jiang P., 2009, Astroparticle Physics, 31, 255
- Dressler (1980) Dressler A., 1980, ApJ, 236, 351
- Emsellem & van de Ven (2008) Emsellem E., van de Ven G., 2008, ApJ, 674, 653
- Fasano et al. (2000) Fasano G., Poggianti B. M., Couch W. J., Bettoni D., Kjærgaard P., Moles M., 2000, ApJ, 542, 673
- Fisher & Drory (2008) Fisher D. B., Drory N., 2008, AJ, 136, 773
- Fujita (1998) Fujita Y., 1998, ApJ, 509, 587
- Gadotti (2009) Gadotti D. A., 2009, MNRAS, 393, 1531
- Gadotti (2012) Gadotti D. A., 2012, arXiv e-prints, p. arXiv:1208.2295
- Gerbal et al. (1997) Gerbal D., Lima Neto G. B., Marquez I., Verhagen H., 1997, MNRAS, 285, L41
- Gutiérrez et al. (2004) Gutiérrez C. M., Trujillo I., Aguerri J. A. L., Graham A. W., Caon N., 2004, ApJ, 602, 664
- Hamabe & Kormendy (1987) Hamabe M., Kormendy J., 1987, Proceedings of the International Astronomical Union, 127, 379
- Hammer et al. (2010) Hammer D., et al., 2010, ApJS, 191, 143
- Hasan (2007) Hasan P., 2007, Ap&SS, 312, 63
- Head et al. (2014) Head J. T. C. G., Lucey J. R., Hudson M. J., Smith R. J., 2014, MNRAS, 440, 1690
- Head et al. (2015) Head J. T. C. G., Lucey J. R., Hudson M. J., 2015, MNRAS, 453, 3729
- Helsdon & Ponman (2003) Helsdon S. F., Ponman T. J., 2003, MNRAS, 339, L29
- Hoyos et al. (2011) Hoyos C., et al., 2011, MNRAS, 411, 2439
- Hubble (1926) Hubble E. P., 1926, ApJ, 64, 321
- Hubble & Humason (1931) Hubble E., Humason M. L., 1931, ApJ, 74, 43
- Hudson et al. (2010) Hudson M. J., Stevenson J. B., Smith R. J., Wegner G. A., Lucey J. R., Simard L., 2010, MNRAS, 409, 405
- Kashikawa et al. (1998) Kashikawa N., Sekiguchi M., Doi M., Komiyama Y., Okamura S., Shimasaku K., Yagi M., Yasuda N., 1998, ApJ, 500, 750
- Komiyama et al. (2002) Komiyama Y., et al., 2002, ApJS, 138, 265
- Kormendy (1977) Kormendy J., 1977, ApJ, 218, 333
- Kormendy & Kennicutt (2004) Kormendy J., Kennicutt Robert C. J., 2004, ARA&A, 42, 603
- Krist et al. (2011) Krist J. E., Hook R. N., Stoehr F., 2011, in Kahan M. A., ed., Society of Photo-Optical Instrumentation Engineers (SPIE) Conference Series Vol. 8127, Optical Modeling and Performance Predictions V. p. 81270J, doi:10.1117/12.892762
- Laurikainen et al. (2006) Laurikainen E., Salo H., Buta R., Knapen J. H., Speltincx T., Block D. L., 2006, Proceedings of the International Astronomical Union, 2, 36–38
- Lintott et al. (2008) Lintott C. J., et al., 2008, MNRAS, 389, 1179
- Mahajan et al. (2010) Mahajan S., Haines C. P., Raychaudhury S., 2010, VizieR Online Data Catalog, p. J/MNRAS/404/1745
- Mahajan et al. (2011) Mahajan S., Haines C. P., Raychaudhury S., 2011, MNRAS, 412, 1098
- Marinova et al. (2012) Marinova I., et al., 2012, ApJ, 746, 136
- Mehlert et al. (2000) Mehlert D., Saglia R. P., Bender R., Wegner G., 2000, A&AS, 141, 449
- Michard, R. & Andreon, S. (2008) Michard, R. Andreon, S. 2008, A&A, 490, 923
- Mihos (2003) Mihos C., 2003, arXiv e-prints, pp astro–ph/0305512
- Mobasher et al. (2001) Mobasher B., et al., 2001, ApJS, 137, 279
- Oemler (1974) Oemler Augustus J., 1974, ApJ, 194, 1
- Peng et al. (2002) Peng C. Y., Ho L. C., Impey C. D., Rix H.-W., 2002, AJ, 124, 266
- Price et al. (2009) Price J., et al., 2009, MNRAS, 397, 1816
- Sandage et al. (1975) Sandage A., Sandage M., Kristian J., 1975, Galaxies and the universe
- Simien & de Vaucouleurs (1986) Simien F., de Vaucouleurs G., 1986, ApJ, 302, 564
- Terlevich et al. (2001) Terlevich A. I., Caldwell N., Bower R. G., 2001, MNRAS, 326, 1547
- Vaghmare et al. (2013) Vaghmare K., Barway S., Kembhavi A., 2013, ApJ, 767, L33
- Vazdekis et al. (1996) Vazdekis A., Casuso E., Peletier R. F., Beckman J. E., 1996, ApJS, 106, 307
- Visvanathan & Sandage (1977) Visvanathan N., Sandage A., 1977, ApJ, 216, 214
- Weinzirl et al. (2014) Weinzirl T., et al., 2014, MNRAS, 441, 3083
- Worthey (1994) Worthey G., 1994, ApJS, 95, 107
- den Brok et al. (2011) den Brok M., et al., 2011, MNRAS, 414, 3052
- den Brok et al. (2014) den Brok M., et al., 2014, MNRAS, 445, 2385
- van der Wel (2008) van der Wel A., 2008, ApJ, 675, L13
Appendix A Supplementary Tables
Table 61 presents the errors in parameters obtained from GALFIT for single Sérsic fits and bulge-disk decomposition.
| Col | Parameter | Description |
|---|---|---|
| 1 | COMA_ID | Name of source. |
| 2 | RA (J2000) | Right ascension of source. |
| 3 | Dec. (J2000) | Declination of source. |
| 4 | Error in bulge magnitude | |
| 5 | Error in bulge Sérsic index | |
| 6 | Error in bulge axis ratio | |
| 7 | Error in bulge position angle | |
| 8 | Error in disk magnitude | |
| 9 | Error in disk axis ratio | |
| 10 | Error in disk position angle | |
| 11 | Error in Galaxy magnitude | |
| 12 | Error in Galaxy Sérsic index | |
| 13 | Error in Galaxy axis ratio | |
| 14 | Error in Galaxy position angle |
Table 72 shows a comparison of the single Sersic fits obtained by this work and that of Hoyos et al. (2011); Weinzirl et al. (2014). In the tables, to facilitate comparison of parameters, parameters like and were converted to arcsec using the average distance of Coma Cluster (100 Mpc) and the pixel scale. We also converted absolute to apparent magnitudes using distance modulus. The parameter was converted to ellipticity from the axis ratio using .
| This work | Hoyos et al. (2011) | Weinzirl et al. (2014) | |
|---|---|---|---|
| Parameter (Col) | Parameter (Col) | Parameter (Col) | Description |
| COMA_ID (1) | Name of source. | ||
| RA (J2000)(2) | Right ascension of source. | ||
| Dec. (J2000)(3) | Declination of source. | ||
| (4) | (10) | (16) | Galaxy magnitude |
| (5) | Galaxy surface brightness | ||
| (6) | (12) | (17) | Galaxy effective radius in arcsec |
| (7) | (13) | (18) | Galaxy Sérsic index |
| (8) | (14) | Galaxy axis ratio | |
| (9) | (15) | Galaxy position angle |
Table 83 shows the comparison of the bulge-disc decomposition obtained by this work and that of Head et al. (2014); Weinzirl et al. (2014).
| This work | Head et al. (2014) | Weinzirl et al. (2014) | |
|---|---|---|---|
| Parameter (Col) | Parameter (Col) | Parameter (Col) | Description |
| COMA_ID (1) | Name of source. | ||
| RA (J2000)(2) | Right ascension of source. | ||
| Dec. (J2000)(3) | Declination of source. | ||
| (4) | (15) | Galaxy magnitude | |
| Bulge surface brightness | |||
| (6) | (16) | (24) | Bulge effective radius in arcsec |
| (7) | (17) | (25) | Bulge Sérsic index |
| (8) | (18) | Bulge axis ratio | |
| (9) | (19) | Bulge position angle | |
| (10) | (20) | Disk magnitude | |
| (11) | Disk surface brightness | ||
| (12) | (21) | (26) | Disk scale length in arcsec |
| (13) | (22) | Disk axis ratio | |
| (14) | (23) | Disk position angle |