1Aryabhatta Research Institute of Observational sciencES, Manora Peak, Nainital-263001, India
\affilTwo2School of Studies in Physics and Astrophysics, Pandit Ravishankar Shukla University, Chattisgarh 492010, India
Deep and CCD photometry of young star cluster NGC 1893 with the 3.6m DOT
Abstract
Young star clusters consisting of massive stars are the ideal sites to study the star formation processes and influence of massive stars on the subsequent star formation. NGC 1893 is a young star cluster associated with the Hii region Sh2-236. It contains about five ‘O’-type stars and several early ‘B’-type stars. It is located at a moderate distance of 3.25 kpc and has a reddening, E(B-V) 0.4 mag. To characterize the young low-mass stellar population in the central portion of the cluster, we carried out deep band observations of the region using the 4K4K CCD mounted on the 3.6-m Devasthal Optical Telescope. Our analysis shows that the present data are deep enough to detect stars below V 24 mag. We found optical counterparts of 220 candidate members, including young stars and unclassified cluster members from Caramazza et al. (2008). We estimated the membership probabilities of the Gaia sources (mostly bright stars with G 19 mag) located within the cluster radius using the Gaia EDR3. Toward the fainter end, we used the optical color-magnitude diagram (CMD) to select the cluster members from a sample of young stars. The locations of young stars on the CMD show that a majority of them are low-mass stars with age 10 Myr. The unclassified member candidates and X-ray sources from Caramazza et al. (2012) are also found to be young low-mass stars. In total, we identified 425 young stars with age 10 Myr, and 110 of these are new. Most of these stars appear kinematic members of the cluster. By examining the CMD for the stars in the cluster region, we suggest that the cluster has insignificant contamination due to field stars in the pre-main sequence zone of the CMD. The slope of the mass function in the mass range 0.2M/M⊙2.5 is found to be = -1.43 0.15, consistent with those of other star-forming complexes. The spatial distribution of the young stars as a function of mass suggests that toward the cluster center, most of the stars are massive.
keywords:
young star clusters: NGC 1893, stars: formation, stars: pre-main sequenceneelam@aries.res.in
20212021
#### \volnum000 2021 \pgrange1– \lp1
1 Introduction
Stars form in the molecular clouds with a variety of masses, ranging from high-mass ( 8 M⊙) to the low-mass upto 0.08 M⊙ and most of the stars emerge as clusters (Lada & Lada 2003). Despite several observational and theoretical works focusing on the processes involved in the formation and evolution of stars and star clusters, a number of issues persist. As young star clusters possess young stars of a diverse mass range, formed from the same molecular cloud, they are particularly suited to enhance our understanding on the physical processes related to the star formation, such as, whether star formation is a fast or slow process, what is the shape of the initial mass function (IMF) towards the low-mass end, and the total star formation efficiencies. However, the presence of massive stars in such systems may significantly influence the evolution of low-mass stars and subsequent star formation. As soon as the massive stars form, they tend to ionize the natal cloud and create expanding Hii region. The expanding edge of the Hii region (I-front) interacts with the surrounding cloud and may trigger star formation via various processes. Thus, young star clusters associated with the Hii regions and young stellar objects (YSOs) are ideal sites to study the influence of massive stars on the formation and evolution of low-mass stars and the processes involved in triggering star formation.
Observations of the early stages of star formation, i.e., Class 0/i/ii YSOs show that these are associated with the disk accretion, jets and outflows. However, jets and outflows are only present when a young star possesses an accretion disk. The strength of a jet depends on the evolutionary status of the driving source and the less evolved source (with thick circumstellar disk) has more powerful outflows. Hence, the presence of jets and outflows in a star forming region can be used to identify young stars that are deeply embedded in the molecular clouds.
As YSOs possess circumstellar accretion disks during their earlier stages of formation, they also exhibit excess emission in the longer (particularly IR) wavelengths. However, the amount of excess emission depends on different evolutionary classes, i.e., Class 0, Class i, Class ii, and Class iii (André 1995). Hence, in general, this property of the young stars is used to identify and classify them (Lada et al. 2006; Luhman 2012). As Class iii objects are disk anemic or possess thin disks, they present no or little excess emission in infrared (IR). Therefore, IR observations become less sensitive for the identification of Class iii objects. However, X-ray observations can be utilized to obtain a complete census of young stars as both Class ii and Class iii objects are generally more luminous in the X-ray wavelengths compared than their main-sequence (MS) counterparts (e.g., Feigelson & Montmerle 1999; Getman et al. 2012). Hence, IR and X-ray observations are widely used to identify and characterize a complete census of YSOs in star-forming regions.
Our target: NGC 1893
NGC 1893 is a young star cluster located in the Auriga OB2 association.
It is associated with the Hii region W8 (or Sh2-236) and contains about five ‘O’-type stars and
several ‘B’-type stars (Marco & Negueruela 2002). Recent studies place the cluster at a moderate distance ranging from 3.2 - 3.6 kpc.
Reddening, E( - ), toward the cluster direction ranges from 0.4 to 0.6 mag (Sharma et al. 2007, Prisinzano et al. 2011, Lim et al. 2014).
The radial extent of the cluster is found to be 6′ (Sharma et al. 2007).
Using different color excess ratios over a wide wavelength range, Lim et al. (2014) found a normal reddening law (RV = 3.1) towards the cluster.
CO (1-0) observations of the Hii region/ cluster complex show that it still consists of molecular gas having VLSR = (7.2 0.5) km (Blitz et al. 1982). As NGC 1893 is located in the outer Galaxy and probably formed
in the low-metallicity environment, it is interesting to probe how such a rich star cluster formed there despite
of the expected unfavourable conditions for star formation in the outer Galaxy.
The region is associated with two tadpole nebulae, Sim 129 and Sim 130, and several YSOs (Maheswar et al. 2007, Caramazza et al. 2008, 2012, Prisinzano et al. 2011, Lim et al. 2014). The spatial distribution of the YSOs shows that they have an elongated and aligned distribution from the cluster center to Sim 129 and Sim 130. An age gradient from the massive stars of the cluster toward the nebulae is also observed (Pandey et al. 2013, Kuhn, Getman & Feigelson 2015). Lata et al. (2012) identified 53 young stellar variables based on the bands time-series photometric observations. They found that the rotational period of young stars decreases with stellar age and mass, and the amplitude in the light curves also declines with the same physical quantities. Based on a cumulative age distribution of the classical T-Tauri stars (CTTSs) and weak-line T-Tauri stars (WTTSs), Pandey et al. (2013) found that these are coeval. Hence, the cluster/ Hii region complex is an active site of star formation and an ideal target to study the formation and evolution of the young stellar population.
Though the cluster and associated Hii region is a target of various optical photometric studies, most of these were shallow (V 21-22 mag) and complete upto 1 M⊙ (Lim et al. 2014). As low-mass stars out-number high-mass stars in a star cluster, information on the low-mass stellar population of the young clusters is essential to infer the cluster properties, star formation histories and mass function (MF). Deep photometric observations are important tools to probe the faint low-mass stars and study the properties of young clusters.
To characterize the low-mass stars and study star formation in the cluster region, we carried out deep band observations of the region with the 4K4K CCD mounted on the 3.6-m Devasthal Optical Telescope (DOT). Our analysis show that the present optical data are 3 mag deeper than that of the previous studies (e.g., Sharma et al. 2007, Lim et al. 2014).
2 Observations & Data Reduction
The bands photometric observations of the central portion of the cluster NGC 1893 were carried out on 2020 October 15 using the 4K4K CCD mounted at the axial ports of the 3.6m DOT (Pandey et al. 2018). With a plate scale of 0.095 arcsec/ pixel, the CCD covers a field of view of 6′.5 6′.5. The observations were carried out in a 22 binning mode to enhance the signal to noise ratio. The images were taken in readout noise and gain mode of 10 e-/s and 5 e-/ADU, respectively. The sky conditions were excellent throughout the night, and during the observations the average full-width half-maxima (FWHM) of the point sources was 0′′.5. To avoid the saturation and contamination to the flux of the stars by the nearby bright stars, we took 12 exposures of 300s and 210s in both and -band, respectively. Thus, the total integration time for the and band images were 1 hour and 42 minutes, respectively. Along with the object frames, several bias and flat frames were also taken during the same night. Pre-processing of the object frames (i.e., bias subtraction, flat-fielding, etc.) was done using the data reduction package. We combined the and band images separately using the task of . We used the software package (Stetson 1987) for the source detection and the photometric measurements of the detected sources in the combined images. The point-spread function (PSF) was obtained for each frame using several uncontaminated stars and the task is used to obtain the instrumental magnitudes of the stars in each frame.
The instrumental magnitudes were calibrated using the photometric measurements of the stars in the cluster NGC 1893 by Sharma et al. (2007). For calibration, we restricted the Sharma et al. (2007) catalog to 18V mag20 to avoid the effects of large photometric errors and saturation of bright stars towards the fainter and brighter ends, respectively. In total, we detected about 1750 stars in both and bands. Out of these, about 1510 stars have magnitude uncertainty 0.1 mag in both and bands.
Prisinzano et al. (2011) also carried out optical and infrared (IR) observations of the young cluster NGC 1893 using Device Optimized for LOw RESolution, a 2K 2K CCD camera with a plate scale of 0′′.25 /pixel, mounted on the 3.6-m Telescopio Nazionale Galileo (TNG) at La Palma. They have reported seeing of 1′′ during the observations. Though our observations are performed with a similar size telescope, the excellent atmospheric conditions (FWHM 0′′.5) and better spatial resolution of 4K4K CCD are the advantages. We detected sources below 25 mag, however considering magnitude uncertainty of 0.1 mag in both and band, our photometry is limited to 24 mag. These values are comparable to photometry of the same region taken with the TNG (see Figure 4 and Figure 8 of Prisinzano et al. 2011). Here, we note that during the observations, the reflectivity of the primary mirror of the 3.6m DOT was 60%. Hence with 90% reflectivity, we expect to reach about 0.5 mag deeper than the present observations.
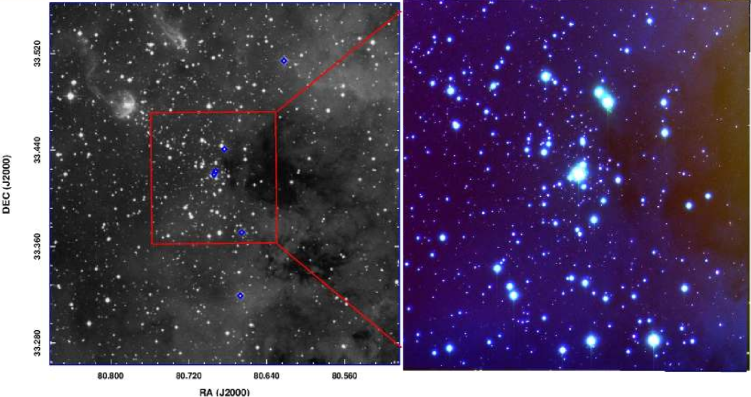
Fig. 1 (left panel) shows the DSS2-R band image of the cluster NGC 1893 along with the Sim 129 and Sim 130 (toward the north-east). Diamond symbols represent the locations of massive ‘O’-type stars taken from SIMBAD. The square represents the area covered with the 4K4K CCD observations (shown in right panel). A color-composite image of the central portion of the cluster (FOV 6′.5 6′.5) constructed using the DSS2-R (blue), 4K4K CCD (green) and -band (red) images is shown in the right panel of Fig. 1.
3 Results & Discussion
3.1 Young stellar population in the region
The spatial distribution of the young stars traces the sites of recent/ ongoing star formation. Hence, the identification and characterization of young stars in a region is essential to infer the star formation histories and the physical properties of the star clusters and Hii regions. Caramazza et al. (2008) identified 359 YSOs in the cluster NGC 1893 using Spitzer-IRAC observations. Based on the IRAC color-color diagram and X-ray emission, these YSOs were characterized as Class 0/i, Class ii or Class iii sources. Out of 359 YSOs, seven sources were classified as Class 0/i, 242 Class ii and 110 Class iii. Caramazza et al. (2008) also reported 460 candidate members that were not detected at 5.8 and 8.0 m and have [3.6] - [4.5] 0.3 mag. Therefore, they could not categorize these candidate members as YSOs. Prisinzano et al. (2011) identified 1034 disk bearing (Class 0/i/ii) sources and about 442 diskless (Class iii) sources in the young cluster NGC 1893 by applying the Q-index method on the data of Caramazza et al. (2008). However, some of their YSO candidates ( 170 sources) appeared older than the majority of young population, which they attributed due to the edge-on disks and accretion activity. Caramazza et al. (2012) studied the coronal properties of the young stars in the NGC 1893 region using the X-ray observations.
3.2 Optical counterparts of the YSOs candidates
As young stars possess disks in their early stages and show excess emission in the longer wavelengths, the estimation of the physical properties of the young stars using longer wavelength observations can be problematic. Since, optical observation mostly traces the photospheric emission from the young stars, these are the best suited to study the physical properties, such as age, mass, etc. of the young stars. In the present work, we have used the catalog of Caramazza et al. (2008) to guide our analysis and, in particular, to identify the young stellar population in the central portion of the cluster. We looked for the optical counterparts of the candidate members (Table 4 of Caramazza et al. 2008) in our optical data using a matching radius of 0.6 arcsec. We found optical counterparts of 226 member stars within the central portion ( 6′.5 6′.5) of the cluster. Out of these, one source is Class 0/i candidate, whereas 106 sources are Class ii and 42 sources are Class iii in nature. Though the rest of the 77 sources were designated as candidate members by Caramazza et al. (2008), these were detected in only 3.6 m and 4.5 m bands and hence were not identified as YSOs based on the IRAC color-color diagram. Accordingly, the nature of these sources remained ambiguous. We looked for these 77 candidates in the YSO catalog of Prisinzano et al. (2011) and found that 55 of these were not present in their YSO catalog either. Since, we are using deep optical photometry of the cluster in the present work, it will be helpful to examine the nature of these 55 candidate members of Caramazza et al. (2008).
We also used the catalog of X-ray sources of Caramazza et al. (2012) to select the additional YSO candidates in the cluster. Using a matching radius of 0.6 arcsec, we found optical counterparts of 336 X-ray sources. Out of these, 109 sources were common to those in the catalog of Caramazza et al. (2008). In summary, we found that the evolutionary status of 123 X-ray sources and unclassified candidate members were not previously known.
3.3 Kinematic members of the cluster NGC 1893 with Gaia EDR3
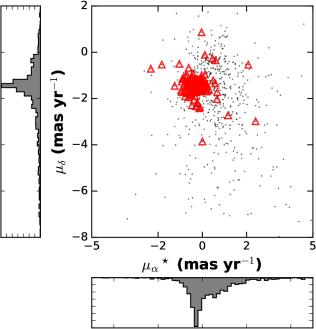
The Gaia mission has revolutionized the kinematic studies of the stars and star clusters by providing rich astrometric and photometric data. In the present work, we used Gaia Early Data Release 3(EDR3; Gaia Collaboration et al. 2020) catalog to elucidate the kinematics of the stars in the young star cluster NGC 1893. We use Gaia EDR3 data for the sources within the cluster region (radius 6 arcmin). We used the proper motion in RA (α⋆) and proper motion in declination (δ) for the stars within the cluster radius to generate the vector point diagram (VPD), where α⋆ . We restricted only those sources with proper motion uncertainty less than 0.5 mas yr-1 and G-band magnitude uncertainty less than 0.1 mag. The VPD for those sources is shown in Fig. 2. The over-density of sources can be easily noticed in Fig. 2. The proper motion of the stars in the cluster region peaks at α⋆,δ -0.30, -1.43 mas yr-1. A circular area of radius 0.7 mas yr-1 around the peak of the over-density in the VPD is used to select the probable cluster members, and the remaining sources in the VPD are considered as field stars.
To determine the membership probability of the stars in the cluster region, we used the approach discussed in Pandey et al. (2020). Assuming a distance of 3.25 kpc (Sharma et al. 2007) and a radial velocity dispersion of 1 km s-1 for open clusters (Girard et al. 1989), a dispersion (c) of 0.06 mas yr-1 in the PMs of the cluster can be expected. We calculated xf = 0.84 mas yr-1, yf = -2.70 mas yr-1, xf = 2.29 mas yr-1 and yf = 3.76 mas yr-1 for the probable field members. These values are further used to construct the frequency distributions of the cluster stars () and field stars () by using the equation given in Yadav et al. (2013) and then the value of membership probability for the th star is calculated using the equation given below:
| (1) |
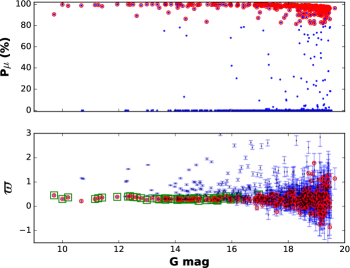
where nc and nf are the normalized number of probable cluster members and field members, respectively. In figure 3 (upper panel), we have plotted the estimated membership probability for all the Gaia sources within the cluster radius as a function of G-band magnitude as blue dots. Gaia sources with high membership probability (Pμ 80%) are shown with red circles. There seems to be a clear separation between the cluster members and field stars toward the brighter part, supporting the effectiveness of this technique. A high membership probability extends down to G 19 mag, whereas toward the fainter limits, the probability gradually decreases. A majority of the stars with high membership probability follow a tight distribution in the VPD. From the above analysis, we calculated the membership probability of 950 stars in the cluster region.
We also plotted the parallax for all the Gaia sources as a function of G-band magnitude (dots in Fig. 3, bottom panel). The respective uncertainties in the parallax values are shown with the error bars. The red circles represent sources having membership probability Pμ 80%. We also estimated the cluster distance using the parallax values of the cluster members having high membership probability (Pμ 80%) and good parallax accuracies (/ϖ 5). These sources are shown with the square symbols in Fig. 3 (bottom panel). The median parallax value of these sources is 0.318 0.054 mas. We estimate the cluster distance after correcting the median parallax value for the known parallax offset of -0.015 (Statssun & Torres 2021). The distance estimate for the cluster using Gaia data comes out to be 3.30 0.54 kpc, which is in agreement with that reported by Sharma et al. (2007).
We also cross-matched the YSOs that have counterparts in our optical photometry to sources in the Gaia catalog. Using a matching radius of 1.2 arcsec, we found 135 Gaia counterparts. These sources are shown with the red triangles in the VPD. Except for few contaminants, most of them follow the distribution of probable cluster members in the VPD, suggesting that these YSO candidates are the cluster members.
From the above analysis, it is clear that using the Gaia EDR3 data, our sample of kinematic members of the cluster is restricted to only relatively bright members (G 19 mag). Therefore, to select the candidate members towards the low-mass end, we adopted the procedure discussed in the following section.
3.4 Color-Magnitude Diagram: Constraining Young Nature of the Candidate Members
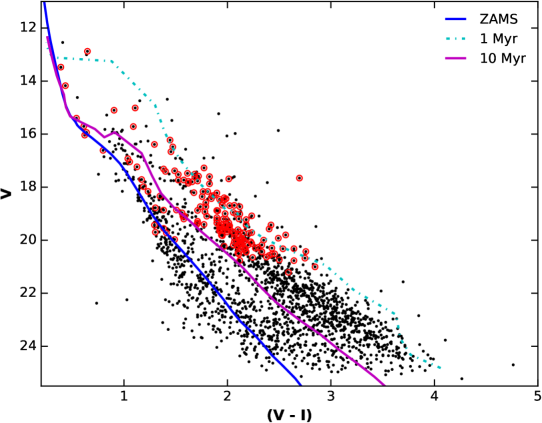
The color-magnitude diagram (CMD) is often used to study the mass distribution and evolutionary stages of the stars of a cluster. In Fig. 4 (top panel), we show the / ( - ) CMD for all the stars in our optical catalog within the cluster region. The red circles represent the cluster members with high membership probabilities (Pμ 80%). We have also plotted a zero-age main sequence (ZAMS) isochrone (thin blue curve) from Girardi et al. (2002) and 1, 10 Myr pre-main sequence (PMS) isochrones (dashed and thick curves, respectively) from Siess et al. (2000). In the present work, we adopted a distance of 3.25 kpc and reddening E( - ) of 0.4 mag for the cluster (Sharma et al. 2007). All the isochrones are corrected for the adopted distance and reddening. The probable cluster members (shown with red circles in top panel of Fig. 4) clearly show that most of these are young in the CMD. As can be seen, there is a clear color gap in the cluster CMD (along the 10 Myr isochrone) that seems to separate a young stellar population (toward the right side in the CMD) from the likely field stars toward the cluster direction. A similar separation of PMS population on the CMD is also observed by Panwar et al. (2018) for the young cluster Berkeley 59.
There may be significant contamination by the field population along the line of sight (e.g., Sung & Bessell 2010; Sung et al. 2013) that can also contaminate our CMD. Therefore, to further examine the distribution of our proposed cluster population, we used the young stars selected based on the X-ray and IR emission properties from Caramazza et al. (2008). We constructed the / ( - ) CMD for the Spitzer-IRAC and Chandra X-ray identified stars (see Fig. 4, bottom panel). In Fig. 4 (bottom panel), the red filled circle shows the location of the Class i object, magenta squares represent the Class ii objects, and blue triangles represent the Class iii objects from Caramazza et al.(2008).
By examining the locations of these YSOs in the CMD, we found that most of the YSOs are located to the right of the 10 Myr PMS isochrone of Siess et al. (2000), confirming that the contamination due to field stars in the PMS population of the cluster region is insignificant. A majority of the YSOs selected based on the IR and X-ray properties by Caramazza et al. (2008) are young low-mass stars.
To examine the evolutionary status of the ambiguous candidate members (without 5.8 and 8.0 m photometry) of the Caramazza et al. (2008) and X-ray sources from Caramazza et al. (2012), we placed these sources on the optical CMD. In Fig. 4 (bottom panel), cross symbols represent the optical counterparts of the X-ray sources detected by the observations (Caramazza et al.2012) that were not cataloged by Caramazza et al. (2008) as YSOs. In contrast, the star symbols represent the ambiguous candidate members of NGC 1893 cataloged in Table 4 by Caramazza et al. (2008). The positions of these sources on the optical CMD suggest that a majority of them are young low-mass stars. The positions of these young stars alongwith the and band magnitudes are listed in Table 1.
Comparing the distribution of all stars with the Spitzer and X-ray identified YSOs in the /( - ) CMD, we suggest that the stars located toward the right of the 10 Myr isochrone may belong to the PMS population of the cluster NGC 1893. However, deep optical observations of a nearby control field or spectroscopic observations of the PMS population are necessary for the confirmation.
3.5 Mass Function of the Young Stars
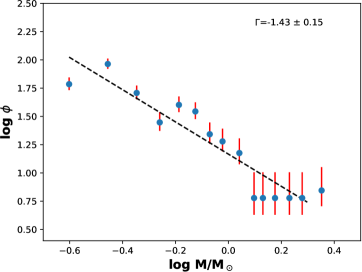
The distribution of the stellar masses in a star cluster at a star formation event is termed as the IMF of that star cluster. Young star clusters (age 10 Myr) are the particularly suited for the IMF studies. They are too young to loose a significant number of members either due to dynamical evolution or stellar evolution. Hence, their MFs can be considered IMFs. The variation of the MF is an important tool that gives clues to the physical conditions of star formation processes (e.g., Bate 2009). The MF is defined as the number of stars per unit logarithmic mass interval, and is generally represented by a power law with a slope,
= d log N(log m)/d log m,
where N(log m) is the distribution of the number of stars per unit logarithmic mass interval. Observational results for the most of the star clusters in the solar neighbourhood suggest MF slopes similar to that given by Salpeter (1955), that is, = -1.35.
Here, we used the optical CMD to count the number of stars in different mass bins, which is shown in the lower panel of Fig. 4 along with isochrones and evolutionary tracks. Since our YSO sample is complete down to 0.2 M⊙, for the MF study we have taken only those YSOs that have masses in the range of 0.2 M/M⊙2.5. The mass distribution of our YSO sample has a best-fitting slope, = -1.43 0.15 (see Fig. 5), similar to the Salpeter value. Our YSO MF appears consistent with those reported for other active star-forming regions, for example, the MF of a YSO sample (with masses 0.2 M⊙) derived by Erickson et al. (2011), the YSO MF slopes of the star-forming regions W51 A ( = -1.17 0.26) and W51 B ( = -1.32 0.26) by Kang et al. (2009) and the YSO MF slope of the young cluster IC 1805 ( = -1.23 0.14) derived by Panwar et al. (2017).
The MF slope below 1 M⊙ show a flattening. It has already been pointed out earlier by many groups (see e.g., Kroupa 2002; Chabrier 2003, 2005; Ojha et al. 2009) that for the masses above 1 M⊙, the MF can generally be approximated by a declining power law with a slope similar to the Salpeter, whereas for the masses below 1 M⊙ the distribution becomes flatter, and turns down at the lowest stellar masses.
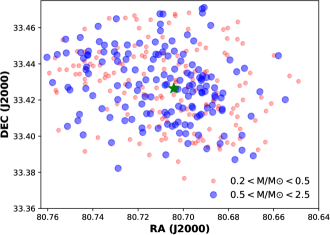
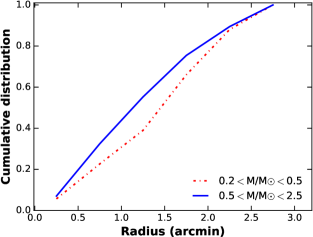
3.6 Indication for the Mass Segregation
Although, there are extensive studies on mass segregation in star clusters, only a few focused on the mass segregation among low-mass stars (e.g., Andersen et al. 2011, Panwar et al. 2018). Sharma et al. (2007) studied the mass segregation in the young cluster NGC 1893 in the mass range 5.5M/M⊙17.7 and found that the high-mass stars are more centrally concentrated than their lower-mass siblings. In the present work, we investigated the mass segregation in low-mass stars by dividing our low-mass young stars, that are located within the 3 arcmin radius around the cluster center, into two mass groups, 0.2M/M⊙0.5 and 0.5M/M⊙2.5. Fig. 6 (left panel) shows the spatial distribution of the stars from these two different groups. Toward the center of the cluster, most of the YSOs seem to be relatively massive. The cumulative distribution of the young stars as a function of radial distance from the cluster center in two different mass groups (see Fig. 6, right panel) also suggest that more massive stars (0.5M/M⊙2.5) tend to lie toward the cluster center, which indicates the mass segregation in the central portion of the cluster region. As the estimated relaxation time for the cluster is very large compared to the age of the cluster, the observed mass segregation in the cluster may be primordial in nature.
| V eV | I eI | |||
|---|---|---|---|---|
| 1 | 80.65629 | 33.36719 | 24.45 0.18 | 20.76 0.04 |
| 2 | 80.73150 | 33.37947 | 23.53 0.08 | 20.52 0.04 |
| 3 | 80.65462 | 33.38117 | 24.93 0.31 | 21.38 0.11 |
| 4 | 80.65742 | 33.37886 | 23.75 0.10 | 20.46 0.03 |
| 5 | 80.73238 | 33.42503 | 23.08 0.06 | 19.87 0.02 |
| 6 | 80.64283 | 33.38447 | 22.43 0.03 | 19.07 0.02 |
| 7 | 80.75638 | 33.42536 | 22.43 0.03 | 19.37 0.02 |
| 8 | 80.69583 | 33.39625 | 21.77 0.02 | 18.95 0.01 |
| 9 | 80.65854 | 33.40050 | 23.63 0.09 | 20.19 0.03 |
| 10 | 80.74296 | 33.37753 | 22.15 0.03 | 19.74 0.02 |
| 11 | 80.69575 | 33.43133 | 22.75 0.05 | 19.63 0.02 |
| 12 | 80.70321 | 33.42994 | 22.88 0.04 | 19.74 0.02 |
| 13 | 80.64454 | 33.43739 | 21.73 0.02 | 19.20 0.02 |
| 14 | 80.71604 | 33.44136 | 24.32 0.15 | 20.67 0.03 |
| 15 | 80.72604 | 33.42392 | 23.23 0.06 | 20.16 0.02 |
| 16 | 80.74096 | 33.45031 | 23.83 0.10 | 20.55 0.04 |
| 17 | 80.69533 | 33.36542 | 22.09 0.02 | 19.37 0.02 |
| 18 | 80.70000 | 33.44533 | 20.81 0.01 | 18.57 0.01 |
| 19 | 80.69396 | 33.44772 | 22.76 0.04 | 19.55 0.02 |
| 20 | 80.68996 | 33.44886 | 21.20 0.02 | 18.72 0.01 |
| 21 | 80.73087 | 33.44939 | 24.11 0.13 | 20.48 0.03 |
| 22 | 80.72146 | 33.45006 | 22.24 0.03 | 19.38 0.02 |
| 23 | 80.65863 | 33.45064 | 23.40 0.08 | 20.58 0.04 |
| 24 | 80.75554 | 33.46075 | 22.32 0.03 | 19.85 0.02 |
| 25 | 80.67600 | 33.45364 | 23.09 0.06 | 19.93 0.03 |
| 26 | 80.72067 | 33.46458 | 23.43 0.07 | 20.06 0.03 |
| 27 | 80.68438 | 33.41661 | 20.44 0.01 | 18.11 0.01 |
| 28 | 80.69267 | 33.45094 | 23.02 0.06 | 19.63 0.02 |
| 29 | 80.72354 | 33.42625 | 23.71 0.10 | 20.21 0.03 |
| 30 | 80.71304 | 33.46053 | 23.90 0.14 | 20.32 0.03 |
| 31 | 80.63804 | 33.46564 | 21.61 0.03 | 19.20 0.02 |
| 32 | 80.69742 | 33.46828 | 23.49 0.11 | 20.16 0.03 |
| 33 | 80.68633 | 33.38081 | 24.43 0.18 | 21.27 0.07 |
| 34 | 80.72071 | 33.38917 | 23.47 0.08 | 20.05 0.03 |
| 35 | 80.68033 | 33.40683 | 24.32 0.19 | 20.39 0.03 |
| 36 | 80.71533 | 33.40808 | 24.06 0.13 | 20.41 0.03 |
| 37 | 80.73371 | 33.41489 | 22.19 0.02 | 19.08 0.01 |
| 38 | 80.70925 | 33.40958 | 23.03 0.06 | 19.89 0.02 |
| 39 | 80.71037 | 33.41331 | 23.66 0.10 | 20.55 0.03 |
| 40 | 80.67242 | 33.42939 | 21.02 0.02 | 18.50 0.01 |
| 41 | 80.69050 | 33.43528 | 23.31 0.07 | 20.49 0.04 |
| 42 | 80.68492 | 33.43072 | 23.11 0.07 | 19.88 0.02 |
| 43 | 80.73079 | 33.44306 | 23.13 0.06 | 19.94 0.02 |
| 44 | 80.70250 | 33.44439 | 21.86 0.02 | 19.06 0.01 |
| 45 | 80.65404 | 33.37956 | 23.95 0.14 | 20.82 0.05 |
| 46 | 80.71221 | 33.36967 | 19.96 0.01 | 17.82 0.01 |
| 47 | 80.70875 | 33.44600 | 21.99 0.06 | 19.00 0.02 |
| 48 | 80.70008 | 33.36347 | 18.88 0.01 | 16.98 0.01 |
| 49 | 80.70225 | 33.40778 | 19.80 0.01 | 17.59 0.01 |
| 50 | 80.67783 | 33.41528 | 22.42 0.04 | 19.57 0.02 |
| 51 | 80.73717 | 33.44658 | 22.15 0.03 | 19.26 0.02 |
| 52 | 80.68675 | 33.41978 | 22.42 0.04 | 19.73 0.02 |
| 53 | 80.68450 | 33.41511 | 21.30 0.02 | 18.81 0.01 |
| 54 | 80.69863 | 33.44711 | 20.77 0.01 | 18.13 0.01 |
| 55 | 80.74375 | 33.44139 | 23.61 0.08 | 20.66 0.04 |
| V eV | I eI | |||
|---|---|---|---|---|
| 56 | 80.69458 | 33.39606 | 22.87 0.05 | 19.85 0.02 |
| 57 | 80.71696 | 33.44383 | 23.10 0.05 | 20.21 0.03 |
| 58 | 80.72688 | 33.43981 | 22.68 0.05 | 20.06 0.03 |
| 59 | 80.70908 | 33.44658 | 18.97 0.01 | 17.41 0.01 |
| 60 | 80.73842 | 33.44344 | 21.17 0.02 | 18.72 0.01 |
| 61 | 80.68525 | 33.42400 | 23.06 0.05 | 20.10 0.03 |
| 62 | 80.68050 | 33.44478 | 22.40 0.03 | 19.52 0.02 |
| 63 | 80.68983 | 33.41750 | 21.68 0.02 | 18.75 0.01 |
| 64 | 80.69846 | 33.41500 | 21.70 0.02 | 18.97 0.01 |
| 65 | 80.70829 | 33.41067 | 20.86 0.02 | 18.37 0.01 |
| 66 | 80.70017 | 33.41553 | 20.31 0.01 | 18.14 0.01 |
| 67 | 80.69579 | 33.42458 | 20.04 0.01 | 17.94 0.01 |
| 68 | 80.70346 | 33.42611 | 19.88 0.01 | 17.81 0.01 |
| 69 | 80.71450 | 33.41242 | 20.53 0.01 | 18.42 0.01 |
| 70 | 80.68837 | 33.40383 | 22.59 0.07 | 19.41 0.02 |
| 71 | 80.69200 | 33.43078 | 19.43 0.02 | 17.53 0.01 |
| 72 | 80.71504 | 33.40528 | 21.51 0.02 | 19.08 0.01 |
| 73 | 80.70096 | 33.41422 | 22.14 0.03 | 19.11 0.01 |
| 74 | 80.71096 | 33.44517 | 20.65 0.01 | 18.41 0.01 |
| 75 | 80.72900 | 33.42025 | 20.06 0.01 | 17.91 0.01 |
| 76 | 80.69771 | 33.42211 | 19.71 0.01 | 17.65 0.01 |
| 77 | 80.68375 | 33.39275 | 22.75 0.04 | 20.14 0.03 |
| 78 | 80.70804 | 33.42825 | 17.89 0.01 | 16.35 0.01 |
| 79 | 80.70304 | 33.37025 | 21.33 0.02 | 18.85 0.01 |
| 80 | 80.70808 | 33.44975 | 19.61 0.02 | 17.50 0.01 |
| 81 | 80.75825 | 33.45269 | 23.20 0.07 | 20.34 0.03 |
| 82 | 80.70363 | 33.46756 | 22.68 0.05 | 19.91 0.02 |
| 83 | 80.68200 | 33.37367 | 23.22 0.07 | 19.90 0.02 |
| 84 | 80.68908 | 33.39406 | 23.13 0.06 | 20.14 0.03 |
| 85 | 80.69333 | 33.39747 | 21.93 0.02 | 18.92 0.01 |
| 86 | 80.74046 | 33.45139 | 24.93 0.27 | 21.40 0.07 |
| 87 | 80.68050 | 33.45406 | 22.89 0.05 | 20.09 0.03 |
| 88 | 80.69779 | 33.45925 | 22.97 0.06 | 20.06 0.02 |
| 89 | 80.74229 | 33.44472 | 18.74 0.04 | 17.00 0.01 |
| 90 | 80.69917 | 33.43533 | 22.44 0.04 | 19.44 0.05 |
| 91 | 80.71362 | 33.41425 | 22.92 0.05 | 20.22 0.03 |
| 92 | 80.74192 | 33.43458 | 21.00 0.02 | 18.70 0.02 |
| 93 | 80.69258 | 33.42667 | 20.86 0.04 | 18.57 0.01 |
| 94 | 80.71742 | 33.43439 | 22.40 0.04 | 19.73 0.02 |
| 95 | 80.71613 | 33.42244 | 22.28 0.03 | 19.74 0.02 |
| 96 | 80.70333 | 33.43089 | 20.87 0.01 | 18.27 0.01 |
| 97 | 80.73067 | 33.43503 | 21.46 0.02 | 18.96 0.01 |
| 98 | 80.67933 | 33.44217 | 19.81 0.01 | 17.87 0.01 |
| 99 | 80.74229 | 33.44506 | 20.02 0.02 | 17.86 0.01 |
| 100 | 80.69483 | 33.43578 | 23.22 0.06 | 20.21 0.03 |
| 101 | 80.69554 | 33.44658 | 24.25 0.19 | 20.62 0.04 |
| 102 | 80.67579 | 33.46319 | 23.33 0.09 | 20.53 0.04 |
| 103 | 80.65292 | 33.43331 | 22.72 0.05 | 19.25 0.02 |
| 104 | 80.69171 | 33.42394 | 18.96 0.02 | 16.90 0.01 |
| 105 | 80.68162 | 33.44603 | 20.76 0.01 | 18.30 0.01 |
| 106 | 80.68975 | 33.42769 | 18.88 0.01 | 16.98 0.01 |
| 107 | 80.71637 | 33.44664 | 22.21 0.04 | 19.52 0.02 |
| 108 | 80.71179 | 33.42675 | 21.53 0.05 | 18.89 0.01 |
| 109 | 80.69796 | 33.42717 | 22.94 0.05 | 19.77 0.02 |
| 110 | 80.69467 | 33.42525 | 20.74 0.02 | 18.24 0.01 |
4 Summary & conclusions
Here, we present the results of our deep optical () observations of the central portion of the cluster NGC 1893. Thanks to the excellent observing conditions and spatial resolution of 4K4K CCD , present data are 3 mag deeper than most of the previous studies.
-
•
Considering a distance of 3.25 kpc and reddening E( - ) of 0.4 mag for the cluster, our optical data are deep enough to reveal the stars below 0.2 M⊙.
-
•
We found counterparts of 450 YSOs, candidate members and X-ray sources in our optical catalog.
-
•
We estimated the membership probability of the stars in the cluster region using the Gaia EDR3. The parallax values of the stars with high membership probability and good parallax measurements (/ϖ 5) are used to estimate the cluster distance. The estimated distance of 3.30 kpc is in good agreement with the photometric distance estimate for the cluster reported by Sharma et al. (2007).
-
•
The locations of the young stellar candidates in the /( - ) CMD show that most of them have ages 10 Myr. Comparing the CMDs for all stars and young members in the cluster region, we suggest an insignificant contribution of the field stars in the PMS zone of the cluster CMD and young stellar population of the cluster region can be identified using the CMD.
-
•
We also found that most of the candidate members having no classification flag in Caramazza et al. (2008) and X-ray sources in Caramazza et al. (2012) also occupy the locations of PMS stars in CMD.
-
•
Based on the present optical observations, we identified 425 young stars in the central portion of the cluster NGC 1893 and 110 of these were new. Our results also demonstrate that present optical observations with the 4K4K CCD reveal faint low-mass stars ( 25 mag at 60% reflectivity of the primary mirror) in the cluster NGC 1893.
-
•
The MF of our YSO sample has a power-law index of -1.43 0.15, close to the Salpeter value (-1.35) and reported for other star forming regions. The spatial distribution of the YSOs as a function of mass suggest that toward the cluster center, most of the stars are relatively massive.
Acknowledgements
We thank the referee for valuable comments that significantly improved the manuscript. We are thankful to the DTAC and staff of the 3.6-m DOT which is operated by ARIES. This work has made use of data from the European Space Agency (ESA) mission Gaia (https://www.cosmos.esa.int/gaia), processed by the Gaia Data Processing and Analysis Consortium. Funding for the DPAC has been provided by national institutions, in particular the institutions participating in the Gaia Multilateral Agreement.
References
- [1] André, P. 1995, Ap&SS, 224, 29
- [2] Andersen M., Meyer M. R., Robberto M., Bergeron L. E. & Reid N. 2011, A&A,534, A10
- [3] Bate M. R. 2009, MNRAS, 392, 1363
- [4] Blitz L., Fich M. & Stark A. A. 1982, ApJS, 49, 183
- [5] Caramazza M., Micela G., Prisinzano L., Rebull L., Sciortino S., Stauffer J. R. 2008, A&A, 488, 211
- [6] Caramazza M. et al., 2012, A&A, 539, A74
- [7] Chabrier G. 2003, PASP, 115, 763
- [8] Chabrier G. 2005, in Corbelli E., Palla F., Zinnecker H., eds, Astrophysicsand Space Science Library, Vol. 327, The Initial Mass Function 50 YearsLater. Springer, Dordrecht, p. 41
- [9] Feigelson E. D. & Montmerle T. 1999, ARA&A, 37, 363
- [10] Gaia Collaboration 2020, VizieR Online Data Catalog, I/350
- [11] Getman K. V., Feigelson E. D., Sicilia-Aguilar A., Broos P. S., Kuhn M. A. & Garmire G. P. 2012, MNRAS, 426, 2917
- [12] Girard T. M., Grundy W. M., Lopez C. E. & Van Altena W. F. 1989, AJ, 98, 227
- [13] Girardi L. et al. 2002, A&A, 391, 195
- [14] Kroupa P. 2002, Science, 295, 82
- [15] Kuhn M. A., Getman K. V., Feigelson E. D. 2015, ApJ, 802, 60
- [16] Lada C. J. & Lada E. A. 2003, ARA&A, 41, 57
- [17] Lada C. J., Muench A. A., Luhman, K. L., et al. 2006, AJ, 131, 1574
- [18] Lata et al. 2014, MNRAS, 442, 273
- [19] Lim B., Sung H., Kim J. S., Bessell M. S., Park B. G., 2014, MNRAS, 443,454
- [20] Luhman K. L. 2012, ARA&A, 50, 65
- [21] Maheswar G., Sharma S., Biman J. M., Pandey A. K., & Bhatt, H. C. 2007, MNRAS, 379, 123
- [22] Marco A. & Negueruela I. 2002, A&A, 393, 195
- [23] Ojha D. K., Tamura M., Nakajima Y. et al. 2019, ApJ, 693,634
- [24] Pandey A. K., Samal M. R., Chauhan N., Eswaraiah C., Pandey J. C., Chen W. P., Ojha D. K. 2013, New Astron., 19, 1
- [25] Pandey R., Sharma S., Panwar N. et al. 2020, ApJ, 891, 81
- [26] Pandey S. B., Yadav R. K. S., Nanjappa N., Yadav S., Krishna Reddey B.,Sahu S., Srinivasan R. 2018, Bull. Soc. Roy. Soc. Liege (BSRSL), 87,42
- [27] Panwar N., Samal M. R., Pandey A. K., Jose J., Chen W. P. et al. 2017, MNRAS, 468, 2684
- [28] Panwar N., Pandey A. K., Samal M. R. et al. 2018, AJ, 155, 44
- [29] Prisinzano L., Sanz-Forcada J., Micela G., Caramazza M., Guarcello M. G., Sciortino S., Testi L. 2011, A&A, 527, 19
- [30] Salpeter E. E. 1955, ApJ, 121, 161
- [31] Stassun K. & T. Guillermo 2021, ApJ, 907, 33
- [32] Sharma S., Pandey A. K., Ojha D. K., Chen W. P., Ghosh S. K., Bhatt B. C.,Maheswar G., Sagar R. 2007, MNRAS, 380, 1141
- [33] Siess L., Dufour E., Forestini M., 2000, A&A, 358, 5931
- [34] Yadav R. K. S., Sariya D. P. & Sagar R. 2013, MNRAS, 430, 3350