1Aryabhatta Research Institute of Observational Sciences (ARIES), Manora Peak, Nainital-263002, India.
\affilTwo2Department of Physics, Deen Dayal Upadhyaya Gorakhpur University, Gorakhpur-273009, India.
\affilThree3School of Studies in Physics and Astrophysics, Pt. Ravishankar Shukla University, Chattisgarh 492010, India.
\affilFour4Instituto de Astrofísica de Andalucía (IAA-CSIC), Glorieta de la Astronomía s/n, E-18008, Granada, Spain.
\affilFive5Departamento de Ingeniería de Sistemas y Automática, Escuela de Ingenierías, Universidad de Málaga, C. Dr. Ortiz Ramos sn, 29071 Málaga, Spain.
\affilSix6Centro Astronḿico Hispano Alemán. Observatorio de Calar Alto. Sierra de los Filabres, E-04550, Gérgal, Almeríía, Spain.
Revealing nature of GRB 210205A, ZTF21aaeyldq (AT2021any), and follow-up observations with the 4K4K CCD Imager+3.6m DOT
Abstract
Optical follow-up observations of optical afterglows of gamma-ray bursts are crucial to probe the geometry of outflows, emission mechanisms, energetics, and burst environments. We performed the follow-up observations of GRB 210205A and ZTF21aaeyldq (AT2021any) using the 3.6m Devasthal Optical Telescope (DOT) around one day after the burst to deeper limits due to the longitudinal advantage of the place. This paper presents our analysis of the two objects using data from other collaborative facilities, i.e., 2.2m Calar Alto Astronomical Observatory (CAHA) and other archival data. Our analysis suggests that GRB 210205A is a potential dark burst once compared with the X-ray afterglow data. Also, comparing results with other known and well-studied dark GRBs samples indicate that the reason for the optical darkness of GRB 210205A could either be intrinsic faintness or a high redshift event. Based on our analysis, we also found that ZTF21aaeyldq is the third known orphan afterglow with a measured redshift except for ZTF20aajnksq (AT2020blt) and ZTF19abvizsw (AT2019pim). The multiwavelength afterglow modelling of ZTF21aaeyldq using the afterglowpy package demands a forward shock model for an ISM-like ambient medium with a rather wider jet opening angle. We determine circumburst density of = 0.87 cm-3, kinetic energy = 3.80 erg and the afterglow modelling also indicates that ZTF21aaeyldq is observed on-axis () and a gamma-ray counterpart was missed by GRBs satellites. Our results emphasize that the 3.6m DOT has a unique capability for deep follow-up observations of similar and other new transients for deeper observations as a part of time-domain astronomy in the future.
keywords:
gamma-ray burst: general, gamma-ray burst: individual: GRB 210205A and ZTF21aaeyldq, methods: data analysis, telescoperahulbhu.c157@gmail.com, rahul@aries.res.in, shashi@aries.res.in
2021—
#### \volnum000 0000 \pgrange1– \lp15
1 Introduction
Gamma-ray bursts (GRBs) are among the most fascinating and luminous explosive transients, occurring at cosmological distances in the Universe. They have two distinct phases of emission; one is the prompt emission (the initial burst phase, peak at sub-MeV energy range), followed by a long-lived multiwavelength afterglow phase (Kumar & Zhang, 2015). The prompt emission can typically last from ms to minutes, whereas afterglow lasts from days to months, sometimes even in years (radio afterglows, Chandra & Frail (2012)). Origin wise, GRBs have been classified as core-collapse or compact objects merger origins such as two neutron stars (NS) merging each other, or NS- black hole (BH), or NS-white dwarf (WD) merger (Levan et al., 2016). Observationally, GRBs are classified into two different classes based on the duration of prompt gamma-ray emission. One set of bursts for which duration is less than 2 s have a harder spectrum, known as short-hard burst, and the other one is long-soft burst, having durations greater than 2 s (Kouveliotou et al., 1993). However, the recent discovery of a short GRB 200826A from a collapsar challenges the traditional classification of GRBs (Ahumada et al., 2021).
In both the cases (long and short GRBs), we see the -ray emission due to jetted emission with high Lorentz factors powered by a possible central engine. The ejected material out-flowing with high Lorentz factors can have different structures, and various shells are moving with different Lorentz factors can collide with each other creating internal shock, which is responsible for the prompt emission (Gehrels & Razzaque, 2013; Iyyani, 2018). Magnetic reconnection could also be a possible mechanism to convert the internal energy into the prompt emission (Pe’er, 2015). Later on, this material expanse and interact with the pre-existing material surrounding the GRB events (external shock), producing the broadband synchrotron radiation, which attributes to the afterglow emission (Piran, 2004; Kann et al., 2010). The external shock consists of two shock waves, the forward shock (FS) moving towards the external medium accompanied by a reverse shock (RS) which will travel into the ejecta itself. Generally, RS emission described the early afterglow data, seen in a few GRBs, and most of the afterglows data are well explained using the FS model. FS emission helps constrain the burst’s circumburst medium, jet geometry, and total energy (Piran, 2004). Furthermore, GRBs are also categorized based on the absence of emission in a particular wavelength; for example, the lack of optical emission leads to “Dark bursts,” and absence of gamma-ray emission leads to “orphan GRBs.”
Dark GRBs: The first GRB afterglow (in X-ray) associated with GRB 970228 was discovered in 1997 by BeppoSAX mission (Costa et al., 1997). Later on, an optical afterglow was also detected from ground-based follow-up observations for the same burst at redshift = 0.695 (van Paradijs et al., 1997). However, soon after the first discovery of the optical afterglow, no optical counterpart associated with GRB 970828 was detected despite deep searches (Groot et al., 1998), and the number of such GRBs (with an X-ray counterpart, but no optical counterpart) is increasing. These bursts are defined as ‘dark burst’ or ‘optically dim burst’ (Jakobsson et al., 2004; Pandey et al., 2003). In the first instance, the non-detection of optical counterparts was explained due to the delayed follow-up observations (counterpart had faded significantly below the telescopes sensitivity limit) due to the unavailability of precise localization. However, after the launch of Swift mission in 2004, rapid follow-up observations of afterglows helped reduce the fraction of dark GRBs, but still a significant fraction of dark bursts exits. From 1997 to 2020, 66 % (1443/2173) of well-localized GRBs are detected with an X-ray counterpart by various X-ray missions; however, so far, only 38 % (831/2173) GRBs are detected with an optical counterpart111https://www.mpe.mpg.de/~jcg/grbgen.html.
In the present era of Swift mission, dark GRBs have been define in the framework of the most accepted fireball model of GRBs. De Pasquale et al. (2003) propose to define the dark burst using the ratio of optical to X-ray flux. Jakobsson et al. (2004) propose to use the optical to X-ray spectral index () to define the dark GRBs (). van der Horst et al. (2009) propose to use the optical () and X-ray () spectral indices depending on the spectral regime. For example, = + 0.5, if the cooling frequency () of synchrotron spectrum is located in between the X-ray and optical frequencies and = , for all other possible spectral regime. Therefore, the possible range of in all the possible spectral regime is -0.5 . In this context, they classified the dark GRBs by .
There are various possible different factors responsible for the optical darkness of afterglows (Greiner et al., 2011). i) optical afterglows could be intrinsically faint; ii) GRBs could be detected at a high redshift, because of which the Lyman- forest emission will affect the optical emission; iii) Obscuration scenario, this could be due to dust in the GRBs host galaxies at larger distances or along the line of sight so that this could cause for a very reddened optical afterglow.
Orphan Afterglows: In the present era of GRBs, many space-based missions such as Swift, Fermi, Konus-Wind, AstroSat, INTEGRAL, etc., are continuously searching the whole sky for new GRBs candidates (prompt emission) with a large field of view (FOV). However, suppose a burst has a viewing angle () greater than the jet opening angle (). In that case, i.e., the case of off-axis observations, no gamma-ray emission will be detected as the prompt emission is beamed within an angle , where is the bulk Lorentz factor, (Totani & Panaitescu, 2002; Ghirlanda et al., 2014). Therefore, space-based missions can only discover those GRBs whose jet is directed towards the Earth. But if the beaming angle intercepts the line of sight, multiwavelength afterglow can be detected. Such afterglows without any prompt emission detection are known as “orphan afterglows.” In the current era of survey telescopes having large FOV such as Zwicky Transient Facility (ZTF), and coming facilities like the Large Synoptic Survey Telescope (LSST) help to discover more number of orphan afterglows.
Afterglow follow-up observations using 3.6m DOT: Considering India’s longitudinal advantage for the follow-up observations of GRBs, deep follow-up observations of possible afterglows of GRBs were occasionally performed (Kumar et al., 2020; Dimple et al., 2020; Ghosh et al., 2021; Gupta et al., 2021a, c) using India’s largest 3.6-meter Devasthal Optical Telescope and other facilities located at Devasthal observatory of Aryabhatta Research Institute of Observational Sciences (ARIES) Nainital. The optical and near-infrared (NIR) back-end instruments of 3.6m DOT (Sagar et al., 2020; Pandey et al., 2018) offer spectral and imaging capabilities from optical to NIR wavelength and are very important for deep observations of afterglows and other fast fading transients. ARIES has a long history of more than two decays for the afterglow follow-up observations. Deep photometric observations of afterglows are essential for identifying the associated supernovae bumps observed in nearby long bursts, the dark nature of afterglows, jet break, total energy, and their environment. On the other hand, spectroscopic observations are helpful for the redshift measurements of GRBs. In the present work, we have studied a detailed analysis of a potential dark (GRB 210205A) and an orphan afterglow (ZTF21aaeyldq) followed by 3.6m DOT. We have organized this paper in the following sections. In sections 2 and 3, we present the properties of GRB 210205A and ZTF21aaeyldq, respectively. Finally, in section 4, we have given the summary and conclusion of this work. We have used following cosmological parameters: the Hubble parameter = 70 km , density parameters , and (Jarosik et al., 2011).
2 GRB 210205A: Dark burst?
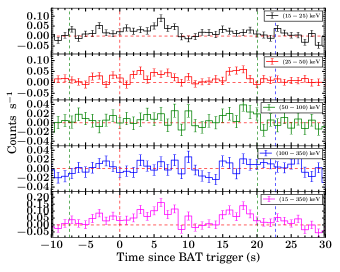
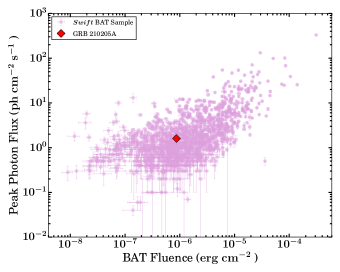
GRB 210205A was discovered by Burst Alert Telescope (BAT) instrument of NASA’s Swift mission at 11:11:17 UT on 05 February 2021 (T0) at the location RA, Dec = 347.257, +56.312 (J2000) with an uncertainty of three arcmin (Dichiara et al., 2021). We downloaded and analyzed the BAT data following the method discussed in Gupta et al. (2021b). The BAT hard X-ray mask-weighted prompt emission light curve comprises of a multi-peaked soft structure with a duration (in 15-350 keV) of 22.70 4.18 s (see Fig. 1). The time-averaged spectrum from T0-7.35 to T0 +20.07 s is best modelled by a simple power-law function with an index of 2.27 0.31 (Barthelmy et al., 2021). In this temporal window, we calculated the energy fluence equal to (8.7 1.6) (in 15-150 keV). We compared the BAT energy fluence in 15-150 keV and peak photon flux in the same energy range of GRB 210205A with all the Swift BAT detected GRBs sample. We noticed this GRB is positioned nearly at the center of this distribution (see Fig. 2), suggesting an intermediate bright GRB.
Due to the narrow spectral coverage of Swift BAT, we calculated the peak energy () of the burst using the correlation between observed fluence and peak energy (Zhang et al., 2020), i.e. = [energy fluence/()]0.28 keV. We find equal to 59.31. The softer value of further confirms that it was a long-duration GRB.
2.1 X-ray afterglow and analysis
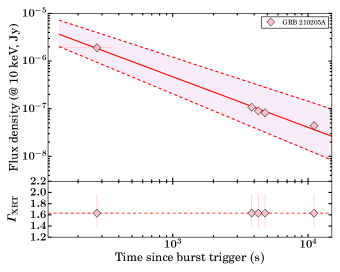
The spacecraft slewed immediately to the burst location to search for the X-ray and optical/UV afterglows. The X-ray telescope (XRT) of Swift detected a new uncatalogued X-ray source (RA, Dec = 347.2214, 56.2943 (J2000)) 134.7 seconds since BAT detection (Dichiara et al., 2021). For the present work, we retrieved the X-ray data (both light curve and spectrum) products from the Swift XRT online repository 222https://www.swift.ac.uk/ and followed the analysis methodology discussed in Gupta et al. (2021b). The X-ray afterglow light curve has been presented in Fig. 3. The evolution of X-ray photon indies in 0.3-10 keV energy range has also been presented in Fig. 3. The X-ray afterglow light curve could be best described with a power-law function with a temporal index of 1.06 (it is in good agreement with the result of the light curve fitting available at the XRT page333https://www.swift.ac.uk/xrt_live_cat/01030629/). As no redshift has been reported for this GRB, we modelled the time-averaged X-ray afterglow spectrum (T0 + 143 to T0 + 39716 s) considering redshift equal to 2, roughly mean redshift value for long bursts. The spectrum could be modelled using an absorption power-law with following spectral parameters: hydrogen column density for the host galaxy ( and = 1.17. To constrain the spectral regime, we implemented the closure relations for ISM and wind-like medium. We find that X-ray emission is explained with an adiabatic deceleration without an energy injection case. The closure relations also indicate that the X-ray afterglow could be best described with spectral regime for a constant as well as wind ambient medium with the electron energy index p 2.34.
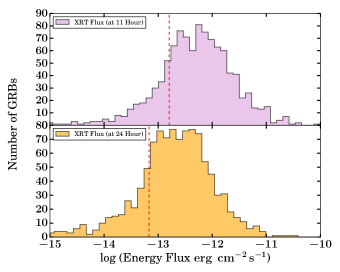
Further, we compared the XRT flux of GRB 210205A at 11 hours and 24 hours post burst in 0.3-10 keV energy range with a complete sample of X-ray afterglows of long GRBs detected by Swift XRT till August 2021. We noticed that the X-ray afterglow of GRB 210205A is faint in comparison to the typical X-ray afterglows at both the epochs (see Fig. 4).
2.2 Optical follow-up observations and analysis
| (days) | Exposure (s) | Magnitude | Filter | Telescope | References |
|---|---|---|---|---|---|
| 1.0921 | 2 x 300 | R | 3.6m DOT | Present work | |
| 1.1033 | 2 x 300 | I | 3.6m DOT | Present work |
Swift Ultra-violet and Optical telescope (UVOT) (Dichiara et al., 2021), and Xinglong GWAC-F60A telescope (Xin et al., 2021) started searching for the early optical emission, but no optical afterglow associated with GRB 210205A was detected. We performed the search for any new optical source using 0.6m Burst Observer and Optical Transient Exploring System (BOOTES) robotic telescope 1.18 hours post burst. We did not detect any new source within the Swift XRT enhanced position (Osborne et al., 2021; Hu et al., 2021). Furthermore, many other ground-based telescopes also performed deeper observations, but no optical afterglow candidate was reported (Fu et al., 2021; Lipunov et al., 2021; Horiuchi et al., 2021).
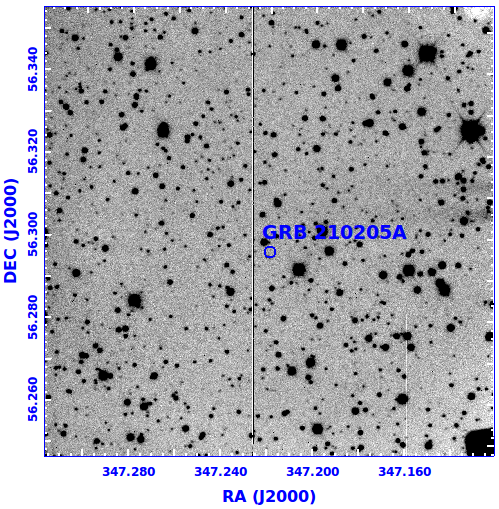
Further, we started the search for the optical afterglow of this XRT localized burst using the 15 m pixel size 4K4K Charge-coupled device (CCD) Imager placed at the axial port of the newly installed 3.6m DOT of ARIES Nainital. The 4K4K CCD Imager is capable of deep optical imaging within a field of view of 6.5′ 6.5′ (Pandey et al., 2018). Multiple frames with exposure times of 300 s each were taken in R, and I filters 1.10 days post burst (Pandey et al., 2021). We do not find evidence of an optical afterglow source inside the XRT error circle, in agreement with other optical non-detections (see Table 1). We constrain the 3-sigma upper limits ( 22.8 mag in R and 22.6 mag in I filters, respectively). A finding chart obtained using 4K4K CCD Imager is shown in Fig. 5.
2.3 Spectral energy distribution
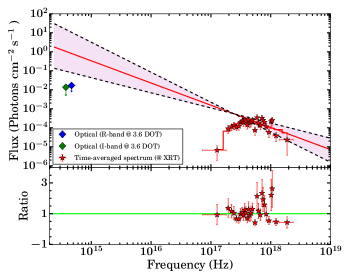
Spectral energy distribution (SED) is helpful to constrain the afterglow behavior. Considering no spectral break between X-ray and optical frequencies, we extrapolated the X-ray spectral index towards optical frequencies to constrain the upper limit of the intrinsic flux of optical afterglow. We found that our deep limiting magnitude values (Galactic extinction corrected) obtained using 3.6m DOT telescope in R and I filters lie below the extrapolated X-ray power-law slope (see Fig. 6). This suggests that it requires absorption, and GRB 210205A could be a potential dark GRB candidate. We calculated the lower limit of extinction (the host extinction in I filter (AI) 0.25 mag) using the SED.
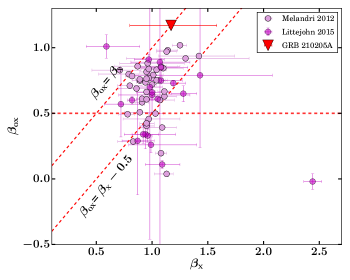
Furthermore, we constrain the upper limit on X-ray-to-optical spectral slope ( 1.17), as the closure relation suggest for spectral regime. We compared the value of as a function of of GRB 210205A along with a large sample of dark population studied by Melandri et al. (2012); Littlejohns et al. (2015). We find a hint that GRB 210205A satisfies the definition of dark GRBs given by van der Horst et al. (2009). The distribution of as a function of for GRB 210205A is shown in Fig. 7.
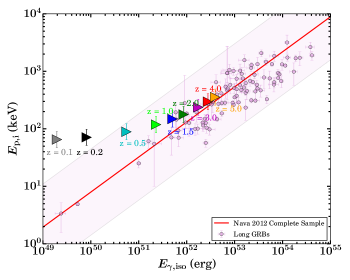
It is clear that neither optical afterglow is detected nor any host galaxy associated with the burst was reported to measure the redshift of GRB 210205A. So, we have used the Amati correlation to explore the possibility of high redshift origin of the burst. We used BAT fluence value to constrain the lower limit on isotropic gamma-ray energies for a range of redshift values = 0.1 to = 5. Fig. 8 shows the position of GRB 210205A for different values of redshift in the Amati correlation plane of long GRBs along with other data points taken from Nava et al. (2012). This analysis indicates that GRB 210205A might be a high redshift burst (with large associated uncertainties). Our analysis suggests that the source was not highly extinguished; therefore, both possibilities, i.e., intrinsically faint or a high redshift origin, could be possible reasons for the optical darkness of this burst.
3 ZTF21aaeyldq (AT2021any): An orphan afterglow
The Zwicky Transient Facility (ZTF) announced the discovery of ZTF21aaeyldq (AT2021any) at the location RA= 08:15:15.34, DEC= -05:52:01.2 (J2000) with filter magnitude of 17.90 (AB). The object was discovered at 06:59:45.6 UT on 16th January 2021, only 22 minutes after the last non-detection ( 20.28). ZTF carried out two additional observations in the same filter over the next 3.3 hours, and it confirmed that the transient has rapidly faded by two magnitudes (Ho et al., 2021). Ho et al. (2021) suggested that the color of the source is moderately red ( 0.3 mag). They also searched for the counterpart/host galaxy, but no such object is visible in deep Legacy Imaging Survey pre-imaging down to a limit of 24 magnitudes (Dey et al., 2019). These characteristics suggest that ZTF21aaeyldq is a fast fading, hostless, and Young optical transient.
de Ugarte Postigo et al. (2021) confirm the afterglow behavior of ZTF21aaeyldq using photometric observations and measured the redshift using spectroscopic observations taken with OSIRIS instrument mounted on 10.4m GTC at 16.60 hours post the first detection. They identified many strong absorption lines such as Ly-alpha, SII, OI, SiII, SiIV, CII, CIV, FeII, AlII, and AlIII at a common redshift of = 2.514 (redshift of ZTF21aaeyldq).
We explored the Swift GRBs archive web page444https://swift.gsfc.nasa.gov/archive/grb_table/ hosted by NASA’s Goddard Space Flight Center, Fermi GBM Sub-threshold archive page 555https://gcn.gsfc.nasa.gov/fermi_gbm_subthresh_archive.html, Fermi GBM GRBs catalog666https://heasarc.gsfc.nasa.gov/W3Browse/fermi/fermigbrst.html, and GCN Circulars Archive777https://gcn.gsfc.nasa.gov/gcn3_archive.html for searching the associated gamma-ray counterpart of ZTF21aaeyldq between the last non-detection by ZTF (at 06:39:27 UT on 16 Jan 2021) and the first ZTF detection (at 06:59:46 UT on 16 Jan 2021). No GRB associated with ZTF21aaeyldq is detected using any space-based -ray telescopes during this temporal window. However, on the same day ( 46 minutes before the last non-detection of ZTF) AstroSat Cadmium Zinc Telluride Imager (CZTI) and Large Area X-ray Proportional Counter (LAXPC) detected a burst (GRB 210116A) with a duration of 9.5 s (Nadella et al., 2021) but due to unavailability of precise localization of GRB 210116A, it could not be confirm or rule out the association between both the events. Considering the typical GRBs energy fluence threshold value of (Cenko et al., 2013), we constrain the isotropic equivalent gamma-ray energy erg.
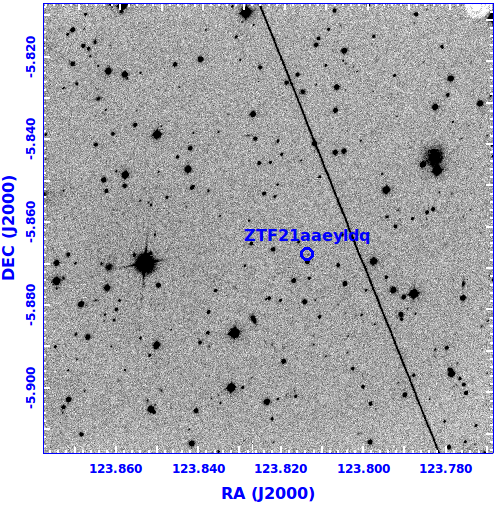
We observed ZTF21aaeyldq using the 4K4K CCD Imager installed at the axial port of the 3.6m DOT, started 15.258 hours after the ZTF first detection (Kumar et al., 2021). We obtained two images with an exposure time of 300 seconds each in Bessel R and I filters. We reduced the data following the method discussed in Gupta et al. (2021b). We also detected an uncatalogued source in both R, and I filters at the location reported by Ho et al. (2021). A finding chart (R-filter) showing the detection of ZTF21aaeyldq, obtained using the 4K4K CCD Imager mounted at the 3.6m DOT, is presented in Fig. 9. Further, we again observed the source in the r filter at 9.40 days after the first discovery using the same instrument and telescope. We acquired a consecutive set of 12 images with an exposure time of 300 seconds each. We do not detect any optical counterpart up to a magnitude limit of 23.98 in the stacked image (Ghosh et al., 2021).
In addition to follow-up of ZTF21aaeyldq using 3.6m DOT, we also performed the observations of this source using the 2.2m CAHA telescope located in Almeria (Spain) equipped with the CAFOS instrument. We obtained multiple images in BVRI filters with an exposure time of 240 s for each frame, starting at 00:02:24 UT on 17th January 2021. The optical counterpart is clearly detected in R and I filters and marginally visible in the V filter at the ZTF location. Using this telescope, we again monitored the object at the second epoch in the same filter system BVRI, starting at 04:08 UT. However, the source could not be detected during our second epoch of observations. We reduced the data using the same methodology as we did for 3.6m DOT. We calibrated the instrumental magnitudes with the nearby stars present in the USNO-B1.0 catalog (same stars used for 3.6m DOT data calibration). We have listed the optical photometry log of our observations of ZTF21aaeyldq along with those obtained using different gamma-ray coordination networks (GCNs) in Table 2.
| (days) | Exposure (s) | Magnitude | Filter | Telescope | References |
| 0.0141 | – | 17.90 0.06 | r | ZTF | Ho et al. (2021) |
| 0.6998 | 1 x 60 | 21.64 0.03 | r | 10.4m GTC | de Ugarte Postigo et al. (2021) |
| 0.8451 | 5 x 300 | 21.86 0.04 | r | NOT | Zhu et al. (2021) |
| 0.8261 | 5 x 300 | 22.28 0.05 | g | NOT | Zhu et al. (2021) |
| 1.8230 | – | 23.39 0.11 | g | 2.2m MPG | Guelbenzu et al. (2021) |
| 2.0199 | – | 23.47 0.06 | g | 2.2m MPG | Guelbenzu et al. (2021) |
| 2.8700 | – | 23.84 0.09 | g | 2.2m MPG | Guelbenzu et al. (2021) |
| 0.8641 | 5 x 300 | 21.65 0.03 | i | NOT | Zhu et al. (2021) |
| 1.0556 | 3 x 180 | 22.10 0.20 | i | Lowell | Ahumada et al. (2021) |
| 0.9969 | 1 x 900 | 21.62 0.20 | J | LBT | Rossi et al. (2021) |
| 0.9969 | 1 x 900 | 21.36 0.24 | H | LBT | Rossi et al. (2021) |
| 1.7584 | 10 x 360 | 22.89 0.12 | Rc | 2.2m CAHA | Kann et al. (2021) |
| 0.7259 | 1 x 240 | 22.97 | B | 2.2m CAHA | Present work |
| 0.8964 | 1 x 240 | 22.13 | B | 2.2m CAHA | Present work |
| 0.7297 | 1 x 240 | 22.17 0.39 | V | 2.2m CAHA | Present work |
| 0.8998 | 1 x 240 | 21.40 | V | 2.2m CAHA | Present work |
| 0.7332 | 1 x 240 | 21.22 0.12 | R | 2.2m CAHA | Present work |
| 0.9032 | 1 x 240 | 20.96 | R | 2.2m CAHA | Present work |
| 0.7367 | 1 x 240 | 21.23 0.19 | I | 2.2m CAHA | Present work |
| 0.9066 | 1 x 240 | 20.01 | I | 2.2m CAHA | Present work |
| 0.6498 | 1 x 300 | 21.25 0.06 | R | 3.6m DOT | Present work |
| 0.6546 | 1 x 300 | 21.36 0.08 | I | 3.6m DOT | Present work |
| 9.3963 | 12 x 300 | r | 3.6m DOT | Present work |
3.1 Afterglow behaviour of ZTF21aaeyldq
| Obs Ids | (days) | Count Rate | Energy range | Flux | Telescope |
|---|---|---|---|---|---|
| 00013991001 | 1.02 | 6.66 | 0.3-10 keV | 2.99 | Swift XRT |
| 00013991002 | 4.24 | 0.0043513 | 0.3-10 keV | 1.95 | Swift XRT |
| 00013991003 | 9.35 | 0.0040133 | 0.3-10 keV | 1.80 | Swift XRT |
After the independent discovery of the afterglow candidate by ZTF, several ground-based telescopes detected the source in different filters888https://gcn.gsfc.nasa.gov/other/ZTF21aaeyldq.gcn3. In addition to multi-band optical/NIR observations, Ho & Zwicky Transient Facility Collaboration (2021) reported the detection of X-ray afterglow based on a target-of-opportunity (ToO) observations obtained using Swift XRT, 19.82 hours after the last ZTF non-detection. We obtained and reduced the XRT data using the online tool known as Build Swift-XRT products999https://www.swift.ac.uk/user$_$objects/ provided by the Swift team. Swift-XRT observed the source at three different epochs (Obs Ids: 00013991001, 00013991002, and 00013991003) with a total exposure time of 8.2 ks (see Table 3). However, the source is only detected at the first epoch ( 24.50 hours post ZTF last non-detection) at the location of ZTF21aaeyldq with a count rate of 6.66 s-1 in 0.3-10 keV. Considering the Galactic hydrogen column density value (Willingale et al., 2013) and X-ray photon index value of 2, we calculated the unabsorbed flux equal to 2.99 and X-ray luminosity equal to 1.60 at equal to 2.514. The measured X-ray luminosity is typical of GRB X-ray afterglows at this epoch. We have used Portable, Interactive Multi-Mission Simulator (PIMMS) tool of NASA’s HEASARC page101010https://heasarc.gsfc.nasa.gov/cgi-bin/Tools/w3pimms/w3pimms.plto calculate the unabsorbed flux. During last two epochs observations, no X-ray emission has been detected at the ZTF afterglow positions. We obtained 3- upper limits on count rate equal to 0.0043513 ( 4.24 days post ZTF last non-detection) and 0.0040133 ( 9.35 days post ZTF last non-detection) at second and third epoch of observations, respectively. Considering the same values of and X-ray photon index, we converted these count rates into an upper limit on the flux density of 1.95 and 1.80 , respectively.
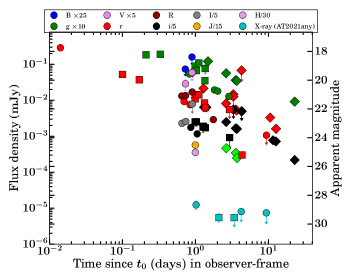
The afterglow light curve of ZTF21aaeyldq has been shown in Fig. 10. The photometric magnitudes have been corrected for foreground extinction before converting them into flux units. The optical afterglow light curve of ZTF21aaeyldq has been continuously fading since the first detection by ZTF, typical characteristics of afterglows. We fitted the early band data taken from Ho et al. (2021); de Ugarte Postigo et al. (2021); Zhu et al. (2021) and found that the band light curve is best described with a single power-law model with a temporal decay slope equal 0.89 0.03, consistent with the slope reported by Kann et al. (2021). Later on, Kann et al. (2021) observed the afterglow candidate ZTF21aaeyldq with the 2.2m telescope at Calar Alto, Spain, in the Rc filter at 2.8 days after the first detection, and with Gamma-ray Burst Optical/Near-infrared Detector (GROND) mounted at the 2.2m MPG telescope at 3.9 days after the first ZTF detection, respectively. They detected the source clearly in each stacked frame. Further, they fitted the optical data taken from various GCNs (Ho et al., 2021; de Ugarte Postigo et al., 2021; Zhu et al., 2021; Guelbenzu et al., 2021) along with their observations. They found that a broken power-law is better fitting the data (/dof = 0.12) with temporal index before the break () equal to 0.95 0.03, temporal index after the break () equal to 2.30 0.76, and break time Tb equal to 0.82 0.08 days. Our late-time observations using 3.6m DOT ( 9.40 days post first detection) are also consistent with the temporal index after the break suggested by (Kann et al., 2021). However, we could not confirm if the break is achromatic/chromatic due to the unavailability of simultaneous multi-wavelength data. In any case, the jet break is a typical characteristic of GRB afterglows, and it indicates that the nature of ZTF21aaeyldq is a GRB afterglow. Since this event was established as an orphan afterglow based on no detection of any associated GRBs between the last non-detection and the first detection of optical emission by ZTF, we extended our analysis by comparing the properties with other orphan events with a redshift measurement. The light curve evolution of ZTF21aaeyldq with other known orphan afterglows (ZTF20aajnksq/AT2020blt and ZTF19abvizsw/AT2019pim) are shown in Fig. 10. In the case of ZTF20aajnksq, we collected data from Ho et al. (2020) and for ZTF19abvizsw (: at 07:35:02 UT on 1st September 2019, the last non-detection111111https://www.wis-tns.org/object/2019pim), we obtained optical observations from Kasliwal et al. (2020). Based on the above, we noticed that ZTF21aaeyldq has many similar features with classical GRBs afterglows. The measured redshift of ZTF21aaeyldq is typical of long GRBs, and the strong absorption lines identified in the optical spectrum are usually present in GRBs afterglows at measured redshift. The detection of X-ray counterpart with typical X-ray luminosity also indicates the afterglow nature of ZTF21aaeyldq. In addition to these, the presence of a break in the optical light curve with typically expected temporal indices due to jet break confirms the afterglow behavior of the source.
3.2 Afterglow modelling of ZTF21aaeyldq
According to the standard external shock fireball model for the afterglows, the X-ray and optical emission from afterglows can be described with synchrotron emission for constant or WIND like external medium (Sari et al., 1998). The broadband synchrotron spectral energy distribution consists of three break frequencies: the synchrotron cooling frequency , the synchrotron peak frequency , and the synchrotron self-absorption frequency . The self-absorption frequency does not affect the X-ray and optical data at early epochs, and it mainly affects the low-frequency observations of afterglows. Depending on the ordering of these break frequencies, we can constrain the spectral regimes of afterglows at a particular epoch (Pandey et al., 2003).
Detailed multiwavelength modelling is helpful to constrain physical parameters associated with the afterglow. We performed detailed multiwavelength modelling of the light curve of the ZTF21aaeyldq afterglow using the publicly available afterglowpy Python package. It is an open-source numerical and analytic modelling tool to calculate the multiwavelength light curve and spectrum using synchrotron radiation from an external shock for the afterglows of GRBs (Ryan et al., 2020). afterglowpy package has capabilities to produce the light curves and spectrum of afterglows considering both structured jets and off-axis observers. We have used Markov chain Monte Carlo (MCMC) Ensemble sampler using emcee python package for fitting the multiwavelength light curve to get the model parameters and associated errors.
| Model Parameter | Unit | Prior Type | Range | Best fit Value |
|---|---|---|---|---|
| rad | [0.01, 1.20] | |||
| erg | uniform | [51, 52.7] | ||
| rad | uniform | [0.01, 1.20] | ||
| cm-3 | uniform | [-6, 1.6] | ||
| - | uniform | [2.0001, 2.5] | ||
| - | uniform | [-3.6, -1.2] | ||
| - | - | 1 | - |
There are various jet structures possible for GRBs afterglows. afterglowpy has capabilities to produce the light curves for some commonly used jet structures such as top-hat, Gaussian, Power-law, etc. We have used the top-hat jet type structure to model the afterglow data of ZTF21aaeyldq using the afterglowpy package. For top hat jet-like afterglows, we consider six free parameters (: viewing angle, : on-axis isotropic equivalent energy, : half-width of the jet core, : number density of ISM medium, : electron distribution power-law index, and : thermal energy fraction in magnetic field). We have fixed the (thermal energy fraction in electrons) value = 0.10 (Panaitescu & Kumar, 2002). We have considered sine prior for viewing angle, and for all the remaining parameters, we have used uniform priors. In addition, we assume that the fraction of electrons that get accelerated is equal to one, and the redshift is equal to 2.514 for the model fitting. Furthermore, due to the large scales, we have set , and parameters on the log scale. We have listed the priors types and the parameters bounds for each model parameter in Table 4.
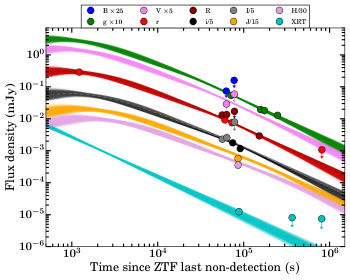
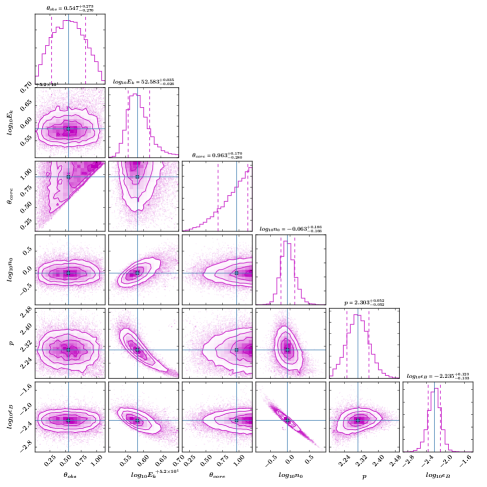
In Fig. 11, we have shown the optical and X-ray afterglow light curves of ZTF21aaeyldq along with the best fit model obtained using afterglowpy. The observed X-ray and optical data points are shown with circles in the figure. The dark-color dashed lines show the light curve generated using the median value from parameter distribution from the MCMC routine. The shaded colored bands show the uncertainty bands around the median light curve. Fig. 12 shows the posterior distribution for the best fit results of microphysical parameters obtained using MCMC simulation. The distribution of median posterior and 16% and 84% quantiles for each modeled parameter are also presented in the same plot. We modelled the optical and X-ray afterglow and obtained the following best fit micro-physical parameters: the model constrained the jet on-axis isotropic equivalent energy = 52.58 erg, the jet structure parameter = 0.96 radian, viewing angle = 0.55 radian, the ambient number density = -0.06 cm-3, the parameters electron energy index = 2.30, and = -2.24. These parameters are consistent with the typical afterglow parameters of other well studied GRBs (Panaitescu & Kumar, 2002).
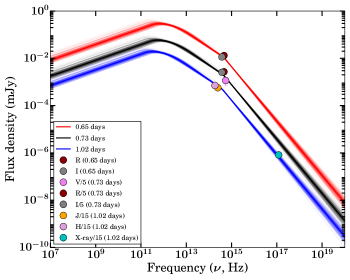
Furthermore, we created the SEDs at three epochs (see Fig. 13). The first at 0.65 days (the epoch of 3.6m DOT observations), the second at 0.73 days (the epoch of CAHA observations), and the third at 1.02 days (the epoch of detection of the X-ray emission). During the first and second SEDs, the cooling frequency () lies close to our optical observations taken with 3.6m DOT and 2.2m CAHA telescope, and later on, it seems that passes through the optical observations.
3.3 Possible explanations of the orphan afterglow
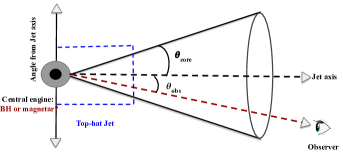
We noticed that the temporal evolution of optical data of ZTF21aaeyldq is consistent with that of typical GRB afterglows. The jet break signature in the optical data indicates that the source observing angle was within the jet opening angle. There could be three possible reasons for the origin of ZTF21aaeyldq. The simplest explanation for any orphan afterglow is that the source is observed on-axis ( ), however, the gamma-ray counterpart was unambiguously missed by space-based gamma-ray GRBs missions, either due to their sensitivity or source was not in their field of view. Our afterglow modelling suggests that this could be the case for the ZTF21aaeyldq. A schematic diagram showing a top-hat jet for the on-axis view is presented in Fig. 14. Other natural explanations for orphan afterglows could be off-axis observations ( ) and a dirty fireball.
Some authors use the off-axis jet scenarios to explain the orphan afterglows (Granot et al., 2002). The off-axis models are also useful to explain the short GRBs from structured jets (Kathirgamaraju et al., 2018), low-luminosity bursts (Liang et al., 2007) and the X-ray plateaus present in the X-ray afterglow light curves (Beniamini et al., 2020). However, in the case of ZTF21aaeyldq, our afterglow modelling suggests that ZTF21aaeyldq was a classical burst viewed on-axis, so we discard the off-axis possibility. In addition, Ryan et al. (2020) suggests a few other signatures of off-axis observations, such as an early shallow decay and a large value of change in temporal indices before and after the break (). However, in the case of ZTF21aaeyldq, we did not notice an early shallow decay, and also value is not very large. Therefore, we discard the possibility of off-axis observations.
The third possibility to explain the orphan afterglow is a dirty fireball, i.e., fireball ejecta with a low value of bulk Lorentz factor ( 5) and with large numbers of baryons. For a dirty fireball, gamma-ray photons of prompt emission are absorbed due to the optical thickness. In such a case, we expect a large value of deceleration time due to a low value of . The deceleration time for a constant density medium is defined as: = 59.6 s (Joshi & Razzaque, 2021). Considering equal to 100, we calculated = 210.68 s using the parameters obtained from afterglow modelling, but for equal to 10, we calculated = 1.13 days. We looked for the GCNs circular to find the bursts within two days before the ZTF discovery of ZTF21aaeyldq, but we did not found any coincident GRBs. In addition, we constrain the limit on bulk Lorentz factor ( 202) using the prompt emission correlation between -121212 182 (Liang et al., 2010). In the light of the above discussion, we discard the possibility of a dirty fireball.
4 Summary and Conclusion
Optical follow-up observations are helpful to constrain the jet geometry, environment, total energy, and other microphysical parameters of GRBs afterglows. India has a longitudinal advantage and a long history for these ToO observations. The recent installation of 3.6m DOT at Devasthal observatory of ARIES help us to move one step forward to these scientific goals. The back-end instruments of DOT are crucial for deep imaging and spectroscopy of afterglows. In this work, we present the analysis of two exciting afterglow sources. For GRB 210205A, an X-ray afterglow was detected by Swift XRT, but we do not find any optical counterpart despite deep follow-up observations using the 3.6m DOT telescope. We investigate the possible reason for the optical darkness of the source. We noticed that GRB 210205A has a fainter X-ray emission compared to well-known X-ray afterglows detected by Swift XRT telescope. We obtained the optical-to-X-ray spectral index and compared it with a large sample of GRBs. We found a hint that the source satisfied the recent definition of the darkness of the afterglow. We also measure the host galaxy extinction using afterglow SED, suggesting either intrinsic faintness of the source or high redshift origin as a possible reason for the optical darkness of the afterglow.
In the case of ZTF21aaeyldq, no gamma-ray prompt emission counterpart was reported by any space-based satellites, and the ZTF survey discovered this source. Based on optical identification of the afterglow, XRT observations and other follow-up observations found a fading source characterized with typical afterglow nature with redshift measured using the 10.4m GTC. Following key observational facts confirms the afterglow nature of ZTF21aaeyldq. (i) Fading nature of the source consistent with typical temporal index seen in case of afterglows. (ii) jet break in the optical light curve (iii) The detection of X-ray afterglow with typical luminosity. We performed detailed multiwavelength modelling of the afterglow, including data taken with 3.6m DOT. Our results suggest that afterglow could be described with a slow cooling case for an ISM-like ambient medium. The micro-physical afterglow parameters of ZTF21aaeyldq are consistent with the typical afterglow parameters of other well-studied GRBs. Our modelling also suggests that ZTF21aaeyldq was viewed on-axis ( ), however, the gamma-ray counterpart was unambiguously missed by space-based gamma-ray GRBs missions, either due to their sensitivity (weak prompt emission) or source was not in their field of view (Earth occultation). It helps us rule out other hypotheses for the possible origin of orphan afterglows, such as off-axis view and a low-Lorentz factor jet. We also compared the light curve evolution of ZTF21aaeyldq with other known orphan afterglows with a measured redshift. We found that the nature of the afterglow of ZTF21aaeyldq is very similar to other well-known orphan afterglows ZTF20aajnksq and ZTF19abvizsw. The comparison also indicates that during the late epochs, ZTF21aaeyldq was fainter than other known cases of orphan afterglows. Further, we measure the energetics of prompt emission (using the limit on erg) and afterglow phases of ZTF21aaeyldq and estimated a radiative efficiency (= /(+ )) 28.6 %. This suggests that most energy is used as kinetic energy and supports the internal shocks as the likely origin of prompt emission. We expect to detect more similar sources in the current era of survey telescopes with large fields of view like ZTF and others. Our results also highlight that the 3.6m DOT has a unique capability for deep follow-up observations of similar and new transients to deeper limits as a part of time-domain astronomy.
Acknowledgements
We thank the anonymous referee for providing positive and constructive comments to improve the manuscript. RG, SBP, and KM acknowledge BRICS grant DST/IMRCD/BRICS/PilotCall1/ProFCheap/2017(G) for the financial support. AA acknowledges funds and assistance provided by the Council of Scientific & Industrial Research (CSIR), India with file no. 09/948(0003)/2020-EMR-I. This research is based on observations obtained at the 3.6m Devasthal Optical Telescope (DOT) during observing cycles DOT-2021-C1 and DOT-2020-C2, which is a National Facility run and managed by Aryabhatta Research Institute of Observational Sciences (ARIES), an autonomous Institute under Department of Science and Technology, Government of India. Based on observations collected at Centro Astronómico Hispano-Alemán (CAHA) at Calar Alto, operated jointly by Junta de Andalucía and Consejo Superior de Investigaciones Científicas (IAA-CSIC). This research has made use of data obtained from the High Energy Astrophysics Science Archive Research Center (HEASARC) and the Leicester Database and Archive Service (LEDAS), provided by NASA’s Goddard Space Flight Center and the Department of Physics and Astronomy, Leicester University, UK, respectively.
References
- Ahumada et al. (2021) Ahumada, T., Singer, L. P., Anand, S., et al. 2021, Nature Astronomy. doi:10.1038/s41550-021-01428-7
- Ahumada et al. (2021) Ahumada, T., Della Costa, J., Cenko, B., et al. 2021, GCN, 29309, 1
- Barthelmy et al. (2021) Barthelmy, S. D., Cummings, J. R., Dichiara, S., et al. 2021, GCN, 29409, 1
- Beniamini et al. (2020) Beniamini, P., Duque, R., Daigne, F., et al. 2020, MNRAS, 492, 2847. doi:10.1093/mnras/staa070
- Cenko et al. (2013) Cenko, S. B., Kulkarni, S. R., Horesh, A., et al. 2013, ApJ, 769, 130. doi:10.1088/0004-637X/769/2/130
- Chandra & Frail (2012) Chandra, P. & Frail, D. A. 2012, ApJ, 746, 156. doi:10.1088/0004-637X/746/2/156
- Costa et al. (1997) Costa, E., Frontera, F., Heise, J., et al. 1997, Nature, 387, 783. doi:10.1038/42885
- De Pasquale et al. (2003) De Pasquale, M., Piro, L., Perna, R., et al. 2003, ApJ, 592, 1018. doi:10.1086/375854
- de Ugarte Postigo et al. (2021) de Ugarte Postigo, A., Kann, D. A., Perley, D. A., et al. 2021, GCN, 29307, 1
- Dey et al. (2019) Dey, A., Schlegel, D. J., Lang, D., et al. 2019, AJ, 157, 168. doi:10.3847/1538-3881/ab089d
- Dichiara et al. (2021) Dichiara, S., Ambrosi, E., Barthelmy, S. D., et al. 2021, GCN, 29397, 1
- Dimple et al. (2020) Dimple D., Panchal, A., Gangopadhyay, A., Ghosh, A., et al. 2020, GCN, 29148, 1
- Fu et al. (2021) Fu, S. Y., Zhu, Z. P., Liu, X., et al. 2021, GCN, 29401, 1
- Gehrels & Razzaque (2013) Gehrels, N. & Razzaque, S. 2013, Frontiers of Physics, 8, 661. doi:10.1007/s11467-013-0282-3
- Ghirlanda et al. (2014) Ghirlanda, G., Burlon, D., Ghisellini, G., et al. 2014, PASA, 31, e022. doi:10.1017/pasa.2014.14
- Ghosh et al. (2021) Ghosh, A., Dimple, Kumar, A., et al. 2021, GCN, 29364, 1
- Granot et al. (2002) Granot, J., Panaitescu, A., Kumar, P., et al. 2002, ApJ, 570, L61. doi:10.1086/340991
- Greiner et al. (2011) Greiner, J., Krühler, T., Klose, S., et al. 2011, A&A, 526, A30. doi:10.1051/0004-6361/201015458
- Groot et al. (1998) Groot, P. J., Galama, T. J., van Paradijs, J., et al. 1998, ApJ, 493, L27. doi:10.1086/311125
- Guelbenzu et al. (2021) Guelbenzu, A. N., Rau, A., & Klose, S. 2021, GCN, 29330, 1
- Gupta et al. (2021a) Gupta, R., Pandey, S. B., Kumar, A., et al. 2021, GCN, 29490, 1
- Gupta et al. (2021b) Gupta, R., Oates, S. R., Pandey, S. B., et al. 2021, MNRAS, 505, 4086. doi:10.1093/mnras/stab1573
- Gupta et al. (2021c) Gupta, R., Pandey, S. B., Castro-Tirado, A. J., et al. 2021, Revista Mexicana de Astronomia y Astrofisica Conference Series, 53, 113. doi:10.22201/ia.14052059p.2021.53.23
- Ho et al. (2021) Ho, A. Y. Q., Perley, D. A., Yao, Y., et al. 2021, GCN, 29305, 1
- Ho & Zwicky Transient Facility Collaboration (2021) Ho, A. Y. Q. & Zwicky Transient Facility Collaboration 2021, GCN, 29313, 1
- Ho et al. (2020) Ho, A. Y. Q., Perley, D. A., Beniamini, P., et al. 2020, ApJ, 905, 98. doi:10.3847/1538-4357/abc34d
- Horiuchi et al. (2021) Horiuchi, T., Hanayama, H., Murata, K. L., et al. 2021, GCN, 29406, 1
- Hu et al. (2021) Hu, Y.-D., Fernandez-Garcia, E., Castro-Tirado, A. J., et al. 2021, GCN, 29400, 1
- Iyyani (2018) Iyyani, S. 2018, JAA, 39, 75. doi:10.1007/s12036-018-9567-9
- Jakobsson et al. (2004) Jakobsson, P., Hjorth, J., Fynbo, J. P. U., et al. 2004, ApJ, 617, L21. doi:10.1086/427089
- Jarosik et al. (2011) Jarosik, N., Bennett, C. L., Dunkley, J., et al. 2011, ApJS, 192, 14. doi:10.1088/0067-0049/192/2/14
- Joshi & Razzaque (2021) Joshi, J. C. & Razzaque, S. 2021, MNRAS, 505, 1718. doi:10.1093/mnras/stab1329
- Kann et al. (2010) Kann, D. A., Klose, S., Zhang, B., et al. 2010, ApJ, 720, 1513. doi:10.1088/0004-637X/720/2/1513
- Kann et al. (2021) Kann, D. A., de Ugarte Postigo, A., Thoene, C. C., et al. 2021, GCN, 29321, 1
- Kann et al. (2021) Kann, D. A., Nicuesa Guelbenzu, A., de Ugarte Postigo, A., et al. 2021, GCN, 29344, 1
- Kasliwal et al. (2020) Kasliwal, M. M., Anand, S., Ahumada, T., et al. 2020, ApJ, 905, 145. doi:10.3847/1538-4357/abc335
- Kathirgamaraju et al. (2018) Kathirgamaraju, A., Barniol Duran, R., & Giannios, D. 2018, MNRAS, 473, L121. doi:10.1093/mnrasl/slx175
- Kouveliotou et al. (1993) Kouveliotou, C., Meegan, C. A., Fishman, G. J., et al. 1993, ApJ, 413, L101. doi:10.1086/186969
- Kumar et al. (2020) Kumar, A., Pandey, S. B., Aryan, A., et al. 2020, GCN, 27653, 1
- Kumar et al. (2021) Kumar, A., Pandey, S. B., Gupta, R., et al. 2021, GCN, 29308, 1
- Kumar & Zhang (2015) Kumar, P. & Zhang, B. 2015, Phys. Rep., 561, 1. doi:10.1016/j.physrep.2014.09.008
- Levan et al. (2016) Levan, A., Crowther, P., de Grijs, R., et al. 2016, Space Sci. Rev., 202, 33. doi:10.1007/s11214-016-0312-x
- Liang et al. (2007) Liang, E., Zhang, B., Virgili, F., et al. 2007, ApJ, 662, 1111. doi:10.1086/517959
- Liang et al. (2010) Liang, E.-W., Yi, S.-X., Zhang, J., et al. 2010, ApJ, 725, 2209. doi:10.1088/0004-637X/725/2/2209
- Lipunov et al. (2021) Lipunov, V., Gorbovskoy, E., Kornilov, V., et al. 2021, GCN, 29402, 1
- Littlejohns et al. (2015) Littlejohns, O. M., Butler, N. R., Cucchiara, A., et al. 2015, MNRAS, 449, 2919. doi:10.1093/mnras/stv479
- Melandri et al. (2012) Melandri, A., Sbarufatti, B., D’Avanzo, P., et al. 2012, MNRAS, 421, 1265. doi:10.1111/j.1365-2966.2011.20398.x
- Nadella et al. (2021) Nadella, D., Waratkar, G., Vibhute, A., et al. 2021, GCN, 29342, 1
- Nava et al. (2012) Nava, L., Salvaterra, R., Ghirlanda, G., et al. 2012, MNRAS, 421, 1256. doi:10.1111/j.1365-2966.2011.20394.x
- Osborne et al. (2021) Osborne, J. P., Beardmore, A. P., Evans, P. A., et al. 2021, GCN, 29399, 1
- Panaitescu & Kumar (2002) Panaitescu, A. & Kumar, P. 2002, ApJ, 571, 779. doi:10.1086/340094
- Pandey et al. (2003) Pandey, S. B., Anupama, G. C., Sagar, R., et al. 2003, A&A, 408, L21. doi:10.1051/0004-6361:20031153
- Pandey et al. (2018) Pandey, S. B., Yadav, R. K. S., Nanjappa, N., et al. 2018, Bulletin de la Societe Royale des Sciences de Liege, 87, 42
- Pandey et al. (2021) Pandey, S. B., Gupta, R., Kumar, A., et al. 2021, GCN, 29526, 1
- Pandey et al. (2003) Pandey, S. B., Sahu, D. K., Resmi, L., et al. 2003, Bulletin of the Astronomical Society of India, 31, 19
- Pe’er (2015) Pe’er, A. 2015, Advances in Astronomy, 2015, 907321. doi:10.1155/2015/907321
- Piran (2004) Piran, T. 2004, Reviews of Modern Physics, 76, 1143. doi:10.1103/RevModPhys.76.1143
- Rossi et al. (2021) Rossi, A., Palazzi, E., & Grawita Collaboration 2021, GCN, 29327, 1
- Ryan et al. (2020) Ryan, G., van Eerten, H., Piro, L., et al. 2020, ApJ, 896, 166. doi:10.3847/1538-4357/ab93cf
- Sagar et al. (2020) Sagar, R., Kumar, B., & Sharma, S. 2020, Journal of Astrophysics and Astronomy, 41, 33. doi:10.1007/s12036-020-09652-9
- Sari et al. (1998) Sari, R., Piran, T., & Narayan, R. 1998, ApJ, 497, L17. doi:10.1086/311269
- Totani & Panaitescu (2002) Totani, T. & Panaitescu, A. 2002, ApJ, 576, 120. doi:10.1086/341738
- van der Horst et al. (2009) van der Horst, A. J., Kouveliotou, C., Gehrels, N., et al. 2009, ApJ, 699, 1087. doi:10.1088/0004-637X/699/2/1087
- van Paradijs et al. (1997) van Paradijs, J., Groot, P. J., Galama, T., et al. 1997, Nature, 386, 686. doi:10.1038/386686a0
- Willingale et al. (2013) Willingale, R., Starling, R. L. C., Beardmore, A. P., et al. 2013, MNRAS, 431, 394. doi:10.1093/mnras/stt175
- Xin et al. (2021) Xin, L. P., Wang, J., Gao, C., et al. 2021, GCN, 29398, 1
- Zhang et al. (2020) Zhang, Z. B., Jiang, M., Zhang, Y., et al. 2020, ApJ, 902, 40. doi:10.3847/1538-4357/abb400
- Zhu et al. (2021) Zhu, Z. P., Fynbo, J. P. U., Perley, D. A., et al. 2021, GCN, 29310, 1