Resolved-sideband Micromotion Sensing in Yb+ on the 935 nm Repump Transition
Ions displaced from the potential minimum in a RF Paul trap exhibit excess micromotion. A host of well-established techniques are routinely used to sense (and null) this excess motion in applications ranging from quantum computing to atomic clocks. The rich atomic structure of the heavy ion Yb+ includes low-lying states that must be repumped to permit Doppler cooling, typically using a laser coupled to the states. In this manuscript we demonstrate the use of this transition to make resolved-sideband measurements of 3D micromotion in 172Yb+ and 171Yb+ ions. Relative to other sensing techniques our approach has very low technical overhead and is distinctively compatible with surface-electrode ion traps.
1 Introduction
Trapped atomic ions are an excellent platform for optical clocks, tests of fundamental physics [1], and as qubits in near-term quantum computing devices [2] [3]. Of particular interest amongst commonly trapped ionic species are the isotopes of Yb+, especially 171Yb+ as it has a spin- nucleus with a simple hyperfine qubit for straightforward laser-cooling, spin-state initialization, and readout [4]. The magnetic field insensitive clock states of the HF qubit exhibit long-lived coherence [5]. The presence of two narrow quadrupole transitions, as well as one ultra narrow octupole transition, make it a popular approach to building optical atomic clocks [6].
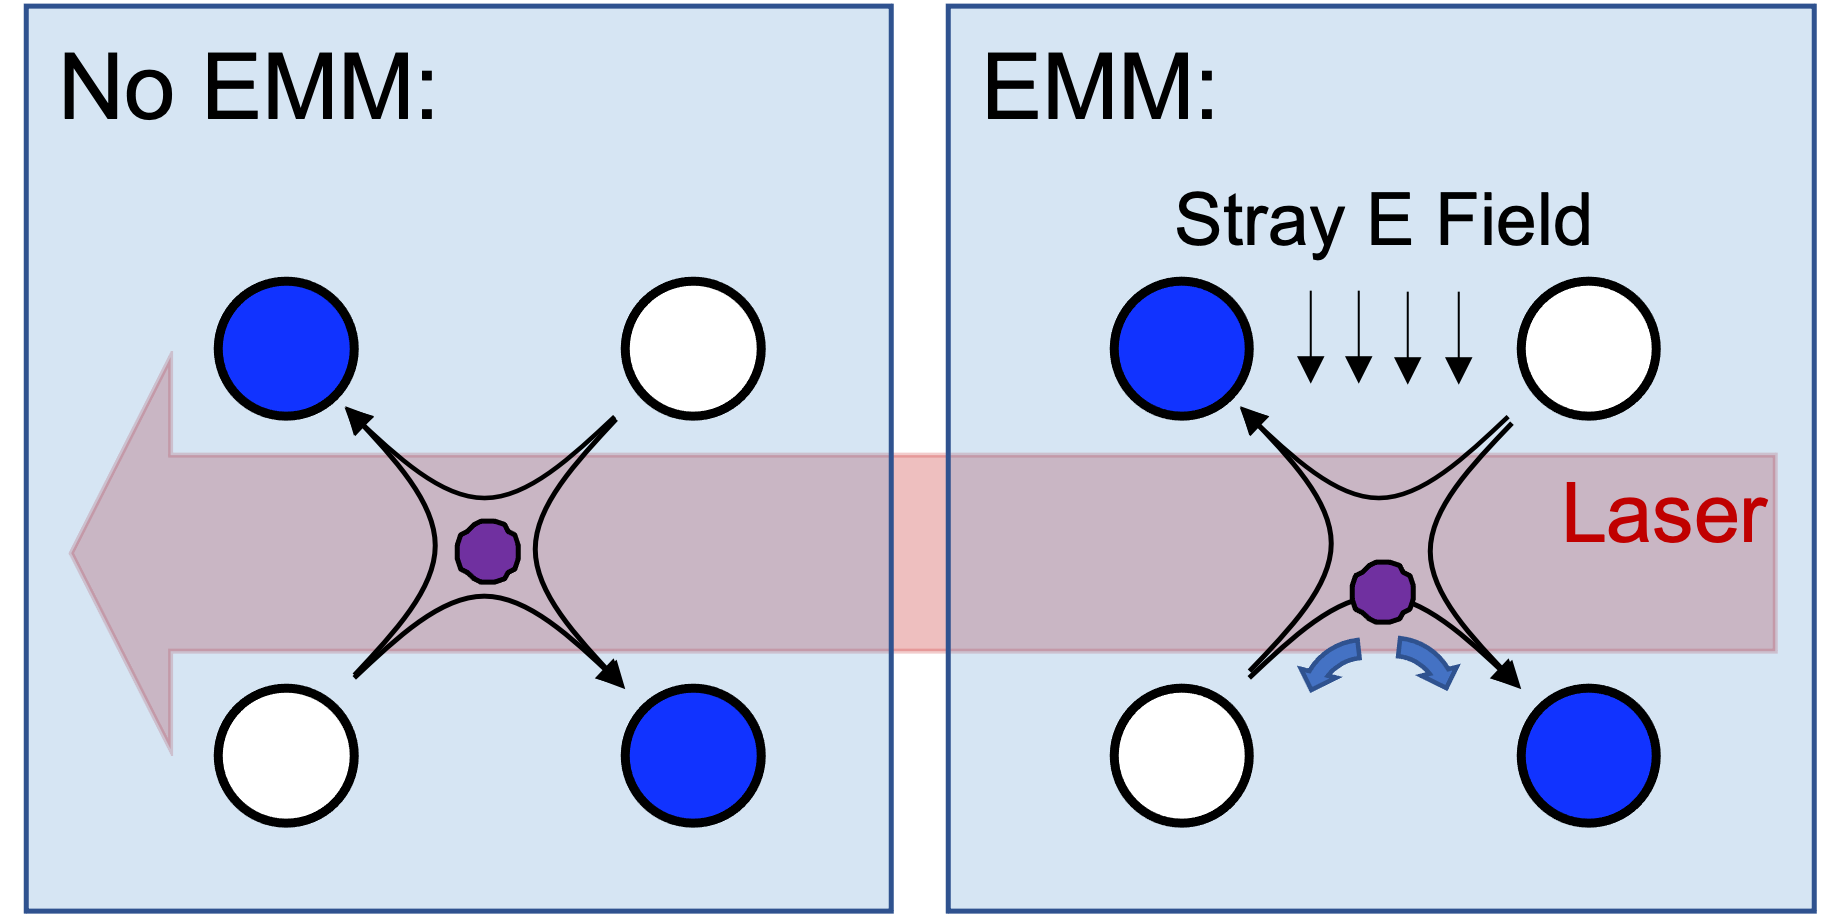
Intrinsic to ions trapped in Paul traps is micromotion at the RF trapping frequency . Micromotion along the direction of a probe laser beam causes phase modulation of the laser spectrum, complicating ion-laser interactions including Doppler cooling [7], ion qubit manipulation by Raman-type processes [8], and probing of narrow clock transitions [9]. When scaling to larger systems these also contribute to spectral crowding [10], while the motion itself contributes to heating of the ion crystal [11] and time-dilation shifts. Furthermore, as it indicates a displacement from the RF null, excess micromotion is associated with Stark shifts. Micromotion sensing and nulling is therefore a common experimental subroutine across a range of applications.
The most straightforward method for measuring micromotion is by looking for sidebands on the Doppler cooling transition. In low mass ions such as Be+ or Mg+, the usual trap RF frequencies, , are much greater than the D1 linewidth , and the micromotion sidebands are well-resolved. For heavier ions such as Yb+ or Ba+, resulting in poorly resolved sidebands. Furthermore, the probe beam must be tuned over several multiples of to unambiguously determine the modulation depth. Given that ion D1 lines are at blue or UV wavelengths, and that the required tuning range approaches or exceeds the bandwidth of available AOMs, this is technically inconvenient in day to day operations. Other techniques include monitoring the time-dependence of ion fluorescence for correlations with the trap RF period [7] [12], or by attempting to drive coherent operations on the micromotion sidebands of very narrow transitions [9]. In the case of the former, precise time tagging of photon detection events with nanosecond resolution is required. In the case of the latter, narrow lasers are needed. Full determination (and nulling) of micromotion requires measuring in three independent directions. This is complicated by many of the relevant transitions being in the UV, or at the same wavelength as used for detection. With this comes the concern that adding additional probe beams increases the amount of background scatter, adding to detection noise as well as inducing unwanted charging.
In Yb+, leakage from the primary laser cooling transition to meta-stable states in (Figure 2) is repumped through a higher lying manifold of states, forming an effective cycling transition. This transition is both an order of magnitude narrower than the primary cooling transition and smaller than the most commonly used trapping frequencies. As it plays a secondary role in cooling, this transition allows micromotion sidebands to be directly resolved in the cooling fluorescence without the overhead of coherently driving a clock-like transition. Being in the IR, concerns of background scattering hampering the signal to noise or inducing charging are essentially eliminated. This drastically eases alignment constraints for probing in three dimensions, a particular challenge for surface traps. Furthermore, minimal additional hardware is required beyond the standard components necessary for trapping 171Yb+. The few that are required are cheap, off the shelf IR fiber components. This presents a straight forward method of rapid 3D micromotion measurement for day to day calibrations, particularity in cases such as surface traps and integrated optical cavities where nearby surfaces would be susceptible to induced charging from additional UV beams.
2 Methods
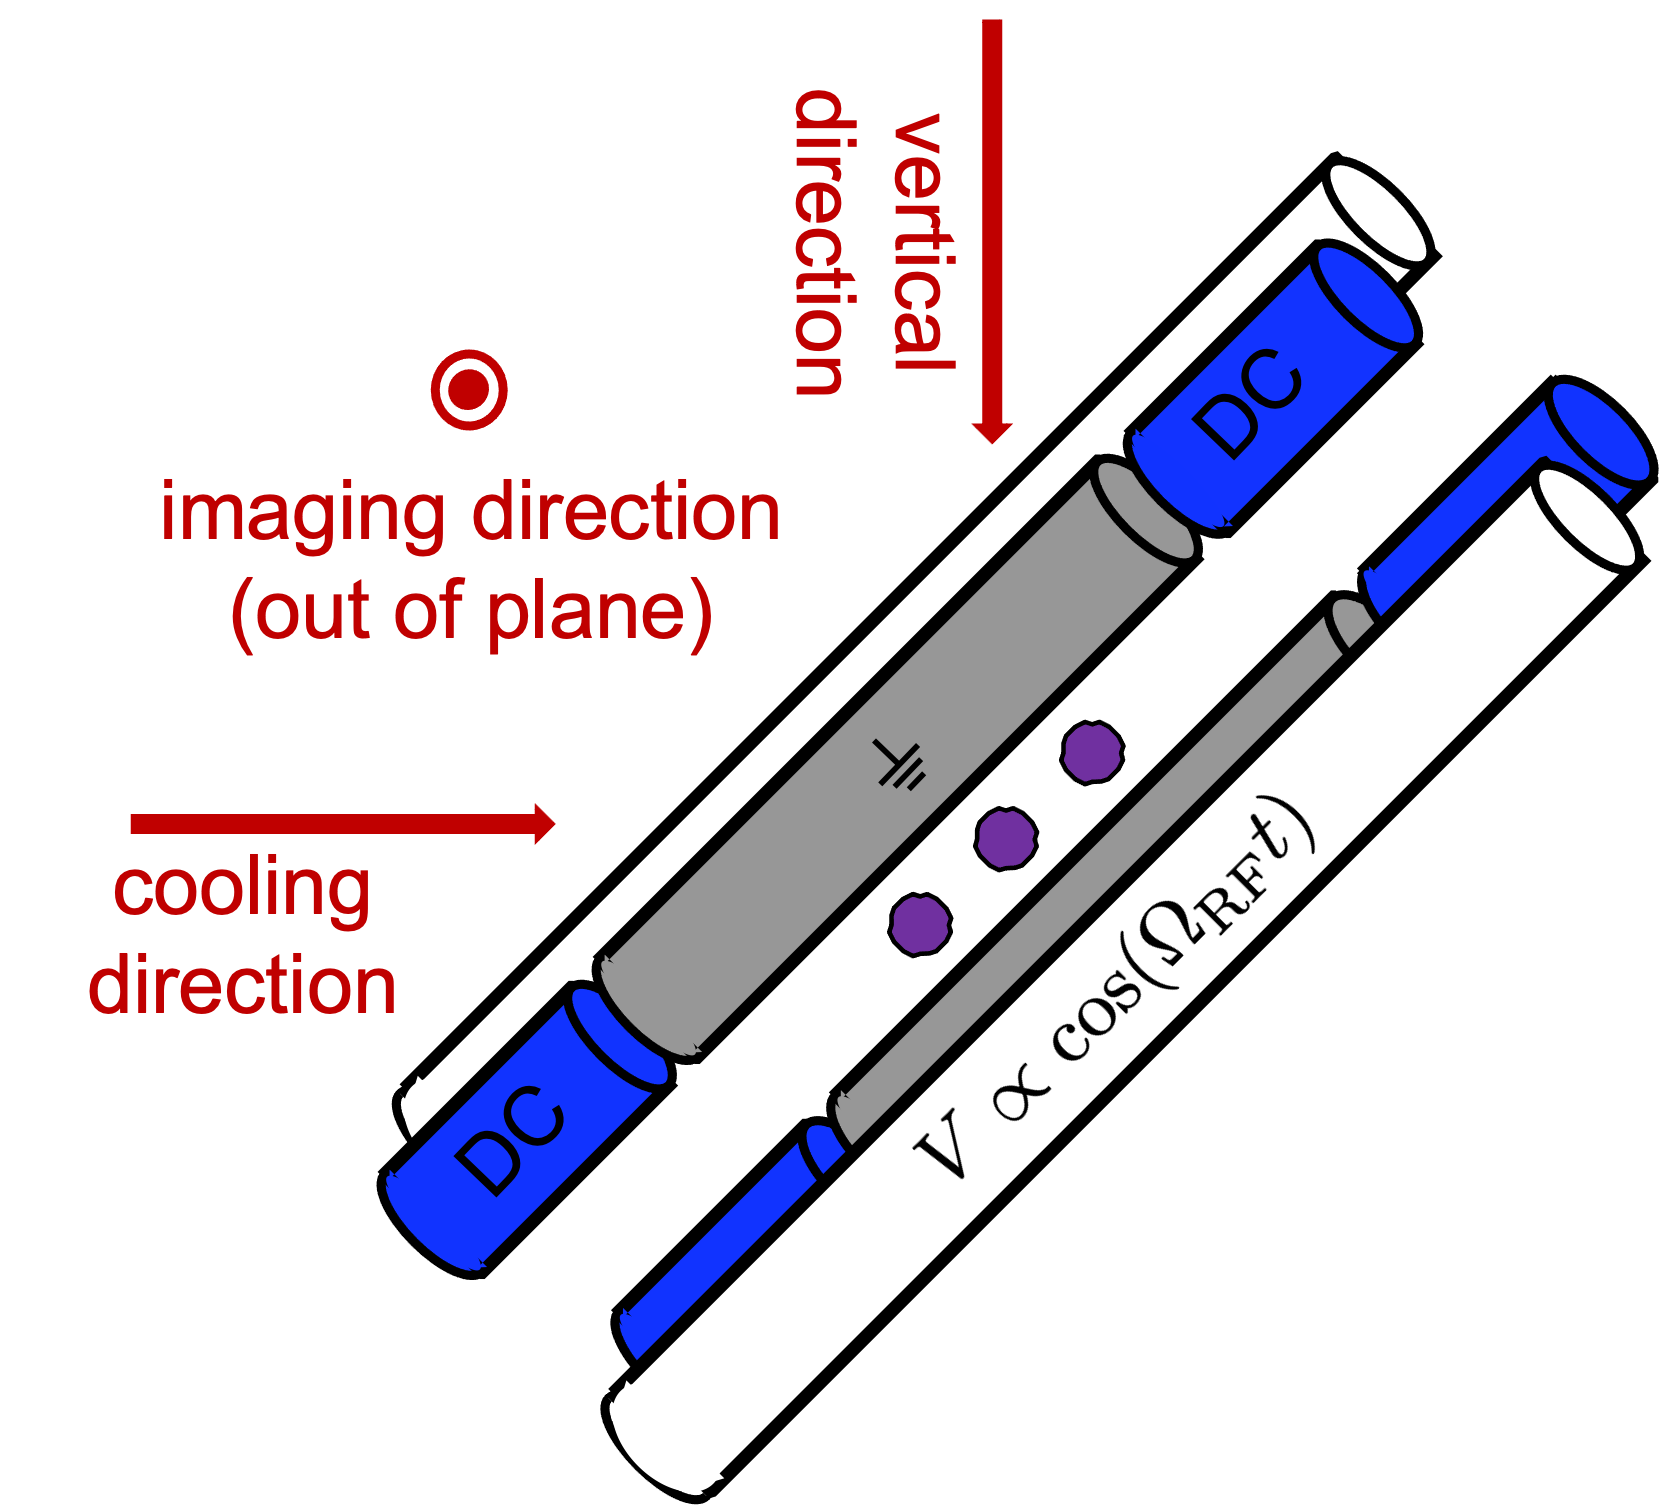
We load ytterbium ions into a blade trap analogous to the diagram in Figure 1(a), with a trap frequency . Copropagating light, light, as well as light involved in isotope selective photoionization are sent along the “cooling” direction in order to load and Doppler cool the ions along all three principal directions. The relevant level structure of a Yb+ ion can be seen in Figure 2. Doppler cooling is achieved on the strong transition at [4]. The can also decay to via a dipole allowed transition at , which happens about once per every 200 scattering events on the primary cooling transition. The ion is returned to the cooling cycle by application of laser light at driving the transition, where the states decay predominantly to the manifold.
For the 171Yb+ isotope, the cooling cycle stays primarily confined to the hyperfine levels. The only leakage channel directly allowed by selection rules is to the hyperfine states of the manifold. This is repumped through the state of the manifold, closing the cycle. Leakage to other hyperfine states in the and manifolds arises from off resonant scatter, namely from the cooling beam scattering off the unintended transition detuned by . Sidebands at approximately and are added to the and beams, respectively, restoring population in the cooling cycle. A small magnetic field of 4 gauss is applied to lift the Zeeman degeneracy and prevent population trapping in coherent dark states [13] [14].
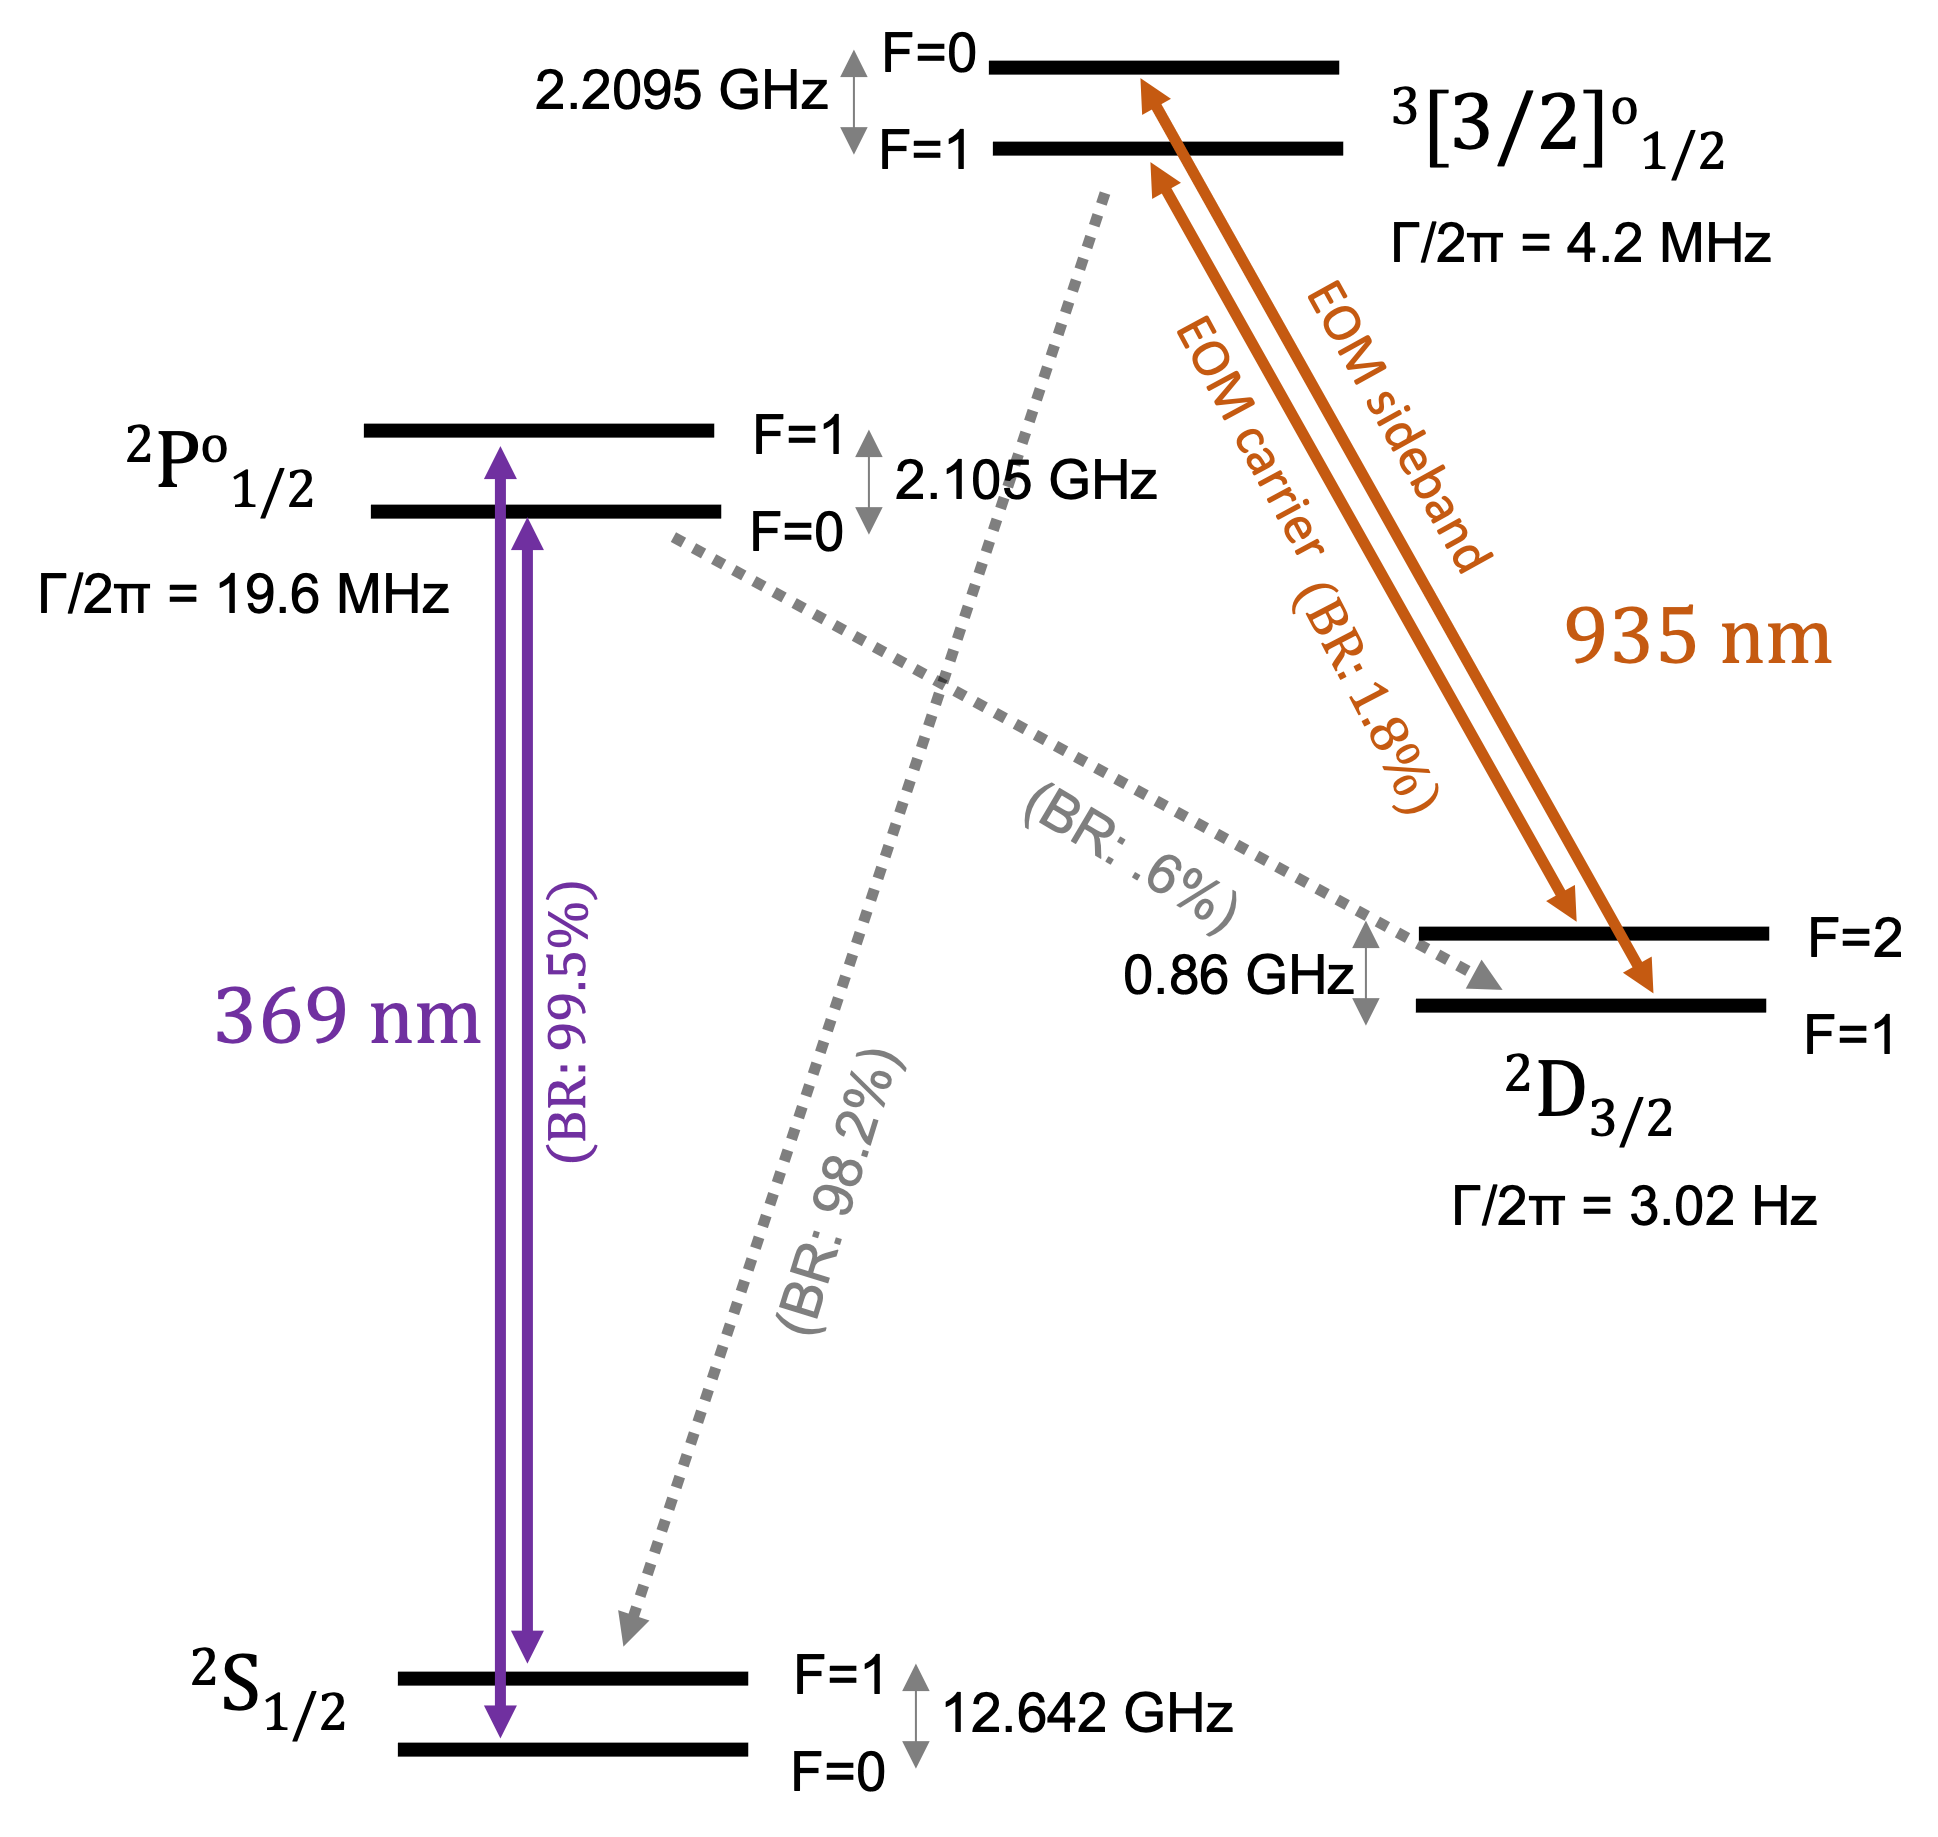
In contrast to the transition with a linewidth of , the transition has a natural linewidth of , an order of magnitude lower than both the cooling linewidth and the trap RF. When the repump light is far detuned, the branching ratio is sufficient to rapidly pump the ion into the , causing the ion to go dark. In contrast, when an excitation of the does occur, the ion is almost immediately returned to the cooling cycle, yielding fluorescence. As a result the lineshape of the repump transition, with micromotion sidebands spectrally well resolved, can be probed by monitoring cooling fluorescence. This is without driving a narrow clock like transition, and only involves varying the frequency and intensity of the light.
In the absence of micromotion and approximating level structure as a four level system, the dependence of the P state population, and hence the detected fluorescence, on the cooling and repump laser parameters is given by
| (1) |
In the above expression, and are the on resonant saturation parameters of the cooling and repump beams, and are their detunings normalized to the and total scattering rates and , and is the scattering rate from state to . See the Appendix for a justification of this lineshape. For convenience, “B” is used to denote the “bracket” state. In the limit of a weak repumping relative to leakage into the states, , this can be approximated to first order in as
| (2) |
With the addition of micromotion sidebands on the repump laser, the form of the fluorescence lineshape becomes
| (3) |
can either be extracted from a fit of this lineshape, or if it is sufficiently small and the sidebands well resolved, directly from the ratio of the measured fluorescence on the carrier and first sideband, .
To measure the amplitude of micromotion in 3D, we extend the directions we can probe with light by adding two additional beam paths, one vertical and one colinear with the imaging objective. A MEMs-mirror-based fiber switch controls which direction the is applied along, while a fiber EOM adds sidebands which are rapidly tunable over many GHz. A fiber AOM is used to dynamically control the amplitude; set to full during standard cooling, and attenuated to be below saturation when probing micromotion.
The technique was first validated using 172Yb+ as its D1 transition has no coherent dark states. This allows the ion to be trapped at zero magnetic field, in turn preventing any Zeeman splitting on the transition, keeping the micromotion sidebands maximally resolved. In order to provide agile control of the probe light, the laser was tuned so that the fiber EOM carrier was detuned red of the desired transition. The first blue sideband was used to provide repumping, allowing fast tuning of the repump color over a large detuning range.
For micromotion detection directly with 171Yb+, the carrier of the EOM was set on resonance with the transition, preventing population buildup from off resonant scattering into this state. The first blue sideband of the EOM was set to span the hyperfine splitting, driving the transition. The magnetic field was increased to approximately 4 G to prevent coherent dark states and resulting in Zeeman broadening of the transitions, however, micromotion sidebands remain resolvable given the trap frequency.
Using the measured micromotion as feedback, the trapping potentials were then modified to reduce EMM in simultaneously in all three directions. This was facilitated by independent control of the DC voltages applied to all four of the end cap electrodes on the two DC blades (analogous to the four blue electrodes labeled “DC” in diagram 1(a)) as well as the to the center DC electrodes (analogous to the gray grounded electrodes in 1(a)). In addition, a DC bias could be added to each of the RF blades. Control of all of the trapping potentials, lasers, and measurements was performed using ARTIQ [15].
3 Results
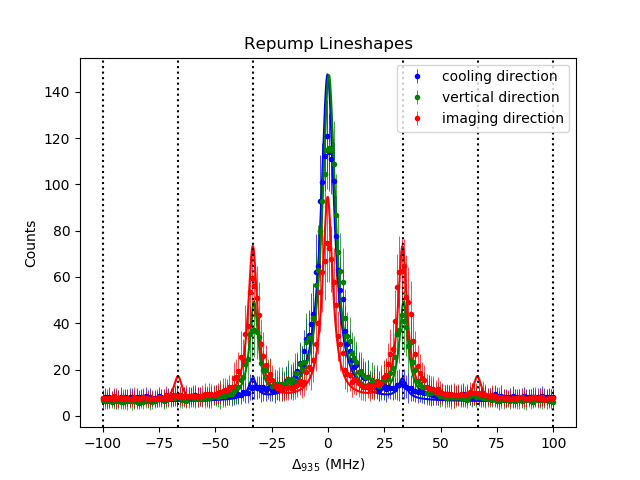
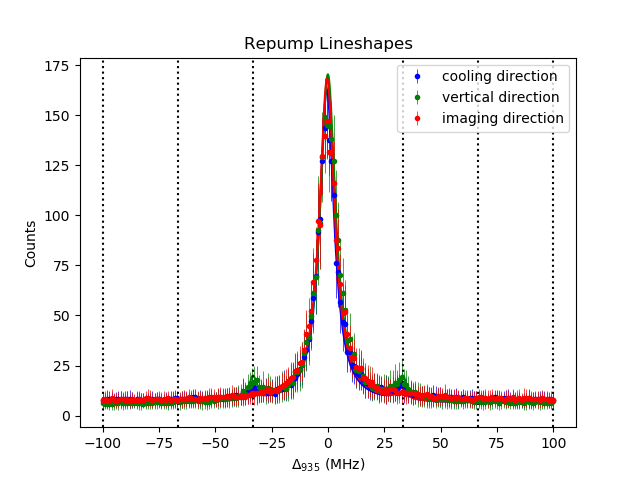
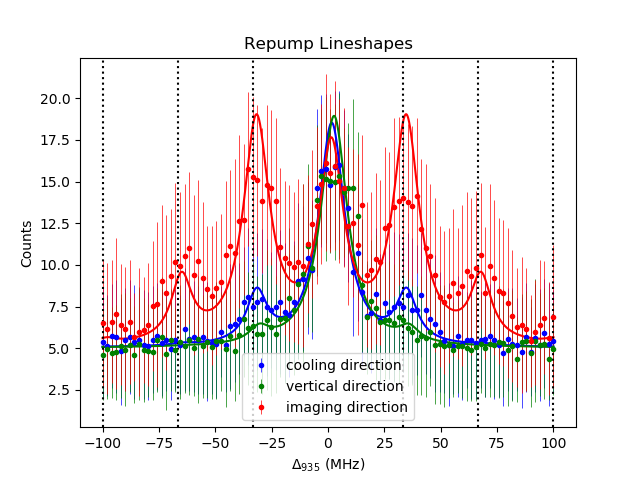
The effective lineshape of the transition of 172Yb+ along three independent directions, observed as the efficacy of restoring fluorescence at for various detunings, can be seen in Figure 3. The necessity of a full 3D measurement when minimizing micromotion is made clear by Figure 3(a). The trapping potentials used when this lineshape was taken were arrived at by first minimizing micromotion along the direction of the cooling beam with the standard photon correlation method at . Although successful in that direction, large amounts of micromotion remained present in the orthogonal plane; making clear that reduced micromotion along one direction is not a sufficient proxy for the for the other two.
Similarly, the 3D lineshape can be taken for 171Yb+, as shown in Figure 4. Fluorescence from this isotope is reduced relative to 172Yb+ due the presence of coherent dark states on the primary cooling transition [13]. Being able to measure micromotion directly with 171Yb+, however, is desired since this is often the isotope of interest.
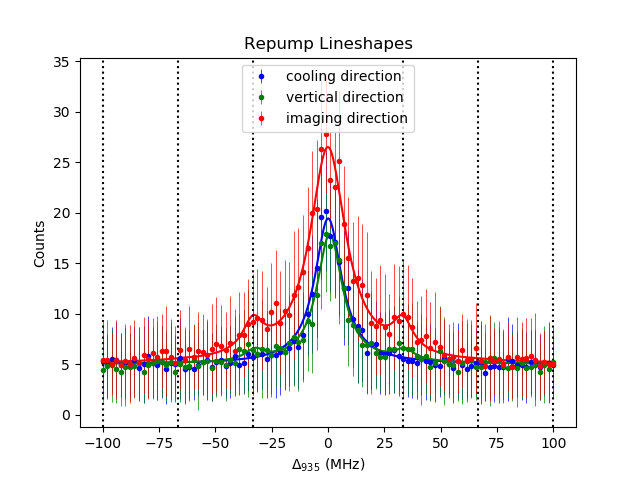
Fitting lineshapes of the form of Eq. (3), the modulation depths along all three directions were extracted. The results for the two isotopes can be seen in Tables 1 and 2, respectively, with the minimum achieved modulation depth corresponding to a sensitivity of . Differences between the modulation depths measured for the two isotopes can be explained by charging in between measurements, as the measurements were taken at different times and charging had been observed to occur, particularity after alignment of the various UV beams.
| direction | With EMM | Reduced EMM |
|---|---|---|
| cooling | ||
| vertical | ||
| imaging |
| direction | With EMM | Reduced EMM |
|---|---|---|
| cooling | ||
| vertical | ||
| imaging |
4 Conclusion
Probing the repump lineshape of trapped Yb+ ions allows rapid detection of micromotion in 3D, including in directions otherwise inaccessible to UV lasers used in standard measurement techniques. Issues of induced charging are reduced, precise photon timing is not required, and measurement does not depend on coherent control. Well developed NIR fiber technology is available, providing agile control of the probe beams for rapid measurements. Furthermore, because the detected signal is the ratio of fluorescence observed on the sidebands relative to the carrier, this method readily extends to large crystals of ions that may have differing absolute count rates due to spatial gradients in the beam intensities. If site resolved imaging and readout is available, a full map of the 3D micromotion can be simultaneously mapped across an entire crystal.
The convenience of this method allows integration as a rapid calibration subroutine that can be incorporated in day to day operation of Yb+ systems. This will be particularly advantageous in future experiments where the ion(s) are located near dielectric surfaces with time-varying stray charges, such as mirrors of small volume optical cavities [16]. It may also serve helpful in efforts to extend ion crystals into two dimensions, where excess micromotion along some directions becomes unavoidable [17] [18].
Appendix A Repump Lineshape
The expected lineshape (1) is derived by approximating Yb+ as a four level system and solving the Lindblad Master equation. Considering the undriven eigenstates as a basis, , the undriven Hamiltonian is
| (4) |
For “cooling” and “repump” lasers driving transitions between and , respectively, the Hamiltonian for the drive fields under the rotating wave approximation (RWA) is
| (5) |
Moving to a rotating frame by making the transformation where
| (6) |
the full Hamiltonian under the rotating wave approximation becomes time independent:
| (7) |
The states and are allowed to decay to both and , as encoded in the Lindbald superoperator
| (8) |
where and is the anti-commutator. Quadrupole decays of D to S have been ignored for simplicity. This is a safe approximation given that the decay rate of the is , which is orders of magnitude slower that the other rates involved (see Figure 2). Finding the steady state solution of of the Lindblad Master equation
| (9) |
by setting and solving the resulting system of equations with the normalization condition , the observed fluorescence is proportional to . The dependence of on the and laser parameters is given by Eq. (1).
References
- [1] Ian Counts et al. “Evidence for Nonlinear Isotope Shift in Yb + Search for New Boson” In Physical Review Letters 125.12, 2020, pp. 123002 DOI: 10.1103/PhysRevLett.125.123002
- [2] K. Wright et al. “Benchmarking an 11-Qubit Quantum Computer” In Nature Communications 10.1, 2019, pp. 5464 DOI: 10.1038/s41467-019-13534-2
- [3] Laird Egan et al. “Fault-Tolerant Control of an Error-Corrected Qubit” In Nature, 2021 DOI: 10.1038/s41586-021-03928-y
- [4] S. Olmschenk et al. “Manipulation and Detection of a Trapped Yb + Hyperfine Qubit” In Physical Review A 76.5, 2007 DOI: 10.1103/PhysRevA.76.052314
- [5] Pengfei Wang et al. “Single Ion Qubit with Estimated Coherence Time Exceeding One Hour” In Nature Communications 12.1, 2021, pp. 233 DOI: 10.1038/s41467-020-20330-w
- [6] N. Huntemann et al. “High-Accuracy Optical Clock Based on the Octupole Transition in Yb + 171” In Physical Review Letters 108.9, 2012, pp. 090801 DOI: 10.1103/PhysRevLett.108.090801
- [7] D.. Berkeland et al. “Minimization of Ion Micromotion in a Paul Trap” In Journal of Applied Physics 83.10, 1998, pp. 5025–5033 DOI: 10.1063/1.367318
- [8] J.. Gaebler et al. “High-Fidelity Universal Gate Set for Be 9 + Ion Qubits” In Physical Review Letters 117.6, 2016 DOI: 10.1103/PhysRevLett.117.060505
- [9] J. Keller, H.. Partner, T. Burgermeister and T.. Mehlstäubler “Precise Determination of Micromotion for Trapped-Ion Optical Clocks” In Journal of Applied Physics 118.10, 2015, pp. 104501 DOI: 10.1063/1.4930037
- [10] D. Kielpinski, C. Monroe and D.. Wineland “Architecture for a Large-Scale Ion-Trap Quantum Computer” In Nature 417.6890, 2002, pp. 709–711 DOI: 10.1038/nature00784
- [11] Kuang Chen, Scott T. Sullivan, Wade G. Rellergert and Eric R. Hudson “Measurement of the Coulomb Logarithm in a Radio-Frequency Paul Trap” In Physical Review Letters 110.17, 2013, pp. 173003 DOI: 10.1103/PhysRevLett.110.173003
- [12] D.. Nadlinger et al. “Micromotion Minimisation by Synchronous Detection of Parametrically Excited Motion”, 2021 arXiv: http://arxiv.org/abs/2107.00056
- [13] D.. Berkeland and M.. Boshier “Destabilization of Dark States and Optical Spectroscopy in Zeeman-Degenerate Atomic Systems” In Physical Review A 65.3, 2002 DOI: 10.1103/PhysRevA.65.033413
- [14] S. Ejtemaee, R. Thomas and P.. Haljan “Optimization of Yb + Fluorescence and Hyperfine-Qubit Detection” In Physical Review A 82.6, 2010 DOI: 10.1103/PhysRevA.82.063419
- [15] Sébastien Bourdeauducq “M-Labs/Artiq”, 2021 M-Labs URL: https://github.com/m-labs/artiq
- [16] M. Steiner, H.. Meyer, J. Reichel and M. Köhl “Photon Emission and Absorption of a Single Ion Coupled to an Optical-Fiber Cavity” In Physical Review Letters 113.26, 2014 DOI: 10.1103/PhysRevLett.113.263003
- [17] Marissa D’Onofrio et al. “Radial Two-Dimensional Ion Crystals in a Linear Paul Trap” In Physical Review Letters 127.2, 2021, pp. 020503 DOI: 10.1103/PhysRevLett.127.020503
- [18] Bryce Yoshimura et al. “Creation of Two-Dimensional Coulomb Crystals of Ions in Oblate Paul Traps for Quantum Simulations” In EPJ Quantum Technology 2.1, 2015, pp. 2 DOI: 10.1140/epjqt14