Constraints on partial half-lives of 136Ce and 138Ce double electron captures
Abstract
The -ray emissions from a radiopure cerium-bromide crystal with a mass of 4381 g were measured for a total of 497.4 d by means of high-resolution -ray spectrometry in the HADES underground laboratory at a depth of 500 m.w.e. A search for and double beta decay transitions of 136Ce and 138Ce was performed using Bayesian analysis techniques. No signals were observed for a total of 35 investigated decay modes. 90% credibility limits were set in the order of a. Existing constraints from a cerium oxide powder measurement were tested with a different cerium compound and half-life limits could be improved for most of the decay modes. The most likely accessible decay mode of the 136Ce transition into the state of results in a new best 90% credibility limit of a.
pacs:
Valid PACS appear hereI Introduction
Neutrinoless double beta () decay is a second-order weak nuclear decay process requiring physics beyond the Standard Model (SM) of particle physics. The observation of decay would establish lepton number violation (LNV) and neutrinos as Majorana particles. It would also open up possibilities to explain the matter-antimatter asymmetry in the Univserse converting Leptogenesis into Baryogenesis (see e.g. Ref. dep18 ). The inverse of the decay half-life in a given isotope is conventionally expressed as
| (1) |
with the phase space factor and the nuclear matrix element . The LNV mechanism can have many origins. Under the assumption of light Majorana neutrino exchange, it is connected with and allows to constrain the absolute neutrino mass scale. While decay is one of the most promising avenues to search for new physics, the similar neutrino-accompanied double beta () decay is allowed within the SM:
| (2) |
with half-life
| (3) |
It was detected directly in 11 isotopes so far with half-lives between 1018 and 1021 a tre02 ; sak13 and provides valuable experimental information to better understand the complex nuclear physics of double beta decay processes and isotopes. Equivalent processes based on the right side of the mass parabola are decays such as (1) double electron capture , (2) electron capture with positron emission and (3) double positron emission :
| (4) | |||||
| (5) | |||||
| (6) |
The experimental sensitivity for those processes is considerably lower compared to decay and, except for two cases, only lower limits for the half-lives in the range of a could be obtained for a few isotopes tre02 ; tre95 ; gav06 ; bel09 ; ruk10 . In Ref. mesh01 the total weak decay ( + + ) half-life for 130Ba is reported as T1/2 = (2.2 0.5) 1021 a (68% C.L.) based on a geochemical analysis of natural barite (BaSO4).
Recently a first direct observation of could be achieved in with a half-life of a apr19 .
decays into excited states, the focus of this work, are so far only observed in two nuclides, and , with
average half-lives of a and a, respectively ESAverage .
The first observations of these decay modes were performed with samples on HPGe detectors in the “sourcedetector” approach that is also employed here.
Neutrinoless double-beta decay has not been observed, yet. Although much effort is being made to improve the sensitivity by using the “sourcedetector” approach, increasing the target mass, isotopic fraction of the nuclide under consideration and improving the radio-purity of the sample, only lower limits of the decay half-lives are reported. Leading half-life limits and sensitivities recently exceeded a by the KamLAND-ZEN KLZ0nbb and GERDA Gerda0nbb experiments for and , respectively.
The recent development of production of large cerium-bromide detectors put cerium isotopes in the focus of double beta decay searches.
Cerium has three isotopes, which are candidates for double beta decay: 136,138Ce and 142Ce.
Moreover, being used as -ray detectors offers the possibility to exploit the “sourcedetector” approach for cerium bel03 ; ber97 ; bel11 .
In this work, we measure double beta decays in a cylindrical CeBr3 crystal of size 10.2 cm 10.2 cm (diameter length) with 4381 g mass with an ultra-low-background HPGe detector in the “sourcedetector” approach. The large size of the crystal contains a significantly greater number of cerium atoms than were available in previous searches. Thorough characterization of the material itself and other crystals produced by the same company revealed a very high radio-purity lutter13 ; bil11 . This provides excellent background conditions for investigating rare decay processes and the possibility for future “sourcedetector” measurements if additional background from the light readout is kept low.
II Double beta decays in cerium
Natural cerium consists of 4 isotopes out of which only (88.45% abundance) is expected to be stable. The long lived isotopes , , and are candidates for double beta decay:
-
•
has a high natural abundance of 11.11% and is a candidate for the decay with an energy release of keV Qvalues . The first excited state is at 1575.8 keV which is higher than the Q-value. Hence, no excited state of its daughter 142Nd can be populated and the decay cannot be measured by -ray spectrometry.
-
•
has a natural abundance of 0.251% and is a candidate for the decay with keV Qvalues . Also in this case no excited state of can be populated and the experimental signature for the mode are only barium X-rays with energies below 40 keV. Due to the high absorption of the low energy X-rays, this decay channel will not be studied. In case of the mode, the excess of energy due to the non-emission of the 2 neutrinos can be released through a bremsstrahlung photon in addition to the X-rays. The energy of the emitted photon, E0ν, is equal to:
(7) where Eβ1 and Eβ2 are the binding energies of the K, L1, L2, L3 shells. In case of barium these are EK = 37.4 keV, EL1 = 6.0 keV, EL2 = 5.6 keV and EL3 = 5.2 keV. Due to the energy resolution of the -ray spectrometer the EL energies cannot be distinguished. Therefore, the mean value of EL, 5.6 keV, is taken for the analysis.
For the LK, and LL decays of 138Ce we expect the emission of a photon at (647.6 5) keV and (679.4 5) keV. Note that due to angular momentum constraints the KK decay to a state is not possible doi93 .
-
•
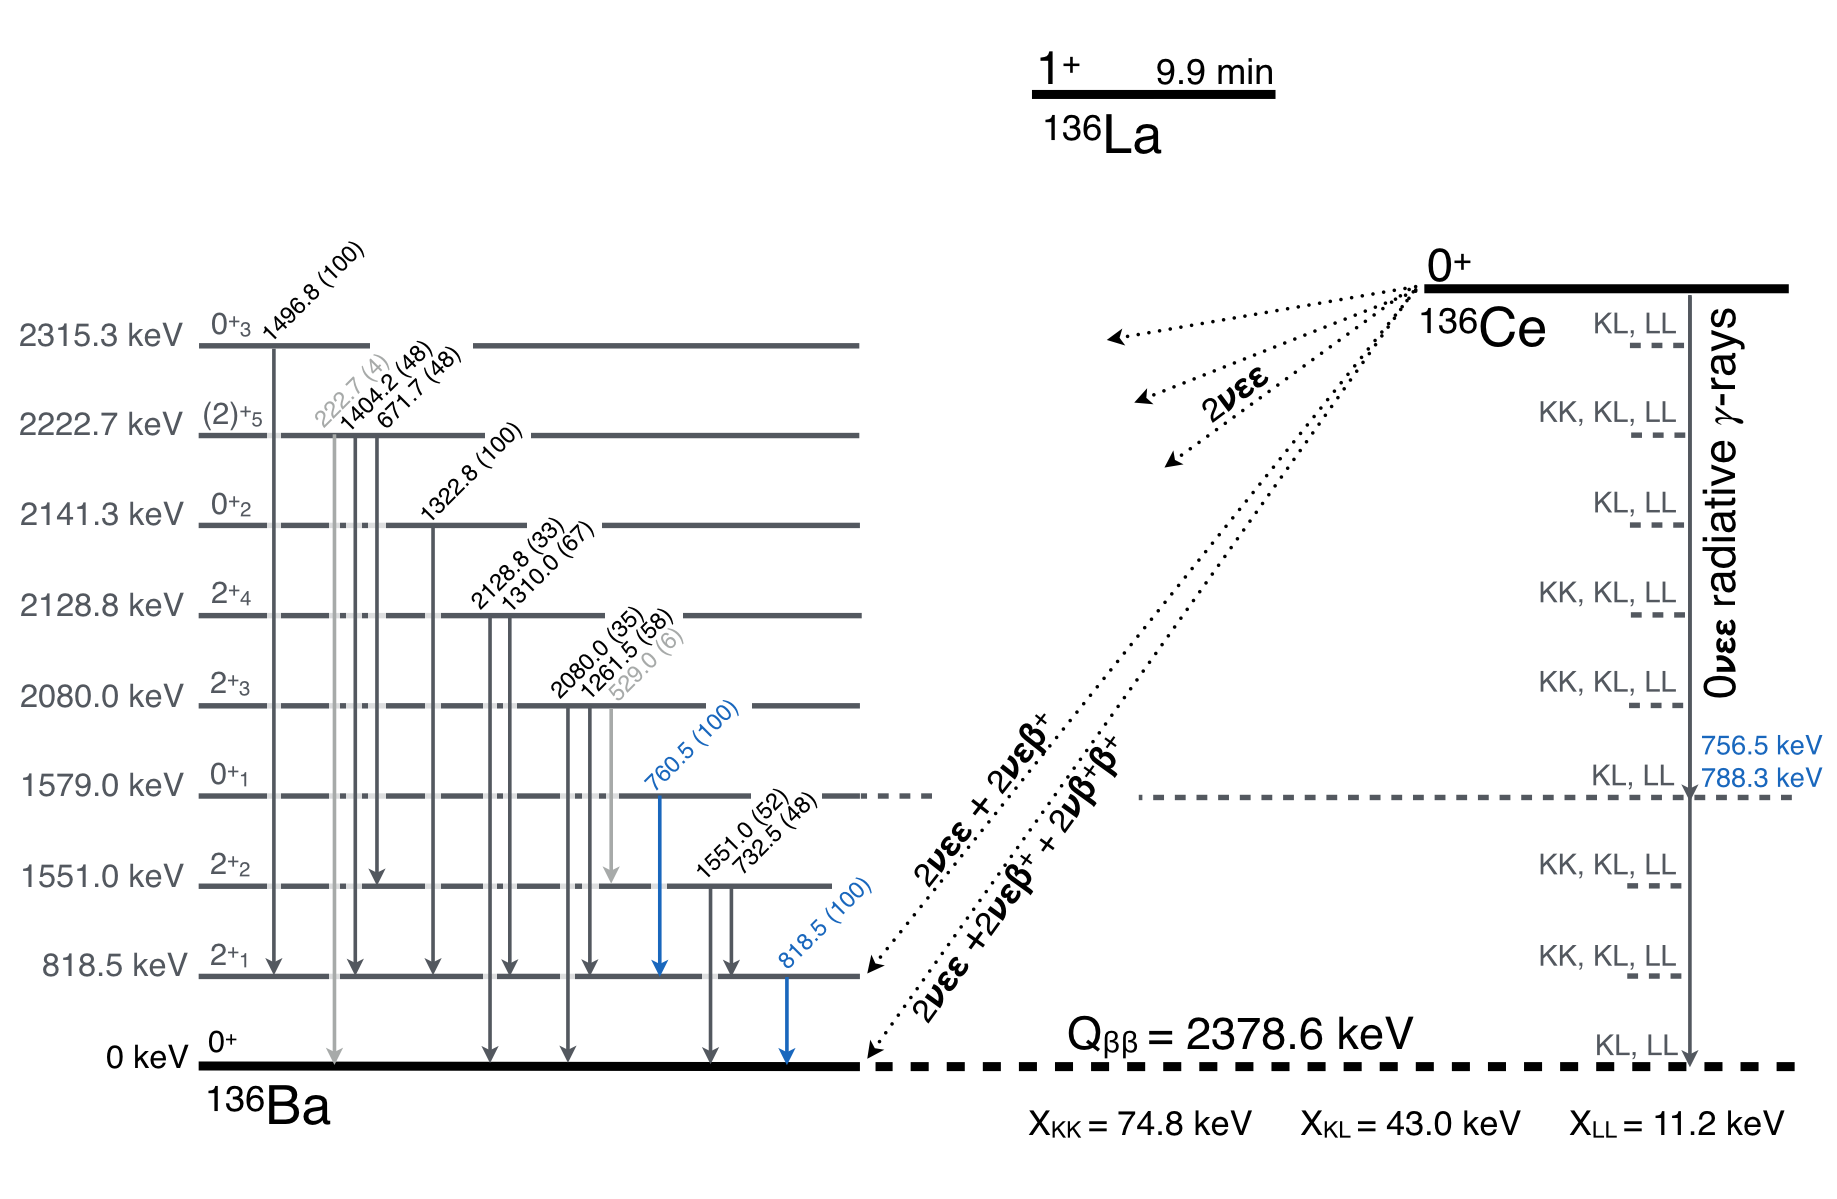
has a natural abundance of 0.185% and is a candidate for , , and decay with keV QValueCe136 . Double beta decays of this isotope are the main focus of this work and the large number of possible decay modes are illustrated in Fig. 1. The mode can only populate the ground state of since each reduces the Q-value twice by 511 keV. Consequently, the mode can populate the ground state and first excited state at 818.5 keV. The decay mode can populate a total of 8 excited states in as shown in Fig. 1. The most likely mode among the excited state transitions investigated here is the first excited state at 1579.0 keV. The modes are possible into the ground and excited states with additional emission of a radiative bremsstrahlung photon to release the excess energy as shown in Eq. 7. This is illustrated in Fig. 1 on the right. For each final state, the bremsstrahlung energy depends on the shell combination from which the two electrons are captured. For the final states, KK, KL, and LL combinations are considered, each differing in the energy but with an otherwise identical -ray de-excitation cascade. For the states only the KL and LL shell captures are considered. Figure 1 shows the example of bremsstrahlung energies for the state transitions in blue.
In a potential resonant double-electron capture to the excited levels in with energies of 2392.1 keV and 2399.9 keV could reduce the half-life by several orders of magnitude to the order of a (e.g. bern83 ). However, a later measurement determined the reaction Q-value of this process to Q = (2378.53 0.27) keV QValueCe136 ruling out such a resonance enhancement in the - system.
Table 1 summarizes the fundamentally different decay modes for each cerium isotope of interest.
Each of these modes has a number of possible “sub-modes” either going to different excited states or starting from captures on different electronic shell combinations (see Fig. 1). The number of sub-modes investigated in this work are listed in the second column.
In this manuscript, the transition into the with the 818.5 keV and 760.5 keV -ray is used to exemplarily illustrate the analysis for all other decay modes.
A clear signature of the 511 keV annihilation peak in combination with the 510.8 keV -line from is present in the background data (as shown later in Fig. 2). Hence, the search for decay modes including a cannot reliably use this signature and we only constrain the mode into the state with the de-excitation -line at 818.5 keV. Due to the possible coincidences of the de-excitation -ray with the annihilation -rays, this mode has a slightly reduced detection efficiency compared to the pure de-excitation -ray search of the into the same final state. Also note that the signature for the and modes are identical since the can carry the remaining decay energy and no radiative bremsstrahlung emission is expected for the case with a emission.
The right column in Tab. 1 lists corresponding theoretical half-life estimates when available. The theoretical half-lives are given for the ground state (g.s.) and first excited , as well as first and second state transitions when applicable. For completeness, Tab. 1 also lists theoretical results for , which are however not investigated in this work.
| decay mode | sub modes | theoretical T1/2 |
| all (investigated) | [a] | |
| 136Ce | ||
| 9 (8) | g.s: [IBM-2], hir94 , rum98 , | |
| suh93 , civ98 , aba84 , | ||
| pir15 | ||
| : pir15 | ||
| : [IBM-2], pir15 | ||
| : pir15 | ||
| 2 (1) | g.s: [IBM-2], hir94 , rum98 , | |
| aba84 , pir15 | ||
| : pir15 | ||
| 1 (0) | g.s: [IBM-2], hir94 , aba84 , | |
| pir15 | ||
| 23 (23) | - | |
| 2 (1) | g.s: [IBM-2], suh03 , suh98 | |
| 1 (0) | g.s: [IBM-2], suh03 , suh98 | |
| 138Ce | ||
| 2 (0) | g.s: [IBM-2], aba84 | |
| 2 (2) | - | |
| 142Ce | ||
| 1 (0) | g.s: [IBM-2], sta90 , bob04 , | |
| del17 | ||
| 1 (0) | g.s: [IBM-2], sta90 |
For this work, the half-lives labeled IBM-2 (microscopic Interacting Boson Model) in Tab. 1 were obtained by dedicated calculations of nuclear matrix elements as described in Ref. CeNME and phase space factors (PSF) as described in Ref. Kot12 and CePSF . In the calculation of PSFs, the same binding energies for K and L shells were used as in the following analysis, i.e, EK = 37.4 keV and the mean value, 5.6 keV for EL.
In these IBM-2 calculations a bare value of was used and the values shown give thus a lower estimate for the half-lives. The quenching of is intensely discussed in literature and values from 1.2694 (the free nucleon value) to values much less than 1 have been suggested (for a review see Ref. suh17 ). For example in Ref. pir15 quenched values from have been used leading to the longest half-life predictions for the mode in question kos21 .
Decays into the ground states are estimated to have half-lives in the range of a and a for decay modes and , respectively.
The predictions of transition to the first excited state vary in the range of a. This large range is
partly due to the fact that the lower estimate is calculated using the bare value and the higher estimate is using quenched values.
For the estimates are a assuming eV.
All other listed theoretical calculations for and modes, as well as, for the transitions to states suggest half-lives longer than a.
Previous investigations of double beta decays in and have been performed in Refs. bel09 ; ber97 ; bel11 ; dan01 ; bel14 and were recently updated in Ref. bel17 . The main differences in this work is the use of a CeBr3 crystal compared to a cerium oxide powder sample used in Ref. bel17 , as well as the use of a fully Bayesian statistical analysis using all signature -rays in combined fits. A list of previous limits is compiled further below together with results from this work.
III Experimental setup and data taking
| Al-bag#1 | Al-bag#2 | |||
|---|---|---|---|---|
| radionuclide | massic activity | activity per bag | activity | activity per bag |
| [Bq/kg] | [mBq] | [Bq/kg] | [mBq] | |
The measurements of the CeBr3 crystal were carried out in the 225 m (500 m water equivalent) deep underground research facility HADES in Belgium hades ; hades2 . The muon flux is reduced by about a factor 5000 compared to above ground. An HPGe-detector named “Ge-4” was used for all measurements of the CeBr3 crystal. It is a coaxial detector with submicron top deadlayer (Canberra, XtRa-type) and has a relative efficiency of 106% geDet . The detector has a good long-term stability which is checked by measuring a quality control source with , and at regular intervals. The shift in peak centroid for the 661.7 keV -line was less than 0.12 keV during the measurement campaigns. The full width at half maximum of the detector is at present 1.86 keV at 661.7 keV and 2.22 keV at 1332.5 keV. An EGSnrc egs-nrc computer model of detector Ge-4 was established when it was installed in 2000. It has since then been refined and validated in several proficiency tests and generally produces results on an absolute scale with an accuracy of around 3%. This computer model was used in combination with the Decay0 event generator decay0 for all calculations of all full energy peak efficiencies in this study. The detector was connected to a digital signal analyzer (Mirion’s LYNX) for high voltage and data acquisition. Spectra are collected on average every two days.
A CeBr3 crystal produced in March 2018 by the company Schott in Jena, Germany, was procured from the company Scionix, Netherlands scionix . Its height and diameter are 102.55 mm and the mass is () g, which corresponds to cerium atoms. Due to the hygroscopic nature of CeBr3, the crystal was delivered to JRC-Geel in three layers of protective wrapping.
The innermost protection is 0.24 mm of Teflon, enveloped by a plastic bag, and followed by an aluminized plastic bag on the outside. The aluminized bag, hereafter referred to as Al-bag, is filled with nitrogen gas. The CeBr3 crystal was measured as it was delivered with these three layers of protection. After the first measurement campaign, the Al-bag used there (Al-bag#1) was changed by Scionix and replaced by another Al-bag (Al-bag#2).
The Al-bag#1 and several Al-bags from the same batch as Al-bag#2 were measured using -ray spectrometry on a low-background detector in HADES and the detected radio-impurities are reported in Tab. 2.
A similar Al-bag was used in a previous study of a smaller CeBr3 crystal lutter13 .
For practical reasons, the measurements of the CeBr3 crystal were carried out in five campaigns starting May 5th 2018 and ending February 23rd 2021.
Background and quality control sources were measured before and after each campaign.
In total, data from 497.4 days passed the quality controls.
In the first campaign of 96.8 d the crystal was placed 25 mm above the endcap of the detector. In the later campaigns the distance was reduced to 4 mm in order to increase the -ray detection efficiencies. For the analysis the data is split in two datasets (M1 and M2) as indicated in Tab. 3 showing the resolution and detection efficiencies for both datasets.
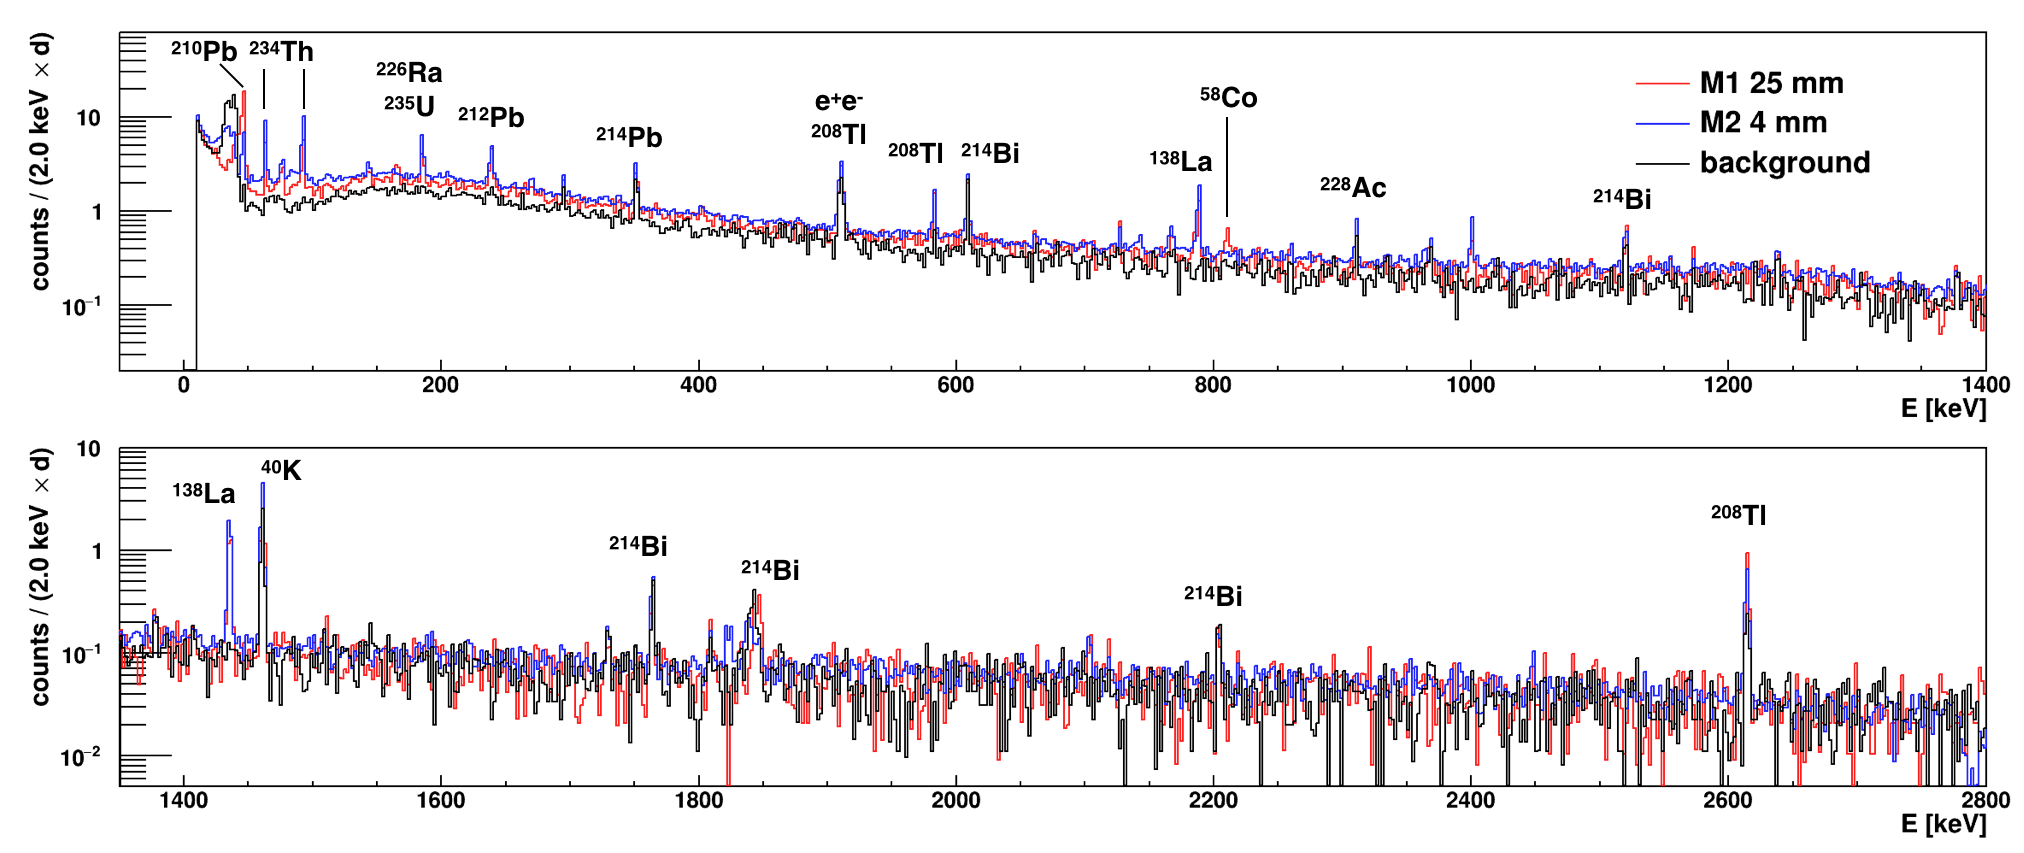
The full spectrum for measurements M1, M2 as well as a 104 d background measurement without sample is shown in Fig. 2. Prominent background -lines are labeled. Some of the -lines are only observed in the sample measurements, notably the -lines at 788.7 keV and 1435.8 keV. The contribution of natural decay chain background is higher in the sample measurements. This is especially visible for the low energy -lines of and which are better shielded by the detector setup than high energy -lines and are thus not as prominent in the background spectrum.
| meas. | time | distance | det. efficiency | resolution |
|---|---|---|---|---|
| M1 | 96.8 d | 25 mm | % | keV |
| M2 | 400.6 d | 4 mm | % | keV |
The radioactive impurities in the CeBr3 crystal itself were quantified by subtracting the activity in the Al-bag (Tab. 2) using Monte Carlo simulations. They are presented in Tab. 4. The most noteworthy difference between the present crystal and the crystal used in the previous measurement is the absence of , whose contribution was relatively high in the previous one. Also, the massic activity of is reduced by almost a factor of 4, likely indicating a change in the production process. A peak at 810.8 keV could be observed in the data from the first measurement campaign M1 (May 2018). The peak can be explained by the activation of copper from the shield, which is located just next to the endcap of Ge4. This copper piece had been brought above ground, end of January 2018, for a few days to be slightly modified. Refs. Co58Argument1 ; Co58Argument2 shows that production of by cosmic activation is quite fast. In addition, the measured half-life () d is compatible with the half-life (70.9 d). We also note two unidentified peaks around 1821 keV and 1825 keV in a subset of data from the M2 campaign with 4 mm detector-to-sample distance. In background data, data from the M1 campaign, and other subsets of the M2 campaign, these peaks are not observed. An extensive search of nuclear databases and the spurious nature of the signal leads us to assume that the origin of the peaks is likely not in the CeBr3 crystal. In either case, these peaks do not interfere with the regions of interest for the double beta decay search in this work.
| 4” crystal 4381 g | 1.5” crystal 222 g | |||
|---|---|---|---|---|
| radionuclide | massic activity | activity | massic activity | activity |
| [mBq/kg] | [mBq] | [mBq/kg] | [mBq] | |
IV Data analysis
The analysis is performed independently for each of the 35 considered decay modes using combined fits to the two datasets , M1 and M2. Each de-excitation -line in a given decay mode has its own fit region, typically keV around the -line of interest111Note that in some cases the fit range is adjusted to include or exclude background -lines on the region borders. Another exception is the KL decay mode where the 760.5 keV -line from the de-excitation cascade and the 756.6 keV bremsstrahlung -line are fitted in a single wider region.. The signal count expectation of each -line in each dataset depends on the single half-life parameter of the decay mode as
| (8) |
Here, is the full energy detection efficiency of -ray in dataset , is Avogadro’s constant, is the live-time of the dataset, is the mass of cerium in the CeBr3 crystal (1616.0 g), ist the molar mass of natural cerium (140.1) and is the natural isotopic abundance of (0.186%) and (0.251%), respectively. The data is binned in 0.5 keV steps for both datasets. The fit is performed combining all datasets and -lines for a given decay mode. The Bayesian Analysis Toolkit (BAT) Caldwell:2009kh is used to obtain full posterior probability distributions for all parameters using Markov Chain Monte Carlo and a binned likelihood. Each free parameter in the fit has an associated prior which is either non-informative e.g. for the half-life, or informed by systematic uncertainties e.g. in case of the energy resolution. The likelihood is defined as the product of the Poisson probabilities of each bin in the fit region for -line in every dataset
| (9) |
where n denotes the data and p the set of floating parameters. is the measured number of counts in bin . is the expected number of counts taken as the integral of the model in this bin. The model is composed of three components: (1) A linear background, (2) the Gaussian signal peak, and (3) a number of Gaussian background peaks. The number and type of background peaks and consequently also the number of fit parameters depend on the fit region. The full expression of is written as:
The first row is describing the linear background with the two parameters and .
The second row is describing the signal peak with the energy resolution and the -line energy .
The third row is describing the background peaks in the fit region of -line with the strength of the peak and the peak position . The same probability density function with different parameter values is used for both datasets. Hence, the same number of background peaks is used in each dataset even if not all background peaks are prominent in both datasets.
The free parameters in the fit and their associated priors are:
-
•
1 inverse half-life with flat prior
-
•
2 x x linear background parameters and with flat priors
-
•
x energy resolutions with Gaussian priors
-
•
x detection efficiencies with Gaussian priors
-
•
x x background peak strength with flat priors
Depending on the decay mode, the contributing -lines (see Fig. 1) and the background peaks in the vicinity, this amounts to 10 fit parameters in the easiest case for the g.s. KL and LL transitions and to 79 fit parameters in the most complex case for the KK, KL, and LL transitions. Note that the large number of parameters is necessary to fully describe the two datasets and multiple regions of interests within each dataset.
The energy resolution for each -line of interest, , is obtained from calibrations and are included in the analysis with a Gaussian prior. The mean is centered around the best fit value and the width is set to an estimated systematic uncertainty of 5%.
The detection efficiencies are determined with MC simulations for each dataset and decay mode and are also included with a Gaussian prior. The uncertainty is estimated at 10%, which includes comparably negligible uncertainties from the sample mass (1%) and the isotopic abundance (1%).
Additional uncertainties for the peak positions of the signal are typically small and neglected here. A special case is the radiative -rays from in with keV that is discussed below.
The full posterior probability obtained by BAT is used for parameter estimation. The global mode of the posterior space is the best fit. The posterior space is marginalized for and the 90% quantile of this distribution is used for limit setting. The values quoted are 90% credibility intervals (C.I.) on the half-life222Note that in most cases Frequentist confidence levels (C.L.) and Bayesian credibility intervals (C.I.) are numerically similar. A distinction is made due to different definitions of probability in the two concepts. In practice, numerical differences can occur in special cases when reducing multi-dimensional parameter spaces into one dimension for the parameter of interest e.g. . This is often done by profiling in the Frequentist case and marginalization in the Bayesian case..
Systematic uncertainties are naturally included via the width of Gaussian priors but typically have a small effect in the case of limit setting, where the fit is dominated by statistical uncertainties.
Fixing the free parameters with Gaussian priors to their mean value results in about 1% better half-life limits.
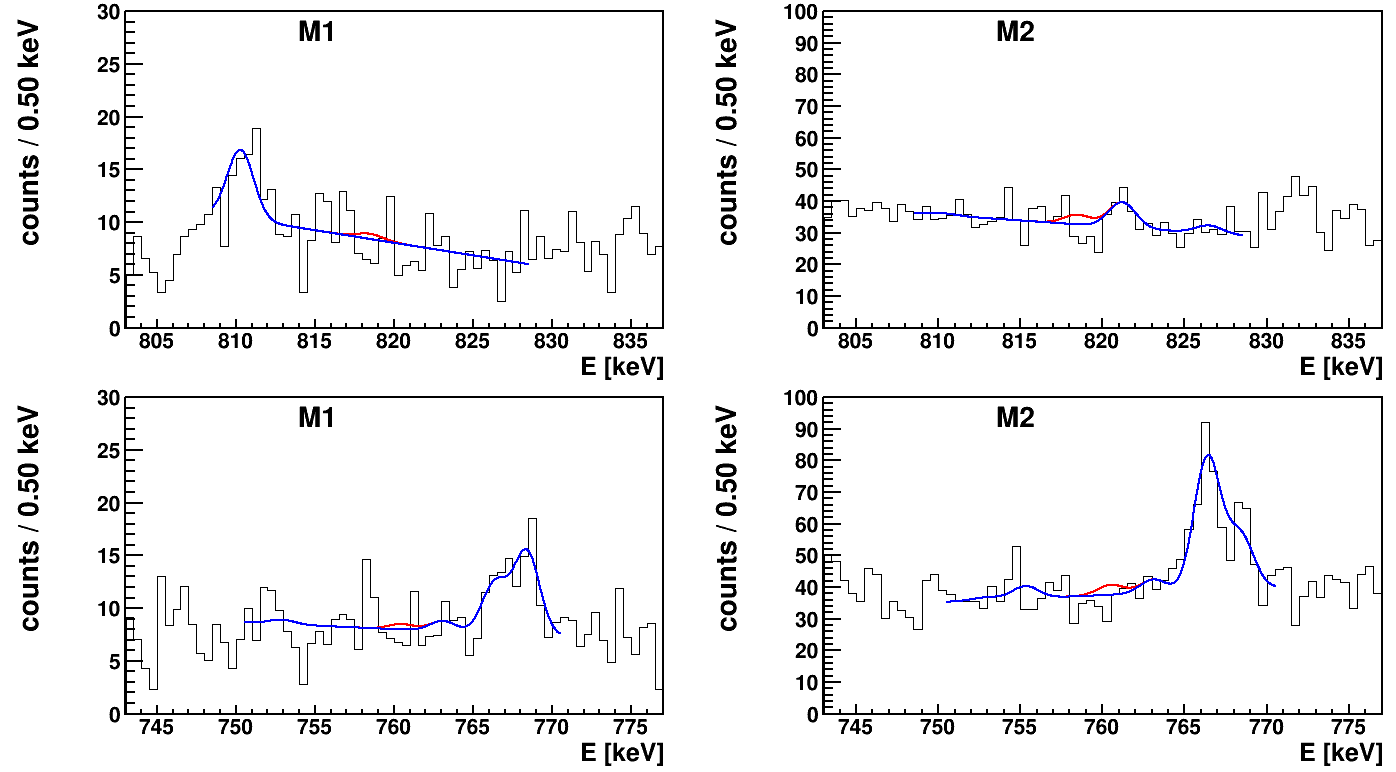
Fig. 3 exemplarily shows the combined fit for the transition into the state for the region of interest of the 818.5 keV and 760.5 keV -lines, for both datasets, respectively.
This fit contains 43 free parameters.
The best fit function is shown in blue and the signal strength, set to the 90% credibility limit, is shown in red.
The 818.5 keV fit region includes the
810.8 keV -line from at 99.5% emission probability as well as
821.2 keV (0.16%, ), and
826.5 keV (0.12%, ) background -lines in the fit.
The 760.5 keV region includes the
752.9 keV (0.13%, ),
755.3 keV (1.0%, ),
763.1 keV (0.64%, ),
766.4 keV (0.32%, ), and
768.4 keV (4.9%, ) background -lines in the fit.
Some decay modes are discussed in more detail in the following. For radiative -rays the available energy decreases with increasing excitation level. -rays below 150 keV are not used in this analysis due to small detection efficiencies. Thus, these -lines are removed from searches for the highest excited states of the and transitions.
The radiative -ray for the mode at 238.6 keV has the background -line of (43.6%) overlapping at the same energy and is thus ignored.
Equally, the 287.4 keV -line for the mode is ignored due to a background -line at 288.2 keV from (0.34%)
and the 752.8 keV -line in the mode due to the 752.9 keV -line from (0.13%)
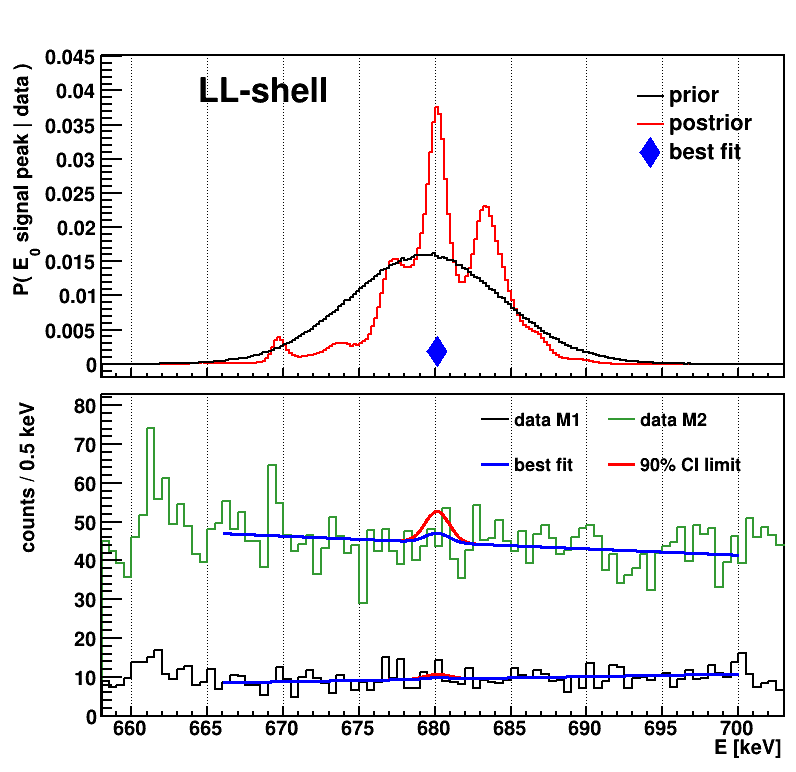
For the modes in the analysis becomes more complex since the Q-value and thus the signal peak energy are only known within keV.
This is significantly larger than the energy resolution of the detector system and special care is taken to include the look elsewhere effect and correctly estimate the half-life probability within a large energy window.
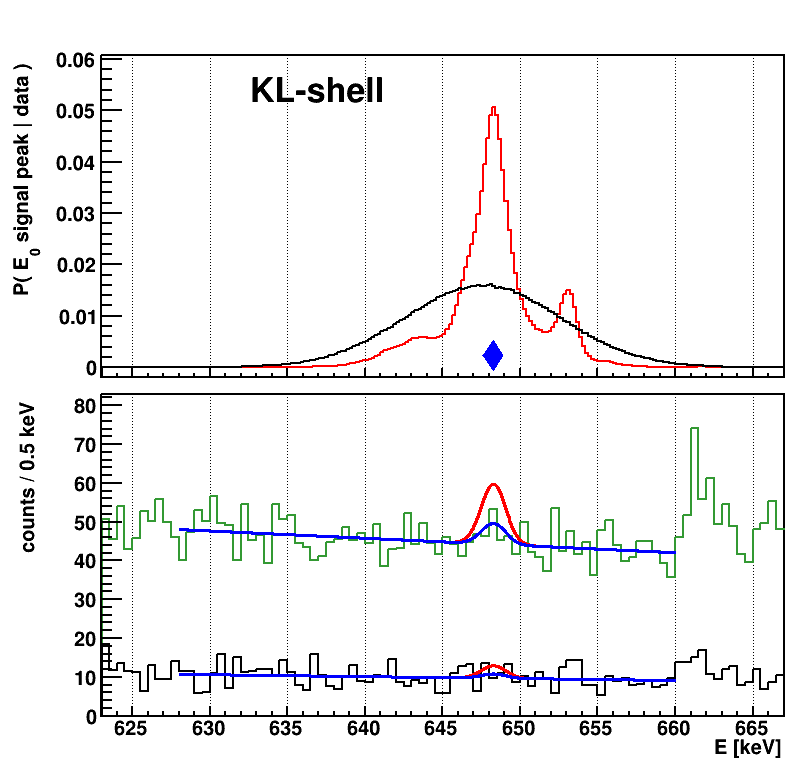
In the Bayesian framework the prior probability for the signal peak position (see Eq. IV) is thus included as (647.6 5) keV and (679.4 5) keV for the KL and LL mode which is shown in Fig. 4 in the left and right top panels, respectively. The input prior probability for is shown in black.
The resulting posterior probability is shown in red and shows significant structures. Any background upward fluctuation in the spectrum (shown in the bottom panels) will result in a larger or smaller probability for the signal peak at the position of the fluctuation.
The global best fit value for is shown as a blue diamond marker and also in the blue best-fit functions in the bottom panels. It appears as if a non-zero signal has been found at the indicated locations of the marker.
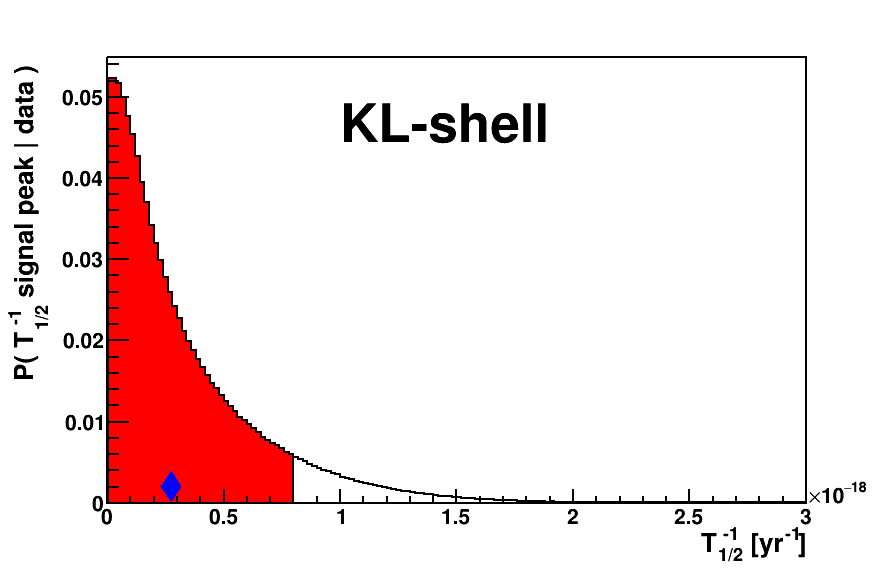
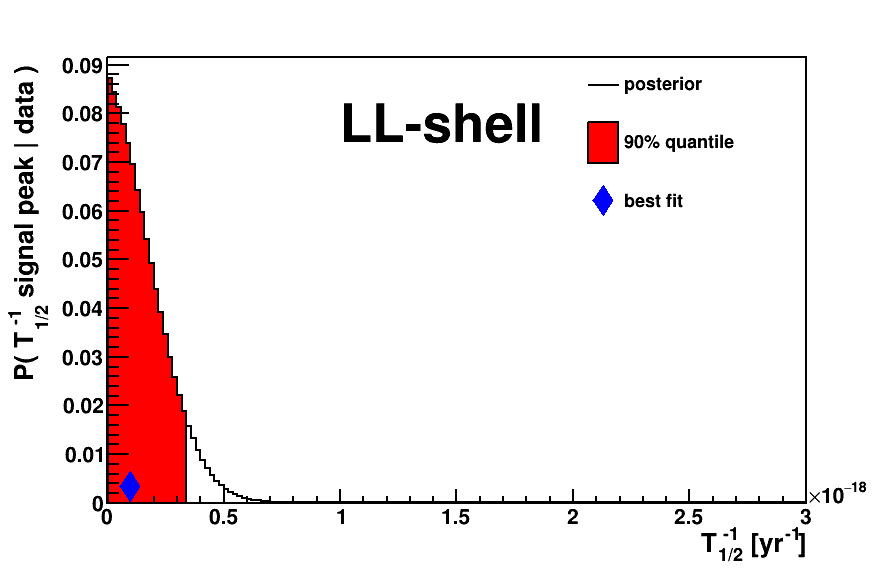
However, considering the full probability for a signal anywhere in the fit region, the most probable signal value is zero. This is shown in Fig. 5. The histograms show the marginalized posterior for with the 90% quantile highlighted in red and the global best fit value of marked as blue diamond. In other words, if one were to search for any peak in the wide search window, one would find one at the marked location with rather large significance as indicated by the best fit in Fig. 5. However, when including the look elsewhere effect and marginalizing over all possible peak positions, the evidence for a signal peak does not exist.
V Results
All fits are consistent with zero signal count and hence no double beta decay signal has been found. For 27 of the 35 considered decay modes, the posterior distributions peaks at zero. For the other eight channels a positive value is found; however zero is included within 1.1 sigma even for the most extreme case. For consistency, the 90% quantile of the distribution is used for limit setting in all cases. The lower limits set in this work are shown in Tab. 6 together with previous results. The obtained half-life limits are at a similar order of magnitude as previous results in bel17 , but improve the global constraints for most decay modes.
The most likely decay, of to the (1579.0 keV) state in , could be constrained to a (90% C.I.).
| decay mode | final state | previous result bel17 | this work |
| [keV] | 90% C.L. [a] | 90% C.I. [a] | |
| (818.5) | |||
| (1551.0) | |||
| (1579.0) | |||
| (2080.0) | |||
| (2128.8) | |||
| (2141.3) | |||
| (2222.7) | |||
| (2315.3) | |||
| (g.s.) | |||
| (g.s.) | |||
| (818.5) | |||
| (818.5) | |||
| (818.5) | |||
| (1551.0) | |||
| (1551.0) | |||
| (1551.0) | |||
| (1579.0) | |||
| (1579.0) | |||
| (2080.0) | |||
| (2080.0) | |||
| (2080.0) | |||
| (2128.8) | |||
| (2128.8) | |||
| (2128.8) | |||
| (2141.3) | |||
| (2141.3) | |||
| (2222.7) | |||
| (2222.7) | |||
| (2222.7) | |||
| (2315.3) | |||
| (2315.3) | |||
| (818.5) | |||
| (818.5) | |||
| (g.s.) | |||
| (g.s.) |
This analysis considers many decay modes - some with a complex decay scheme and many de-excitation -rays.
The order of magnitude of the half-life limits is mainly determined by the exposure and background of the experiment.
Smaller variations are due to different detection efficiencies of -rays in the different decay modes.
The use of information from all prominent -lines for a given decay mode in a combined fit largely mitigates strong differences as would be seen when e.g. only a single -line is used for limit setting.
Another source of variations are statistical fluctuations of the background. Also here, the use of a combined fit to multiple -lines reduces the probability of strong background fluctuation compared to using a single -line fit.
It is also worth noting that the approach of combined fits reduces the selection bias. This would occur, if one selects the limit from the -line which happens to result in the highest limit.
Especially for decay modes with multiple -rays at similar detection efficiency, this would systematically select favorable background fluctuations.
Each decay mode is analyzed independently. However, the value of the limits is not independent, since many decay modes share the same -line. This is especially true for the 818.5 keV -line from the state which is the final -ray in the de-excitation cascade.
VI Discussion and Conclusion
A 4381 g CeBr3 crystal was measured with -ray spectrometry over the last three years at the HADES underground lab.
An extensive search for double electron capture transitions in cerium isotopes has been performed on 479.4 days of data. No signals have been observed and 90% credibility limits have been set using a Bayesian analysis for all accessible decay modes in and .
Previously existing limits could be improved by up to a factor of two. Special care has been taken to avoid selection biases and look elsewhere effects using all available spectral information in the analysis as well as implementing knowledge of systematic uncertainties using Bayesian priors.
The measurement was performed in a state-of-the-art low-background -ray spectrometry setup for an extended time.
Further reducing the radioactive background or increasing the measurement time / exposure is limited in feasibility and practicality.
Instead, a much stronger improvement on the half-life sensitivity may be achieved by instrumenting the CeBr3 crystal as a scintillation detector - its intended purpose.
This allows analysis-driven background rejection by coincidence or anti-coincidence requirements between the CeBr3 and the HPGe detectors.
In addition, turning the crystal into a detector would enable searches in the sourcedetector configuration with a two order of magnitude increase in detection efficiency close to 100%. Furthermore, additional decay modes become accessible, e.g. those which only emit X-rays, which do not easily escape the crystal, or modes with continuous double beta spectrum.
With enough resources, isotopic enrichment of the low mass side of cerium isotopes can increase the half-life sensitivity by multiple orders of magnitude. Natural abundances of and are only 0.25% and 0.19%, respectively, with strong potential for enrichment.
The newly achieved experimental constraints on the half-lives of the order of a are still considerably far away from theoretical predictions.
The shortest half-lives are expected for the ground state transitions which were not accessible in this search. However, they are predicted as low as a for and come into reach with an instrumented CeBr3 crystal.
decay modes to the ground state have slightly longer half-life predictions but an enhanced experimental signature with two annihilation photons. This signature could not be exploited in this setup but becomes a powerful discriminator using CeBr3-HPGe coincidences.
The shortest decay with -ray emission is the mode, predicted at a. Reaching this sensitivity requires significant improvement and investment. However, the only two observed double beta decay excited state transitions in and were measured at a significant lower half-life than predicted ESReview . Surprises are possible for the complicated nuclear physics of double beta decay and future experimental searches are well motivated.
VII Acknowledgements
This work received support from the EC-JRC open access scheme EUFRAT under Horizon-2020, project number 35375-1. EIG EURIDICE and the staff of HADES are gratefully acknowledged for their work. One of the authors (A. O.) acknowledges the support from the Extreme Light Infrastructure Nuclear Physics (ELI-NP) Phase II, a project co-financed by the Romanian Government and the European Union through the European Regional Development Fund, the Competitiveness Operational Programme (1/07.07.2016, COP, ID 1334). Another authors (J. K.) acknowledges the support from the Academy of Finland, Grant Nos. 314733 and 320062.
References
- (1) F. F. Deppisch, L. Graf, J. Harz, and W.-C. Huang, Phys. Rev. D 98, 055029 (2018).
- (2) V. I. Tretyak, Yu. G. Zdesenko, At. Data Nucl. Data Tables 61, 83 (2002).
- (3) R. Saakyan, Annu. Rev. Nucl. Part. Sci., 63:503 (2013).
- (4) V. I. Tretyak, Yu. G. Zdesenko, At. Data Nucl. Data Tables 61, 43 (1995).
- (5) Ju. M. Gavriljuk, et al., Phys. At. Nucl. 69, 2124 (2006).
- (6) P. Belli et al., Nucl. Phys. A 824, 101 (2009).
- (7) N. J. Rukhadze et al., J. Phys. Conf. Se. 203, 012072 (2010).
- (8) A. P. Meshik, C. M. Hohenberg, O. V. Pravdivtseva, and Ya. S. Kapusta, Phys. Rev. C 64, 035205 (2001).
- (9) E. Aprile et al., Nature 568, 532 (2019).
- (10) A.S. Barabash, Phys. Rev. C 81, 035501 (2010).
- (11) A. Gando et al. (KamLAND-Zen Collaboration) Phys. Rev. Lett. 117, 082503 (2016).
- (12) M. Agostini et al. (GERDA Collaboration) Phys. Rev. Lett. 125, 252502 (2020).
- (13) P. Belli et al., Nucl. Instr. Meth. A 498, 352 (2003).
- (14) R. Bernabei et al., Nuovo Cimento A 110, 189 (1997).
- (15) P. Belli et al., J. Phys. G: Nucl. Part. 38, 015103 (2011).
- (16) G. Lutter et al., Nucl. Instr. Meth. A 703, 158 (2013).
- (17) R. Billnert et al., Nucl. Instr. Meth. A 647, 94 (2011).
- (18) M. Wang et al., Chinese Physics C 41 3, 030003 (2017).
- (19) M. Doi and T. Kotani, Prog. of Theo. Phys., 89, 1 (1993).
- (20) V.S. Kolhinen et al., Phys. Lett. B 697, 116 (2011).
- (21) J. Bernabeu, A. De Rujula, C. Jarlskog, Nucl. Phys. B 223, 15 (1983).
- (22) J. Barea, J. Kotila, and F. Iachello, Phys. Rev. C 91, 034304 (2015).
- (23) J. Kotila and F. Iachello, Phys. Rev. C 85, 034316 (2012).
- (24) J. Kotila and F. Iachello, Phys. Rev. C 87, 024313 (2013).
- (25) J. Suhonen, Front. Phys. 5, 55 (2017).
- (26) J. Kostensalo et al., Phys. Lett. B 882, 136652 (2021).
- (27) M. Hirsch et al., Z. Phys. A 347, 151 (1994).
- (28) O. A. Rumyantsev and M. H. Urin, Phys. Lett. B 443, 51 (1998).
- (29) J. Suhonen, Phys. Rev. C 48, 574 (1993).
- (30) O. Civitarese and J. Suhonen, Phys. Rev. C 58, 1535 (1998).
- (31) J. Abad et al., J. Physique 45, C3-C147 (1984).
- (32) P. Pirinen, J. Suhonen, Phys. Rev. C 91 054309 (2015).
- (33) D.S. Delion, J. Suhonen, Phys. Rev. C 95 034330 (2017).
- (34) A. Staudt, K.Muto and H. V. Klapdor-Kleingrothaus, Europhys. Lett. 13, 31 (1990).
- (35) A. Bobyk et al., Eur. Phys. J. A 19, 327 (2004).
- (36) J. Suhonen and M. Aunola, Nuclear Physics A 723, 271 (2003).
- (37) J. Suhonen, O. Civitarese, Phys. Rep. 300 123 (1998).
- (38) F. A. Danevich et al., Nucl. Phys. A 694, 375 (2001).
- (39) P. Belli et al., Nucl. Phys. A 930, 195 (2014).
- (40) P. Belli et al., Eur. Phys. J. A 53, 172 (2017).
- (41) EURIDICE, http://www.euridice.be .
- (42) M. Hult, G. Marissens, H. Stroh, ISBN 978-92-76-18589-5. Publication Office of the European Union. https://publications.jrc.ec.europa.eu/repository/handle/JRC120311 (2020).
- (43) M. Hult, J. Gasparro, L. Johansson, P.N. Johnston, R. Vasselli, Env. Radiochem. Anal. II, 373-382 (2003).
- (44) I. Kawrakow, D. W. O. Rogers, E. Mainegra-Hing, F. Tessier, R. W. Townson, B. R. B. Walters, doi:10.4224/40001303 (2000).
- (45) O. A. Ponkratenko, V. I. Tretyak, Yu. G. Zdesenko, Phys. At. Nucl. 63, 1282 (2000).
- (46) SCIONIX Holland bv, P.O.Box143, 3980 CC Bunnik, The Netherlands.
- (47) S. Cebrián et al., Astr. Part. Phys. 33, 316 (2010).
- (48) L. Baudis, A. Kish, F. Piastra, M. Schumann, Eur. Phys. J. C 75, 485 (2015).
- (49) A. Caldwell, D. Kollár, K. Kröninger, Comp. Phys. Commun. 180, 2197 (2009).
- (50) B. Lehnert, EPJ Web of Conf., 93, 01025 (2015).