Another look at the Landau gauge three-gluon vertex
Abstract
We revisit the computation of the three-gluon vertex in the Landau gauge using lattice QCD simulations with large physical volumes of (6.5 fm)4 and (8 fm)4 and large statistical ensembles. For the kinematical configuration analysed, that is described by a unique form factor, an evaluation of the lattice artefacts is also performed. Particular attention is given to the low energy behaviour of vertex and its connection with evidence (or lack of it) of infrared ghost dominance.
1 Introduction
The amputated three-gluon correlation function, herein also named vertex, is a fundamental QCD correlation function that allows for the extraction of a strong coupling constant and the computation of a static potential between color charges. Our aim is to revisit a previous calculation duarte2016 ; proc2016 using an improved statistics for the larger volume and estimate the corresponding lattice artefacts.
Lattice simulations measure the correlation function via the computation of
| (1) |
In terms of the gluon propagator and of the one-particle irreducible three-gluon diagram (1PI) the correlation function is given by
| (2) |
The three-gluon vertex reads
| (3) |
and given that Bose symmetry requires the 1PI function to be symmetric under permutations of any pair it follows that has to be antisymmetric under the interchange of any pair . The description of in the continuum formulation requires six Lorentz invariant form factors. Two of the form factors are associated with the transverse component of the vertex, while the remaining define its longitudinal component ballchiu .
Here we consider the evaluation of the vertex for the asymmetric momentum configuration that is defined by , as in duarte2016 ; proc2016 ; alles . Then, the three point connected Green function is given by
| (4) |
and, therefore,
| (5) |
It follows that the form factor can be measured by computing the ratio
| (6) |
For large momentum, the gluon propagator becomes small and its fluctuations induce large variations for that prevent a precise measurement of this form factor in the UV regime. Indeed, such large fluctuations have been observed in previous simulations; see e.g. duarte2016 and references therein.
2 The lattice setup
In the following we show results from a simulation using a lattice with an ensemble of 2000 configurations already studied in duarte2016 , together with a simulation using a lattice and an ensemble of 1800 configurations. The ensembles were generated with the Wilson gauge action at using Chroma library chroma . The gauge configurations have been rotated to the Landau gauge using the Fourier accelerated Steepest Descent method davies . Fast Fourier transforms were implemented using the PFFT library pfft . Our definition for the gluon field being
| (7) |
with its corresponding field in momentum space being given by
| (8) |
An improved definition for lattice momenta, motivated by lattice perturbation theory, is
| (9) |
3 Handling of noise and lattice artefacts
We use two approaches to handle the problem of the large statistical fluctuations at high momenta already discussed in Catumba:2021hcx ; guitese , namely
-
•
explore the ambiguity on the scale setting that allow us to bin the momentum data — the momentum are grouped in bins and for each bin the lattice data is replaced by its weighted average, using as weight the inverse of the statistical error of the bin data points;
-
•
perform a extrapolation of the lattice data becirevic1999 ; soto2009 — such procedure uses the naive lattice momentum and explores the lattice symmetry group that is associated with an hypercube. Accordingly, any lattice scalar function depends on the invariants
and one writes . The corresponding function in the continuum limit is given by up to corrections . The procedure requires several data points with the same but different , , . can be computed via an extrapolation of if one assumes that can be written as a power series of the H(4) invariants. Herein, we ignore contributions due to and and consider a linear extrapolation in .
4 Results
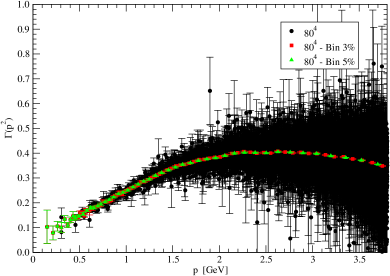
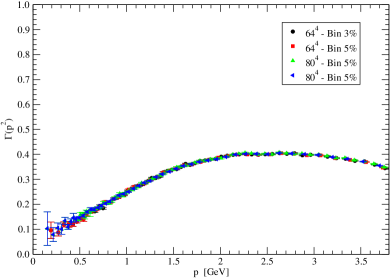
The data for both binned and unbinned is reported in the left plot of Figure 1 for the largest lattice. Clearly, by binning the data the large statistical errors in the high momentum region are suppressed resulting in a well defined and smooth curve. On the right plot of Figure 1, the binned data for the two lattice volumes is compared. The good agreement within errors of both sets of data suggest that the finite volume effects are under control and are small.
The linear H(4) extrapolation of the lattice data, including the binned data, is compared with the original binned data in the left plot of Figure 2. Up to momentum GeV both the H(4) extrapolation and the binned data are in good agreement. However, for large the H(4) extrapolation overestimates in comparison with the binned lattice data. As seen in the right plot of Figure 2, in the low momentum regime the two sets of data agree within errors.
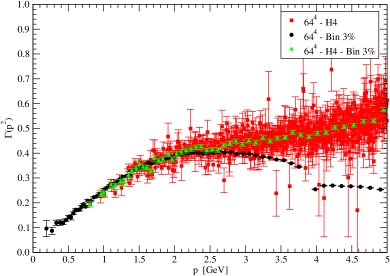
As can be observed in all the Figures the form factor does not seem to change sign in the infrared region. Recall that the change of sign is, in general, understood as an indication of ghost dominance in the infrared.
5 Infrared behaviour of
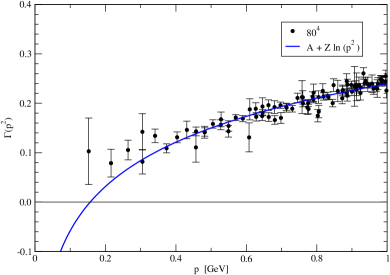
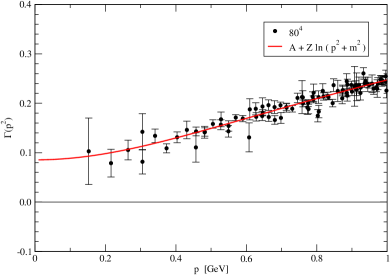
The lack of observing a change of sign in the form factor can be an indication that either it does not happen and there is no ghost dominance in the infrared region or the change of sign occurs at momenta that are smaller than those accessed in the simulations. Here, we explore further the infrared behavior of by fitting the lattice data to various functional forms. In the following, only the lattice data for momenta below 1GeV will be considered.
The best fits of the lattice data to and are reported in Figure 3. was used in recent studies of the infrared three-gluon vertex, see guitese for details, and is a regularized version of that is, in principle, finite over the full range of . The best fit to results in a , and . Hence, the zero crossing should occur at MeV. The best fit for gives , and GeV, with a . No change of sign can be associated with this function; see the right plot of Figure 3.
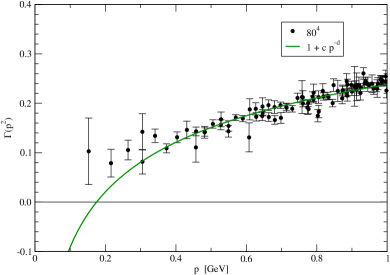
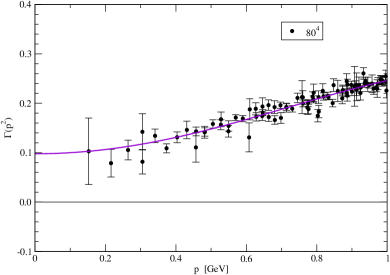
In order to help clarifying the infrared behavior of , we also considered a power law, with the best fit resulting in , with a . Accordingly, the change of sign occurs at MeV; see Figure 4, left plot. Finally we considered the quadratic function whose optimal parameters are , , and , with a . Similarly to , the change of sign of the form factor is also not observed; see Figure 4, right plot.
6 Conclusions and outlook
An improved calculation of the three gluon vertex on the lattice and for the asymmetric momentum configuration is described. Two different lattice volumes of fm and fm, with a common lattice spacing of fm, have been investigated. In general our approach to handle the fluctuations and the lattice spacing effects seems to be able to produce compatible smooth curves over a wide range of momenta that extends up to 2.5 GeV. Our investigation of the deep infrared region using the lattice data and relying on fits to functional forms are inclusive in what concerns a change of sign of .
This work was granted access to the HPC resources of the PDC Center for High Performance Computing at the KTH Royal Institute of Technology, Sweden, made available within the Distributed European Computing Initiative by the PRACE-2IP, receiving funding from the European Communitys Seventh Framework Programme (FP7/2007-2013) under Grant agreement no. RI-283493. The use of Lindgren has been provided under DECI-9 project COIMBRALATT. We acknowledge that the results of this research have been achieved using the PRACE-3IP project (FP7 RI312763) resource Sisu based in Finland at CSC. The use of Sisu has been provided under DECI-12 project COIMBRALATT2. We acknowledge the Laboratory for Advanced Computing at the University of Coimbra lca for providing access to the HPC resource Navigator. This work was produced with the support of INCD incd funded by FundaÃão para a CiÃncia e a Tecnologia, I. P. (FCT) and FEDER under the project 01/SAICT/2016 n 022153. The authors acknowledge Minho Advanced Computing Center macc for providing HPC resources that have contributed to the research results reported within this paper. This work was produced with the support of MACC and it was funded by FCT under the Advanced Computing Project CPCA/A2/6816/2020, platform Bob. Work supported by national funds from FCT, within the Projects UIDB/04564/2020, UIDP/04564/2020, and CERN/FIS-COM/0029/2017. P. J. S. acknowledges financial support from FCT under Contract CEECIND/00488/2017. G. T. R. C. acknowledges financial support from FCT under Project UIDB/04564/2020, and also from the Generalitat Valenciana (genT program CIDEGENT/2019/040) and Ministerio de Ciencia e Innovacion PID2020-113644GB-I00.
References
- (1) A. G. Duarte, O. Oliveira, P. J. Silva, Phys. Rev. D94, 074502 (2016).
- (2) A. G. Duarte, O. Oliveira, P. J. Silva, PoS(LATTICE2016)351.
- (3) J. S. Ball, T.-W. Chiu, Phys. Rev. D22, 2550 (1980).
- (4) B. Allés, D. S. Henty, H. Panagopoulos, C. Parrinello, C. Pittori, D. G. Richards, Nucl. Phys. B502, 325 (1997).
- (5) R. G. Edwards, B. Joo, Nucl. Phys. Proc. Suppl. 140, 832 (2005).
- (6) C. T. H. Davies, G. G. Batrouni, G. R. Katz, A. S. Kronfeld, G. P. Lepage, K. G. Wilson, P. Rossi, B. Svetitsky, Phys. Rev. D37, 1581 (1988).
- (7) M. Pippig, SIAM J. Sci. Comput. 35, C213 (2013).
- (8) G. T. R. Catumba, O. Oliveira, P. J. Silva, Phys. Rev. D103, 074501 (2021).
- (9) Guilherme Telo Rodrigues Catumba, Master Thesis, University of Coimbra, 2020, arXiv:2101.06074 [hep-lat].
- (10) D. Becirevic, Ph. Boucaud, J. P. Leroy, J. Micheli, O. PÃne, J. RodrÃguezâQuintero, C. Roiesnel, Phys. Rev. D60, 094509 (1999).
- (11) F. de Soto and C. Roiesnel, JHEP 09, 007 (2007).
- (12) https://www.uc.pt/lca
- (13) https://www.incd.pt
- (14) https://macc.fccn.pt