Detectability of large correlation length inflationary magnetic field with Cherenkov telescopes
Abstract
Magnetic fields occupying the voids of the large scale structure may be a relic from the Early Universe originating from either Inflation or from cosmological phase transitions. We explore the possibility of identifying the inflationary origin of the void magnetic fields and measuring its parameters with -ray astronomy methods. The large correlation length inflationary field is expected to impose a characteristic asymmetry of extended -ray emission that is correlated between different sources on the sky. We show that a set of nearby blazars for which the extended emission is observable in the 0.1-1 TeV band with CTA can be used for the test of inflationary origin of the void magnetic fields.
I Introduction
Observations of extended and delayed gamma-ray emission around extragalactic sources of TeV -rays provides a possibility of measurement of magnetic field in the voids of the Large Scale Structure (LSS) Plaga (1995); Neronov and Semikoz (2007, 2009). This emission is generated by electron-positron pairs deposited by the pair production by -rays on the Extragalactic Background Light. The combination of data from current generation Cherenkov telescopes, HESS, MAGIC and VERITAS with data from the Fermi-LAT telescope currently constrains the void field strength to be stronger than G Neronov and Vovk (2010); Taylor et al. (2011); Ackermann et al. (2018). The next-generation Cherenkov Telescope Array (CTA) will provide a possibility to explore the magnetic field over a wide range of possible strength and correlation lengths, up to the field strength of the order of G Korochkin et al. (2021); Vovk et al. (2021).
Several physical phenomena that took place a fraction of a second after the Big Bang can be responsible for the generation of a relic magnetic field. First order phase transitions that might have happened at quark confinement or during the Electroweak epoch can produce short correlation length magnetic field that evolves through turbulent decay toward a magnetic field configuration with correlation length and strength satisfying a relation kpc today Banerjee and Jedamzik (2004); Kahniashvili et al. (2013). Alternatively, a field generated at the epoch of inflation can have a very large correlation length, up to the present day Hubble scale Ratra (1992); Garretson et al. (1992); Gasperini et al. (1995); Giovannini and Shaposhnikov (2000); Demozzi et al. (2009); Ferreira et al. (2013); Durrer and Neronov (2013).
Magnetic fields from galactic outflows, if they efficiently pollute the voids (as suggested e.g. by Bertone et al. (2006)), would be distinguishable from both inflationary and phase transition field based on their galaxy scale correlation length (10-100 kpc). This is much larger than that of the phase transition induced field, but not reaching the Hubble scale of the correlation length of the inflationary field. However even though magnetised outflows from galaxies can spread non-cosmological magnetic fields in the intergalactic medium, these outflows are most likely not strong enough to fill the voids Marinacci et al. (2018); Bondarenko et al. (2021). This suggests that the volume-filling magnetic field in the voids is a relic from the Early Universe Durrer and Neronov (2013).
In what follows we explore the possibility of distinguishing between these two possibilities observationally. Large correlation length fields break isotropy by selecting a unique direction in a cosmologically large volume. This selected direction imposes a correlated asymmetry on magnetic field dependent extended emission patterns around -ray sources across the sky. We explore if it is possible to detect this asymmetry and measure the inflationary magnetic field direction. We use a magnetic field generated from a realistic model of the LSS derived from Borg constrained cosmological simulations Jasche and Wandelt (2013) that reproduces the location of known LSS elements (galaxies, clusters) in the local Universe. Our analysis relies on magneto-hydrodynamic (MHD) simulations using the ramses code Teyssier (2002) to estimate the effect of the structure formation on the initial magnetic field configuration. Modelling the properties of secondary -ray signal is performed with the CRbeam code Berezinsky and Kalashev (2016). We use calculations of electromagnetic cascades along lines of sight to known nearby blazars to estimate the influence of large correlation length magnetic field on the properties of secondary -ray signal from the cascade.
II Modelling of the magnetic field
We calculate intergalactic magnetic field (IGMF) out to a distance of 200 Mpc from the Milky Way by running MHD simulations using the Ramses-MHD code (Fromang et al., 2005) on the initial conditions (ICs) from Borg (Jasche and Lavaux, 2019). Using a Markov Chain Monte Carlo approach, the Borg methodology generates ICs that are constrained to reproduce the structure of positions of real galaxies and galaxy clusters of the 2M++ survey (Lavaux and Hudson, 2011) within 200 Mpc cube around Milky Way. A cosmological zoom of one variant of the Borg ICs was produced using Music algorithm (Hahn and Abel, 2011) to generate a high resolution region 200 Mpc around the Milky Way with spatial resolution at of Mpc and mass resolution . This is a factor 4 increase over the original Borg ICs spatial resolution. Note however that the density fluctuations on this scale are unconstrained. The initial configuration of the magnetic field is uniform across the simulation volume with strength up to G. Its direction is chosen to be in the direction of north () of the ICRS coordinate system. The hydrodynamical variables and magnetic field were evolved on the AMR grid using the HLLD solver (Miyoshi and Kusano, 2005) with the MinMod slope limiter being used to reconstruct variables at cell interfaces.
The simulation was run without cooling, star formation or feedback as the focus of this study are cosmological voids where the impact of processes are likely to be small Bondarenko et al. (2020, 2021). As a result of this the magnetic field is a smoothed tracer of the dark matter density field. Only sufficiently massive objects are capable of producing large enhancements of the gas density field. Regions with overdensities greater than approximately 3 were thought to be close enough to structures that generate magnetized outflows that they are at risk of being “polluted” by magnetic fields of non-cosmological origin, as indicated in Marinacci et al. (2018). The magnetic field strength in such regions may deviate from simple scaling imposed by the amplification due to pure adiabatic contraction. As a result we therefore mark as high magnetic field region any area with an overdensity greater than 3 averaged over a thin cylinder with radius 2.7 Mpc (3 cells in the zoom region) along the line of sight during the course of our analysis.
Ramses-MHD was used due to its implementation of a constrained transport scheme (Evans and Hawley, 1988). Potentially spurious amplification of the magnetic field seen in codes that use divergence cleaning schemes (e.g. Stasyszyn and Elstner, 2015; Mocz et al., 2016) are suppressed by this scheme. In any case, this effect is most important in high density regions such as the centres of clusters and should have a minimal effect in this work.
III Nearest TeV blazars
| Name | RA | Dec | , TeV cm-2 s-1 | |
|---|---|---|---|---|
| Mkn 421 | 166.11 | 38.21 | 0.031 | |
| Mkn 501 | 253.47 | 39.76 | 0.033 | |
| QSO B2344+514 | 356.77 | 51.7 | 0.044 | |
| Mkn 180 | 174.11 | 70.16 | 0.046 | |
| 1ES 1959+650 | 299.99 | 65.15 | 0.047 | |
| AP Librae | 229.42 | -24.37 | 0.04903 | |
| TXS 0210+515 | 33.57 | 51.75 | 0.04913 |
There are several known TeV blazars whose position falls within the high resolution simulation volume. The source list is given in Table 1. All the sources are well-established TeV emitters. The proximity of the sources enables measurements of their intrinsic spectra attenuated by the pair production effect up to 10 TeV. This is important because the extended emission in the energy range above 100 GeV is produced by electrons and positrons injected in interactions of -rays with energies above 10 TeV. Measurement of the flux above 10 TeV allows us to obtain reliable estimates of the expected power of the secondary flux in the GeV range.
The lines of sight toward the sources listed in Table 1 are oriented at different angles with respect to the direction of initial homogeneous field chosen in simulation. This provides a possibility to study how variations of the misalignment of the cosmological field direction affects the observational appearance of the extended emission. Lines of sight toward two sources, 1ES 1959+650 and Mkn 180 are more strongly aligned to the direction of the magnetic field than, say, the lines of sight to Mkn 421 and Mkn 501. The line of sight toward AP Librae has the largest misalignment angle in our sample.
In the following sections we show results for the three brightest sources in our sample Mkn 501, Mkn 421 and 1ES 1959+650, see Table 1.
IV Structure of magnetic fields along the lines of sight
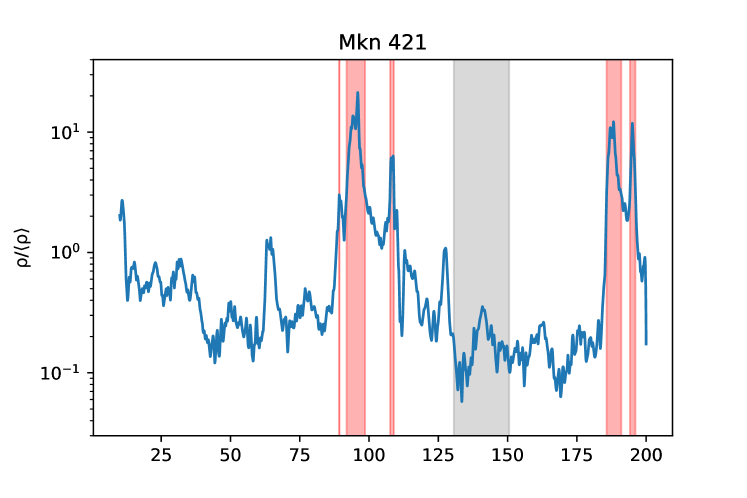
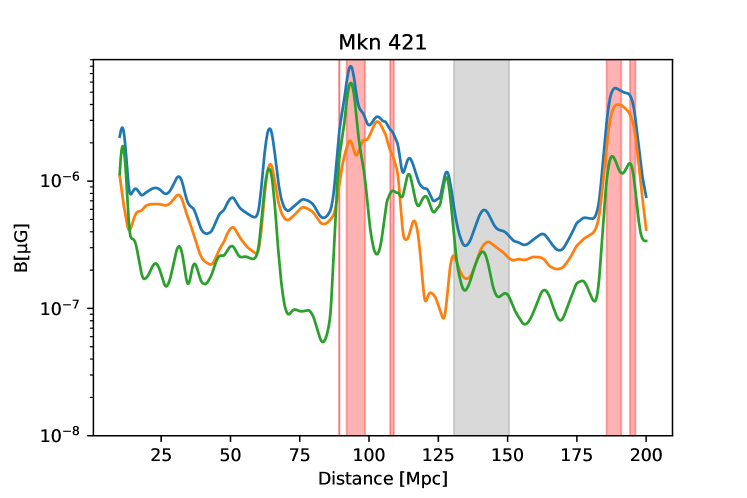
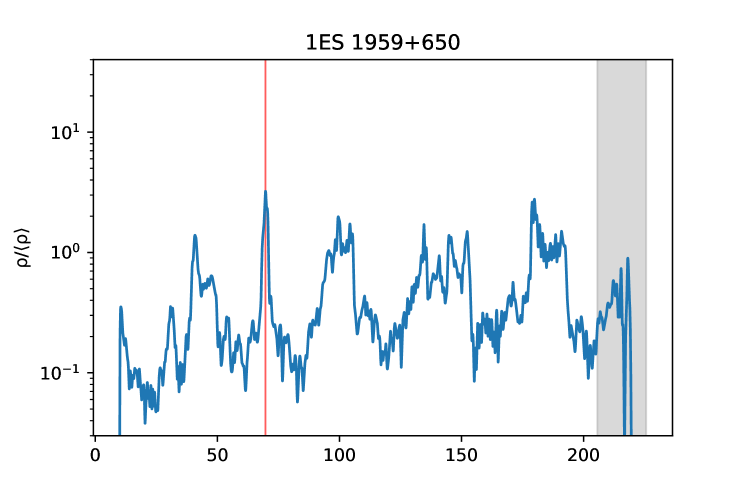
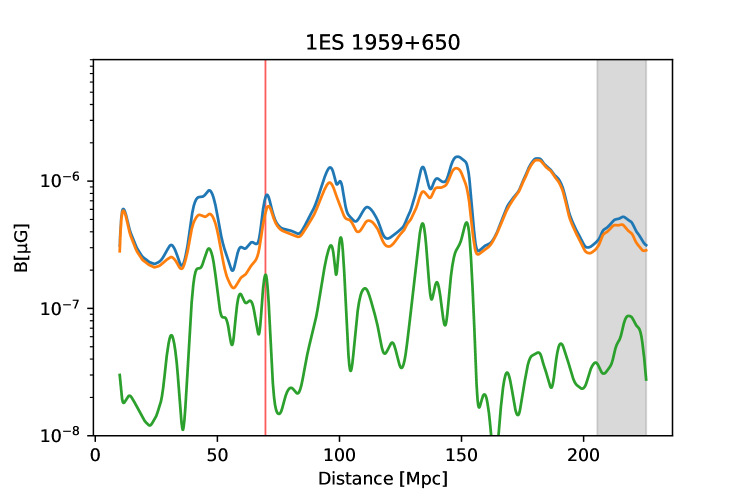
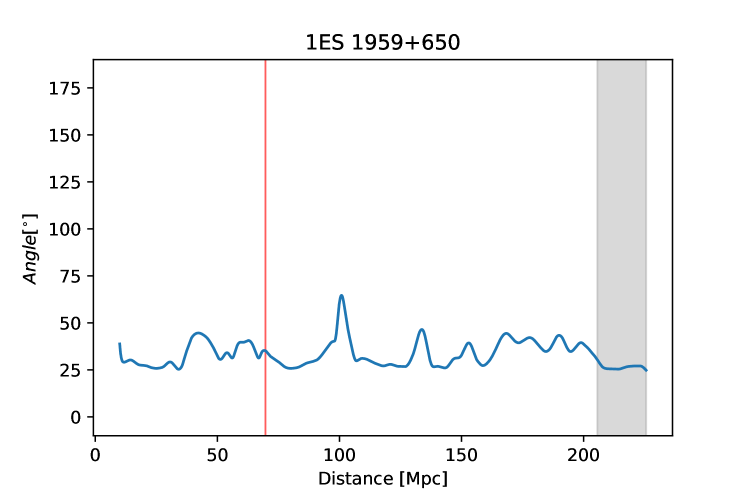
Figs. 1, 2 and 3 show the line-of-sight profiles of magnetic field toward Mkn 501, Mkn 421 and 1ES 1959+650. The top panels of the figures show the line-of-sight profiles of the density field. Regions with overdensities above that are excluded from our further analysis because of possible “contamination” of the magnetic field by baryonic feedback Bondarenko et al. (2021) are indicated with vertical red bands. In those regions secondary electrons are randomized by high magnetic fields, they emit secondary photons in random directions and their signal in direction to observer can be safely neglected. Grey bands indicate the distance to the blazars. For all three examples, the -ray sources are situated in moderately overdense regions that are unlikely to be affected by strong magnetised outflows from galaxies. None of the three sources have a line-of-sight aligned with a filament of the LSS. This makes all the three sources suitable for the IGMF measurement.
The middle and bottom panels of the figures show the strength and orientation of the IGMF along the lines of sight. One can see clear differences of the IGMF structure for the three sources. The component of the magnetic field perpendicular to the line of sight is strongly suppressed in the case of 1ES 1959+650, because of the alignment of the cosmological field direction with the line of sight.
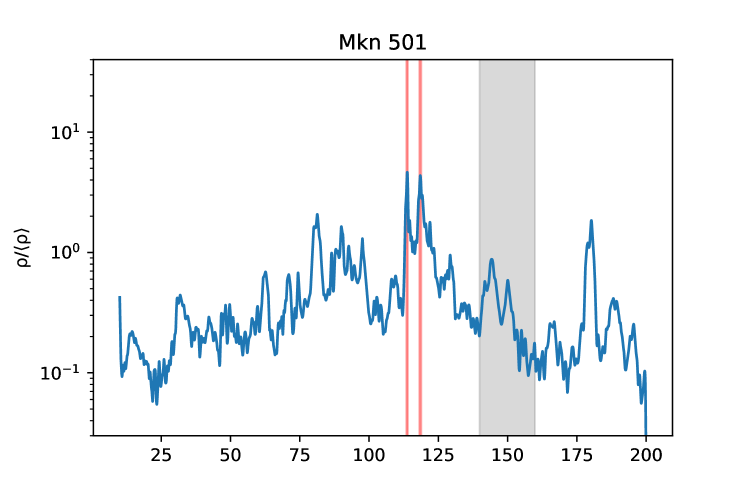
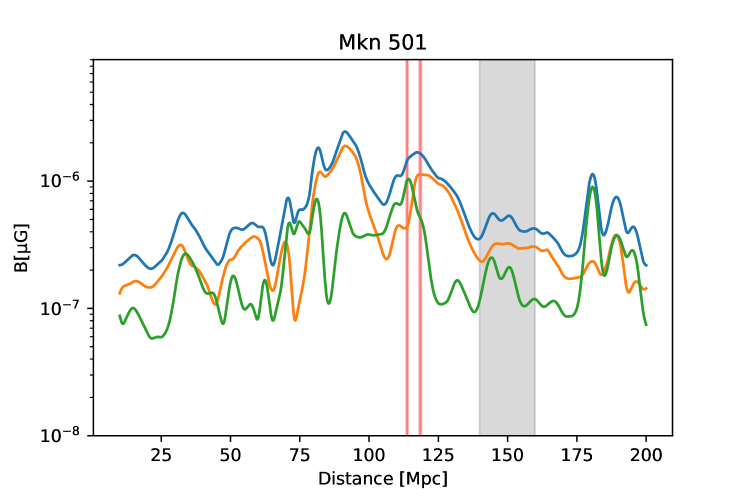
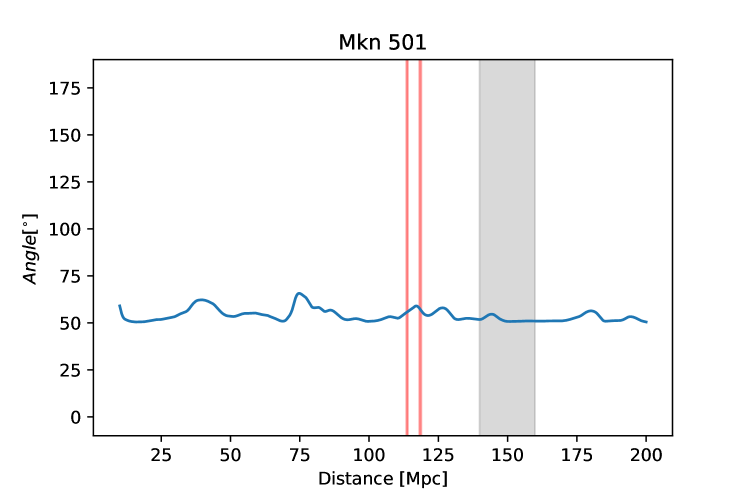
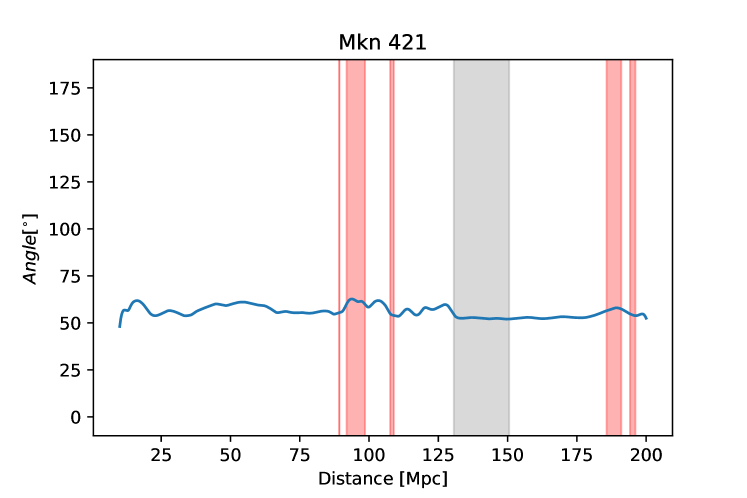
The lower panels of the figure show the position angle of the perpendicular to the line-of-sight field component, counted from the direction toward North. Deviations from the straight horizontal lines in these panels are due to the effect of structure formation. One can see that the effect is moderate and the initial cosmological field direction is mostly preserved in the course of structure formation.
V Modelling of secondary extended gamma-ray emission
We model the secondary cascade -ray signal with the CRbeam Monte Carlo code (Berezinsky and Kalashev, 2016) which propagates high energy -rays through the cosmic medium taking into account most important physical interactions: pair production by -ray absorption and inverse Compton scattering of secondary electrons and positrons on the EBL (Franceschini et al., 2008) and CMB. Electrons and positrons are also deflected in magnetic field whose strength is obtained from IGMF model described in the previous section.
For intrinsic point source spectrum we assume broken power law spectrum with break position around 100 GeV and maximum energy 100 TeV. All primary -rays have the same direction of initial momenta which coincides with the direction from the source to the observer. The -rays are propagated until they reach the sphere whose center coincides with the position of the source and radius is equal to the distance to the observer. To model primary -ray emission into a jet with an opening angle we select -rays whose positions on the sphere lie inside the cone with the opening angle and direction of the axis coincides with the direction of jet. We do not take into account secondary photons that were created in the regions with an overdensity above 3, see Figs. 1, 2 and 3. To explore different strengths of seed magnetic field we rescale the magnetic field profile by a constant factor keeping the shape of the profile unchanged.
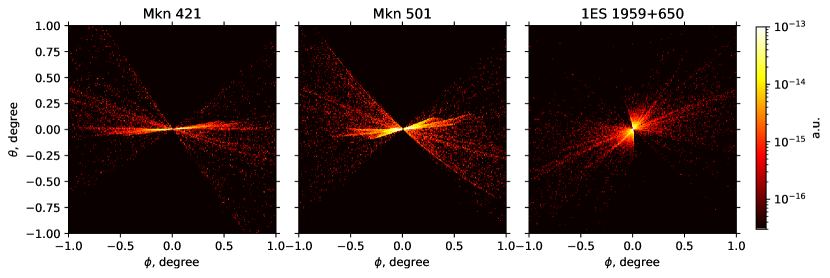
Figs. 4 shows the images of the extended emission calculated for the field strength G for the three brightest sources in our sample. The images of extended emission around Mkn 421 and Mkn 501 reveal a clear overall azimuthal asymmetry that is imposed by the orientation of the initial homogeneous field projected on the sky. To the contrary, the image for 1ES 1959+650 appears halo-like. This is explained by the alignment of the magnetic field along the line of sight.
The images are superpositions of line-like features that are not perfectly aligned with each other. If the IGMF were perfectly homogeneous, with fixed direction, all these features would be strictly aligned, so that “narrow-jet-like” extensions would be observable. The appearance of multiple misaligned features reveals the influence of the structure formation on the field. Each feature is produced by the -ray beam passing through individual voids along the line of sight. In each void collective motions of the medium induce different deformations of the magnetic field. This results in the changes of directions of deflection of electrons and positrons injected in the voids by the pair production.
Jet-like, rather than halo-like extended emission is generically expected even for short correlation length IGMF (originating from a cosmological phase transition) Neronov et al. (2010). Thus, the azimuthal asymmetry of the extended signal is not an indication of the presence of large correlation length IGMF. However, there are two important differences in the properties of the jet-like extended emission in the two alternative cases of phase transition and inflationary magnetic field. The jet-like extensions are one-sided in the case of a short correlation length field Neronov et al. (2010), whereas the jet-like extensions are two sided for Mkn 421 and Mkn 501 in Fig. 4. In addition, in the case of the phase transition IGMF, the position angle of the one-sided jet-like extended emission is determined by the orientation of the jet of the blazar rather than by the direction of the field. It is expected to be random for different sources, whereas in the case of the inflationary large correlation length field the extended sources associated to different blazars have the same position angle.
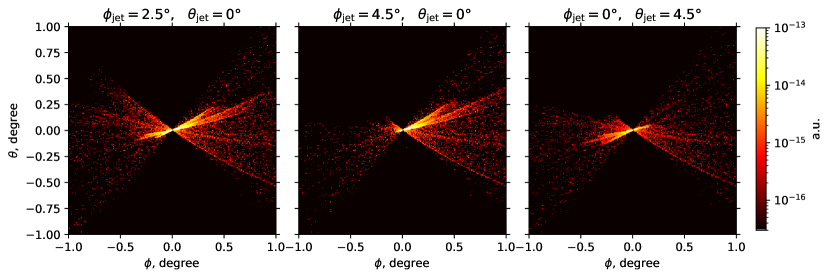
If the blazar jet is closely aligned with the line of sight, the two sides of the extended emission are symmetric, they have comparable surface brightness. This symmetry can be broken by the misalignment of the jet with the line of sight. This effect is illustrated in Fig. 5. Angles between the blazar jet, the line of sight and the direction of CMF regulate the flux levels of the extended emission components on different sides.
The orientation of the two-sided extension that is due to the presence of the large correlation length field is, always perpendicular to the direction of magnetic field projected on the sky. If the cosmological IGMF is correlated on the distance scales larger than hundreds of Megaparsecs, orientations of the two-sided extensions around different sources all over the sky are all expected to be aligned. Measurement of aligned extended emission features around multiple sources can provide an unambiguous evidence for the presence of magnetic field of inflationary origin. In this case position angles of the two-sided extensions provide the measurement of the direction of the primordial field.
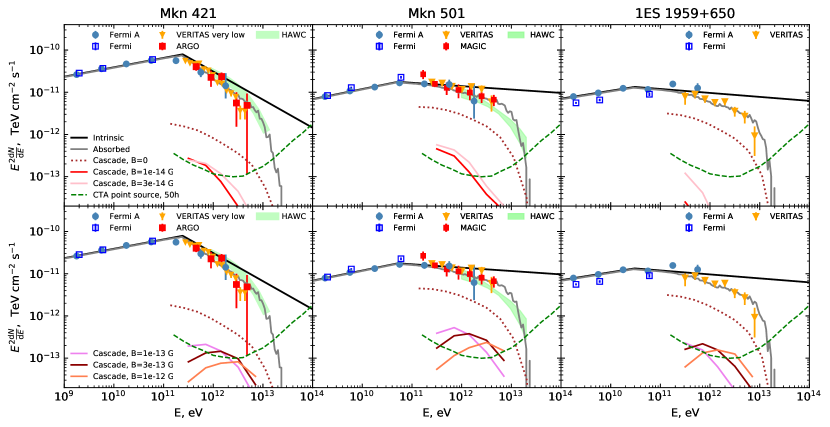
Fig. 6 shows spectra of the point and extended source emission for different assumptions about the magnetic field strength. For each source we choose the model of the intrinsic spectrum in such a way that it fits the spectral measurements of the ”low state” of the source and/or the time-averaged spectral measurements on multi-year time scales. For all sources we consider two alternative Fermi spectral data: the spectral measurements reported in the Fermi source catalog Abdollahi et al. (2020) and the spectra extracted usng the aperture photometry approach for the full 13-year exposure of Fermi/LAT up to July 2021. This allows us to extend the Fermi catalog measurements up to the 3 TeV energy111The “analysis caveats” page of Fermi Science Support Center, https://fermi.gsfc.nasa.gov/ssc/data/analysis/caveats.html recommends the use of Fermi/LAT spectra up to 1 TeV, because of the lack of validation of the Instrument Response Functions (IRFs) in the 1-3 TeV energy range. Our comparison of Fermi/LAT and Cherenkov telescope spectra of bright blazars shown in Fig. 6 shows that the Fermi/LAT measurements in this energy range agree with those of other -ray telescopes. . For the aperture photometry, we extract the source counts: , , from circles of the radius 0.5 and 1 degree using the gtsselecte-gtmktime-gtbin chain. We then calculate the exposure (product of the energy-dependent effective area and exposure time , using the gtexposure tool twice: first without the aperture correction, to calculate , and then with the aperture correction that takes into account the fraction of the point spread function contained in the circles of different radii : , . This allows us to calculate and that enter a system of equations that determines and for the source flux (measured in counts/(cm2s)) and background flux (in counts/(cm2sr)):
| (1) |
Solving this system of equations for and we determine the source and background fluxes in each energy bin. The high energy part of Fermi/LAT spectral measurements overlaps well with the energy range of Cherenkov telescope and HAWC measurements. This provides a possibility of cross-calibration of measurements with different instruments.
For Mkn 501 we used MAGIC and VERITAS analyses from 2009 (Abdo et al., 2011), and long term observations from ARGO (Bartoli, 2012) and HAWC (Coutiño de Leon et al., 2019). For Mkn 421 we used long term observations from ARGO (Bartoli et al., 2016) and HAWC (Coutiño de Leon et al., 2019) and very low state from VERITAS measurement (Acciari et al., 2011).
We extracted the extended source fluxes from wedges of the angular width that contain the signal. From the wedges, we excluded the regions in which the primary source emission dominates, namely, we did not take into account those regions of the wedges that are located at a distance from the centers less than the angular resolution of the CTA. From Fig. 4 one can judge that the extended emission is dominated by the flux in a much narrower wedge, with opening angle of just a few degrees.
This gives a conservative estimate of the detectable extended source flux. In principle, stronger signal can be extracted using the azimuthal asymmetry of the extended emission. If the shape of the point spread function is known, the extended emission can be detected also from within the extent of the point spread function. Systematic uncertainty of the knowledge of the point spread function limits the sensitivity of Cherenkov telescopes for detection of extended emission Neronov et al. (2011); Da Vela et al. (2018). This uncertainty can be mitigated by the direct measurement of the point spread function in the direction perpendicular to the direction of extended emission. This is possible even if the source line of sight is nearly aligned with the field direction, as illustrated by the example of 1ES 1959+650, shown in the right panel of Fig. 4.
The linear, one-dimensional, rather than circular, two-dimensional shape of the extended source also provides an improvement of sensitivity for another reason. The sensitivity for extended sources typically worsens with the increase of the solid angle spanned by the extended source on the sky, because of the increase of the background on top of which the signal is detected. Concentration of the extended signal in a narrow wedge reduces the solid angle and hence increases the signal-to-noise ratio.
All the sources in our sample have steep spectra in the 10 TeV range. This diminishes the power of the secondary emission observable in the 0.1-1 TeV range. The total flux that would be available for detection (as a contribution to the point source flux) in the absence of an IGMF is shown by the brown dotted lines in Fig. 6. The IGMF deflects electrons and positrons away from the line of sight, so that the secondary -rays produced by the inverse Compton scattering of the Cosmic Microwave Background becomes unobservable. This effect is stronger at lower energies. This explains the suppression of the extended flux (that we collect from the wedge-shaped regions containing the secondary flux) at the energies below 100 GeV. If the magnetic field is too weak to deflect electrons and positrons, the secondary flux just contributes to the point source flux and is also undetectable. This explains the suppression of the secondary signal at higher energies. Both low- and high-energy suppression depends on the strength of magnetic field.
Fig. 6 shows a comparison of the expected secondary flux levels with the sensitivity of the CTA telescopes for detection of extended sources. This comparison shows how challenging the search for the two-sided jet-like extensions might be. The model predictions for the extended signal are at the limit of sensitivity for the 50 hr exposure of each of the three brightest sources in our source sample. However, use of possible improvements of the method with ”in-situ” measurement of the telescope point spread function and careful choice of the wedge for the extended signal measurements may improve the sensitivity. Otherwise, much longer exposure of several hundred hours (instead of 50 hr considered here) can also boost signal-to-noise ratio and make the correlated extended emission signal measureable in all the three brightest nearby blazars considered above.
VI Conclusions
In this paper we studied a possibility of detection of primordial magnetic field from inflation Ratra (1992); Durrer and Neronov (2013) with gamma-ray telescopes. Such field can be coherent on cosmological scales and induce wedge-like extended emission around nearby blazars, with aligned wedge orientations in multiple sources across the sky.
This alignment can be used to distinguish the establish the inflationary origin of IGMF, because it is not expected if the IGMF originates from cosmological phase transitions. For small coherence scale IGMF, the wedge like appearance of the extended emission is also generically expected, but the position angles of wedged extended emission around different sources would not be correlated, because it is determined by the orientation of the jets in the primary blazar source.
The morphology of the secondary emission depends on the jet orientation also for the inflationary magnetic field (Fig. 5). However, the jet orientation does not affect the position angle of the extended source.
Acknowledgements.
The work of A.N., G.L., M.R. and D.S. has been supported in part by the French National Research Agency (ANR) grant ANR-19-CE31-0020, work of A.K. was supported in part by Russian Science Foundation grant 20-42-09010. A.K.’s stay in the APC laboratory was provided by the “Vernadsky” scholarship of the French embassy in Russia. This work has made use of the Infinity Cluster hosted by Institut d’Astrophysique de Paris. We thank Stéphane Rouberol for running this cluster smoothly for us. This work has been done within the Aquila Consortium (https://www.aquila-consortium.org).References
- Plaga (1995) R. Plaga, Nature (London) 374, 430 (1995).
- Neronov and Semikoz (2007) A. Neronov and D. V. Semikoz, JETP Lett. 85, 473 (2007), eprint astro-ph/0604607.
- Neronov and Semikoz (2009) A. Neronov and D. Semikoz, Phys. Rev. D 80, 123012 (2009), eprint 0910.1920.
- Neronov and Vovk (2010) A. Neronov and I. Vovk, Science 328, 73 (2010), eprint 1006.3504.
- Taylor et al. (2011) A. Taylor, I. Vovk, and A. Neronov, Astron. Astrophys. 529, A144 (2011), eprint 1101.0932.
- Ackermann et al. (2018) M. Ackermann et al. (Fermi-LAT), Astrophys. J. Suppl. 237, 32 (2018), eprint 1804.08035.
- Korochkin et al. (2021) A. Korochkin, O. Kalashev, A. Neronov, and D. Semikoz, Astrophys. J. 906, 116 (2021), eprint 2007.14331.
- Vovk et al. (2021) I. Vovk, J. Biteau, H. Martínez-Huerta, M. Meyer, and S. Pita (CTA Consortium), PoS ICRC2021, 894 (2021), eprint 2110.07864.
- Banerjee and Jedamzik (2004) R. Banerjee and K. Jedamzik, Phys. Rev. D 70, 123003 (2004), eprint astro-ph/0410032.
- Kahniashvili et al. (2013) T. Kahniashvili, A. G. Tevzadze, A. Brandenburg, and A. Neronov, Phys. Rev. D 87, 083007 (2013), eprint 1212.0596.
- Ratra (1992) B. Ratra, Ap.J.Lett. 391, L1 (1992).
- Garretson et al. (1992) W. D. Garretson, G. B. Field, and S. M. Carroll, Phys. Rev. D 46, 5346 (1992), eprint hep-ph/9209238.
- Gasperini et al. (1995) M. Gasperini, M. Giovannini, and G. Veneziano, Phys. Rev. Lett. 75, 3796 (1995), eprint hep-th/9504083.
- Giovannini and Shaposhnikov (2000) M. Giovannini and M. E. Shaposhnikov, Phys. Rev. D 62, 103512 (2000), eprint hep-ph/0004269.
- Demozzi et al. (2009) V. Demozzi, V. Mukhanov, and H. Rubinstein, JCAP 08, 025 (2009), eprint 0907.1030.
- Ferreira et al. (2013) R. J. Z. Ferreira, R. K. Jain, and M. S. Sloth, JCAP 10, 004 (2013), eprint 1305.7151.
- Durrer and Neronov (2013) R. Durrer and A. Neronov, Astron. Astrophys. Rev. 21, 62 (2013), eprint 1303.7121.
- Bertone et al. (2006) S. Bertone, C. Vogt, and T. Enßlin, MNRAS 370, 319 (2006), eprint astro-ph/0604462.
- Marinacci et al. (2018) F. Marinacci, M. Vogelsberger, R. Pakmor, P. Torrey, V. Springel, L. Hernquist, D. Nelson, R. Weinberger, A. Pillepich, J. Naiman, et al., MNRAS 480, 5113 (2018), eprint 1707.03396.
- Bondarenko et al. (2021) K. Bondarenko, A. Boyarsky, A. Korochkin, A. Neronov, D. Semikoz, and A. Sokolenko (2021), eprint 2106.02690.
- Jasche and Wandelt (2013) J. Jasche and B. D. Wandelt, MNRAS 432, 894 (2013), eprint 1203.3639.
- Teyssier (2002) R. Teyssier, A&A 385, 337 (2002), eprint astro-ph/0111367.
- Berezinsky and Kalashev (2016) V. Berezinsky and O. Kalashev, Phys. Rev. D 94, 023007 (2016), eprint 1603.03989.
- Fromang et al. (2005) S. Fromang, P. Hennebelle, and R. Teyssier, SF2A-2005: Semaine de l’Astrophysique Francaise p. 743 (2005).
- Jasche and Lavaux (2019) J. Jasche and G. Lavaux, A&A 625, A64 (2019), eprint 1806.11117.
- Lavaux and Hudson (2011) G. Lavaux and M. J. Hudson, MNRAS 416, 2840 (2011), eprint 1105.6107.
- Hahn and Abel (2011) O. Hahn and T. Abel, MNRAS 415, 2101 (2011), eprint 1103.6031.
- Miyoshi and Kusano (2005) T. Miyoshi and K. Kusano, Journal of Computational Physics 208, 315 (2005).
- Bondarenko et al. (2020) K. Bondarenko, J. Pradler, and A. Sokolenko, Phys. Lett. B 805, 135420 (2020), eprint 2002.08942.
- Evans and Hawley (1988) C. R. Evans and J. F. Hawley, Astrophys. J. 332, 659 (1988).
- Stasyszyn and Elstner (2015) F. A. Stasyszyn and D. Elstner, Journal of Computational Physics 282, 148 (2015), eprint 1411.3290.
- Mocz et al. (2016) P. Mocz, R. Pakmor, V. Springel, M. Vogelsberger, F. Marinacci, and L. Hernquist, MNRAS 463, 477 (2016), eprint 1606.02310.
- Franceschini et al. (2008) A. Franceschini, G. Rodighiero, and M. Vaccari, A&A 487, 837 (2008), eprint 0805.1841.
- Neronov et al. (2010) A. Neronov, D. Semikoz, M. Kachelriess, S. Ostapchenko, and A. Elyiv, Ap.J.Lett. 719, L130 (2010), eprint 1002.4981.
- Abdo et al. (2011) A. A. Abdo et al. (LAT, MAGIC, VERITAS), Astrophys. J. 727, 129 (2011), eprint 1011.5260.
- Bartoli (2012) B. e. a. A. Bartoli, Astrophys. J. 758, 2 (2012), eprint 1209.0534.
- Coutiño de Leon et al. (2019) S. Coutiño de Leon, A. C. Alonso, D. Rosa-Gonzalez, and A. L. Longinotti, in 36th International Cosmic Ray Conference (ICRC2019) (2019), vol. 36 of International Cosmic Ray Conference, p. 654, eprint 1909.01179.
- Abdollahi et al. (2020) S. Abdollahi et al. (Fermi-LAT), Astrophys. J. Suppl. 247, 33 (2020), eprint 1902.10045.
- Bartoli et al. (2016) B. Bartoli et al. (ARGO-YBJ), Astrophys. J. Suppl. 222, 6 (2016), eprint 1511.06851.
- Acciari et al. (2011) V. A. Acciari et al., Astrophys. J. 738, 25 (2011), eprint 1106.1210.
- Neronov et al. (2011) A. Neronov, D. V. Semikoz, P. G. Tinyakov, and I. I. Tkachev, A&A 526, A90 (2011), eprint 1006.0164.
- Da Vela et al. (2018) P. Da Vela, A. Stamerra, A. Neronov, E. Prandini, Y. Konno, and J. Sitarek, Astroparticle Physics 98, 1 (2018).