Datasets for Online Controlled Experiments
Abstract
Online Controlled Experiments (OCE) are the gold standard to measure impact and guide decisions for digital products and services. Despite many methodological advances in this area, the scarcity of public datasets and the lack of a systematic review and categorization hinder its development. We present the first survey and taxonomy for OCE datasets, which highlight the lack of a public dataset to support the design and running of experiments with adaptive stopping, an increasingly popular approach to enable quickly deploying improvements or rolling back degrading changes. We release the first such dataset, containing daily checkpoints of decision metrics from multiple, real experiments run on a global e-commerce platform. The dataset design is guided by a broader discussion on data requirements for common statistical tests used in digital experimentation. We demonstrate how to use the dataset in the adaptive stopping scenario using sequential and Bayesian hypothesis tests and learn the relevant parameters for each approach.
1 Introduction
Online controlled experiments (OCEs) have become popular among digital technology organizations in measuring the impact of their products and services, and guiding business decisions [50, 53, 76]. Large tech companies including Google [41], Linkedin [85], and Microsoft [49] reported running thousands of experiments on any given day, and there are multiple companies established solely to manage OCEs for other businesses [11, 45]. It is also considered a key step in the machine learning development lifecycle [9, 90].
OCEs are essentially randomized controlled trials run on the Web. The simplest example, commonly known as an A/B test, splits a group of entities (e.g. users to a website) randomly into two groups, where one group is exposed to some treatment (e.g. showing a "free delivery" banner on the website) while the other act as the control (e.g. seeing the original website without any mention of free delivery). We calculate the decision metric(s) (e.g. proportion of users who bought something) based on responses from both groups, and compare the metrics using a statistical test to draw causal statements about the treatment.
The ability to run experiments on the Web allows one to interact with a large number of subjects within a short time frame and collect a large number of responses. This, together with the scale of experimentation carried out by tech organizations, should lead to a wealth of datasets describing the result of an experiment. However, there are not many publicly available OCE datasets, and we believe they were never systematically reviewed nor categorized. This is in contrast to the machine learning field, which also enjoyed its application boom in the past decade yet already has established archives and detailed categorizations for its datasets [28, 78].
We argue the lack of relevant datasets arising from real experiments hinders the further development of OCE methods (e.g. new statistical tests, bias correction, and variance reduction methods). Many statistical tests proposed relied on simulated data that impose restrictive distributional assumptions and thus may not be representative of the real-world scenario. Moreover, it may be difficult to understand how methods differ from each other and assess their relative strengths and weaknesses without a common dataset to compare them on.
To address this problem, we present the first ever survey and taxonomy for OCE datasets. Our survey identified 13 datasets, including standalone experiment archives, accompanying datasets from scholarly works, and demo datasets from online courses on the design and analysis of experiments. We also categorize these datasets based on dimensions such as the number of experiments each dataset contains, how granular each data point is time-wise and subject-wise, and whether it includes results from real experiment(s).
The taxonomy enables us to engage in a discussion on the data requirements for an experiment by systematically mapping out which data dimension is required for which statistical test and/or learning the hyperparameter(s) associated with the test. We also recognize that in practice data are often used for purposes beyond what it is originally collected for [47]. Hence, we posit the mapping is equally useful in allowing one to understand the options they have when choosing statistical tests given the format of data they possess. Together with the survey, the taxonomy helps us to identify what types of datasets are required for commonly used statistical tests, yet are missing from the public domain.
One of the gaps the survey and taxonomy identify is datasets that can support the design and running of experiments with adaptive stopping (a.k.a. continuous monitoring / optional stopping). We motivate their use below. Traditionally, experimenters analyze experiments using Null Hypothesis Statistical Tests (NHST, e.g. a Student’s -test). These tests require one to calculate and commit to a required sample size based on some expected treatment effect size, all prior to starting the experiment. Making extra decisions during the experiment, be it stopping the experiment early due to seeing favorable results, or extending the experiment as it teeters “on the edge of statistical significance” [61], is discouraged as they risk one having more false discoveries than intended [35, 60].
Clearly, the restrictions above are incompatible with modern decision-making processes. Businesses operating online are incentivized to deploy any beneficial and roll back any damaging changes as quickly as possible. Using the “free delivery” banner example above, the business may have calculated that they require four weeks to observe enough users based on an expected 1% change in the decision metric. If the experiment shows, two weeks in, that the banner is leading to a 2% improvement, it will be unwise not to deploy the banner to all users simply due to the need to run the experiment for another two weeks. Likewise, if the banner is shown leading to a 2% loss, it makes every sense to immediately terminate the experiment and roll back the banner to stem further losses.
As a result, more experimenters are moving away from NHST and adopting adaptive stopping techniques. Experiments with adaptive stopping allow one to decide when to stop an experiment (i.e. stopping it earlier or prolonging it) based on the sample responses observed so far without compromising the statistical validity of false positive/discovery rate control. To encourage further development in this area, both in methods and data, we release the ASOS Digital Experiments Dataset, which contains daily checkpoints of decision metrics from multiple, real OCEs run on the global online fashion retail platform.
The dataset design is guided by the requirements identified by the mapping between the taxonomy and statistical tests, and to the best of our knowledge, is the first public dataset that can support the end-to-end design and running of online experiments with adaptive stopping. We demonstrate it can indeed do so by (1) running a sequential test and a Bayesian hypothesis test on all the experiments in the dataset, and (2) estimating the value of hyperparameters associated with the tests. While the notion of ground-truth does not exist in real OCEs, we show the dataset can also act as a quasi-benchmark for statistical tests by comparing results from the tests above with that of a -test.
To summarize, our contributions are:
- 1.
-
2.
(Section 4) We map the relationship between the taxonomy to statistical tests commonly used in experiments by identifying the minimally sufficient set of statistics and dimensions required in each test. The mapping, which also applies to offline and non-randomized controlled experiments, enables experimenters to quickly identify the data collection requirements for their experiment design (and conversely the test options available given the data availability); and
-
3.
(Section 5) We make available, to the best of our knowledge, the first real, multi-experiment time series dataset, enabling the design and running of experimentation with adaptive stopping.111Link to the dataset and accompanying datasheet: https://osf.io/64jsb/
2 A Taxonomy for Online Controlled Experiment Datasets
We begin by presenting a taxonomy on OCE datasets, which is necessary to characterize and understand the results of a survey. To the best of our knowledge, there are no surveys nor taxonomies specifically on this topic prior to this work. While there is a large volume of work concerning the categorization of datasets in machine learning [28, 78], of research work in the online randomized controlled experiment methods [3, 4, 32, 69], and of general experiment design [43, 52], our search on Google Scholar and Semantic Scholar using combinations of the keywords “online controlled experiment”/“A/B test”, “dataset”, and “taxonomy”/“categorization” yields no relevant results.
The taxonomy focuses on the following four main dimensions:
Experiment count A dataset can contain the data collected from a single experiment or multiple experiments. Results from a single experiment are useful for demonstrating how a test works, though any learning should ideally involve multiple experiments. Two closely related but relatively minor dimensions are the variant count (number of control/treatment groups in the experiment) and the metric count (number of performance metrics the experiment is tracking). Having an experiment with multiple variants and metrics enables the demonstration of methods such as false discovery rate control procedures [8] and learning the correlation structure within an experiment.
Response granularity Depending on the experiment analysis requirements and constraints imposed by the online experimentation platform, the dataset may contain data aggregated to various levels. Consider the “free delivery” banner example in Section 1, where the website users are randomly allocated to the treatment (showing the banner) and control (not showing the banner) groups to understand whether the banner changes the proportion of users who bought something. In this case, each individual user is considered a randomization unit [50].
A dataset may contain, for each experiment, only summary statistics on the group level, e.g. the proportion of users who have bought something in the control and treatment groups respectively. It can also record one response per randomization unit, with each row containing the user ID and whether the user bought something. The more detailed activity logs at a sub-randomization unit level can also have each row containing information about a particular page view from a particular user.
Time granularity An experiment can last anytime between a week to many months [50], which provides many possibilities in recording the result. A dataset can opt to record the overall result only, showing the end state of an experiment. It may or may not come with a timestamp for each randomization unit or experiment if there are multiple instances of them. It can also record intermediate checkpoints for the decision metrics, ideally at regular intervals such as daily or hourly. These checkpoints can either be a snapshot of the interval (recording activities between time and , time and , etc.) or cumulative from the start of the experiment (recording activities between time and , time and , etc.).
Syntheticity A dataset can record data generated from a real process. It can also be synthetic—generated via simulations with distributional assumptions applied. A dataset can also be semi-synthetic if it is generated from a real-life process and subsequently augmented with synthetic data.
Note we can also describe datasets arising from any experiments (including offline and non-randomized controlled experiments) using these four dimensions. We will discuss in Section 4 how these dimensions map to common statistical tests used in online experimentation.
In addition, we also record the application domain, target demographics, and the temporal coverage of the experiment(s) featured in a dataset. In an age when data are often reused, it is crucial for one to understand the underlying context, and that learnings from a dataset created under a certain context may not translate to another context. We also see the surfacing of such context as a way to promote considerations in fairness and transparency for experimenters as more experiment datasets become available [44]. For example, having target demographics information on a meta-level helps experimenters to identify who were involved, or perhaps more importantly, who were not involved in experiments and could be adversely impacted by a treatment that is effectively untested.
Finally, two datasets can also differ in their medium of documentation and the presence/absence of a data management / long-term preservation plan. The latter includes the hosting location, the presence/absence of a DOI, and the type of license. We record these attributes for the datasets surveyed below for completeness.
3 Public Online Controlled Experiment Datasets
Here we discuss our approach to produce the first ever survey on OCE datasets and present its results. The survey is compiled via two search directions, which we describe below. For both directions, we conduct a first round search in May 2021, with follow up rounds in August and October 2021 to ensure we have the most updated results.
We first search on the vanilla Google search engine using the keywords “Online controlled experiment "dataset"”, “A/B test "dataset"”, and “Multivariate test "dataset"”. For each keyword, we inspect the first 10 pages of the search result (top 100 results) for scholarly articles, web pages, blog posts, and documents that may host and/or describe a publicly available OCE dataset. The search term “dataset” is in double quotes to limit the search results to those with explicit mention of dataset(s). We also search on specialist data search engines/hosts, namely on Google Dataset Search (GDS) and Kaggle, using the keywords “Online controlled experiment(s)” and “A/B test(s)”. We inspect the metadata and description for all the results returned (except for GDS, where we inspect the first 100 results for “A/B test(s)”) for relevant datasets as defined below.222Searching for the keyword “Online controlled experiment” on GDS and Kaggle returned 42 and 7 results respectively, and that for “A/B test” returned “100+” and 286 results respectively. Curiously, replacing “experiment” and “test” in the keywords with their plural form changes the number of results, with the former returning 6 and 10 results on GDS and Kaggle respectively, and the latter returning “100+” and 303 results respectively.
A dataset must record the result arising from a randomized controlled experiment run online to be included in the survey. The criterion excludes experimental data collected from offline experiments, e.g. those in agriculture [84], medicine [27], and economics [29]. It also excludes datasets used to perform quasi-experiments and observational studies, e.g. the LaLonde dataset used in econometrics [21] and datasets constructed for uplift modeling tasks [25, 40].333Uplift modeling (UM) tasks for online applications often start with an OCE [67] and thus we can consider UM datasets as OCE datasets with extra randomization unit level features. The nature of the tasks is different though: OCEs concern validating the average treatment effect across the population using a statistical test, whereas UM concerns modeling the conditional average treatment effect for each individual user, making it more a general causal inference task that is outside the scope of this survey.
The result is presented in Table 1. We place the 13 OCE datasets identified in this exercise along the four taxonomy dimensions defined in Section 2 and record the additional features. These datasets include two standalone archives for online media and education experiments respectively [56, 71], plus two accompanying datasets for peer-reviewed research articles [75, 87]. There are also tens of Kaggle datasets, blog posts, and code repositories that describe and/or duplicate one of the five example datasets used in five different massive open online courses on online controlled experiment design and analysis [10, 12, 36, 37, 77]. Finally, we identify three standalone datasets hosted on Kaggle with relatively light documentation [5, 31, 48].
From the table, we observe a number of gaps in OCE dataset availability, the most obvious one being the lack of datasets that record responses at a sub-randomization unit level. In the sections below, we will identify more of these gaps and discuss their implications for OCE analysis.
4 Matching Dataset Taxonomy with Statistical Tests
Specifying the data requirements (or structure) and performing statistical tests are perhaps two of the most common tasks carried out by data scientists. However, the link between the two processes is seldom mapped out explicitly. It is all too common to consider from scratch the question “I need to run this statistical test, how should I format my dataset?” (or more controversially, “I have this dataset, what statistical tests can I run?” [47]) for every new project/application, despite the list of possible dataset dimensions and statistical tests remaining largely the same.
We aim to speed up the process above by describing what summary statistics are required to perform common statistical tests in OCE, and link the statistics back to the taxonomy dimensions defined in Section 2. The exercise is similar to identifying the sufficient statistic(s) for a statistical model [33], though the identification is done for the encapsulating statistical inference procedure, with a practical focus on data dimension requirements. We do so by stating the formula used to calculate the corresponding effect sizes and test statistics and observe the summary statistics required in common. The general approach enables one to also apply the resultant mapping to any experiments that involve
Dataset Name Ref. Experiment Count - Variant / Metric Count Response Granularity Time Granularity Syntheticity Application Domain Target Demographic Temporal Coverage Documentation Data management / long- term preservation plan Upworthy Research Archive [56] Multiple (32,487) - 2-14 / 2 (C) Group Overall result only Timestamp per expt. Real Media & Ads Copy/Creative Mostly English- speaking users in USA Jan 2013 – Apr 2015 Peer reviewed data article Host: Open Science Framework DOI: ✓ (see [56]) Licence: CC BY 4.0 ASSISTments Dataset from Multiple Randomized Controlled Experiments [71] Multiple (22) - 2 / 2 (BC) Rand. Unit Overall result only ✗ timestamp Real Education Teaching model Mostly middle school students (age 11-14) in/near MA, USA 2013 – 2015 Peer reviewed data article Host: Author website DOI: Unknown Licence: Unknown A/B Testing Web Analytics Data (From [88]) [87] Single - 5 / 2 (C) Group Overall result only timestamp Real Education UX/UI change Mostly English- speaking university library users May 2013 – Jun 2013 Accompanying dataset to peer-reviewed research article Host: University library DOI: ✓ (see [87]) Licence: CC BY-SA 4.0 Dataset of two experiments of the application of gamified peer assessment model into online learning environment MeuTutor (From [74]) [75] Multiple (2) - 3+2 / 3+3 (R+C) Rand. Unit Overall result only ✗ timestamp Real Education Teaching model High school students in Brazil taking ENEM (age 17) Jul 2015 – Aug 2015 Peer reviewed data article Host: Journal website DOI: ✓ (see [75]) Licence: CC BY 4.0 Udacity Free Trial Screener Experiment (From Udacity A/B Testing Course - Final Project [36]) See e.g. [62, 72, 80] Single - 2 / 4 (C) Group Daily checkpoint Snapshot Real Education UX/UI change Mostly English- speaking users Unknown Blog posts & Kaggle notebooks e.g. [57, 70, 89] Host: Kaggle / GitHub (multiple) DOI: Unknown Licence: Unknown “Analyse A/B Test Results” Dataset (From Udacity Online Data Analyst Course - Project 3 [77]) See e.g. [2, 20, 65] Single - 2 / 1 (B) Rand. Unit Overall result only Timestamp per RU Unknown E-commerce UX/UI change Unknown Unknown Blog posts & Kaggle notebooks e.g. [16, 54, 68] Host: Kaggle / GitHub (multiple) DOI: Unknown Licence: Unknown Mobile Games A/B Testing with Cookie Cats (DataCamp project [10]) See e.g. [30, 73, 86] Single - 2 / 3 (BC) Rand. Unit Overall result only ✗ timestamp Real Gaming Design change Unknown (likely Facebook users) Unknown Kaggle notebook Host: Kaggle / Course website DOI: Unknown Licence: Unknown Experiment Dataset (From DataCamp A/B Testing in R Course [12]) [13] Single - 2 / 1 (B) Rand. Unit Overall result only Timestamp per RU Synthetic Tech UX/UI Change N/A N/A Course notes Blog posts Host: Course website DOI: Unknown Licence: Unknown Data Visualization Website - April 2018 (From DataCamp A/B Testing in R Course [12]) [14] Single - 2 / 4 (BR) Rand. Unit Overall result only Timestamp per RU Synthetic Tech UX/UI Change N/A N/A Course notes Host: Course website DOI: Unknown Licence: Unknown AB Testing Result (From Customer Analytics and A/B Testing in Python [37]) [38] Single - 2 / 2 (CR) Rand. Unit Overall result only Timestamp per RU Unknown Tech UX/UI Change Unknown Jan 2014 – Jan 2018 Course notes Host: Course website DOI: Unknown Licence: Unknown Grocery Website Data for AB Test [48] Single - 2 / 1 (B) Rand. Unit Overall result only ✗ timestamp Unknown E-commerce UX/UI change Unknown Unknown Kaggle notebook Host: Kaggle DOI: Unknown Licence: Unknown Ad A/B Testing (aka SmartAd AB Data) [31] Single - 2 / 2 (B) Rand. Unit Overall result only Timestamp per RU Unknown Media & Ads Display ads Unknown Jul 2020 Kaggle notebook Host: Kaggle DOI: N/A Licence: CC BY-SA 3.0 Synthetical A/B-Tests [5] Multiple (25,856) - 2 / 1 (R) Group. Overall result only ✗ timestamp Synthetic N/A N/A N/A Kaggle notebook Host: Kaggle DOI: Unknown Licence: CDLA- Sharing-1.0
a two-sample statistical test, including offline experiments and experiments without a randomized control. For brevity, we will refrain from discussing the full model assumptions as well as their applicability. Instead, we point readers to the relevant work in the literature.
4.1 Effect size and Welch’s -test
We consider a two-sample setting and let and be i.i.d. samples from the distributions and respectively. We assume the first two moments exist for the distributions and , with their mean and variance denoted and respectively. We also denote the sample mean and variance of the two samples and respectively.
Often we are interested in the difference between the mean of the two distributions , commonly known as the effect size (of the difference in mean) or the average treatment effect. A standardized effect size enables us to compare the difference across many experiments and is thus useful in meta-analyses. One commonly used effect size is Cohen’s , defined as the difference in sample means divided by the pooled sample standard deviation [18]:
| (1) |
We are also interested in whether the samples carry sufficient evidence to indicate is different from a prescribed value . This can be done via a hypothesis test with and .444There are other ways to specify the hypotheses such as that in superiority and non-inferiority tests [19], though they are unlikely to change the data requirement as long as it remains anchored on . One of the most common statistical test used in online controlled experiments is the Welch’s -test [82], in which we calculate the test statistic as follow:
| (2) |
We observe that in order to calculate the two stated quantities above, we require six quantities: two means (, ), two (sample) variances (, ), and two counts (, ). We call these quantities Dimension Zero (D0) quantities as they are the bare minimum required to run a statistical test—these quantities will be expanded along the taxonomy dimensions defined in Section 2.
Cluster randomization / dependent data The sample variance estimates (, ) may be biased in the case where cluster randomization is involved. Using again the “free delivery” banner example, instead of randomly assigning each individual user to the control and treatment groups, the business may randomly assign postcodes to the two groups, with all users from the same postcode getting the same version of the website. In this case, user responses may become correlated, which violates the independence assumptions in statistical tests. Common workarounds including the use of bootstrap [7] and the Delta method [24] generally require access to sub-randomization unit responses.
4.2 Experiments with adaptive stopping
As discussed in Section 1, experiments with adaptive stopping are getting increasingly popular among the OCE community. Here we motivate the data requirement for statistical tests in this domain by looking at the quantities required to calculate the test statistics for a Mixture Sequential Probability Ratio Test (mSPRT) [45] and a Bayesian hypothesis test using Bayes factor [23], two popular approaches in online experimentation. There are many other tests that support adaptive stopping [59, 79], though the data requirements, in terms of the dimensions defined in Section 2, should be largely identical.
We first observe running a mSPRT with a normal mixing distribution involves calculating the following test statistic upon observing the first and (see Eq. (11) in [45]):
| (3) |
where and represent the sample mean of the s and s up to sample respectively, and is a hyperparameter to be specified or learned from data.
For Bayesian hypothesis tests using Bayes factor, we calculate the (square root of) Wald test statistic upon seeing the first and first [22, 23]:
| (4) |
where and are the effect size (standardized by the pooled variance) and the effective sample size of the test respectively. In OCE it is common to appeal to the central limit theorem and assume a normal likelihood for the effect size, i.e. . We then compare the hypotheses and by calculating the Bayes factor [46]:
| (5) |
where is the PDF of a normal distribution with mean and variance , and is a hyperparameter that we specify or learn from data.
During an experiment with adaptive stopping, we calculate the test statistics stated above many times for different and . This means a dataset can only support the running of such experiments if it contains intermediate checkpoints for the counts (, ) and the means (, ), ideally cumulative from the start of the experiment. Often one also requires the variances at the same time points (see below). The only exception to the dimensional requirement above is the case where the dataset contains responses at a randomization unit or finer level of granularity, and despite recording the overall results only, has a timestamp per randomization unit. Under this special case, we will still be able to construct the cumulative means (, ) for all relevant values of and by ordering the randomization units by their associated timestamps.
Learning the effect size distribution (hyper)parameters The two tests introduced above feature some hyperparameters ( and ) that have to be specified or learned from data. These parameters characterize the prior belief of the effect size distribution, which will be the most effective if it “matches the distribution of true effects across the experiments a user runs” [45]. Common parameter estimation procedures [1, 6, 39] require results from multiple related experiments.
Estimating the response variance In the equations above, the response variance of the two samples and are assumed to be known. In practice we often use the plug-in empirical estimates and —the sample variances for the first and first respectively, and thus the data dimensional requirement is identical to that of the counts and means as discussed above. In the case where the plug-in estimate may be biased due to dependent data, we will also require a sub-randomization unit response granularity (see Section 4.1).
4.3 Non-parametric tests
We also briefly discuss the data requirements for non-parametric tests, where we do not impose any distributional assumptions on the responses but compare the hypotheses and , where we recall and are the distributions of the two samples.
One of the most commonly used (frequentist) non-parametric tests in OCE, the Mann-Whitney -test [55], calculates the following test statistic:
| (9) |
While a rank-based method is available for large and , both methods require the knowledge of all the and . Such requirement is the same for other non-parametric tests, e.g. the Wilcoxon signed-rank [83], Kruskal-Wallis [51], and Kolmogorov–Smirnov tests [26]. This suggests a dataset can only support a non-parametric test if it at least provides responses at a randomization unit level.
We conclude by showing how we can combine the individual data requirements above to obtain the requirement to design and/or run experiments for more complicated statistical tests. This is possible due to the orthogonal design of the taxonomy dimensions. Consider an experiment with adaptive stopping using Bayesian non-parametric tests (e.g. with a Pólya Tree prior [17, 42]). It involves a non-parametric test and hence requires responses at a randomization unit level. It computes multiple Bayes factors for adaptive stopping and hence requires intermediate checkpoints for the responses (or a timestamp for each randomization unit). Finally, to learn the hyperparameters of the Pólya Tree prior it requires multiple related experiments. The substantial data requirement along 3+ dimensions perhaps explains the lack of relevant OCE datasets and the tendency for experimenters to use simpler statistical tests for the day-to-day design and/or running of OCEs.
5 A Novel Dataset for Experiments with Adaptive Stopping
We finally introduce the ASOS Digital Experiments Dataset, which we believe is the first public dataset that supports the end-to-end design and running of OCEs with adaptive stopping. We motivate why this is the case, provide a light description of the dataset (and a link to the more detailed accompanying datasheet),55footnotemark: 5 and showcase the capabilities of the dataset via a series of experiments. We also discuss the ethical implications of releasing this dataset.
Recall from Section 4.2 that in order to support the end-to-end design and running of experiments with adaptive stopping, we require a dataset that (1) includes multiple related experiments; (2) is real, so that any parameters learned are reflective of the real-world scenario; and either (3a) contains intermediate checkpoints for the summary statistics during each experiment (i.e. time-granular), or (3b) contains responses at a randomization unit granularity with a timestamp for each randomization unit (i.e. response-granular with timestamps).
None of the datasets surveyed in Section 3 meet all three criteria. While the Upworthy [56], ASSISTments [71], and MeuTutor [75] datasets meet the first two criteria, they all fail to meet the third.555All three report the overall results only and hence are not time-granular. The Upworthy dataset reports group-level statistics and hence is not response-granular. The ASSISTments and MeuTutor datasets are response-granular but they lack the timestamp to order the samples. The Udacity Free Trial Screener Experiment dataset meets the last two criteria by having results from a real experiment with daily snapshots of the decision metrics (and hence time-granular), which supports the running of an experiment with adaptive stopping. However, the dataset only contains a single experiment, which is not helpful for learning the effect size distribution (the design).
The ASOS Digital Experiments Dataset contains results from OCEs run by a business unit within ASOS.com, a global online fashion retail platform. In terms of the taxonomy defined in Section 2, the dataset contains multiple (78), real experiments, with two to five variants in each experiment and four decision metrics based on binary, count, and real-valued responses. The results are aggregated on a group level, with daily or 12-hourly checkpoints of the metric values cumulative from the start of the experiment. The dataset design meets all the three criteria stated above and hence differentiates itself from other public datasets.
We provide readers with an accompanying datasheet (based on [34]) that provides further information about the dataset. We also host the dataset on Open Science Framework to ensure it is easily discoverable and can be preserved long-term.11footnotemark: 1 It is worth noting that the dataset is released with the intent to support development in the statistical methods required to run OCEs. The experiment results shown in the dataset are not representative of ASOS.com’s overall business operations, product development, or experimentation program operations, and no conclusion of such should be drawn from this dataset.
5.1 Potential use cases
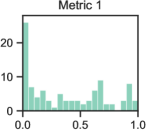
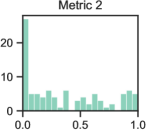
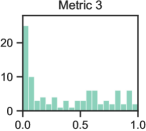
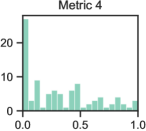
Meta-analyses The multi-experiment nature of the dataset enables one to perform meta-analyses. A simple example is to characterize the distribution of -values (under a Welch’s -test) across all experiments (see Figure 1). We observe there are roughly a quarter of experiments in this dataset attaining , and attribute this to the fact that what we experiment in OCEs are often guided by what domain experts think may have an impact. Having that said, we invite external validation on whether there is evidence for data dredging using e.g. [58].
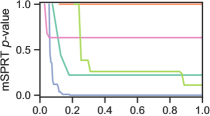
Design and running of experiments with adaptive stopping We then demonstrate the dataset can indeed support OCEs with adaptive stopping by performing a mixed Sequential Probability Ratio test (mSPRT) and a Bayesian hypothesis test via Bayes factor for each experiment and metric. This requires learning the hyperparameters and . We learn, for each metric, a naïve estimate for by collating the (see (4)) at the end of each experiment and taking their sample variance. This yields the estimates 1.30e-05, 1.07e-05, 6.49e-06, and 5.93e-06 for the four metrics respectively. For , we learn near-identical naïve estimates by collating the value of Cohen’s (see (1)) instead. However, as captures the spread of unstandardized effect sizes, we specify in each test , where is the sample variance of all responses up to the observation in that particular experiment. The Bayesian tests also require a prior belief in the null hypothesis being true ()—we set it to based on what we observed in the -tests above.
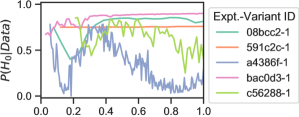
We then calculate the -value in mSPRT and the posterior belief in the null hypothesis () in the Bayesian test for each experiment and metric at each daily/12-hourly checkpoint, following the procedures stated in [45] and [23, 46] respectively. We plot the results for five experiments selected at random in Figure 2, which shows the -value for a mSPRT is monotonically non-increasing, while the posterior belief for a Bayesian test can fluctuate depending on the effect size observed so far.
A quasi-benchmark for adaptive stopping methods Real online controlled experiments, unlike machine learning tasks, generally do not have a notion of ground truth. The use of quasi-ground truth enables the comparison between two hyperparameter settings of the same adaptive stopping method or two adaptive stopping methods. Using as quasi-ground truth the significant / not significant verdict from a Welch’s -test at the end of the experiment as the “ground truth”, we could then compare this “ground truth” to the significant / not significant verdict of a mSPRT at different stages of individual experiments. This yields many “confusion matrices” over different stages of individual experiments where a “Type I error” corresponds to cases where a Welch’s t-test gives a not significant result and a mSRPT reports a significant result, a confusion matrix for the end of each experiment can be seen in Table 2. As the dataset was collected without early stopping it allows us to perform sensitivity analysis and optimization on the hyperparameters of mSPRT under what can be construed as a “precision-recall” tradeoff of statistically significant treatments.
Other use cases The time series nature of this dataset enables one to detect bias (of the estimator) across time, e.g. those that are caused by concept drift or feedback loops. In the context of OCEs, [15] described a number of methods to detect invalid experiments over time that may be run on this dataset. Moreover, being both a multi-experiment and time series dataset also enables one to learn the correlation structure across experiments, decision metrics, and time [66, 81].
5.2 Ethical considerations
We finally discuss the ethical implications of releasing the dataset, touching on data protection and anonymization, potential misuses, and the ethical considerations for running OCEs in general.
| -test | Significant | Not significant | ||
|---|---|---|---|---|
| mSPRT | Significant | Not significant | Significant | Not significant |
| Metric 1 | 19 | 7 | 2 | 71 |
| Metric 2 | 20 | 7 | 18 | 49 |
| Metric 3 | 16 | 9 | 6 | 63 |
| Metric 4 | 16 | 11 | 4 | 63 |
Data protection and anonymization The dataset records aggregated activities of hundreds of thousands or millions of website users for business measurement purposes and hence it is impossible to identify a particular user. Moreover, to minimize the risk of disclosing business sensitive information, all experiment context is either removed or anonymized such that one should not be able to tell who is in an experiment, when is it run, what treatment does it involve, and what decision metrics are used. We refer readers to the accompanying datasheet55footnotemark: 5 for further details in this area.
Potential misuses An OCE dataset, no matter how anonymized it is, reflects the behavior of its participants under a certain application domain and time. We urge potential users of this dataset to exercise caution when attempting to generalize the learnings. It is important to emphasize that the learnings are different from the statistical methods and processes that are demonstrated on this dataset. We believe the latter are generalizable, i.e. they can be applied on other datasets with similar data dimensions regardless of the datasets’ application domain, target demographics, and temporal coverage, and appeal for potential users of the dataset to focus on such.
One example of generalizing the learnings is the use of this dataset as a full performance benchmark. As discussed above, this dataset does not have a notion of ground truth and any quasi-ground truths constructed are themselves a source of bias to estimators. Thus, experiment design comparisons need to be considered at a theoretical level [52]. Another example will be directly applying the value of hyperparameter(s) obtained while training a model on this dataset to another dataset. While this may work for similar application domains, the less similar they are the less likely the hyperparameters learned will transfer. This may introduce risk in incurring bias both on the estimator and in fairness.
Running OCEs in general The dataset is released with the aim to support experiments with adaptive stopping, which will enable a faster experimentation cycle. As we run more OCEs, which are ultimately human subjects research, the ethical concerns will naturally mount. We reiterate the importance of the following three principles when we design and run experiments [63, 64]: respect for persons, beneficence (properly assess and balance the risks and benefits), and justice (ensure participants are not exploited), and refer readers to Chapter 9 of [50] and its references for further discussions in this area.
6 Conclusion
Online controlled experiments (OCE) are a powerful tool for online organizations to assess their digital products’ and services’ impact. To safeguard future methodological development in the area, it is vital to have access to and have a systematic understanding of relevant datasets arising from real experiments. We described the result of the first ever survey on publicly available OCE datasets, and provided a dimensional taxonomy that links the data collection and statistical test requirements. We also released the first ever dataset that can support OCEs with adaptive stopping, which design is grounded on a theoretical discussion between the taxonomy and statistical tests. Via extensive experiments, we also showed that the dataset is capable of addressing the identified gap in the literature.
Our work on surveying, categorizing, and enriching the publicly available OCE datasets is just the beginning and we invite the community to join in the effort. As discussed above we have yet to see a dataset that can support methods dealing with correlated data due to cluster randomization, or the end-to-end design and running of experiments with adaptive stopping using Bayesian non-parametric tests. We also see ample opportunity to generalize the survey to cover datasets arising from uplift modeling tasks, quasi-experiments, and observational studies. Finally, we can further expand the taxonomy, which already supports datasets from all experiments, with extra dimensions (e.g. number of features to support stratification, control variate, and uplift modeling methods) as the area matures.
Acknowledgments and Disclosure of Funding
CHBL is part-funded by the EPSRC CDT in Modern Statistics and Statistical Machine Learning at Imperial College London and University of Oxford (StatML.IO) and ASOS.com. The authors thank their colleagues, participants in CODE@MIT 2021, and the anonymous reviewers for suggesting many improvements to the original manuscript.
References
- Adams [2018] Christopher P. Adams. Empirical Bayesian estimation of treatment effects. SSRN Electronic Journal, 2018. doi: 10.2139/ssrn.3157819. URL https://doi.org/10.2139/ssrn.3157819.
- Alreemi [2019] Sadiq Alreemi. Analyze AB test results, 2019. URL https://github.com/SadiqAlreemi/Analyze-AB-Test-Results. Code repository.
- Auer and Felderer [2018] Florian Auer and Michael Felderer. Current state of research on continuous experimentation: A systematic mapping study. In 2018 44th Euromicro Conference on Software Engineering and Advanced Applications (SEAA), pages 335–344, 2018. doi: 10.1109/SEAA.2018.00062.
- Auer et al. [2021] Florian Auer, Rasmus Ros, Lukas Kaltenbrunner, Per Runeson, and Michael Felderer. Controlled experimentation in continuous experimentation: Knowledge and challenges. Information and Software Technology, 134:106551, 2021. ISSN 0950-5849. doi: https://doi.org/10.1016/j.infsof.2021.106551. URL https://www.sciencedirect.com/science/article/pii/S0950584921000367.
- Ay [2020] Yamaç Eren Ay. Synthetical A/B-tests, Version 1 [Dataset], 2020. URL https://www.kaggle.com/yamaerenay/synthetical-abtests/version/1.
- Azevedo et al. [2019] Eduardo M. Azevedo, Alex Deng, José L. Montiel Olea, and E. Glen Weyl. Empirical Bayes estimation of treatment effects with many A/B tests: An overview. AEA Papers and Proceedings, 109:43–47, May 2019. doi: 10.1257/pandp.20191003. URL https://www.aeaweb.org/articles?id=10.1257/pandp.20191003.
- Bakshy and Eckles [2013] Eytan Bakshy and Dean Eckles. Uncertainty in online experiments with dependent data: An evaluation of bootstrap methods. In Proceedings of the 19th ACM SIGKDD International Conference on Knowledge Discovery and Data Mining, KDD ’13, page 1303–1311, New York, NY, USA, 2013. Association for Computing Machinery. ISBN 9781450321747. doi: 10.1145/2487575.2488218. URL https://doi.org/10.1145/2487575.2488218.
- Benjamini and Hochberg [1995] Yoav Benjamini and Yosef Hochberg. Controlling the false discovery rate: A practical and powerful approach to multiple testing. Journal of the Royal Statistical Society: Series B (Methodological), 57(1):289–300, January 1995. doi: 10.1111/j.2517-6161.1995.tb02031.x. URL https://doi.org/10.1111/j.2517-6161.1995.tb02031.x.
- Bernardi et al. [2019] Lucas Bernardi, Themistoklis Mavridis, and Pablo Estevez. 150 successful machine learning models: 6 lessons learned at Booking.com. In Proceedings of the 25th ACM SIGKDD International Conference on Knowledge Discovery & Data Mining, KDD ’19, page 1743–1751, New York, NY, USA, 2019. Association for Computing Machinery. ISBN 9781450362016. doi: 10.1145/3292500.3330744. URL https://doi.org/10.1145/3292500.3330744.
- [10] Rasmus Bååth and Bret Romero. Mobile games A/B testing with Cookie Cats [MOOC]. URL https://www.datacamp.com/projects/184.
- Browne and Swarbrick Jones [2017] Will Browne and Mike Swarbrick Jones. What works in e-commerce - a meta-analysis of 6700 online experiments. http://www.qubit.com/wp-content/uploads/2017/12/qubit-research-meta-analysis.pdf, 2017. URL http://www.qubit.com/wp-content/uploads/2017/12/qubit-research-meta-analysis.pdf. White paper.
- [12] David Campos, Chester Ismay, and Shon Inouye. A/B testing in R | DataCamp [MOOC]. URL https://www.datacamp.com/courses/ab-testing-in-r.
- Campos et al. [n.d.a] David Campos, Chester Ismay, and Shon Inouye. Experiment dataset [Dataset], n.d.a. URL https://assets.datacamp.com/production/repositories/2292/datasets/52b52cb1ca28ce10f9a09689325c4d94d889a6da/experiment_data.csv.
- Campos et al. [n.d.b] David Campos, Chester Ismay, and Shon Inouye. Data visualization website - April 2018 [Dataset], n.d.b. URL https://assets.datacamp.com/production/repositories/2292/datasets/b502094e5de478105cccea959d4f915a7c0afe35/data_viz_website_2018_04.csv.
- Chen et al. [2019] Nanyu Chen, Min Liu, and Ya Xu. How A/B tests could go wrong: Automatic diagnosis of invalid online experiments. In Proceedings of the Twelfth ACM International Conference on Web Search and Data Mining, WSDM ’19, page 501–509, New York, NY, USA, 2019. Association for Computing Machinery. ISBN 9781450359405. doi: 10.1145/3289600.3291000. URL https://doi.org/10.1145/3289600.3291000.
- Chen [2020] Sisi Chen. A/B tests project — Udacity DAND P2, 2020. URL https://rachelchen0104.medium.com/a-b-tests-project-udacity-dand-p2-55faddd4d5e0. Blog post.
- Chen and Hanson [2014] Yuhui Chen and Timothy E. Hanson. Bayesian nonparametric k-sample tests for censored and uncensored data. Computational Statistics & Data Analysis, 71:335–346, 2014. ISSN 0167-9473. doi: https://doi.org/10.1016/j.csda.2012.11.003. URL https://www.sciencedirect.com/science/article/pii/S0167947312003945.
- Cohen [1988] Jacob Cohen. Statistical Power Analysis for the Behavioral Sciences. Taylor & Francis, 1988. ISBN 9781134742707.
- Committee for Proprietary Medicinal Products [2001] Committee for Proprietary Medicinal Products. Points to consider on switching between superiority and non-inferiority. British Journal of Clinical Pharmacology, 52(3):223–228, Sep 2001. ISSN 0306-5251. doi: 10.1046/j.0306-5251.2001.01397-3.x. URL https://pubmed.ncbi.nlm.nih.gov/11560553.
- Dawoud [2021] Ahmed Dawoud. E-commerce A/B testing, Version 1 [Dataset], 2021. URL https://www.kaggle.com/ahmedmohameddawoud/ecommerce-ab-testing/version/1.
- Dehejia and Wahba [1999] Rajeev H. Dehejia and Sadek Wahba. Causal effects in nonexperimental studies: Reevaluating the evaluation of training programs. Journal of the American Statistical Association, 94(448):1053–1062, 1999. ISSN 01621459. URL http://www.jstor.org/stable/2669919.
- Deng [2015] Alex Deng. Objective Bayesian two sample hypothesis testing for online controlled experiments. In Proceedings of the 24th International Conference on World Wide Web, WWW ’15 Companion, page 923–928, New York, NY, USA, 2015. Association for Computing Machinery. ISBN 9781450334730. doi: 10.1145/2740908.2742563. URL https://doi.org/10.1145/2740908.2742563.
- Deng et al. [2016] Alex Deng, Jiannan Lu, and Shouyuan Chen. Continuous monitoring of A/B tests without pain: Optional stopping in Bayesian testing. In 2016 IEEE International Conference on Data Science and Advanced Analytics (DSAA), pages 243–252, 2016. doi: 10.1109/DSAA.2016.33.
- Deng et al. [2018] Alex Deng, Ulf Knoblich, and Jiannan Lu. Applying the delta method in metric analytics: A practical guide with novel ideas. In Proceedings of the 24th ACM SIGKDD International Conference on Knowledge Discovery & Data Mining, KDD ’18, page 233–242, New York, NY, USA, 2018. Association for Computing Machinery. ISBN 9781450355520. doi: 10.1145/3219819.3219919. URL https://doi.org/10.1145/3219819.3219919.
- Diemert et al. [2018] Eustache Diemert, Artem Betlei, Christophe Renaudin, and Amini Massih-Reza. A large scale benchmark for uplift modeling, 2018. URL http://ama.imag.fr/~amini/Publis/large-scale-benchmark.pdf. 2018 AdKDD & TargetAd Workshop (in conjunction with KDD ’18).
- Dodge [2008] Yadolah Dodge. Kolmogorov–Smirnov Test. In The Concise Encyclopedia of Statistics, pages 283–287. Springer New York, New York, NY, 2008. ISBN 978-0-387-32833-1. doi: 10.1007/978-0-387-32833-1_214. URL https://doi.org/10.1007/978-0-387-32833-1_214.
- Doyle et al. [2018] Joseph Doyle, Sarah Abraham, Laura Feeney, Sarah Reimer, and Amy Finkelstein. Clinical decision support for high-cost imaging: a randomized clinical trial [Dataset], 2018. URL https://doi.org/10.7910/DVN/BRKDVQ.
- Dua and Graff [2019] Dheeru Dua and Casey Graff. UCI machine learning repository, 2019. URL http://archive.ics.uci.edu/ml.
- Dupas et al. [2016] Pascaline Dupas, Vivian Hoffman, Michael Kremer, and Alix Peterson Zwane. Targeting health subsidies through a non-price mechanism: A randomized controlled trial in Kenya, 2016. URL https://doi.org/10.7910/DVN/PBLJXJ.
- Dwivedi [2020] Arpit Dwivedi. Cookie Cats, Version 1 [Dataset], 2020. URL https://www.kaggle.com/arpitdw/cokie-cats/version/1.
- Emmanuel [2020] Osuolale Emmanuel. Ad A/B testing, Version 1 [Dataset], 2020. URL https://www.kaggle.com/osuolaleemmanuel/ad-ab-testing/version/1.
- Fabijan et al. [2018] Aleksander Fabijan, Pavel Dmitriev, Helena Holmstrom Olsson, and Jan Bosch. Online controlled experimentation at scale: An empirical survey on the current state of A/B testing. In 2018 44th Euromicro Conference on Software Engineering and Advanced Applications (SEAA), pages 68–72, 2018. doi: 10.1109/SEAA.2018.00021.
- Fisher [1922] Ronald A. Fisher. On the mathematical foundations of theoretical statistics. Philosophical Transactions of the Royal Society of London. Series A, Containing Papers of a Mathematical or Physical Character, 222(594-604):309–368, January 1922. doi: 10.1098/rsta.1922.0009. URL https://doi.org/10.1098/rsta.1922.0009.
- Gebru et al. [2020] Timnit Gebru, Jamie Morgenstern, Briana Vecchione, Jennifer Wortman Vaughan, Hanna Wallach, Hal Daumé III, and Kate Crawford. Datasheets for datasets, 2020. arXiv:1803.09010 [cs.DB].
- Greenland et al. [2016] Sander Greenland, Stephen J. Senn, Kenneth J. Rothman, John B. Carlin, Charles Poole, Steven N. Goodman, and Douglas G. Altman. Statistical tests, values, confidence intervals, and power: a guide to misinterpretations. European Journal of Epidemiology, 31(4):337–350, April 2016. doi: 10.1007/s10654-016-0149-3. URL https://doi.org/10.1007/s10654-016-0149-3.
- [36] Carrie Grimes, Caroline Buckey, and Diane Tang. A/B testing | Udacity free courses [MOOC]. URL https://www.udacity.com/course/ab-testing--ud257.
- [37] Ryan Grossman. Customer analytics and A/B testing in Python | DataCamp [MOOC]. URL https://www.datacamp.com/courses/customer-analytics-and-ab-testing-in-python.
- Grossman [n.d.] Ryan Grossman. AB testing results [Dataset], n.d. URL https://assets.datacamp.com/production/repositories/1646/datasets/2751adce60684a03d8b4132adeadab8a0b95ee56/AB_testing_exercise.csv.
- Guo et al. [2020] F. Richard Guo, James McQueen, and Thomas S. Richardson. Empirical Bayes for large-scale randomized experiments: a spectral approach, 2020. arXiv:2002.02564 [stat.ME].
- Hillstrom [2008] Kevin Hillstrom. The MineThatData e-mail analytics and data mining challenge, 2008.
- Hohnhold et al. [2015] Henning Hohnhold, Deirdre O’Brien, and Diane Tang. Focusing on the long-term: It’s good for users and business. In Proceedings of the 21th ACM SIGKDD International Conference on Knowledge Discovery and Data Mining, KDD ’15, pages 1849–1858, New York, NY, USA, 2015. ACM. ISBN 978-1-4503-3664-2.
- Holmes et al. [2015] Chris C. Holmes, François Caron, Jim E. Griffin, and David A. Stephens. Two-sample Bayesian nonparametric hypothesis testing. Bayesian Analysis, 10(2):297–320, 2015. doi: 10.1214/14-BA914. URL https://doi.org/10.1214/14-BA914.
- Hopewell et al. [2010] Sally Hopewell, Susan Dutton, Ly-Mee Yu, An-Wen Chan, and Douglas G Altman. The quality of reports of randomised trials in 2000 and 2006: comparative study of articles indexed in PubMed. BMJ, 340:c723, 2010. doi: 10.1136/bmj.c723. URL https://www.bmj.com/content/340/bmj.c723.
- Jiang et al. [2019] Shan Jiang, John Martin, and Christo Wilson. Who’s the guinea pig? investigating online A/B/n tests in-the-wild. In Proceedings of the Conference on Fairness, Accountability, and Transparency, FAT* ’19, page 201–210, New York, NY, USA, 2019. Association for Computing Machinery. ISBN 9781450361255. doi: 10.1145/3287560.3287565. URL https://doi.org/10.1145/3287560.3287565.
- Johari et al. [2017] Ramesh Johari, Pete Koomen, Leonid Pekelis, and David Walsh. Peeking at A/B tests: Why it matters, and what to do about it. In Proceedings of the 23rd ACM SIGKDD International Conference on Knowledge Discovery and Data Mining, KDD ’17, page 1517–1525, New York, NY, USA, 2017. Association for Computing Machinery. ISBN 9781450348874. doi: 10.1145/3097983.3097992. URL https://doi.org/10.1145/3097983.3097992.
- Kass and Raftery [1995] Robert E. Kass and Adrian E. Raftery. Bayes factors. Journal of the American Statistical Association, 90(430):773–795, 1995. ISSN 01621459. URL http://www.jstor.org/stable/2291091.
- Kerr [1998] Norbert L. Kerr. HARKing: Hypothesizing after the results are known. Personality and Social Psychology Review, 2(3):196–217, August 1998. doi: 10.1207/s15327957pspr0203_4. URL https://doi.org/10.1207/s15327957pspr0203_4.
- Klimonova [2020] Tetiana Klimonova. Grocery website data for AB test [Dataset], 2020. URL https://www.kaggle.com/tklimonova/grocery-website-data-for-ab-test/version/1.
- Kohavi et al. [2013] Ron Kohavi, Alex Deng, Brian Frasca, Toby Walker, Ya Xu, and Nils Pohlmann. Online Controlled Experiments at Large Scale. In Proceedings of the 19th ACM SIGKDD International Conference on Knowledge Discovery and Data Mining, KDD ’13, pages 1168–1176, New York, NY, USA, 2013. ACM. ISBN 978-1-4503-2174-7.
- Kohavi et al. [2020] Ron Kohavi, Diane Tang, and Ya Xu. Trustworthy Online Controlled Experiments: A Practical Guide to A/B Testing. Cambridge University Press, 1st Edition edition, 2020. ISBN 9781108724265.
- Kruskal and Wallis [1952] William H. Kruskal and W. Allen Wallis. Use of ranks in one-criterion variance analysis. Journal of the American Statistical Association, 47(260):583–621, 1952. doi: 10.1080/01621459.1952.10483441. URL https://www.tandfonline.com/doi/abs/10.1080/01621459.1952.10483441.
- Liu and McCoy [2020] C. H. Bryan Liu and Emma J. McCoy. An evaluation framework for personalization strategy experiment designs, 2020. arXiv:2007.11638 [stat.ME]. Presented in AdKDD 2020 Workshop (In conjunction with KDD’20).
- Liu et al. [2020] C. H. Bryan Liu, Benjamin Paul Chamberlain, and Emma J. McCoy. What is the value of experimentation and measurement?: Quantifying the value and risk of reducing uncertainty to make better decisions. Data Science and Engineering, 5:152–167, 2020. ISSN 23641541. doi: 10.1007/s41019-020-00121-5. URL https://doi.org/10.1007/s41019-020-00121-5.
- Malesova [2020] Jana Malesova. Analyze A/B test results, 2020. URL https://janamalesova.github.io/Udacity-Data-Analyst-Nanodegree/P2/. Code notebook.
- Mann and Whitney [1947] H. B. Mann and D. R. Whitney. On a test of whether one of two random variables is stochastically larger than the other. The Annals of Mathematical Statistics, 18(1):50–60, March 1947. doi: 10.1214/aoms/1177730491. URL https://doi.org/10.1214/aoms/1177730491.
- Matias et al. [2021] J. Nathan Matias, Kevin Munger, Marianne Aubin Le Quere, and Charles Ebersole. The Upworthy Research Archive, a time series of 32,487 experiments in U.S. media. Scientific Data, 8(1):195, Aug 2021. ISSN 2052-4463. doi: 10.1038/s41597-021-00934-7. URL https://doi.org/10.1038/s41597-021-00934-7.
- Messerschmied [2019] Marius Messerschmied. Udacity A/B testing—final course project, Version 11, 2019. URL https://www.kaggle.com/mariusmesserschmied/udacity-a-b-testing-final-course-project?scriptVersionId=21267929. Code notebook.
- Miller and Hosanagar [2020] Alex Miller and Kartik Hosanagar. A meta-analytic investigation of p-hacking in e-commerce experimentation. Working paper, 2020. URL https://mackinstitute.wharton.upenn.edu/wp-content/uploads/2020/11/FP0398b_WP_2020Mar.pdf.
- Miller [2010] Evan Miller. How not to run an A/B test, 2010. URL https://www.evanmiller.org/how-not-to-run-an-ab-test.html. Blog post.
- Munroe [2011] Randall Munroe. xkcd: Significant, 2011. URL https://xkcd.com/882/.
- Munroe [2015] Randall Munroe. xkcd: P-values, 2015. URL https://xkcd.com/1478/.
- Nahar [2021] Purva Nahar. Udacity free trial screener model analysis, Version 1 [Dataset], 2021. URL https://www.kaggle.com/purvanahar/udacity-free-trial-screener-model-analysis/version/1.
- National Commission for the Protection of Human Subjects of Biomedical and Behavioral Research, United States [1978] National Commission for the Protection of Human Subjects of Biomedical and Behavioral Research, United States. The Belmont report: Ethical principles and guidelines for the protection of human subjects of research, volume 2. The Commission, 1978.
- Office for Human Research Protections, U.S. Department of Health and Human Services et al. [2018] Office for Human Research Protections, U.S. Department of Health and Human Services et al. Federal policy for the protection of human subjects (’Common Rule’), 2018. URL https://www.hhs.gov/ohrp/regulations-and-policy/regulations/common-rule/.
- Patience [2019] Grant Patience. Udacity data analysis nanodegree | Analyze AB test results, 2019. URL https://github.com/patiegm/Udacity_Data_Analysis_Nanodegree/tree/master/Analyze%20AB%20Test%20Results. Code repository.
- Pouget-Abadie et al. [2019] Jean Pouget-Abadie, Kevin Aydin, Warren Schudy, Kay Brodersen, and Vahab Mirrokni. Variance reduction in bipartite experiments through correlation clustering. In Advances in Neural Information Processing Systems, volume 32, 2019. URL https://proceedings.neurips.cc/paper/2019/file/bc047286b224b7bfa73d4cb02de1238d-Paper.pdf.
- Radcliffe [2007] Nicholas Radcliffe. Using control groups to target on predicted lift: Building and assessing uplift model. Direct Marketing Analytics Journal, pages 14–21, 2007.
- Raza [2020] Mohsin Raza. Analyze A/B test results, Version 1, 2020. URL https://www.kaggle.com/razamh/analyze-a-b-test-results?scriptVersionId=41223618. Code notebook.
- Ros and Runeson [2018] Rasmus Ros and Per Runeson. Continuous experimentation and A/B testing: A mapping study. In Proceedings of the 4th International Workshop on Rapid Continuous Software Engineering, RCoSE ’18, page 35–41, New York, NY, USA, 2018. Association for Computing Machinery. ISBN 9781450357456. doi: 10.1145/3194760.3194766. URL https://doi.org/10.1145/3194760.3194766.
- Rotem [2018] Tammy Rotem. AB testing with Python - Walkthrough Udacity’s course final project, Version 29, 2018. URL https://www.kaggle.com/tammyrotem/ab-tests-with-python?scriptVersionId=2109873. Code notebook.
- Selent et al. [2016] Douglas Selent, Thanaporn Patikorn, and Neil Heffernan. ASSISTments dataset from multiple randomized controlled experiments. In Proceedings of the Third (2016) ACM Conference on Learning @ Scale, L@S ’16, page 181–184, New York, NY, USA, 2016. Association for Computing Machinery. ISBN 9781450337267. doi: 10.1145/2876034.2893409. URL https://doi.org/10.1145/2876034.2893409.
- Shen [2021] Zacks Shen. Udacity AB testing by Google datasets, Version 1 [Dataset], 2021. URL https://www.kaggle.com/zacksshen/udacity-ab-testing-by-google-datasets/version/1.
- Sui [2019] Aurelia Sui. Mobile games: A/B testing, Version 1 [Dataset], 2019. URL https://www.kaggle.com/yufengsui/mobile-games-ab-testing/version/1.
- Tenório et al. [2016] Thyago Tenório, Ig Ibert Bittencourt, Seiji Isotani, Alan Pedro, and Patrícia Ospina. A gamified peer assessment model for on-line learning environments in a competitive context. Computers in Human Behavior, 64:247–263, 2016. ISSN 0747-5632. doi: https://doi.org/10.1016/j.chb.2016.06.049. URL https://www.sciencedirect.com/science/article/pii/S0747563216304770.
- Tenório et al. [2017] Thyago Tenório, Ig Ibert Bittencourt, Seiji Isotani, Alan Pedro, Patrícia Ospina, and Daniel Tenório. Dataset of two experiments of the application of gamified peer assessment model into online learning environment MeuTutor. Data in Brief, 12:433–437, 2017. ISSN 2352-3409. doi: https://doi.org/10.1016/j.dib.2017.04.032. URL https://www.sciencedirect.com/science/article/pii/S2352340917301646.
- Thomke [2020] Stefan Thomke. Experimentation Works: The Surprising Power of Business Experiments. Harvard Business Review Press, 2020. ISBN 9781633697102.
- [77] Udacity. Online data analyst course [MOOC]. URL https://www.udacity.com/course/data-analyst-nanodegree--nd002.
- Vanschoren et al. [2013] Joaquin Vanschoren, Jan N. van Rijn, Bernd Bischl, and Luis Torgo. OpenML: Networked science in machine learning. SIGKDD Explorations, 15(2):49–60, 2013. doi: 10.1145/2641190.2641198. URL http://doi.acm.org/10.1145/2641190.2641198.
- Wald [1945] Abraham Wald. Sequential tests of statistical hypotheses. The Annals of Mathematical Statistics, 16(2):117–186, June 1945. doi: 10.1214/aoms/1177731118. URL https://doi.org/10.1214/aoms/1177731118.
- Wan [2019] Ella Wan. A/B testing for an pre-enrollment intervention in Udacity, 2019. URL https://github.com/moggirain/A-B-Testing-for-Udacity. Code repository.
- Wang et al. [2020] Zenan Wang, Xuan Yin, Tianbo Li, and Liangjie Hong. Causal meta-mediation analysis: Inferring dose-response function from summary statistics of many randomized experiments. In Proceedings of the 26th ACM SIGKDD International Conference on Knowledge Discovery & Data Mining, pages 2625–2635, 2020.
- Welch [1947] Bernard Lewis Welch. The generalization of ‘Student’s’ problem when several different population variances are involved. Biometrika, 34(1-2):28–35, 1947. doi: 10.1093/biomet/34.1-2.28. URL https://doi.org/10.1093/biomet/34.1-2.28.
- Wilcoxon [1945] Frank Wilcoxon. Individual comparisons by ranking methods. Biometrics Bulletin, 1(6):80, December 1945. doi: 10.2307/3001968. URL https://doi.org/10.2307/3001968.
- Wright [2020] Kevin Wright. agridat: Agricultural Datasets, 2020. URL https://CRAN.R-project.org/package=agridat. R package version 1.17.
- Xu et al. [2015] Ya Xu, Nanyu Chen, Addrian Fernandez, Omar Sinno, and Anmol Bhasin. From infrastructure to culture: A/B testing challenges in large scale social networks. In Proceedings of the 21th ACM SIGKDD International Conference on Knowledge Discovery and Data Mining, KDD ’15, pages 2227–2236, New York, NY, USA, 2015. ACM. ISBN 978-1-4503-3664-2.
- Yarkın [2021] Mürşide Yarkın. Mobile games A/B testing - Cookie Cats, Version 1 [Dataset], 2021. URL https://www.kaggle.com/mursideyarkin/mobile-games-ab-testing-cookie-cats/version/1.
- Young [2014a] Scott W. H. Young. Improving library user experience with A/B testing: Principles and process [Dataset], 2014a. URL https://doi.org/10.15788/m2rp42.
- Young [2014b] Scott W. H. Young. Improving library user experience with A/B testing: Principles and process. Weave: Journal of Library User Experience, 1(1), August 2014b. doi: 10.3998/weave.12535642.0001.101. URL https://doi.org/10.3998/weave.12535642.0001.101.
- Yu [2017] Sheena Yu. A/B testing for Udacity free trial screener, 2017. URL https://rstudio-pubs-static.s3.amazonaws.com/294845_0216f40bdc6b49c6a7d3fa0e5e0c5470.html. Code notebook.
- Zhang et al. [2020] Jie M. Zhang, Mark Harman, Lei Ma, and Yang Liu. Machine learning testing: Survey, landscapes and horizons. IEEE Transactions on Software Engineering, Feb 2020. doi: 10.1109/TSE.2019.2962027.