ALMA Sub-arcsec-resolution 183 GHz HO and Dense Molecular Line Observations of Nearby Ultraluminous Infrared Galaxies
Abstract
We present the results of ALMA 2 mm, 1-resolution observations of ten (ultra)luminous infrared galaxies ([U]LIRGs; infrared luminosity 10L) at 0.15, targeting dense (10 cm) molecular (HCN, HCO, and HNC J=2–1) and 183 GHz HO 3–2 emission lines. Higher HCN to HCO J=2–1 flux ratios are observed in some, but not all, AGN-important ULIRGs than in starburst-classified sources. We detect 183 GHz HO emission in almost all AGN-important ULIRGs, and elevated HO emission is found in two sources with elevated HCN J=2–1 emission, relative to HCO J=2–1. Except one ULIRG (the Superantennae), the HO emission largely comes from the entire nuclear regions (1 kpc), rather than AGN-origin megamaser at the very center (1 kpc). Nuclear (1 kpc) dense molecular gas mass derived from HCO J=2–1 luminosity is a few 10M, and its depletion time is estimated to be 10 yr in all sources. Vibrationally excited J=2–1 emission lines of HCN and HNC are detected in a few (U)LIRGs, but those of HCO are not. It is suggested that in mid-infrared-radiation-exposed innermost regions around energy sources, HCO and HNC are substantially less abundant than HCN. In our ALMA 2 mm data of ten (U)LIRGs, two continuum sources are serendipitously detected within 10, which are likely to be an infrared luminous dusty galaxy at 1 and a blazar.
1 Introduction
Ultraluminous infrared galaxies (ULIRGs) with infrared (8–1000 m) luminosity L 10L and luminous infrared galaxies (LIRGs) with L 10L are characterized by strong dust thermal emission that is heated by energy sources (sam96). The infrared luminosity is typically much greater than UV-optical luminosity, suggesting that the energy sources, either starbursts and/or active galactic nuclei (AGNs), are mostly hidden behind dust. (U)LIRGs are almost exclusively observed as gas-rich galaxy mergers in the local universe at 0.3 (e.g., san88; cle96; mur96; duc97). Numerical simulations of gas-rich galaxy mergers predict that supermassive black holes (SMBHs) grow rapidly in mass through accretion and become luminous AGNs at nuclear regions (hop06). However, high concentrations of dust and gas in merging (U)LIRGs’ nuclei (e.g., dow07; sco15; sak17; ima19) preclude clear distinction of hidden energy sources, particularly if compact AGNs are deeply buried (=obscured in virtually all directions) because the AGN signatures become elusive in extensively used optical spectroscopic classification (mai03; ima06). Observing at wavelengths of small dust extinction effects is indispensable to properly understand the energetic roles of buried AGNs in merging (U)LIRGs.
Radiative energy in a starburst originates from nuclear fusion inside stars, while in an AGN, a mass-accreting SMBH produces huge radiative energy from a compact (1 pc) accretion disk. In an AGN, (1) 2 keV X-rays and (2) mid-infrared 3–35 m emission are much stronger than a starburst when normalized to intrinsic UV or bolometric luminosity (e.g., sha11), because in the vicinity of a mass-accreting SMBH, (1) UV photons from the accretion disk are upscattered to X-rays by inverse Compton process and (2) the amount of mid-infrared emitting hot (100 K) dust is much greater because of considerably higher UV radiation density than in star-forming regions. Because hard X-rays (10 keV) and infrared 3–35 m have strong penetrating power into dust and gas, spectroscopy in these wavelengths can be used as an effective tool to identify luminous buried AGN signatures, by distinguishing from starbursts, in gas/dust-rich (U)LIRGs’ nuclei. Such spectroscopy of nearby ( 0.3) (U)LIRGs has been conducted systematically and signatures of luminous buried AGNs have been revealed in many sources with no obvious optical AGN signatures, at 10 keV hard X-rays (e.g., ten15; oda17; ric17; yam21) and at infrared 3–35 m (e.g., gen98; ima06; arm07; ima07a; ima08; nar08; nar09; vei09; nar10; ima10b). The presence of theoretically hypothesized deeply buried AGNs (actively mass-accreting SMBHs) in many merging (U)LIRGs has been observationally uncovered. However, there remain many nearby (U)LIRGs that have no significant AGN signatures even in the hard X-rays and infrared. It is important to distinguish whether (1) they contain no energetically important AGNs, or (2) they do, but are elusive even in hard X-rays and infrared owing to extremely large extinction (e.g., dow07; mat09; sco17; per21). Observations at wavelengths of even lower extinction can provide useful information.
(Sub)millimeter at 0.8–3.5 mm is one such wavelengths, with 1/20 extinction effects than hard X-rays at 10 keV and infrared 20 m (hil83). Because energy generation mechanisms are different for a starburst (nuclear fusion inside stars) and an AGN (mass-accreting SMBH), their effects on the surrounding mass-dominating dense (10 cm) molecular gas at (U)LIRGs’ nuclei (gao04) can be different, possibly producing different rotational J-transition line flux ratios among dense molecular gas tracers at (sub)millimeter. (Sub)millimeter dense molecular line flux ratios (J=1–0, J=3–2, and J=4–3 of HCN and HCO) characteristic to known optically identified luminous AGNs (e.g., koh05; kri08; izu15; ima16c), are also observed in a number of (U)LIRGs that show no discernible AGN signatures in the optical, infrared, and X-rays (e.g., ima07b; ima09a; pri15; izu16; ima16c; ima18b; ima19). Considering that independent (sub)millimeter AGN signatures are observed in some of these (U)LIRGs, they can be considered as candidates of optically/infrared/X-ray-elusive, but (sub)millimeter-detectable extremely deeply buried luminous AGNs (ima18b; ima19).
ALMA is an ideal observing facility to apply this (sub)millimeter dense molecular line energy diagnostic method to nearby (U)LIRGs, owing to very high sensitivity and high spatial resolution which enables to (1) pinpoint nuclear (1 kpc) regions where the putative luminous buried AGNs are expected to be present and (2) investigate AGN effects, by minimizing the contaminations from surrounding spatially extended (a few kpc) starburst emission. However, owing to the current ALMA frequency coverage of 84 GHz (band 3–10), HCN and HCO J=1–0 lines cannot be observed for (U)LIRGs at 0.06 where many interesting nearby (U)LIRGs are found (kim98). Thus, we observed at J=3–2 and J=4–3 lines of HCN, HCO, and HNC (ima14; izu16; ima16c; ima18b; ima19). A trend of elevated HCN emission, relative to HCO, is observed in (U)LIRGs with luminous AGN signatures, compared to those without (ima14; izu16; ima16c; ima18b; ima19). An enhanced HCN abundance in AGN-affected dense molecular gas (e.g., ala15; sai18; tak19; nak18; kam20; ima20) is one possibility. However, higher rotational excitation of HCN by warm and dense molecular gas in the vicinity of a luminous AGN than in a starburst is another scenario (ima18b), because the critical density of HCN is higher by a factor of 5 than that of HCO (shi15). Addition of different J-transition line data can help distinguish the physical origin of the elevated HCN emission in luminous AGNs.
Since ALMA Cycle 5, band 5 (163–211 GHz or 1.8 mm) observations have become available for openuse programs. HCN, HCO, and HNC J=2–1 transition lines can be observed in band 5 for nearby (U)LIRGs. Because the excitation energy level is lower at J=2 than at J=3 or J=4, we can (1) discuss dense molecular line flux ratios at J=2–1 less affected by uncertainty of excitation conditions than at J=3–2 and J=4–3, and (2) J=2–1 lines of HCN, HCO, and HNC may be more reliable dense molecular gas mass tracers, by reasonably assuming that J=2–1 lines are thermalized and optically thick (i.e., same luminosity as J=1–0 in units of [K km s pc]) in (U)LIRGs’ nuclei, where warm and dense molecular gas is highly concentrated (e.g., dow07; sco15; sak17; ima19). Further, addition of J=2–1 lines of HCN, HCO, and HNC, to J=3–2 and J=4–3 lines, can be used to better constrain physical properties of dense molecular gas at (U)LIRGs’ nuclei.
In addition, the para-HO 3–2 line at rest frequency 183 GHz with an upper energy level of 205 K. (hereafter “183 GHz HO”) is present in close proximity to the HNC J=2–1 line ( 181 GHz), so they are simultaneously observable using ALMA. In warm and dense molecular gas illuminated by a luminous AGN, it is theoretically predicted that the 183 GHz HO emission line can be very bright through maser amplification (e.g., deg77; neu91; yat97; mal02) and/or elevated thermal (non-maser) emission owing to enhanced HO abundance caused by AGN’s X-ray illumination (neu94; meij12). Although sensitive observations of the 183 GHz HO lines are difficult for very nearby sources at 0 owing to the poor atmospheric transmission of Earth at 183 GHz, we can observe this line without severe Earth’s atmospheric HO absorption for (U)LIRGs at 0.02, rendering this HO line as another potentially good AGN indicator.
In this paper, we present the results of ALMA band 5 (163–211 GHz) and 4 (125–163 GHz) dense molecular (HCN, HCO, and HNC J=2–1) and 183 GHz HO line observations of ten (U)LIRGs (Table 1), for which the J=3–2 and J=4–3 line data of HCN, HCO, and HNC are available (ima13a; ima13b; ima14; ima16b; ima16c; ima17; ima18b). Results of a ULIRG, the Superantennae (IRAS 192547245) at 0.0617, where strong signatures of AGN-megamaser-origin luminous 183 GHz HO emission were found, have previously been published by ima21. In this manuscript, we report our band 4–5 (2 mm) observational results of ten (U)LIRGs and discuss general properties of their nuclear dense molecular gas. Compilation of the J=2–1, J=3–2, and J=4–3 line data of HCN, HCO, and HNC, and detailed discussion of the physical properties of dense molecular gas at (U)LIRGs’ nuclei, with the aid of non-LTE modeling (van07), will be presented in a separate paper (M. Imanishi in preparation). We adopt the cosmological parameters, H 71 km s Mpc, = 0.27, and = 0.73, throughout this paper. Unless otherwise mentioned, “HO emission” indicates “183 GHz HO 3–2 line emission”, while “molecular line flux ratio” indicates “rotational J-transition line flux ratio at the vibrational ground level (v=0)”.
2 Targets
Detailed properties of the observed ten (U)LIRGs in Table 1 are described by ima16b; ima16c; ima18b. In short, we selected nearby (U)LIRGs that (1) had different levels of AGN’s energetic contributions to the bolometric luminosity, based on optical/infrared/(sub)millimeter spectroscopic energy diagnostic methods and (2) were expected to show bright molecular emission lines, to investigate their flux ratios with small statistical uncertainty. We regard NGC 1614 and IRAS 135090442 as starburst-dominated, because there are no luminous buried AGN signatures in the infrared as well as (sub)millimeter. IRAS 060357102, IRAS 085723915, IRAS 121271412, IRAS 152503609, the Superantennae, and IRAS 205514250 are diagnosed to contain luminous obscured AGNs based on 3–35 m infrared spectroscopy (e.g., arm07; ima07a; ima08; vei09; nar09; nar10). IRAS 121120305 and IRAS 224911808 display no obvious luminous AGN signatures in the optical and infrared, but possible signatures of (sub)millimeter-detected extremely deeply buried luminous AGNs were found in IRAS 121120305 NE (north eastern primary nucleus) and IRAS 224911808 (ima18b). IRAS 121120305 SW (south western secondary nucleus) is considered starburst-dominated (ima18b). Although our sample is not statistically unbiased, nor complete, it can provide useful information on the possible variation of molecular line flux ratios, depending on different AGN’s energetic contributions.
| Object | Redshift | d | Scale | f | f | f | f | log L | Optical | IR/(sub)mm |
|---|---|---|---|---|---|---|---|---|---|---|
| [Mpc] | [kpc/] | [Jy] | [Jy] | [Jy] | [Jy] | [L] | Class | Class | ||
| (1) | (2) | (3) | (4) | (5) | (6) | (7) | (8) | (9) | (10) | (11) |
| NGC 1614 (IRAS 043150840) | 0.0160 | 68 | 0.32 | 1.38 | 7.50 | 32.12 | 34.32 | 11.7 | HII (Cp) | SB |
| IRAS 060357102 | 0.0795 | 356 | 1.5 | 0.12 | 0.57 | 5.13 | 5.65 | 12.2 | LI | AGN |
| IRAS 085723915 | 0.0580 | 256 | 1.1 | 0.32 | 1.70 | 7.43 | 4.59 | 12.1 | LI(Sy2) | AGN |
| IRAS 121120305 | 0.0730 | 326 | 1.4 | 0.12 | 0.51 | 8.50 | 9.98 | 12.3 | LI (Sy2) | AGN + SB |
| IRAS 121271412 | 0.1332 | 620 | 2.3 | 0.13 | 0.24 | 1.54 | 1.13 | 12.2 | LI (HII) | AGN |
| IRAS 135090442 | 0.1364 | 636 | 2.4 | 0.10 | 0.23 | 1.56 | 2.53 | 12.3 | HII (Cp) | SB |
| IRAS 152503609 | 0.0552 | 243 | 1.1 | 0.16 | 1.31 | 7.10 | 5.93 | 12.0 | LI (Cp) | AGN |
| Superantennae (IRAS 192547245) | 0.0617 | 273 | 1.2 | 0.22 | 1.24 | 5.48 | 5.79 | 12.1 | Sy2 | AGN |
| IRAS 205514250 | 0.0430 | 188 | 0.84 | 0.28 | 1.91 | 12.78 | 9.95 | 12.0 | LI or HII (Cp) | AGN |
| IRAS 224911808 | 0.0776 | 347 | 1.5 | 0.05 | 0.55 | 5.44 | 4.45 | 12.2 | HII | AGN |
Note. — Col.(1): Object name. Col.(2): Redshift adopted from ALMA dense molecular line data (ima16c), which are slightly different from the optically derived ones (kim98) in some cases. Col.(3): Luminosity distance (in Mpc). Col.(4): Physical scale (in kpc arcsec). Col.(5)–(8): f, f, f, and f are IRAS fluxes at 12 m, 25 m, 60 m, and 100 m, respectively, taken from kim98 or san03 or the IRAS Faint Source Catalog (FSC). Col.(9): Decimal logarithm of infrared (81000 m) luminosity in units of solar luminosity (L), calculated with D(Mpc) (13.48 + 5.16 + ) (ergs s) (sam96). Col.(10): Optical spectroscopic classification. “Sy2”, “LI”, “HII”, and “Cp” mean Seyfert 2, LINER, HII-region, and starburstAGN composite, respectively. : vei95. : kew01. : yua10. : duc97. : vei99. : mir91. : col91. Col.(10): Infrared and (sub)millimeter energy diagnostic result. “AGN” and “SB” mean AGN-important (AGN signatures significantly detected) and starburst-dominated (no AGN signature), respectively. IRAS 121120305 consists of two galaxy nuclei, AGN-important primary nucleus and starburst-dominated secondary nucleus (2).
3 Observations and Data Analysis
We conducted band 5 (163–211 GHz) and 4 (125–163 GHz) observations of nine ULIRGs and one LIRG NGC 1614 (Table 1) in our ALMA Cycle 5 programs 2017.1.00022.S and 2017.1.00023.S (PI = M. Imanishi). Data of dense molecular gas tracers, HCN J=2–1 ( = 177.261 GHz) and HCO J=2–1 ( = 178.375 GHz) lines, were obtained in one observation (called as “J21a”). Data of HNC J=2–1 ( = 181.325 GHz) and 3–2 line of para-HO at = 183.310 GHz (183 GHz HO) were obtained separately (“J21b”). Table 2 summarizes our observation details.
| Object | Line | Date | Antenna | Baseline | Integration | Calibrator | ||
|---|---|---|---|---|---|---|---|---|
| [UT] | Number | [m] | [min] | Bandpass | Flux | Phase | ||
| (1) | (2) | (3) | (4) | (5) | (6) | (7) | (8) | (9) |
| NGC 1614 | HCN/HCO J=2–1 (J21a) | 2018 September 12 | 41 | 15–1231 | 13 | J04230120 | J04230120 | J04220643 |
| HNC J=2–1/183 GHz HO (J21b) | 2018 September 12 | 41 | 15–1231 | 20 | J04230120 | J04230120 | J04220643 | |
| IRAS 060357102 | HCN/HCO J=2–1 (J21a) | 2018 August 26 | 42 | 15–782 | 6 | J05194546 | J05194546 | J06017036 |
| HNC J=2–1/183 GHz HO (J21b) | 2018 September 21 | 43 | 15–1398 | 15 | J06357516 | J06357516 | J06017036 | |
| IRAS 085723915 | HCN/HCO J=2–1 (J21a) | 2018 April 1 | 41 | 15–704 | 19 | J08542006 | J08542006 | J09163854 |
| 2018 September 19 | 41 | 15–1398 | 19 | J08542006 | J08542006 | J09163854 | ||
| HNC J=2–1/183 GHz HO (J21b) | 2018 September 19 | 41 | 15–1398 | 27 | J08542006 | J08542006 | J09163854 | |
| IRAS 121120305 | HCN/HCO J=2–1 (J21a) | 2018 April 1 | 41 | 15–704 | 11 | J12290203 | J12290203 | J12200203 |
| HNC J=2–1/183 GHz HO (J21b) | 2018 September 6 | 43 | 15–784 | 6 | J12290203 | J12290203 | J12200203 | |
| IRAS 121271412 | HCN/HCO J=2–1 (J21a) | 2017 December 15 | 45 | 15–2517 | 20 | J11271857 | J11271857 | J12151731 |
| HNC J=2–1/183 GHz HO (J21b) | 2017 December 14 | 49 | 15–3321 | 33 | J11271857 | J12151731 | J11271857 | |
| IRAS 135090442 | HCN/HCO J=2–1 (J21a) | 2017 December 14 | 46 | 15–3083 | 16 | J12560547 | J12560547 | J13590159 |
| HNC J=2–1/183 GHz HO (J21b) | 2017 December 13 | 44 | 15–3083 | 22 | J12560547 | J12560547 | J13590159 | |
| 2017 December 24 | 43 | 15–2517 | 22 | J12560547 | J12560547 | J13590159 | ||
| IRAS 152503609 | HCN/HCO J=2–1 (J21a) | 2018 August 31 | 43 | 15–784 | 14 | J15500527 | J15500527 | J16133412 |
| HNC J=2–1/183 GHz HO (J21b) | 2018 August 28 | 44 | 15–782 | 13 | J15500527 | J15500527 | J16133412 | |
| 2018 September 20 | 43 | 15–1398 | 13 | J15500527 | J15500527 | J16133412 | ||
| Superantennae | HCN/HCO J=2–1 (J21a) | 2018 September 18 | 43 | 15–1398 | 6 | J16175848 | J16175848 | J18377108 |
| HNC J=2–1/183 GHz HO (J21b) | 2018 September 18 | 43 | 15–1398 | 27 | J16175848 | J16175848 | J18377108 | |
| IRAS 205514250 | HCN/HCO J=2–1 (J21a) | 2018 August 24 | 45 | 15–500 | 48 | J20564714 | J20564714 | J21094110 |
| 2018 August 24 | 45 | 15–500 | 48 | J20564714 | J20564714 | J21094110 | ||
| HNC J=2–1/183 GHz HO (J21b) | 2018 August 31 | 45 | 15–784 | 37 | J20564714 | J20564714 | J21094110 | |
| 2018 August 31 | 45 | 15–784 | 37 | J20564714 | J20564714 | J21094110 | ||
| 2018 September 20 | 46 | 15–1398 | 37 | J20564714 | J20564714 | J21094110 | ||
| IRAS 224911808 | HCN/HCO J=2–1 (J21a) | 2018 September 20 | 46 | 15–1398 | 7 | J22582758 | J22582758 | J22361433 |
| HNC J=2–1/183 GHz HO (J21b) | 2018 September 20 | 46 | 15–1398 | 8 | J22582758 | J22582758 | J22361433 | |
Note. — Col.(1): Object name. Col.(2): Observed molecular line. Col.(3): Observation date in UT. Col.(4): Number of antennas used for observations. Col.(5): Baseline length in meters. Minimum and maximum baseline lengths are shown. Col.(6): Net on source integration time in minutes. Cols.(7), (8), and (9): Bandpass, flux, and phase calibrator for the target source, respectively.
We employed the widest 1.875 GHz mode with 1920 channels for each spectral window. For the J21a observations, we included HCN J=2–1 and HCO J=2–1 lines in two spectral windows in one sideband (LSB or USB). The vibrationally excited v=1, l=1f (v=1f) HCN (hereafter HCN-VIB) J=2–1 line at = 178.136 GHz and vibrationally excited v=1f HCO (HCO-VIB) J=2–1 line at = 179.129 GHz were also included in this sideband. Further, two spectral windows were set in another sideband to observe continuum and serendipitously detected lines. For the J21b observations, we covered the HNC J=2–1 and 183 GHz HO lines and vibrationally excited v=1f HNC (HNC-VIB) J=2–1 line at = 182.584 GHz in two spectral windows on one sideband, and used two additional spectral windows in another sideband. In band 5, the atmospheric transmission of Earth is very low at the observed frequency = 182–184.5 GHz by HO absorption centered at 183.3 GHz. Although the targeted molecular lines of our sources were confirmed to be not strongly affected by the Earth’s atmospheric absorption, the other sideband in some sources fell into the frequency of low Earth’s atmospheric transmission. These data were completely flagged by ALMA pipeline processes and not used for our analysis.
We started our analysis from pipeline-processed data by ALMA, using CASA (mcm07) 111https://casa.nrao.edu. We determined the continuum level using channels that did not contain discernible emission lines, and subtracted it using the CASA task “uvcontsub”. We then applied the CASA task “clean” (Briggs weighting; robust 0.5 and gain 0.1) to create maps of the continuum-subtracted molecular line data, by binning 20 channels for all ULIRGs (velocity resolution 35 km s). For the LIRG NGC 1614, we applied 10 channels binning (20 km s), because molecular emission lines were much narrower than those of other ULIRGs. In addition, we created cleaned continuum maps by integrating the line-free-channels’ data.
The pixel scales were set as 0025–01 pixel, which were less than one-fifth of the synthesized beam size of each data. We adopted 10% absolute flux calibration uncertainty for our band 4–5 data, based on the ALMA Cycle 5 Proposer’s Guide 222https://almascience.eso.org/documents-and-tools/cycle5/alma-proposers-guide
4 Results
Continuum emission at 2 mm is detected in all sources and is displayed in Figure 1 as contours. Table 3 summarizes detailed continuum emission properties. The achieved beam size is 1 (i.e., sub-arcsecond) for all the obtained data. According to the ALMA Cycle 5 Technical Handbook (equation 7.6) 333https://almascience.eso.org/documents-and-tools/cycle5/alma-technical-handbook, the maximum recoverable scale (MRS) is 10 at 2 mm for the minimum baseline of 15 m (Table 2), which corresponds to 8 kpc for all the ULIRGs and 3 kpc for the LIRG NGC 1614. Thus, our targeting dense molecular line emission in compact nuclei (a few kpc) should be fully recovered.
![[Uncaptioned image]](/html/2111.09338/assets/x1.png)
![[Uncaptioned image]](/html/2111.09338/assets/x2.png)
![[Uncaptioned image]](/html/2111.09338/assets/x3.png)
![[Uncaptioned image]](/html/2111.09338/assets/x4.png)
![[Uncaptioned image]](/html/2111.09338/assets/x5.png)
![[Uncaptioned image]](/html/2111.09338/assets/x6.png)
![[Uncaptioned image]](/html/2111.09338/assets/x7.png)
![[Uncaptioned image]](/html/2111.09338/assets/x8.png)
![[Uncaptioned image]](/html/2111.09338/assets/x9.png)
![[Uncaptioned image]](/html/2111.09338/assets/x10.png)
![[Uncaptioned image]](/html/2111.09338/assets/x11.png)
![[Uncaptioned image]](/html/2111.09338/assets/x12.png)
![[Uncaptioned image]](/html/2111.09338/assets/x13.png)
![[Uncaptioned image]](/html/2111.09338/assets/x14.png)
![[Uncaptioned image]](/html/2111.09338/assets/x15.png)
![[Uncaptioned image]](/html/2111.09338/assets/x16.png)
![[Uncaptioned image]](/html/2111.09338/assets/x17.png)
![[Uncaptioned image]](/html/2111.09338/assets/x18.png)
![[Uncaptioned image]](/html/2111.09338/assets/x19.png)
![[Uncaptioned image]](/html/2111.09338/assets/x20.png)
![[Uncaptioned image]](/html/2111.09338/assets/x21.png)


| Object | Frequency | Flux | Peak Coordinate | rms | Synthesized beam |
|---|---|---|---|---|---|
| [GHz] | [mJy/beam] | (RA,DEC)ICRS | [mJy/beam] | [ ] () | |
| (1) | (2) | (3) | (4) | (5) | (6) |
| NGC 1614 W | J21a (173.2–176.9, 185.4–189.1) | 0.88 (10) | (043359.98, 083445.1) | 0.088 | 0.550.37 (83) |
| J21b (177.4–181.2, 189.6–193.3) | 0.76 (8.1) | (043359.99, 083445.3) | 0.093 | 0.580.33 (79) | |
| NGC 1614 N | J21a (173.2–176.9, 185.4–189.1) | 0.96 (11) | (043400.01, 083444.6) | 0.088 | 0.550.37 (83) |
| J21b (177.4–181.2, 189.6–193.3) | 0.86 (9.3) | (043400.01, 083444.6) | 0.093 | 0.580.33 (79) | |
| NGC 1614 S | J21a (173.2–176.9, 185.4–189.1) | 0.80 (9.1) | (043400.03, 083445.7) | 0.088 | 0.550.37 (83) |
| J21b (177.4–181.2, 189.6–193.3) | 0.73 (7.8) | (043400.03, 083445.7) | 0.093 | 0.580.33 (79) | |
| NGC 1614 E | J21a (173.2–176.9, 185.4–189.1) | 0.75 (8.5) | (043400.07, 083445.2) | 0.088 | 0.550.37 (83) |
| J21b (177.4–181.2, 189.6–193.3) | 0.73 (7.9) | (043400.07, 083445.2) | 0.093 | 0.580.33 (79) | |
| IRAS 060357102 | J21a (163.1–166.7, 175.0–178.7) | 1.0 (9.8) | (060253.94, 710310.2) | 0.10 | 1.10.80 (50) |
| J21b (166.9–170.7, 178.9–182.6) | 0.83 (13) | (060253.94, 710310.2) | 0.064 | 0.480.34 (6) | |
| IRAS 085723915 | J21a (166.2–169.9) | 1.4 (18) | (090025.37, 390354.1) | 0.080 | 0.710.35 (1) |
| J21b (170.3–174.1) | 1.6 (22) | (090025.37, 390354.1) | 0.073 | 0.680.33 (14) | |
| IRAS 121120305 NE | J21a (163.9–167.5, 175.7–179.4) | 3.4 (33) | (121346.06, 024841.5) | 0.10 | 0.870.68 (29) |
| J21b (167.9–171.5) | 3.6 (18) | (121346.06, 024841.4) | 0.20 | 0.830.57 (61) | |
| IRAS 121120305 SW | J21a (163.9–167.5, 175.7–179.4) | 0.39 (3.9) | (121345.95, 024839.1) | 0.10 | 0.870.68 (29) |
| J21b (167.9–171.7) | 0.39 (1.9) | (121345.93, 024839.0) | 0.20 | 0.830.57 (61) | |
| IRAS 121271412 AABand 4 observation because the targeted molecular lines are redshifted into Band 4 (125–163 GHz). | J21a (142.9–146.4, 155.1–158.7) AABand 4 observation because the targeted molecular lines are redshifted into Band 4 (125–163 GHz). | 0.84 (34) | (121519.13, 142941.8) | 0.024 | 0.290.19 (81) |
| J21b (159.0–162.7) AABand 4 observation because the targeted molecular lines are redshifted into Band 4 (125–163 GHz). | 0.85 (42) | (121519.13, 142941.8) | 0.020 | 0.240.16 (59) | |
| IRAS 135090442 AABand 4 observation because the targeted molecular lines are redshifted into Band 4 (125–163 GHz). | J21a (142.5–146.0, 154.7–158.2) AABand 4 observation because the targeted molecular lines are redshifted into Band 4 (125–163 GHz). | 0.27 (10) | (135331.57, 042804.8) | 0.027 | 0.270.19 (68) |
| J21b (158.5–162.2) AABand 4 observation because the targeted molecular lines are redshifted into Band 4 (125–163 GHz). | 0.21 (7.2) | (135331.57, 042804.8) | 0.029 | 0.290.18 (63) | |
| IRAS 152503609 | J21a (166.7–170.3) | 5.1 (22) | (152659.42, 355837.4) | 0.23 | 1.10.68 (22) |
| J21b (170.8–174.6) | 5.6 (47) | (152659.42, 353837.4) | 0.12 | 0.700.39 (10) | |
| Superantennae | J21a (165.6–169.3) | 3.1 (15) | (193121.45, 723921.5) | 0.21 | 0.540.36 (26) |
| J21b (169.7–173.5) | 3.4 (30) | (193121.43, 723921.5) | 0.11 | 0.490.34 (10) | |
| IRAS 205514250 | J21a (168.6–172.3) | 2.5 (43) | (205826.80, 423900.3) | 0.058 | 1.10.82 (89) |
| J21b (172.8–176.5, 185.0–188.7) | 2.3 (63) | (205826.80, 423900.3) | 0.036 | 0.610.41 (84) | |
| IRAS 224911808 | J21a (163.2–166.8, 175.0–178.6) | 2.0 (23) | (225149.35, 175224.1) | 0.088 | 0.500.33 (76) |
| J21b (167.2–171.0) | 2.2 (20) | (225149.35, 175224.1) | 0.11 | 0.410.34 (89) |
Note. — Col.(1): Object name. Col.(2): Frequency range in GHz used for continuum extraction. Frequencies of obvious emission lines were removed. When only one frequency range is shown, it means that data in another sideband were noisy owing to poor Earth’s atmospheric transmission, and were not used. Col.(3): Flux density (in mJy beam) at the emission peak. Value at the highest flux pixel (0025–01 pixel) is extracted. The detection significance relative to the root mean square (rms) noise is shown in parentheses. Col.(4): Coordinate of the continuum emission peak in ICRS. Col.(5): The rms noise level (1) (in mJy beam), derived from the standard deviation of sky signals in each continuum map. Col.(6): Synthesized beam (in arcsec arcsec) and position angle (in degrees). The position angle is 0 along the north–south direction and increases in the counterclockwise direction.
In the LIRG NGC 1614, there are four bright continuum emission peaks, denoted as NGC 1614 W, N, S, and E (Figure 1). In IRAS 121120305, continuum emission is significantly (3) detected not only in the north-eastern (NE) primary nucleus, but also in the south-western (SW) secondary nucleus (Figure 1). Continuum emission properties of these multiple positions are tabulated in Table 3. For other ULIRGs, continuum emission is clearly detected only in the primary nucleus. In the fields of IRAS 135090442 and the Superantennae, a bright continuum emitting source is serendipitously detected at 8 north and 8 south side of the primary ULIRG’s nucleus, respectively. These continuum sources are unlikely to be physically related to each ULIRG, and thus their observed properties are described in Appendix A. In short, the former and latter sources are likely to be an infrared luminous dusty galaxy at 1 and a blazar, respectively.
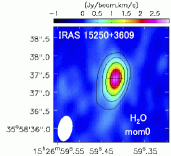
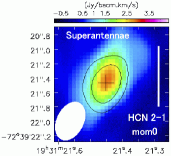
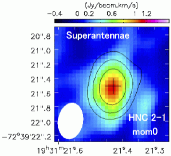
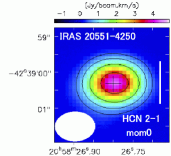
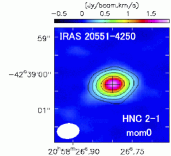
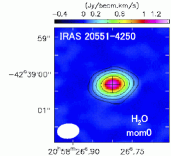
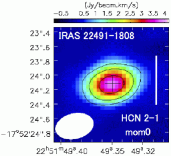
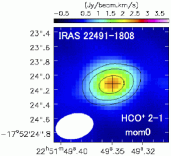
Integrated intensity (moment 0) maps of the HCN J=2–1, HCO J=2–1, HNC J=2–1 and 183 GHz HO lines are created by integrating signals in channels with significant line detection, and the peak emission flux as well as detection significance is tabulated in Table 4. Figure 1 displays the moment 0 maps of these emission lines with significant (3) detection. The peak positions of these detected molecular emission lines spatially agree with the simultaneously obtained continuum data.
| Peak [Jy beam km s] | ||||
|---|---|---|---|---|
| Object | HCN J=2–1 | HCO J=2–1 | HNC J=2–1 | 183 GHz HO |
| (1) | (2) | (3) | (4) | (5) |
| NGC 1614 W | 0.40 (6.6) AAFor NGC 1614, integrated channels are determined to cover all of the nuclear (1 kpc) emission components. Molecular emission at individual continuum peaks is narrower than the whole nuclear emission and has different peak velocity (Table 6 and Figure 2). Thus, the detection significance is apparently low, owing to increased noise originating from the integration of a large number of channels, even if narrow emission line signatures are clearly discernible in original beam spectra (Figure 2). | 0.79 (8.3) AAFor NGC 1614, integrated channels are determined to cover all of the nuclear (1 kpc) emission components. Molecular emission at individual continuum peaks is narrower than the whole nuclear emission and has different peak velocity (Table 6 and Figure 2). Thus, the detection significance is apparently low, owing to increased noise originating from the integration of a large number of channels, even if narrow emission line signatures are clearly discernible in original beam spectra (Figure 2). | 0.29 (3) AAFor NGC 1614, integrated channels are determined to cover all of the nuclear (1 kpc) emission components. Molecular emission at individual continuum peaks is narrower than the whole nuclear emission and has different peak velocity (Table 6 and Figure 2). Thus, the detection significance is apparently low, owing to increased noise originating from the integration of a large number of channels, even if narrow emission line signatures are clearly discernible in original beam spectra (Figure 2). | 0.31 (3) AAFor NGC 1614, integrated channels are determined to cover all of the nuclear (1 kpc) emission components. Molecular emission at individual continuum peaks is narrower than the whole nuclear emission and has different peak velocity (Table 6 and Figure 2). Thus, the detection significance is apparently low, owing to increased noise originating from the integration of a large number of channels, even if narrow emission line signatures are clearly discernible in original beam spectra (Figure 2). |
| NGC 1614 N | 0.49 (8.1) AAFor NGC 1614, integrated channels are determined to cover all of the nuclear (1 kpc) emission components. Molecular emission at individual continuum peaks is narrower than the whole nuclear emission and has different peak velocity (Table 6 and Figure 2). Thus, the detection significance is apparently low, owing to increased noise originating from the integration of a large number of channels, even if narrow emission line signatures are clearly discernible in original beam spectra (Figure 2). | 0.84 (8.8) AAFor NGC 1614, integrated channels are determined to cover all of the nuclear (1 kpc) emission components. Molecular emission at individual continuum peaks is narrower than the whole nuclear emission and has different peak velocity (Table 6 and Figure 2). Thus, the detection significance is apparently low, owing to increased noise originating from the integration of a large number of channels, even if narrow emission line signatures are clearly discernible in original beam spectra (Figure 2). | 0.29 (3) AAFor NGC 1614, integrated channels are determined to cover all of the nuclear (1 kpc) emission components. Molecular emission at individual continuum peaks is narrower than the whole nuclear emission and has different peak velocity (Table 6 and Figure 2). Thus, the detection significance is apparently low, owing to increased noise originating from the integration of a large number of channels, even if narrow emission line signatures are clearly discernible in original beam spectra (Figure 2). | 0.31 (3) AAFor NGC 1614, integrated channels are determined to cover all of the nuclear (1 kpc) emission components. Molecular emission at individual continuum peaks is narrower than the whole nuclear emission and has different peak velocity (Table 6 and Figure 2). Thus, the detection significance is apparently low, owing to increased noise originating from the integration of a large number of channels, even if narrow emission line signatures are clearly discernible in original beam spectra (Figure 2). |
| NGC 1614 S | 0.34 (5.5) AAFor NGC 1614, integrated channels are determined to cover all of the nuclear (1 kpc) emission components. Molecular emission at individual continuum peaks is narrower than the whole nuclear emission and has different peak velocity (Table 6 and Figure 2). Thus, the detection significance is apparently low, owing to increased noise originating from the integration of a large number of channels, even if narrow emission line signatures are clearly discernible in original beam spectra (Figure 2). | 0.56 (5.9) AAFor NGC 1614, integrated channels are determined to cover all of the nuclear (1 kpc) emission components. Molecular emission at individual continuum peaks is narrower than the whole nuclear emission and has different peak velocity (Table 6 and Figure 2). Thus, the detection significance is apparently low, owing to increased noise originating from the integration of a large number of channels, even if narrow emission line signatures are clearly discernible in original beam spectra (Figure 2). | 0.32 (3.0) AAFor NGC 1614, integrated channels are determined to cover all of the nuclear (1 kpc) emission components. Molecular emission at individual continuum peaks is narrower than the whole nuclear emission and has different peak velocity (Table 6 and Figure 2). Thus, the detection significance is apparently low, owing to increased noise originating from the integration of a large number of channels, even if narrow emission line signatures are clearly discernible in original beam spectra (Figure 2). | 0.31 (3) AAFor NGC 1614, integrated channels are determined to cover all of the nuclear (1 kpc) emission components. Molecular emission at individual continuum peaks is narrower than the whole nuclear emission and has different peak velocity (Table 6 and Figure 2). Thus, the detection significance is apparently low, owing to increased noise originating from the integration of a large number of channels, even if narrow emission line signatures are clearly discernible in original beam spectra (Figure 2). |
| NGC 1614 E | 0.29 (4.8) AAFor NGC 1614, integrated channels are determined to cover all of the nuclear (1 kpc) emission components. Molecular emission at individual continuum peaks is narrower than the whole nuclear emission and has different peak velocity (Table 6 and Figure 2). Thus, the detection significance is apparently low, owing to increased noise originating from the integration of a large number of channels, even if narrow emission line signatures are clearly discernible in original beam spectra (Figure 2). | 0.54 (5.7) AAFor NGC 1614, integrated channels are determined to cover all of the nuclear (1 kpc) emission components. Molecular emission at individual continuum peaks is narrower than the whole nuclear emission and has different peak velocity (Table 6 and Figure 2). Thus, the detection significance is apparently low, owing to increased noise originating from the integration of a large number of channels, even if narrow emission line signatures are clearly discernible in original beam spectra (Figure 2). | 0.29 (3) AAFor NGC 1614, integrated channels are determined to cover all of the nuclear (1 kpc) emission components. Molecular emission at individual continuum peaks is narrower than the whole nuclear emission and has different peak velocity (Table 6 and Figure 2). Thus, the detection significance is apparently low, owing to increased noise originating from the integration of a large number of channels, even if narrow emission line signatures are clearly discernible in original beam spectra (Figure 2). | 0.31 (3) AAFor NGC 1614, integrated channels are determined to cover all of the nuclear (1 kpc) emission components. Molecular emission at individual continuum peaks is narrower than the whole nuclear emission and has different peak velocity (Table 6 and Figure 2). Thus, the detection significance is apparently low, owing to increased noise originating from the integration of a large number of channels, even if narrow emission line signatures are clearly discernible in original beam spectra (Figure 2). |
| IRAS 060357102 | 2.5 (19) | 3.1 (20) | 1.0 (14) | 0.45 (9.4) |
| IRAS 085723915 | 1.1 (13) | 1.4 (15) | 0.37 (8.3) | 0.57 (11) |
| IRAS 121120305 NE | 4.7 (26) | 2.6 (19) | 3.4 (15) | 1.9 (14) |
| IRAS 121120305 SW | 0.43 (4.2) BBIntegrated channels are optimized for the SW nucleus, because the molecular emission from the SW nucleus is faint and has a significantly different velocity profile from the brighter NE nucleus. | 0.88 (7.9) BBIntegrated channels are optimized for the SW nucleus, because the molecular emission from the SW nucleus is faint and has a significantly different velocity profile from the brighter NE nucleus. | 0.34 (3) BBIntegrated channels are optimized for the SW nucleus, because the molecular emission from the SW nucleus is faint and has a significantly different velocity profile from the brighter NE nucleus. | 0.45 (3) BBIntegrated channels are optimized for the SW nucleus, because the molecular emission from the SW nucleus is faint and has a significantly different velocity profile from the brighter NE nucleus. |
| IRAS 121271412 | 0.48 (8.2) | 0.33 (6.8) | 0.32 (7.6) | 0.22 (4.6) |
| IRAS 135090442 | 0.28 (5.7) | 0.28 (5.3) | 0.16 (5.5) | 0.15 (3.8) |
| IRAS 152503609 | 3.0 (20) | 1.3 (13) | 3.0 (19) | 2.7 (20) |
| Superantennae | 2.9 (12) | 1.6 (11) | 1.1 (10) | 4.3 (21) |
| IRAS 205514250 | 4.4 (53) | 6.0 (59) | 1.8 (30) | 1.3 (27) |
| IRAS 224911808 | 3.9 (24) | 2.5 (20) | 2.4 (23) | 1.3 (17) |
Note. — Col.(1): Object name. Cols.(2)–(4): Flux (in Jy beam km s) at the emission peak in the integrated intensity (moment 0) map with original synthesized beam. Detection significance relative to the rms noise (1) in the moment 0 map is shown in parentheses. These moment 0 maps of the original beam are primarily used for (a) verification of significant detection at the peak position of the molecular line and (b) confirming its spatial coincidence with continuum peak within peak determination uncertainty (= beam-size/signal-to-noise [S/N] ratio). Col.(2): HCN J=2–1 (=177.261 GHz). Col.(3): HCO J=2–1 (=178.375 GHz). Col.(4): HNC J=2–1 (=181.325 GHz). Col.(5): Para-HO 3–2 (=183.310 GHz). In each object, the synthesized beam size of the HCN J=2–1 and HCO J=2–1 (HNC J=2–1 and HO) is virtually identical to that of continuum J21a (J21b) shown in Table 3, column 6.