Modeling Fluid Polyamorphism Through a Maximum-Valence Approach
Abstract
We suggest a simple model to describe polyamorphism in single-component fluids using a maximum-valence approach. The model contains three types of interactions: i) atoms attract each other by van der Waals forces that generate a liquid-gas transition at low pressures, ii) atoms may form covalent bonds that induce association, and iii) bonded atoms attract or repel each other stronger than non-bonded atoms, thus generating liquid-liquid separation. As an example, we qualitatively compare this model with the behavior of liquid sulfur and show that condition (iii) generates a liquid-liquid phase transition in addition to the liquid-gas phase transition.
The existence of two alternative liquid phases in a single-component substance is known as “liquid polyamorphism” [1, 2, 3]. A substance may be found to be polyamorphic by experimentally or computationally detecting a liquid-liquid phase transition (LLPT), which could be terminated at a liquid-liquid critical point (LLCP) [4, 5]. Liquid polyamorphism has been observed in a variety of substances including: hydrogen [6, 7, 8, 9, 10], helium [11, 12], sulfur [13], phosphorous [14, 15] and liquid carbon [16], while being proposed to exist in selenium and tellurium [17, 18] and in various oxides [3] - e.g. silica [19, 20, 21]. It has also been hypothesized in supercooled silicon [22, 5] and in metastable deeply supercooled water below the temperature of spontaneous ice nucleation [1, 2, 3, 23, 24, 25, 26, 27, 28, 29, 30, 31].
The phenomenon of liquid polyamorphism could be understood through the interconversion of the two alternative molecular or supramolecular states via a reversible reaction [2, 32, 33]. While for some polyamorphic systems, like supercooled water, this approach is still being debated, there are substances (such as hydrogen, sulfur, phosphorous, and liquid carbon) where liquid-liquid phase separation is indeed induced by a chemical reaction. For example, it was recently discovered that high-density sulfur, well above the liquid-gas critical pressure (in the range from to ), exhibits a LLPT indicated by a discontinuity in density from a low-density-liquid (LDL) monomer-rich phase to a high-density-liquid (HDL) polymer-rich phase [13]. This liquid-liquid transition is found in a polymerized state of sulfur (observed above at ambient pressure [34, 35, 36, 37, 38]). However, with further increase of temperature, as the system approaches the liquid-gas phase transition (LGPT), the polymer chains gradually dissociate. Another liquid-liquid transition accompanied by a chemical reaction has been predicted in hydrogen at extremely high-pressures [39, 40, 41, 42, 43], and although the first-order phase transition is still a subject of debate in the literature [44, 45, 46], two liquid phases of hydrogen have been observed, in which liquid-molecular hydrogen (dimers) dissociates into atomistic-metallic hydrogen [6, 7, 8, 9, 10].
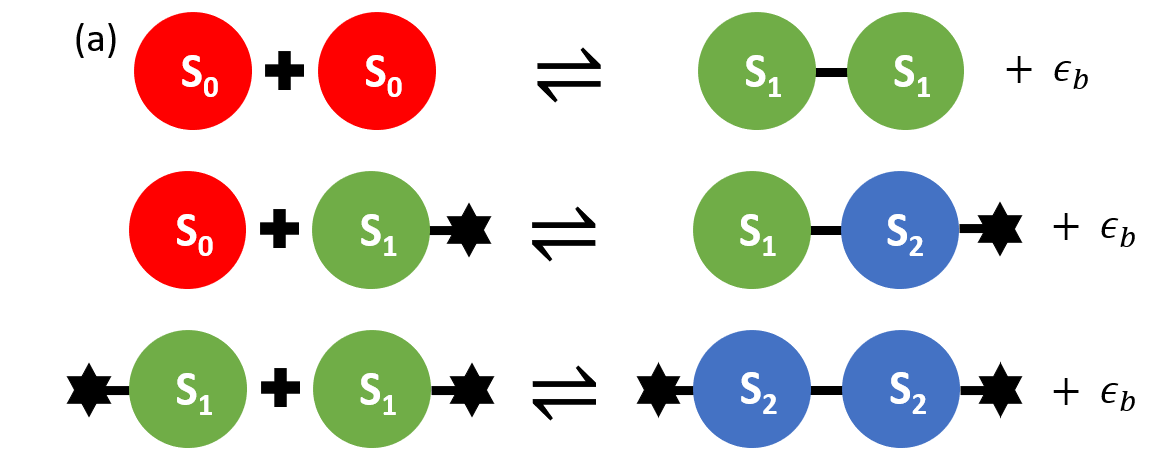
In this work, motivated by the recent discoveries of the LLPT in sulfur [13] and hydrogen [6, 7, 8, 9, 10], we propose a simple model to describe liquid polyamorphism in a variety of chemically-reacting fluids. The model combines the ideas of two-state thermodynamics [2, 28] with the maximum-valence approach [47, 48, 49], in which atoms may form covalent bonds via a reversible reaction, changing their state according to their bond number. By mimicking the valence structure and maximum bond number, , our model predicts the LLPT in systems with dimerization (), polymerization (), and gelation (). As an example, we compare the molecular dynamics (MD) simulations with the phase behavior of sulfur. In particular, we show that when the bonded atoms attract each other stronger than to the unbonded atoms, phase separation is coupled to polymerization generating the LLPT in sulfur.
I Maximum-Valence Model
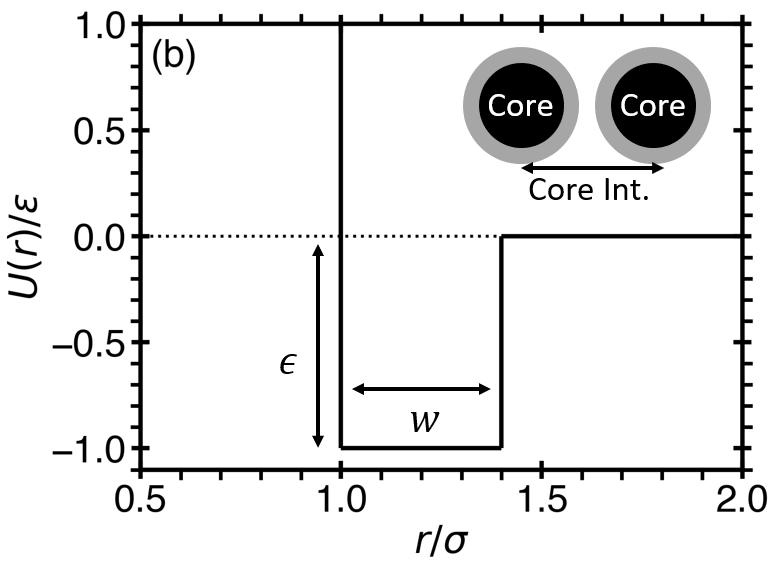
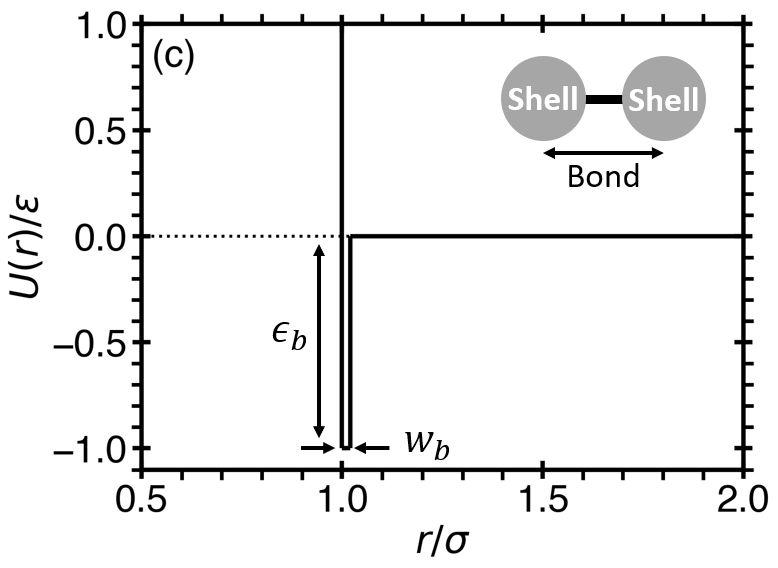
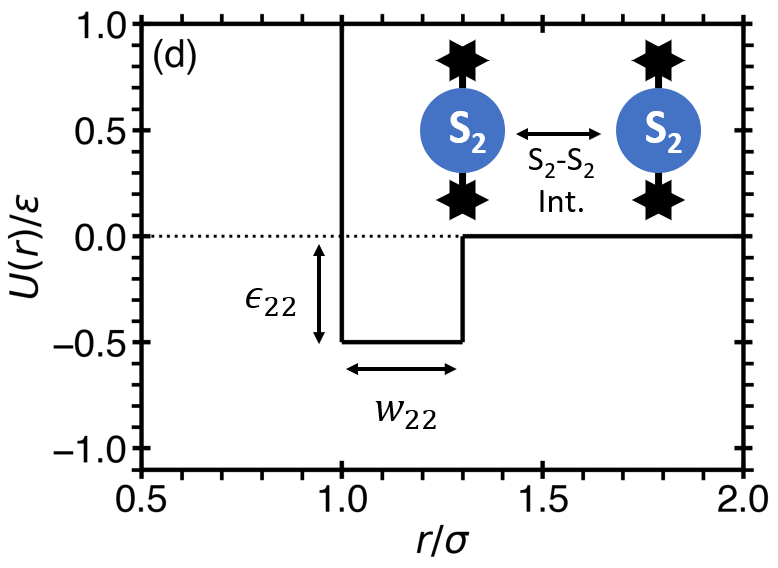
We model the polymerization of a sulfur-like system by characterizing each atom by its coordination number, the number of bonds it has with other atoms. Depending on the coordination number, each atom is assigned to distinguished states: S0 (with zero bonds), S1 (with one bond), and S2 (with two bonds). Atoms cannot form more than two bonds and, consequently, will polymerize into a linear polymer. All of the atoms in the system may change their state by forming or breaking a covalent bond via a reversible reaction. Fig. 1a depicts the three types of reversible reactions that may occur in the system. In this work, we demonstrate that the minimum ingredients required to produce a LLPT are the following: i) the van der Waals interactions between atoms, which produce a LGPT; ii) covalent bonds between atoms, which induce polymerization; and iii), as we hypothesize, additional van der Waals interactions between atoms with maximum valency (having two bonds), which couple phase segregation to polymerization. These three ingredients are illustrated by square-well potentials in Figs. 1(b-d).
Physically, the additional attraction between atoms in neighboring chains may stem from the fact that in real polymers the covalent bond is shorter than the diameter of the unbonded (“free”) atoms, such that the attractive wells of bonded atoms in neighboring chains overlap with each other [50, 51, 52, 4, 53, 54]. This effectively creates an additional zone of attraction between polymer chains, which is a common attribute that produces LLPTs in soft-core potentials [52, 4]. In these models, the atoms which penetrate the soft-core, can be regarded as bonded, which generate an additional “effective” attractive well due to the fact that such “bonded” atoms have more neighbors in their attractive range [55]. However, the explicit shortening of the covalent bonds between atoms would require the development of a microscopic Hamiltonian for this phenomenon, which would be most desirable for a future study. Therefore, in this work, for simplicity, instead of shortening the length of the covalent bonds, this effect is accounted for in the model through the additional “effective” square-well attraction (iii). Without this potential, with characteristic energy , and consequently, in the absence of polymerized atoms, no LLPT will occur. We note that this simplification is in the spirit of common semi-phenomenological models of non-ideal binary mixtures, such as the Flory-Huggins theory of polymer solutions [56, 57, 58, 59] or a regular-solution model [60].
To verify our hypothesis, we implement these three ingredients of interactions via an event-driven MD technique [61, 62]; in particular, we use a discrete MD package (DMD) that only includes particles interacting through spherically-symmetric step-wise potentials, which may form bonds via reversible reactions [63]. We simulate an NVT ensemble of atoms in a cubic box with periodic boundaries at various constant densities and temperatures. The temperature is controlled by a Berendsen thermostat [64]. The van der Waals and covalent-bonding interactions are implemented by separating each atom into two overlapping hard spheres (a core and a shell), with the same diameter and mass , see Figs. 1(b-d). The connection between the core and its shell is represented by an infinite square-well potential of width . The cores and shells of different atoms do not interact with each other. The core represents the atom without its valence electrons. It interacts with other cores via a wide potential well with depth and width (the parameters are chosen as an example, Fig. 1b), which models the van der Waals interactions in the system. Meanwhile, the shell represents the outer valence electron cloud. It interacts with other shells via a narrow potential well with depth and width (Fig. 1c), which models the breaking and forming of covalent bonds. In the absence of the shell, this system has a liquid-gas critical point (LGCP) at , , and [54], well above the equilibrium crystallization line, which we force to be at low temperature by selecting the appropriate width, , of the potential. We note that all physical parameters are normalized by the appropriate combination of mass , length , and energy units, as used in Ref. [54]. When the shell interactions are included and the system may form covalent bonds, the location of the LGCP changes, but not significantly. In addition to the wide and narrow wells, we introduce an additional attractive potential well (with depth and width , Fig. 1d) for the van der Waals interaction between the shells of the atoms with two bonds (both in the state S2), which are not chemically bonded to each other.
We note that during either the formation or breaking of a bond, the new state of the reacting particles may modify the potential energy of the interactions with their non-bonded neighboring particles [63]. In our model, this occurs when particles in the state S1 convert to the state S2 (or vice versa). To maintain the conservation of energy, we calculate the change of the total potential energy, , due to the change of the state of the reacting particles and subtract it from the kinetic energy of the reacting pair. As a consequence, the equations for computing the new velocities [63] may not have real solutions. In this case, the bond will not form or break, and the reacting particles will conserve their states through an elastic collision.
In this work, we obtain a detailed phase diagram of the model using the values of the square-well depths and widths illustrated in Figs. 1(b-d). In addition, we investigate the effect of and on the position of the liquid-liquid (LLCP) and liquid-gas (LGCP) critical points.
II Results: Liquid-Liquid Phase Transition
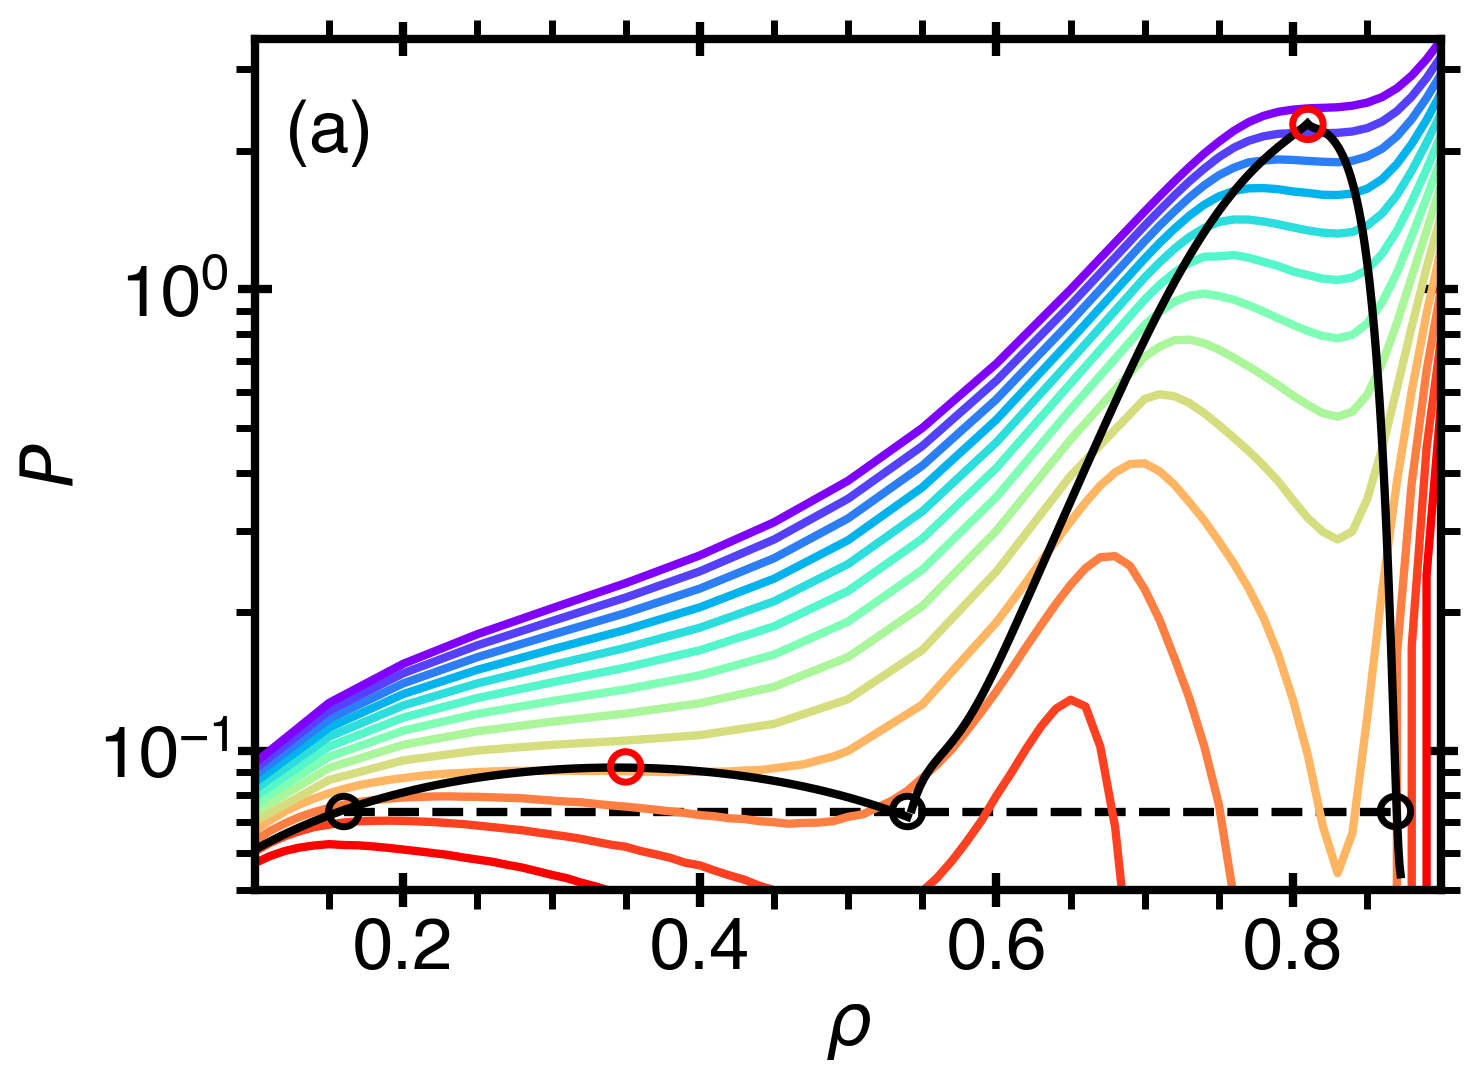
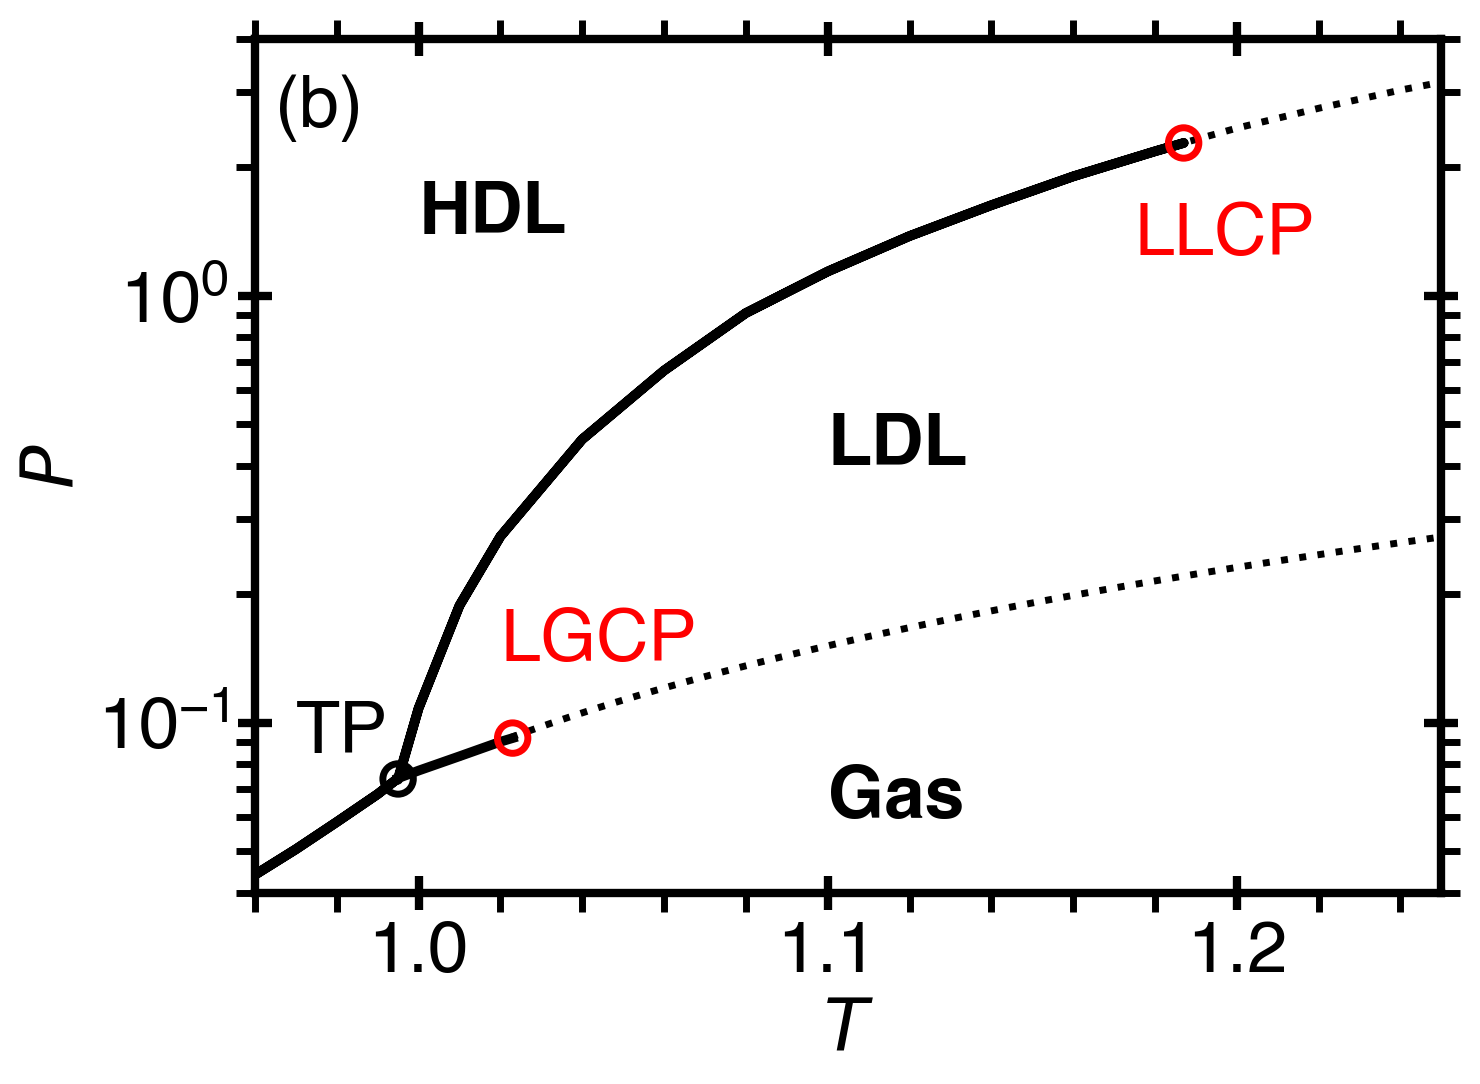
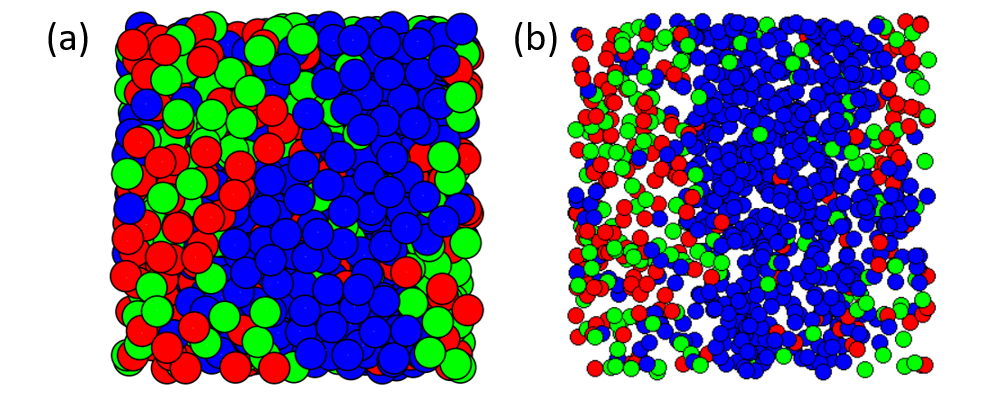
Figure 2a illustrates isotherms on a pressure-density (-) plane, which exhibit two sets of van der Waals loops. The loops correspond to the LGCP, located at low density and pressure, and the LLCP, located at a higher density and pressure. Fig. 2b illustrates the LG and LL coexistence on a - plane along with the critical isochores. At the triple point (TP), the gaseous, LDL, and HDL phases coexist. In contrast to the ST2 model for water [27], but in agreement with spherically symmetric models [4, 65], the - line of the LL coexistence has a positive slope. Simulation snapshots depicted in Fig. 3 show the segregation of polymer-rich, HDL, and polymer-poor, LDL, phases.
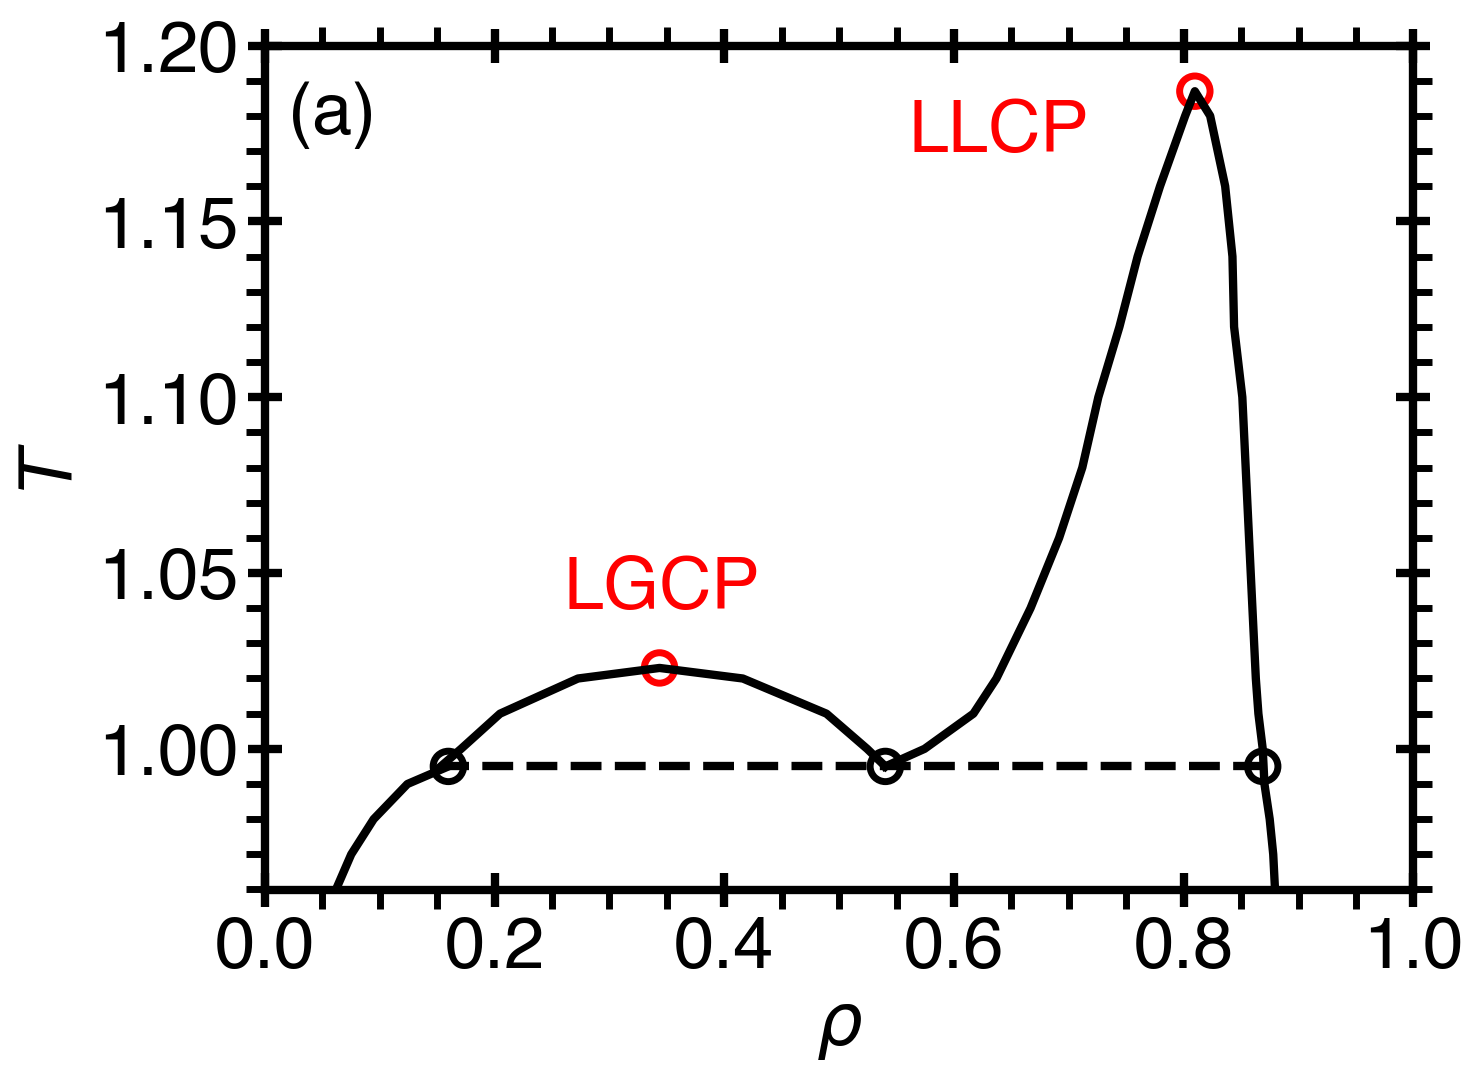
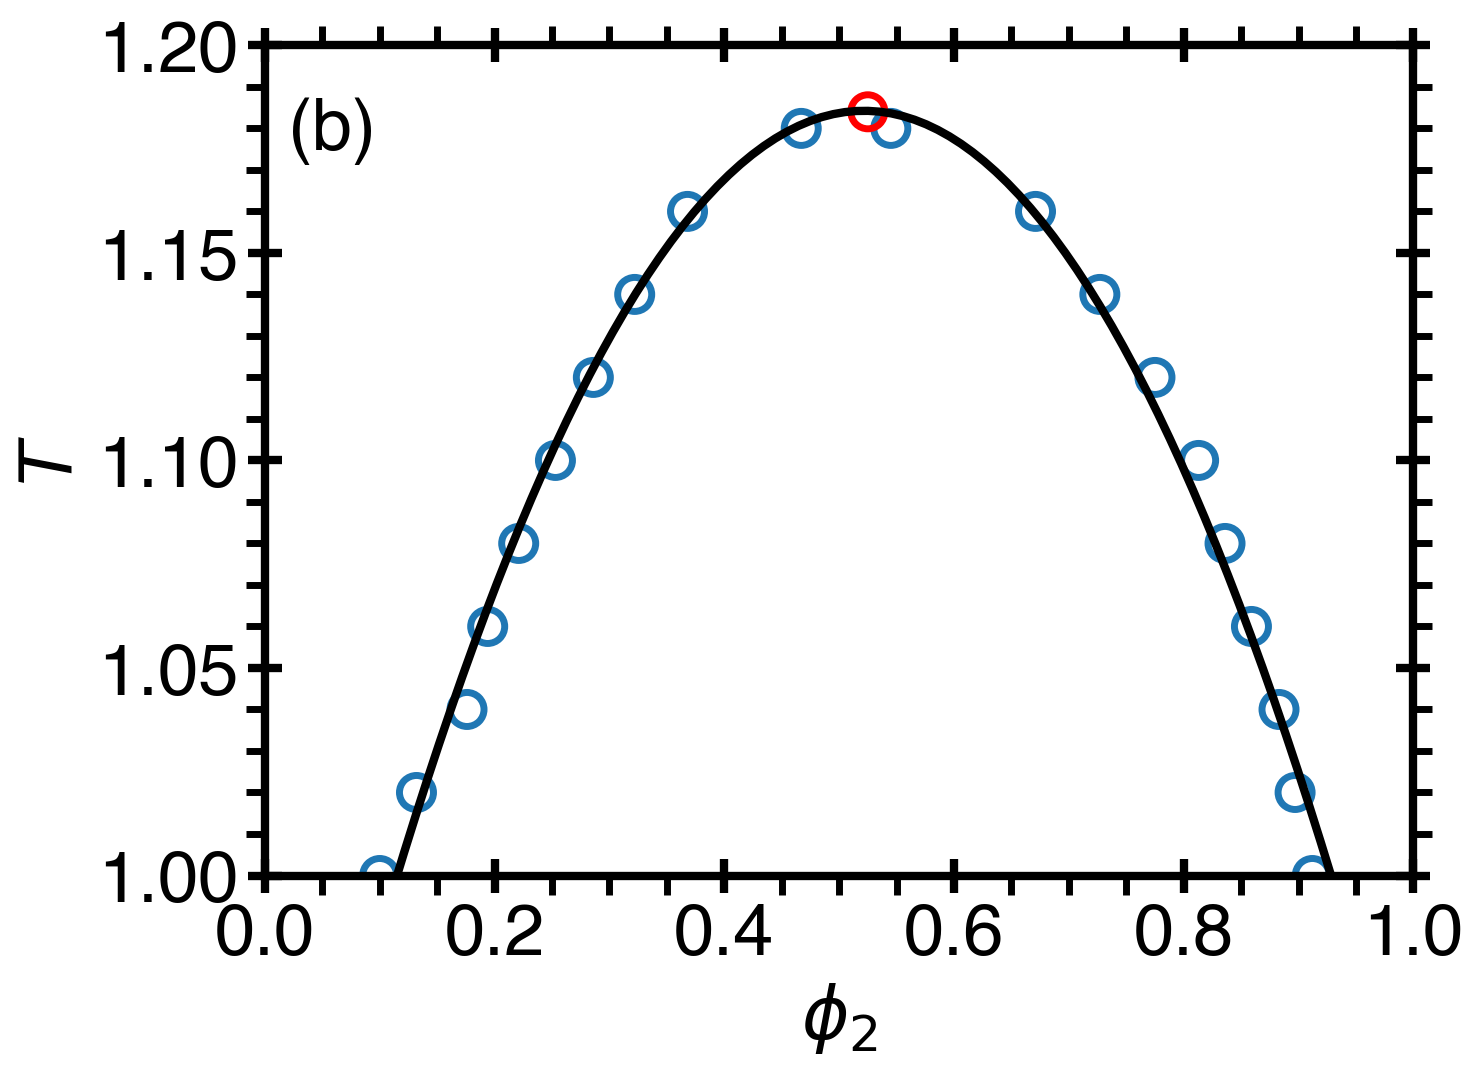
Figure 4a presents the LG and LL coexistence curves on a - phase diagram. Although there is a distribution of polymer chains with varying lengths, a simple way to characterize the degree of polymerization is to find the fractions , and of atoms in states S0, S1 and S2. Due to the conservation of the number of atoms, . The fraction was computed based on the asymmetric LL coexistence curve (Fig. 4a). Remarkably, was found to be symmetric and centered around as shown in Fig. 4b. Consequently, the sum has the same symmetry. This feature suggests that may be viewed as the appropriate order parameter for the LLPT coupled with polymerization. In contrast, the density, , is the order parameter for the LGPT, as commonly accepted. The symmetric nature of , and the fact that S1 atoms are the intermediate states in the formation of polymer chains, enables a two-state thermodynamic approach [2] by reducing this model to two alternative states, with fractions and + .
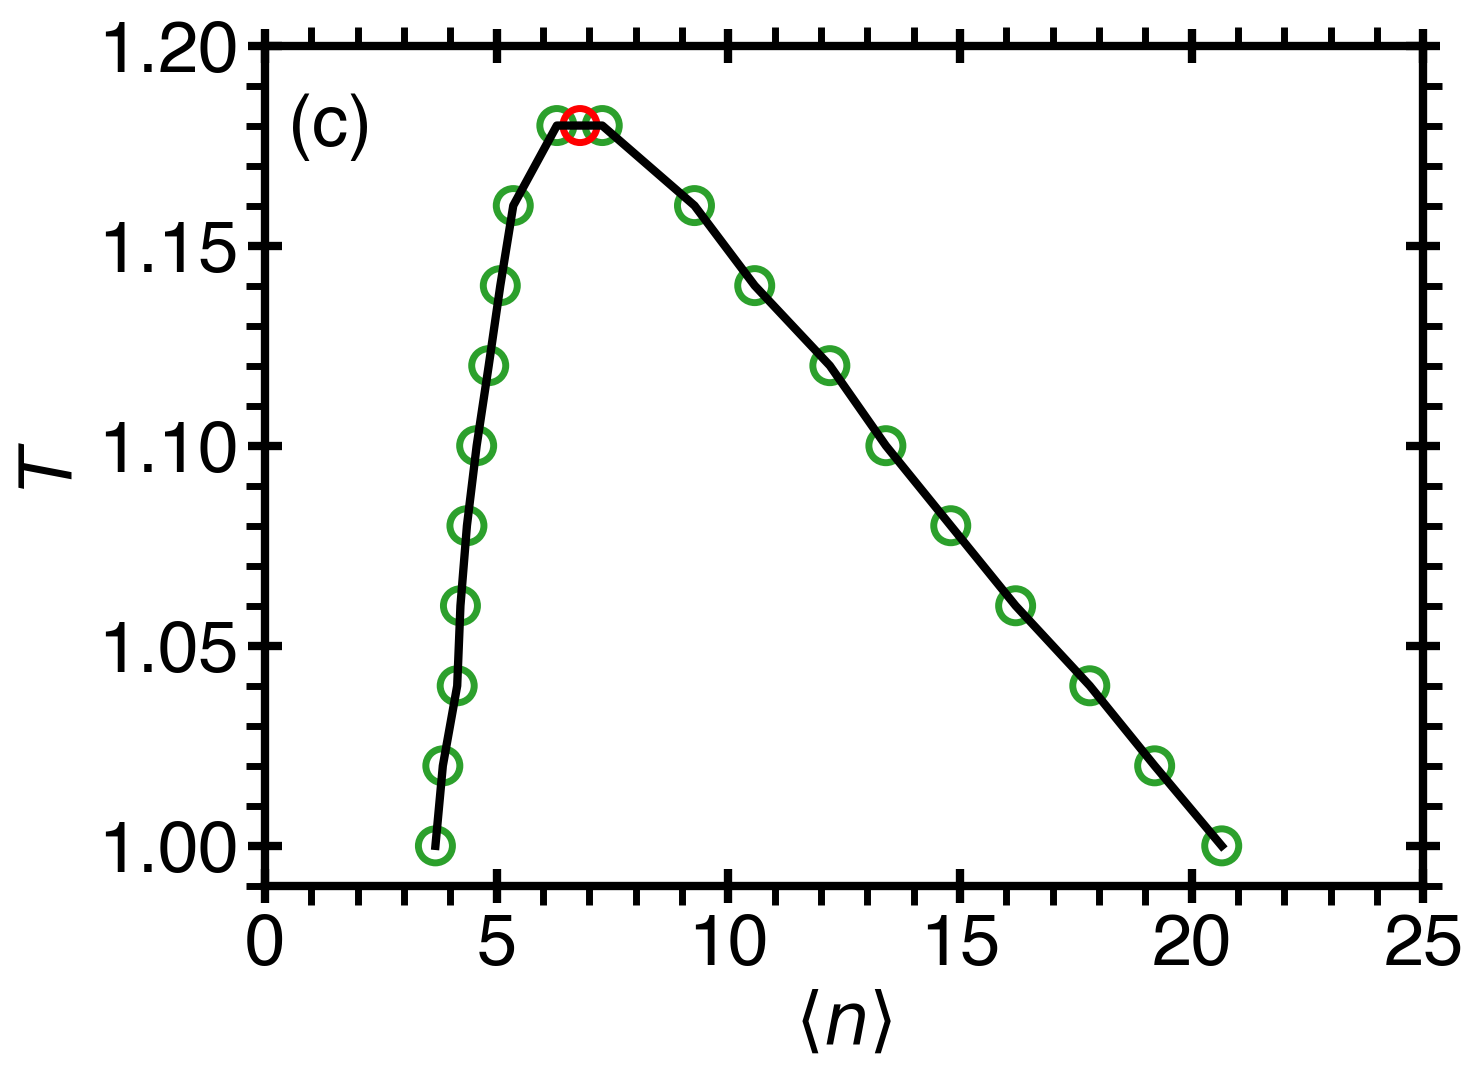
The LLPT coexistence curve on the - plane (Fig. 4c), where is the average length of a polymer chain among those containing at least one atom in state S2, namely trimers or longer polymer chains. The strong temperature dependence of in the phase segregation region proves that the LLPT is associated with polymerization. Neither nor shows any discontinuity as a function of density and temperature, although shows a strong asymmetry toward the HDL phase.
III Location of the Critical Points
With the values of parameters considered in the previous sections, the system acquires a LLPT terminating at a second critical point located at , and . We have investigated the dependency of the location of the LLCP and LGCP on the the three key parameters of the model: the range of van der Waals interactions , the bond strength , and the interaction energy between bonded and unbonded atoms, , presented in Fig. 5. Each of the parameter sets produced a LLCP at much higher pressures than the LGCP, which practically remains the same as the square-well model without bonds [66]. We observed that the reduction of the interaction energy, proportionally reduces and (see Figs. 5a,b). This indicates that the attraction between atoms in state S2 is crucial for the existence of the LLPT, since decreasing the interaction energy further decreases to negative pressures and, eventually, to a point in the metastable region below the liquid-gas coexistence curve, where the LLCP effectively disappears. We find that for all simulations with , the LGCP moves into the metastable region of the LLCP and effectively disappears, while for , the interactions between polymer chains are too weak to produce the LLCP.
In contrast, increasing the bond strength, , does not indicate that the LLCP is going to disappear. Increasing the bond energy produces a slight increase in and , while producing a significant decrease in as shown in Figs. 5(a-c). We note that when the bond energy becomes larger than the van der Waals interaction energy, , the LLCP drops to negative pressures (or in some cases, drops below the crystallization line) and may disappear. This indicates that increasing the strength of polymer bonds is not crucial for the existence of the LLPT. In addition, we found that by increasing the width of the van der Waals interaction potential attraction between cores, , causes to increase slightly, while producing a greater increase in (see Fig. 5d). Meanwhile, increasing causes the inverse effect in and , while leaving and essentially unaffected. We note that the maximum-valence model produces a LLCP even when the bond energy is zero (as shown for in Figs. 5(a-c) for ). This indicates that the interplay between the van der Waals interaction and the attraction between bonded atoms is crucial to generate the LLPT, while the strength of the bond is secondary to this effect.
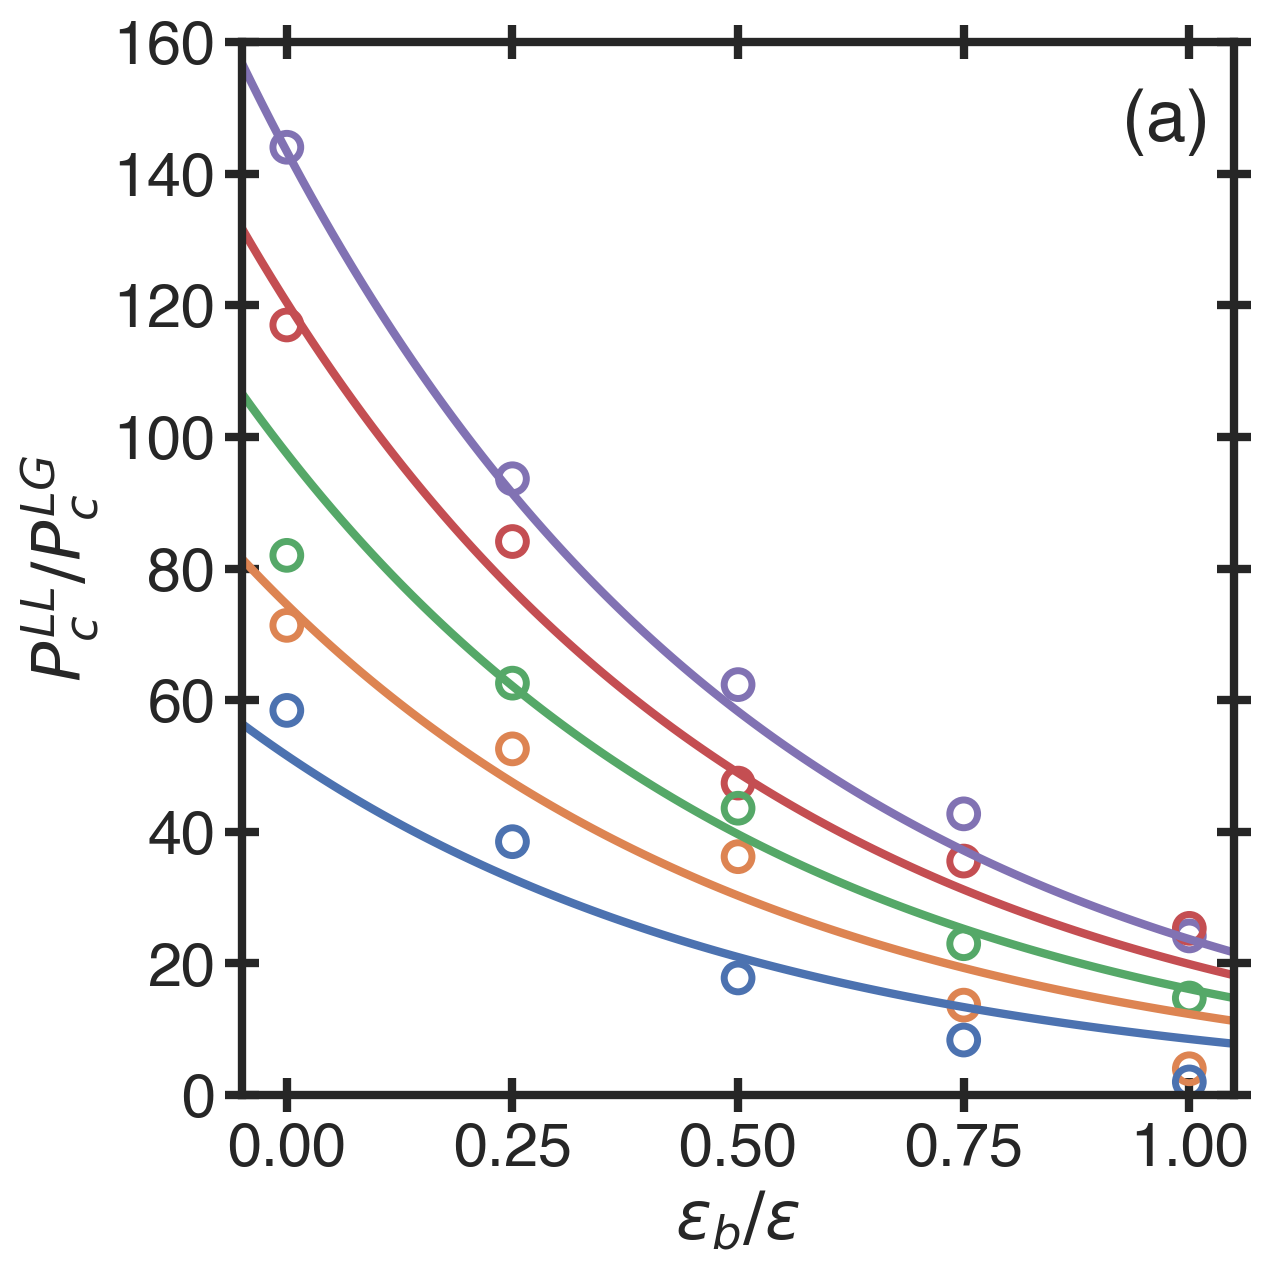
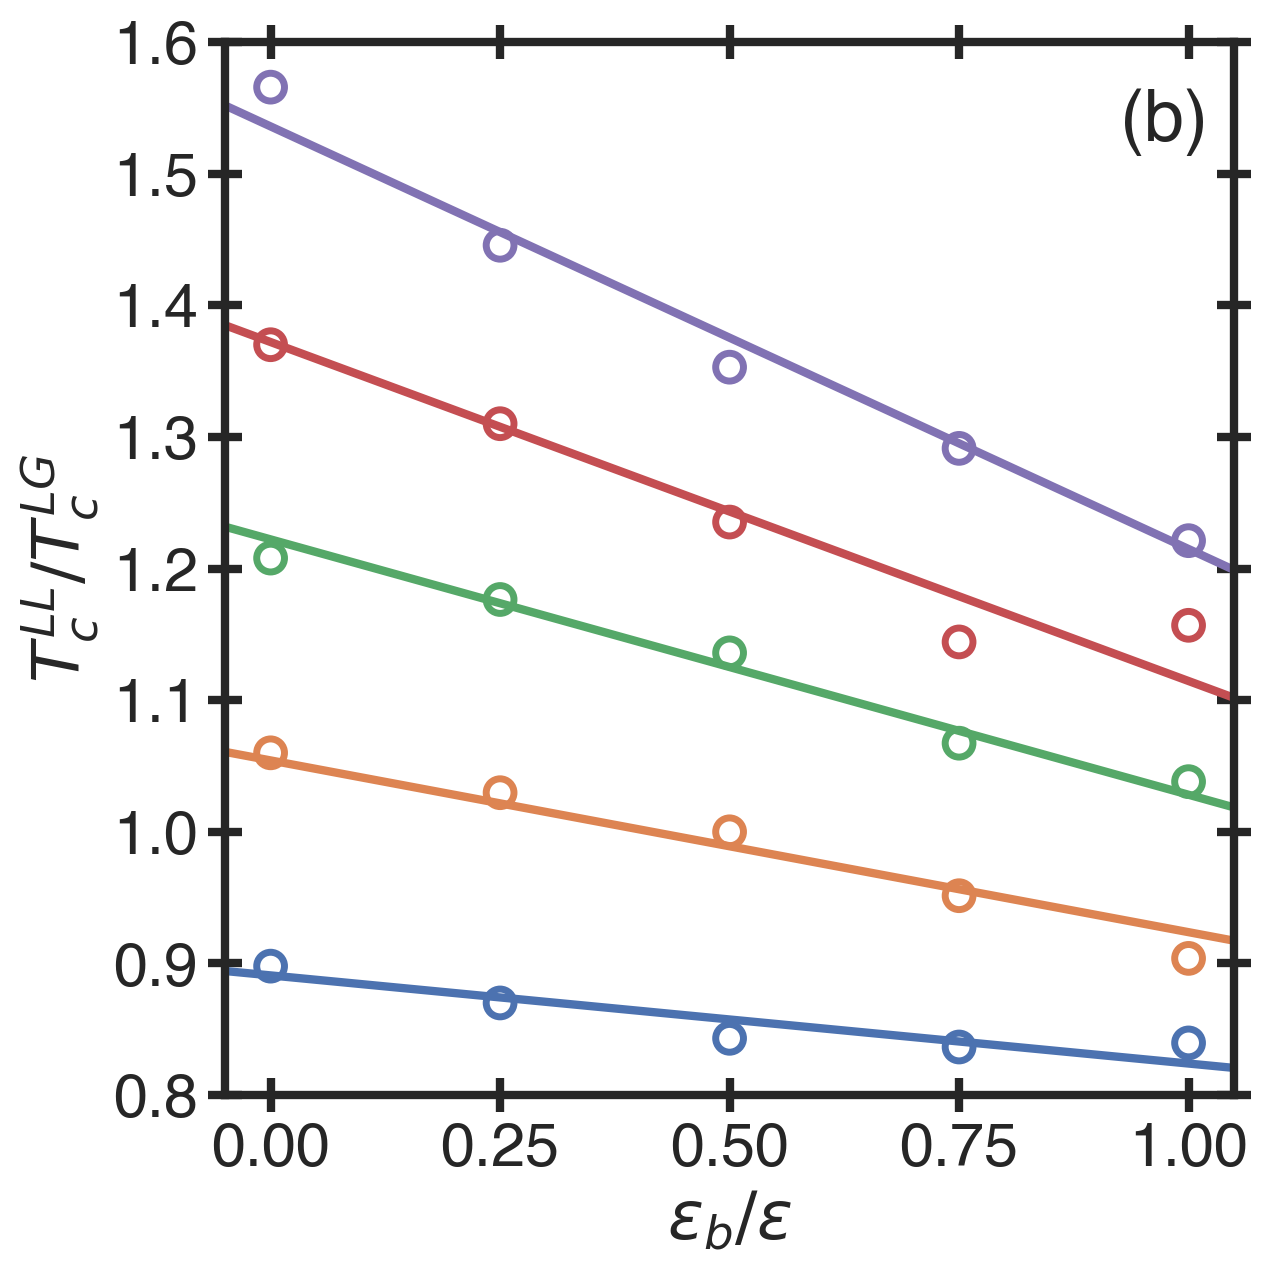
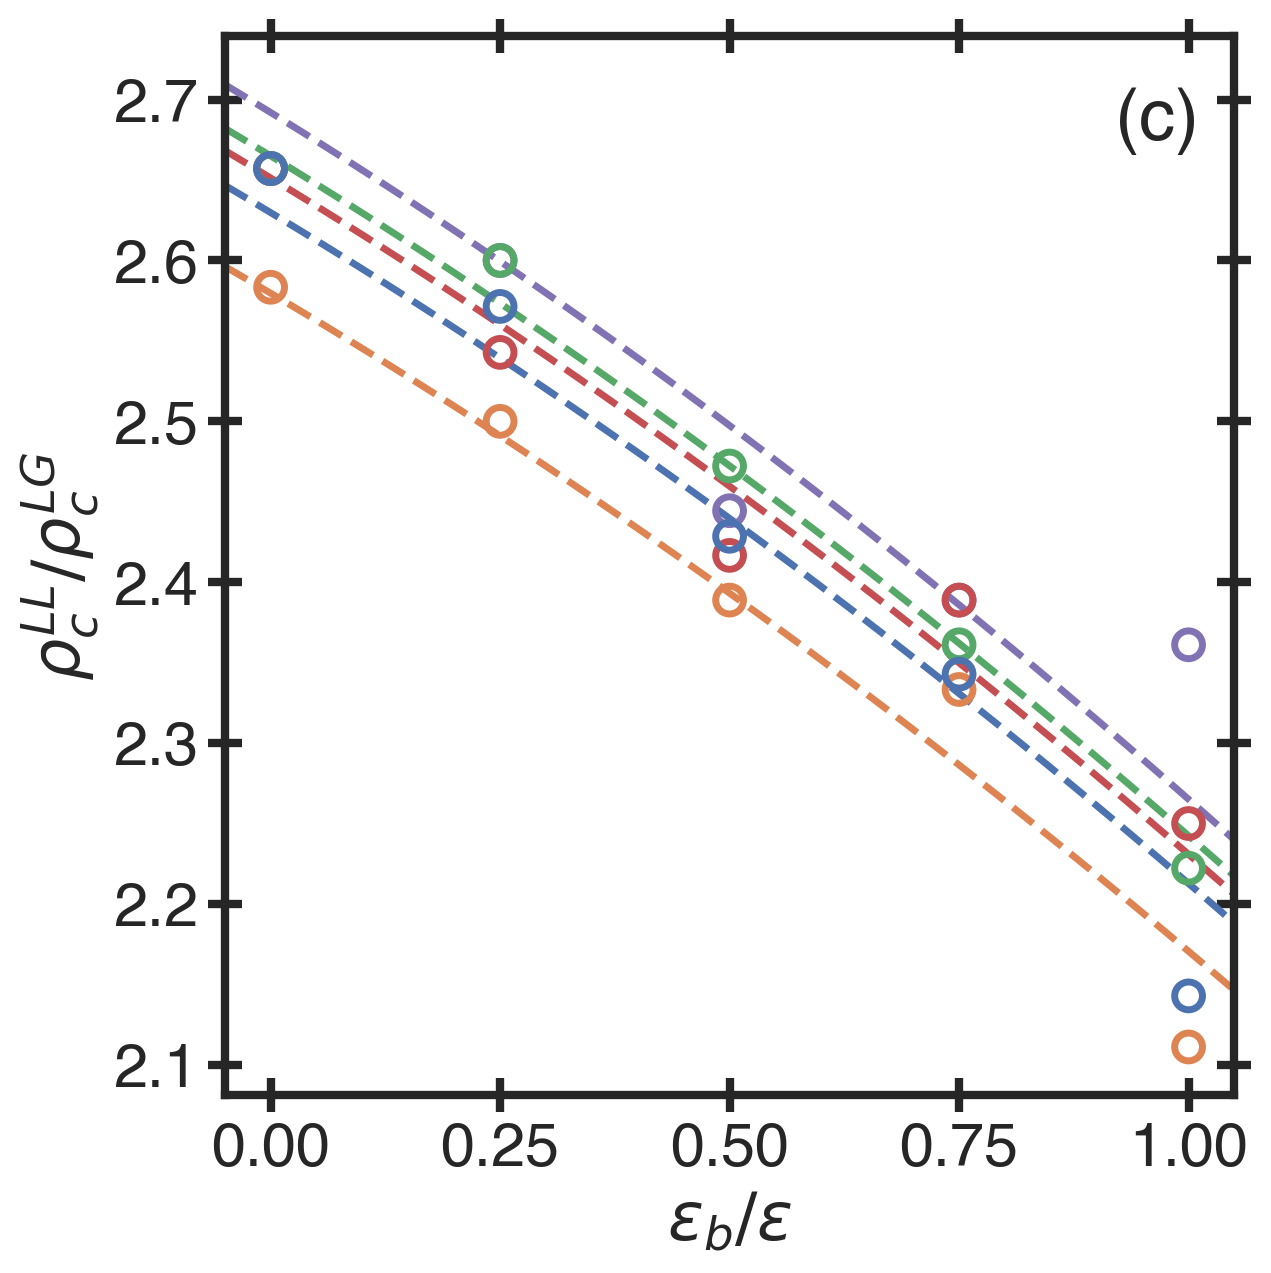
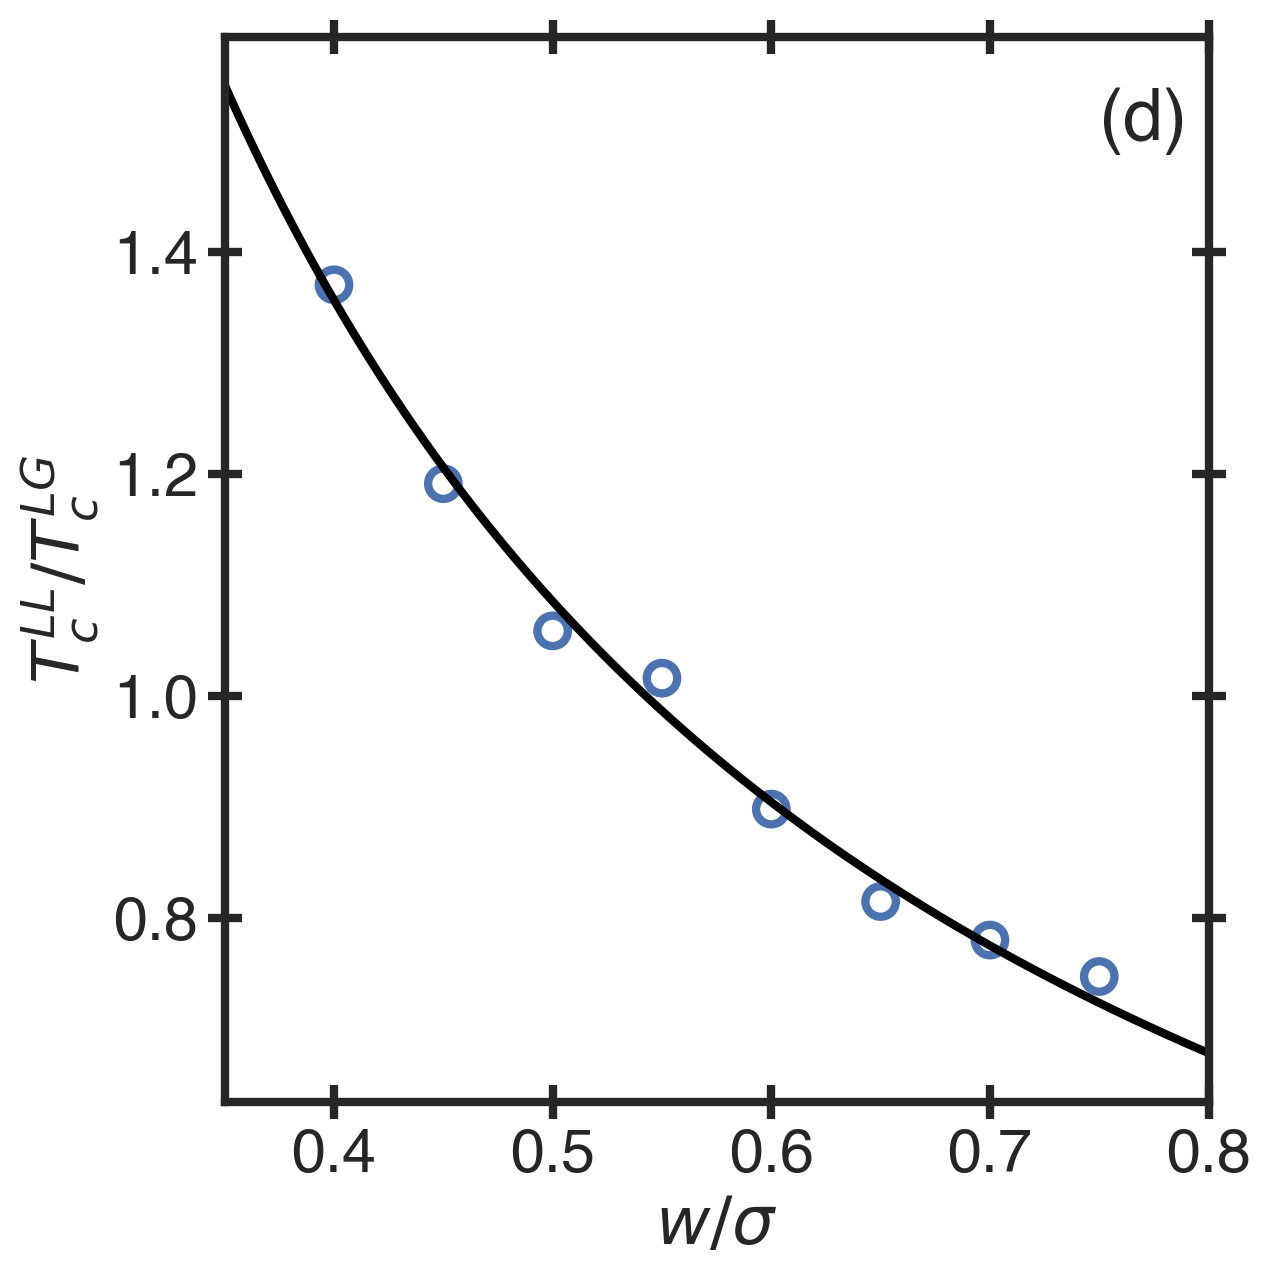
To compare the critical point behavior in the maximum-valence model with sulfur, we considered the ratio of the LLCP and LGCP critical-point parameters. For sulfur, these ratios are , , and [13, 67]. Fig. 5 depicts the behavior of the critical-point parameters for the maximum valence model. As illustrated in Fig. 5a, we find that the ratio of critical pressures scales linearly with and exponentially with as . We also find that the liquid-liquid critical temperature is linearly related to and as (see Fig. 5b), while also being inversely proportional to as the ratio (see Fig. 5d). Meanwhile, as illustrated in Fig. 5c, the critical density shows a general decreasing trend with increase of . From the general trends presented in Fig. 5, we find that the best parameter sets in the maximum-valence model that produce ratios that match with sulfur exist for large van der Waals interaction potential, , and small bond energies, at large interaction potentials between bonded atoms . For , , and , producing , , and , values which are close to the ratio in sulfur [13, 67].
IV Further Comparisons with the Behavior of Sulfur
Qualitatively, the phase diagram of sulfur matches that of the maximum-valence model with a specific set of interaction parameters. In sulfur, the LGCP is located at , , and [67], while the LLCP is located at , , and [13], such that the ratio of the LL to LG critical parameters qualitatively matches the predictions of the maximum-valence model. We note that the behavior of sulfur is more complicated away from the LLPT since liquid sulfur contains octamers that (above the lambda transition [37, 34, 35, 36, 38]) are to be broken down upon heating before polymerization can occur [37]. Since in the considered formulation of the maximum-valence model, we consider atoms that form linear polymers, this mimics the valence structure and bond formation of sulfur in the vicinity of the LLPT.
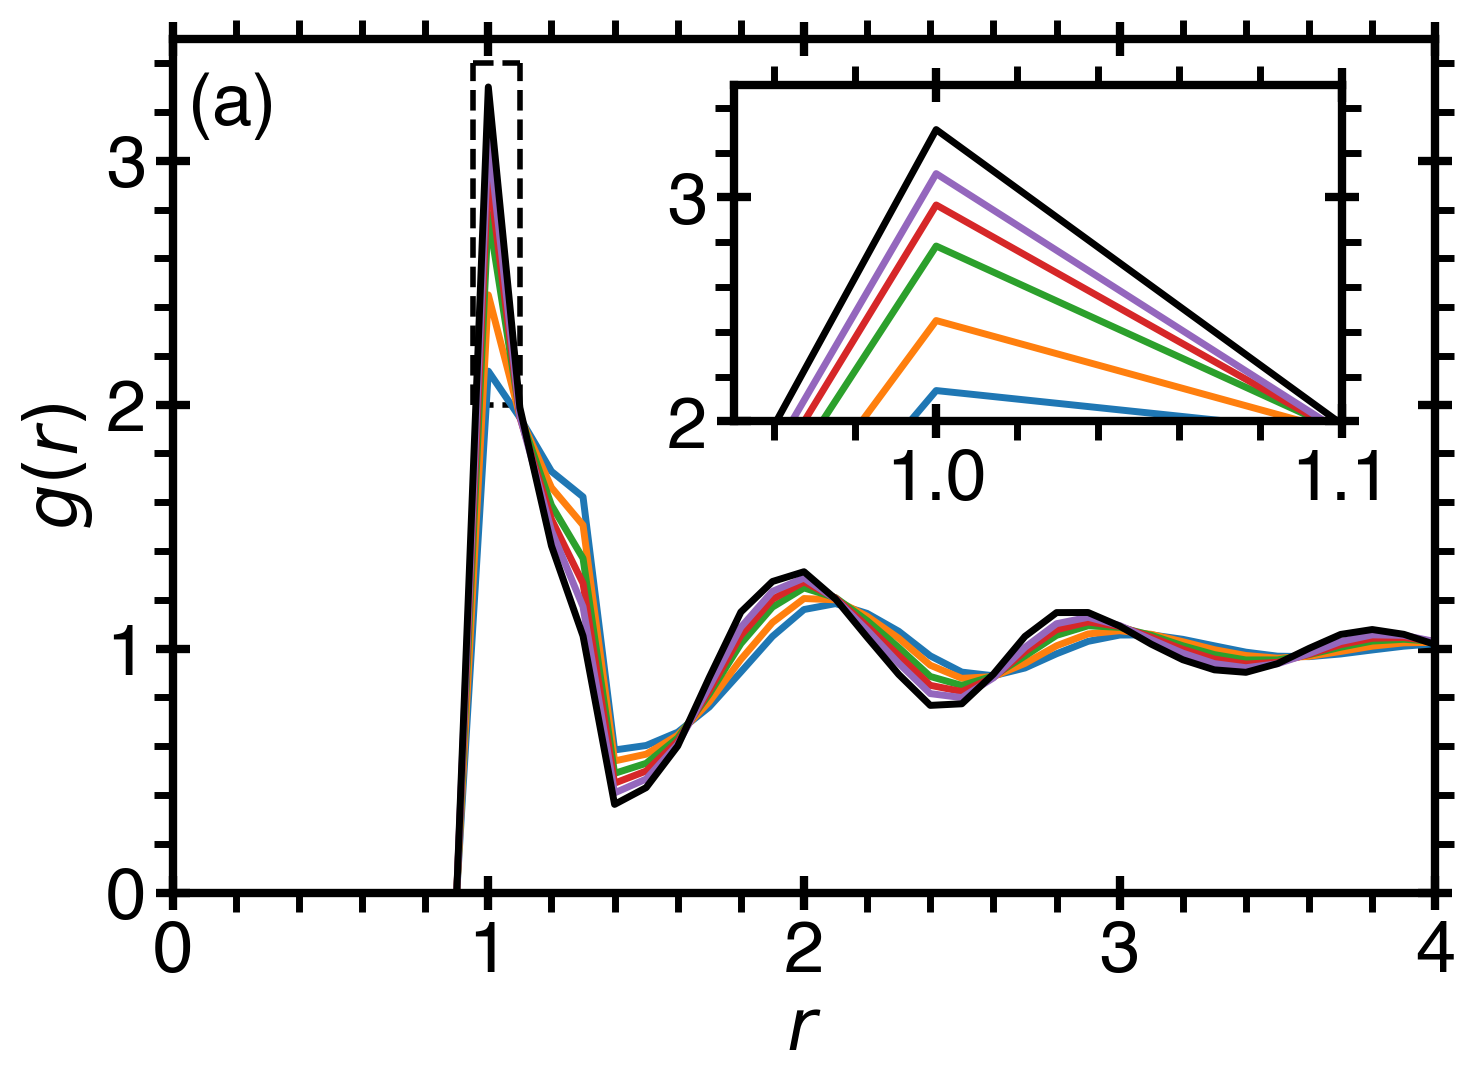
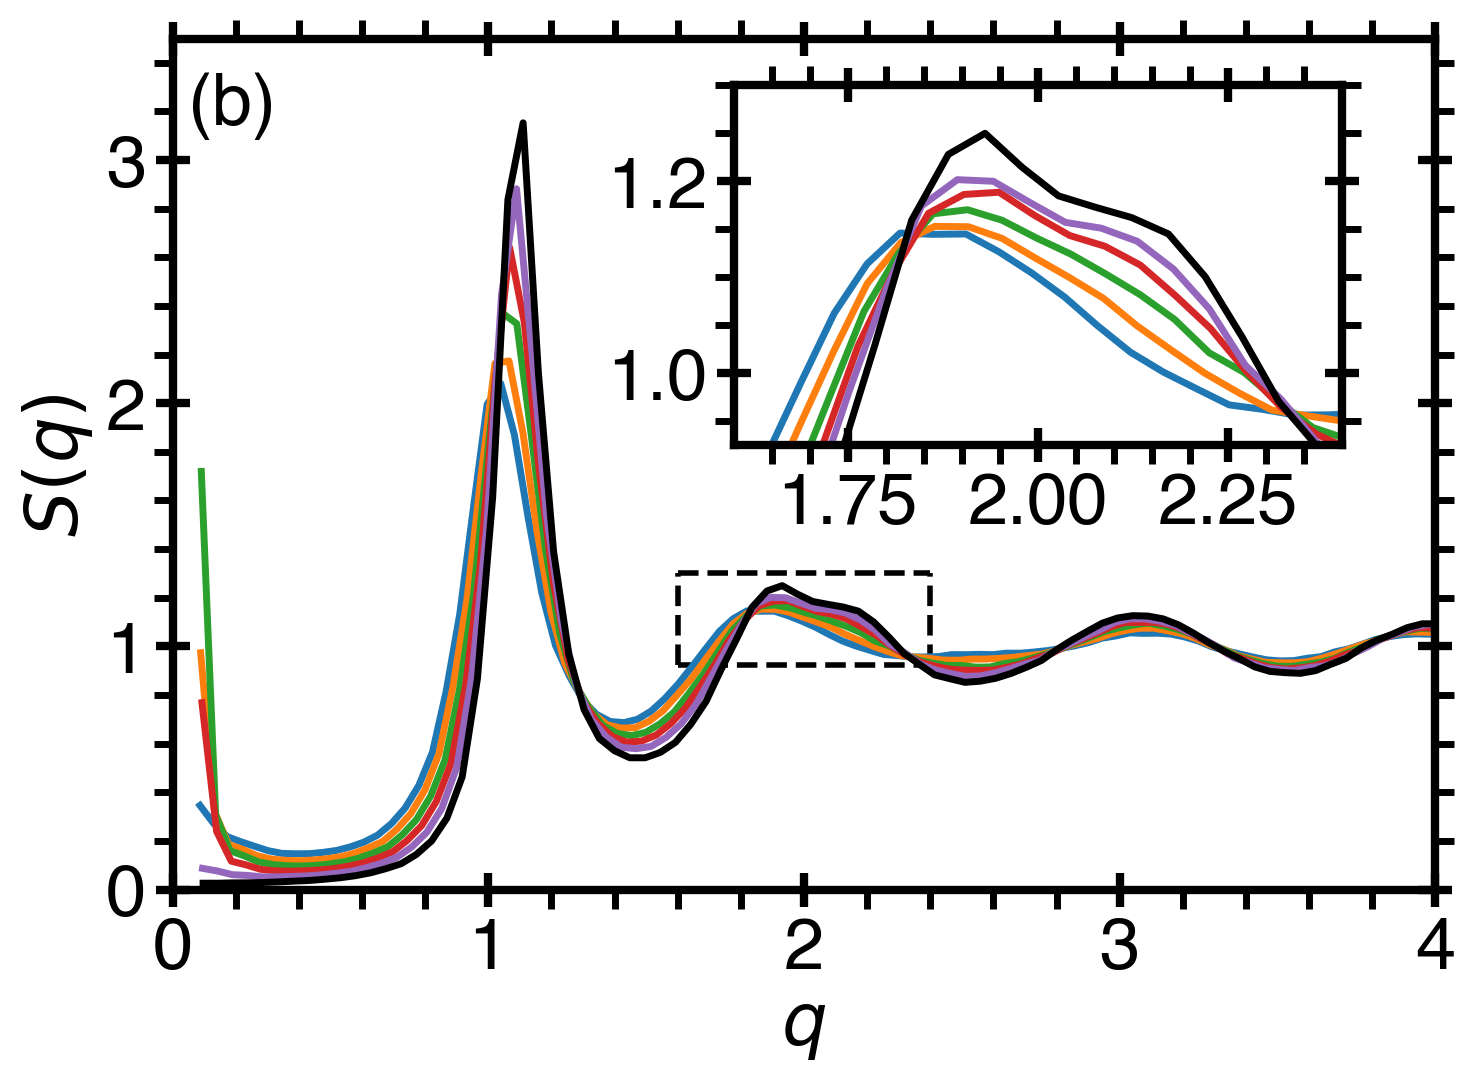
Also, the computed structure factor contains qualitative similarities with the LLPT in sulfur. In Fig. 6, we depict the structural differences between the LDL and HDL phases through the density correlation function, , and the structure factor, , for several densities at constant temperature near the liquid-liquid coexistence (computed for the atom cores). In Fig. 6a, the shows a sharp peak corresponding to the covalent bond length , in the HDL phase. Correspondingly, the structure factor shows a shift in the first peak to a larger wavenumber , while the second peak changes due to polymerization. This change is similar to what was observed in a recent experiment on sulfur [13]. In addition, shows a dramatic increase as for the points corresponding to the equilibrium between two liquid phases (see Fig. 6b), which is indicative of the divergence of the isothermal compressibility. We note that in this work, we find a gas-LDL-HDL triple point, while in the recent experimental work on sulfur [13], the solid-LDL-HDL triple point is observed. In principle, this triple point may be reproduced in the maximum-valence model by fine-tuning the parameters, which requires further investigation.
V Conclusion
The maximum-valence model describes liquid polyamorphism in a variety of chemically-reacting fluids. By tuning the maximum valency, (maximum coordination number), of the model, the liquid-liquid phase transitions (LLPT) in these systems could be investigated. We show that when the bonded atoms attract each other stronger than the non-bonded atoms or when the bonded and non-bonded atoms repel each other, the LLPT is generated by the coupling between phase separation and the chemical reaction. In this work, we compared the model with to the behavior of liquid sulfur. Our results show that the LLPT predicted by the model qualitatively reproduces the LLPT in sulfur at a high pressure and temperature.
The model could also be used to study the LLPTs in systems with other maximum valence numbers. For instance, when , the LLPT is induced by dimerization (e.g. hydrogen at extremely large pressures [6, 7, 8, 9, 10]). For , the LLPT could be induced either by gelation or by molecular network formation [47]. For example, it could be used to model the phase behavior of liquid phosphorous with [14, 15] as well as silicon [5], silica [20, 21], or supercooled water with [24, 49]. In a future study, the two-state thermodynamics of liquid polyamorphism [2, 33, 32] could be applied to these systems to develop the equation of state, which would determine the anomalies of the physical properties in this system, especially near the critical points.
Acknowledgements.
The authors thank Frédéric Caupin, Pablo G. Debenedetti, Francesco Sciortino, and Eugene I. Shakhnovich for useful discussions. This work is a part of the research collaboration between the University of Maryland, Princeton University, Boston University, and Arizona State University supported by the National Science Foundation. The research at Boston University was supported by NSF Award No. 1856496, while the research at the University of Maryland was supported by NSF award no. 1856479. S.V.B. acknowledges the partial support of this research through Bernard W. Gamson Computational Science Center at Yeshiva College.References
- Stanely [2013] H. E. Stanely, Liquid Polymorphism, edited by A. R. D. Stuart A. Rice, Advances in Chemical Physics, Vol. 152 (JohnWiley & Sons, 2013).
- Anisimov et al. [2018] M. A. Anisimov, M. Duška, F. Caupin, L. E. Amrhein, A. Rosenbaum, and R. J. Sadus, Thermodynamics of fluid polyamorphism, Phys. Rev. X 8, 011004 (2018).
- Tanaka [2020] H. Tanaka, Liquid–liquid transition and polyamorphism, J. Chem. Phys. 153, 130901 (2020).
- Franzese et al. [2001] G. Franzese, G. Malescio, A. Skibinsky, S. V. Buldyrev, and H. E. Stanley, Generic mechanism for generating a liquid-liquid phase transition, Nature 409, https://doi.org/10.1038/35055514 (2001).
- Sciortino [2011] F. Sciortino, Liquid–liquid transitions: Silicon in silico, Nat. Phys. 7, 523 (2011).
- Ohta et al. [2015] K. Ohta, K. Ichimaru, M. Einaga, S. Kawaguchi, K. Shimizu, T. Matsuoka, N. Hirao, and Y. Ohishi, Phase boundary of hot dense fluid hydrogen, Sci. Rep. 5, https://doi.org/10.1038/srep16560 (2015).
- McWilliams et al. [2016] R. S. McWilliams, D. A. Dalton, M. F. Mahmood, and A. F. Goncharov, Optical properties of fluid hydrogen at the transition to a conducting state, Phys. Rev. Lett. 116, 255501 (2016).
- Dzyabura et al. [2013] V. Dzyabura, M. Zaghoo, and I. F. Silvera, Evidence of a liquid–liquid phase transition in hot dense hydrogen, Proc. Natl. Acad. Sci. 110, 8040 (2013).
- Zaghoo et al. [2016] M. Zaghoo, A. Salamat, and I. F. Silvera, Evidence of a first-order phase transition to metallic hydrogen, Phys. Rev. B 93, 155128 (2016).
- Zaghoo and Silvera [2017] M. Zaghoo and I. F. Silvera, Conductivity and dissociation in liquid metallic hydrogen and implications for planetary interiors, Proc. Natl. Acad. Sci. 114, 11873 (2017).
- Vollhardt and Wölfle [1990] D. Vollhardt and P. Wölfle, The Superfluid Phases of Helium 3 (Taylor and Francis, London, UK, 1990).
- Schmitt [2015] A. Schmitt, Introduction to superfluidity (Springer International Publishing, Cham, 2015).
- Henry et al. [2020] L. Henry, M. Mezouar, G. Garbarino, D. Sifré, G. Weck, and F. Datchi, Liquid–liquid transition and critical point in sulfur, Nature 584, 382 (2020).
- Katayama et al. [2000] Y. Katayama, T. Mizutani, W. Utsumi, O. Shimomura, M. Yamakata, and K. ichi Funakoshi, A first-order liquid–liquid phase transition in phosphorus, Nature 403, 170 (2000).
- Katayama et al. [2004] Y. Katayama, Y. Inamura, T. Mizutani, M. Yamakata, W. Utsumi, and O. Shimomura, Macroscopic separation of dense fluid phase and liquid phase of phosphorus, Science 306, 848 (2004).
- Glosli and Ree [1999] J. N. Glosli and F. H. Ree, Liquid-liquid phase transformation in carbon, Phys. Rev. Lett. 82, 4659 (1999).
- Brazhkin et al. [1999] V. V. Brazhkin, S. V. Popova, and R. N. Voloshin, Pressure -temperature phase diagram of molten elements: selenium, sulfur and iodine, Physica B 265, 64 (1999).
- Plašienka et al. [2015] D. Plašienka, P. Cifra, and R. Martoňák, Structural transformation between long and short-chain form of liquid sulfur from ab initio molecular dynamics, J. Chem. Phys. 142, 154502 (2015).
- Saika-Voivod et al. [2004] I. Saika-Voivod, F. Sciortino, T. Grande, and P. H. Poole, Phase diagram of silica from computer simulation, Phys. Rev. E 70, 061507 (2004).
- Lascaris et al. [2014] E. Lascaris, M. Hemmati, S. V. Buldyrev, H. E. Stanley, and C. A. Angell, Search for a liquid-liquid critical point in models of silica, J. Chem. Phys. 140, 224502 (2014).
- Chen et al. [2017] R. Chen, E. Lascaris, , and J. C. Palmer, Liquid–liquid phase transition in an ionic model of silica, J. Chem. Phys. 146, 234503 (2017).
- Sastry and Angell [2003] S. Sastry and C. A. Angell, Liquid–liquid phase transition in supercooled silicon, Nat. Mater. 2, 739 (2003).
- Holten and Anisimov [2012] V. Holten and M. A. Anisimov, Entropy-driven liquid–liquid separation in supercooled water, Sci. Rep. 2, 713 (2012).
- Gallo et al. [2016] P. Gallo, K. Amann-Winkel, C. A. Angell, M. A. Anisimov, F. Caupin, C. Chakravarty, E. Lascaris, T. Loerting, A. Z. Panagiotopoulos, J. Russo, J. A. Sellberg, H. E. Stanley, H. Tanaka, C. Vega, L. Xu, and L. G. M. Pettersson, Water: A tale of two liquids, Chem. Rev. 116, 7463 (2016).
- Duška [2020] M. Duška, Water above the spinodal, J. Chem. Phys. 152, 174501 (2020).
- Caupin and Anisimov [2019] F. Caupin and M. A. Anisimov, Thermodynamics of supercooled and stretched water: Unifying two-structure description and liquid-vapor spinodal, J. Chem. Phys. 151, 034503 (2019).
- Poole et al. [1992] P. H. Poole, F. Sciortino, U. Essmann, and H. E. Stanley, Phase behavior of metastable water, Nature 360, 324 (1992).
- Holten et al. [2014] V. Holten, J. C. Palmer, P. H. Poole, P. G. Debenedetti, and M. A. Anisimov, Two-state thermodynamics of the st2 model for supercooled water, J. Chem. Phys. 104502, https://doi.org/10.1063/1.4867287 (2014).
- Debenedetti et al. [2020] P. G. Debenedetti, F. Sciortino, and G. H. Zerze, Second critical point in two realistic models of water, Science 369, 289 (2020).
- Biddle et al. [2017] J. W. Biddle, R. S. Singh, E. M. Sparano, F. Ricci, M. A. González, C. Valeriani, J. L. F. Abascal, P. G. Debenedetti, M. A. Anisimov, , and F. Caupin, Two-structure thermodynamics for the tip4p/2005 model of water covering supercooled and deeply stretched regions, J. Chem. Phys. 146, 034502 (2017).
- Debenedetti [1998] P. G. Debenedetti, One substance, two liquids?, Nature 392, 127 (1998).
- Longo and Anisimov [2022] T. J. Longo and M. A. Anisimov, Phase transitions affected by natural and forceful molecular interconversion, J. Chem. Phys. 156, 084502 (2022).
- Caupin and Anisimov [2021] F. Caupin and M. A. Anisimov, Minimal microscopic model for liquid polyamorphism and waterlike anomalies, Phys. Rev. Lett. 127, 185701 (2021).
- Sauer and Borst [1967] G. E. Sauer and L. B. Borst, Lambda transition in liquid sulfur, Science 158, 1567 (1967).
- Bellissent et al. [1994] R. Bellissent, L. Descotes, and P. Pfeuty, Polymerization in liquid sulphur, J. Phys.: Condens. Matte 6, A211 (1994).
- Kozhevnikov et al. [2004] V. F. Kozhevnikov, W. B. Payne, J. K. Olson, C. L. McDonald, and C. E. Inglefield, Physical properties of sulfur near the polymerization transition, J. Chem. Phys. 121 (2004).
- Tobolsky and Eisenberg [1959] A. V. Tobolsky and A. Eisenberg, Equilibrium polymerization of sulfur, J. Am. Chem. Soc. 81, 780 (1959).
- Eisenberg and Tobolsky [1960] A. Eisenberg and A. V. Tobolsky, Equilibrium polymerization of selenium, J. Pol. Sci. 46, https://doi.org/10.1002/pol.1960.1204614703 (1960).
- Morales et al. [2010] M. A. Morales, C. Pierleoni, E. Schwegler, and D. M. Ceperley, Evidence for a first-order liquid-liquid transition in high-pressure hydrogen from ab initio simulations, Proc. Natl. Acad. Sci. 107, 12799 (2010).
- Pierleoni et al. [2016] C. Pierleoni, M. A. Morales, G. Rillo, M. Holzmann, and D. M. Ceperley, Liquid–liquid phase transition in hydrogen by coupled electron–ion monte carlo simulations, Proc. Natl. Acad. Sci. 113, 4953 (2016).
- Geng et al. [2019] H. Y. Geng, Q. Wu, M. Marqués, and G. J. Ackland, Thermodynamic anomalies and three distinct liquid-liquid transitions in warm dense liquid hydrogen, Phys. Rev. B 100, 134109 (2019).
- Hinz et al. [2020] J. Hinz, V. V. Karasiev, S. X. Hu, M. Zaghoo, D. Mejía-Rodríguez, S. B. Trickey, and L. Calderín, Fully consistent density functional theory determination of the insulator-metal transition boundary in warm dense hydrogen, Phys. Rev. Research 2, 032065 (2020).
- Cheng et al. [2020] B. Cheng, G. Mazzola, C. J. Pickard, and M. Ceriotti, Evidence for supercritical behaviour of high-pressure liquid hydrogen, Nature 585, 217 (2020).
- Goncharov and Geballe [2017] A. F. Goncharov and Z. M. Geballe, Comment on “evidence of a first-order phase transition to metallic hydrogen”, Phys. Rev. B 96, 157101 (2017).
- Howie et al. [2017] R. T. Howie, P. Dalladay-Simpson, and E. Gregoryanz, Comment on “evidence of a first-order phase transition to metallic hydrogen”, Phys. Rev. B 96, 157102 (2017).
- Silvera et al. [2017] I. F. Silvera, M. Zaghoo, and A. Salamat, Reply to “comment on ‘evidence of a first-order phase transition to metallic hydrogen’ ”, Phys. Rev. B 96, 237102 (2017).
- Zaccarelli et al. [2005] E. Zaccarelli, S. V. Buldyrev, E. L. Nave, A. J. Moreno, I. Saika-Voivod, F. Sciortino, and P. Tartagliae, Model for reversible colloidal gelation, Phys. Rev. Lett. 94, 218301 (2005).
- Speedy and Debenedetti [1994] R. J. Speedy and P. G. Debenedetti, The entropy of a network crystal, fluid and glass, Mol. Phys. 81, 237 (1994).
- Speedy and Debenedetti [1996] R. J. Speedy and P. G. Debenedetti, The distribution of tetravalent network glasses, Mol. Phys. 88, 1293 (1996).
- Stell and Hemmer [1972] G. Stell and P. C. Hemmer, Phase transitions due to softness of the potential core, J. Chem. Phys. 56, 4274 (1972).
- Stillinger and Head-Gordon [1993] F. H. Stillinger and T. Head-Gordon, Perturbational view of inherent structures in water, Phys. Rev. E 47, 2484 (1993).
- Jagla [2001] E. A. Jagla, Liquid-liquid equilibrium for monodisperse spherical particles, Phys. Rev. E 63, 061501 (2001).
- Gibson and Wilding [2006] H. M. Gibson and N. B. Wilding, Metastable liquid-liquid coexistence and density anomalies in a core-softened fluid, Phys. Rev. E 73, 061507 (2006).
- Skibinsky et al. [2004] A. Skibinsky, S. V. Buldyrev, G. Franzese, G. Malescio, and H. E. Stanley, Liquid-liquid phase transitions for soft-core attractive potentials, Phys. Rev. E 69, 61206 (2004).
- Buldyrev et al. [2010] S. V. Buldyrev, P. Kumar, S. Sastry, H. E. Stanley, and S. Weiner, Hydrophobic collapse and cold denaturation in the jagla model of water, J. Phys.: Condens. Matter 22, 284109 (2010).
- Flory [1941] P. J. Flory, Thermodynamics of high polymer solutions, J. Chem. Phys. 9, 660 (1941).
- Huggins [1941] M. L. Huggins, Solutions of long chain compounds, J. Chem. Phys. 9, 440 (1941).
- Chan and Rey [1996] P. K. Chan and A. D. Rey, Polymerization-induced phase separation. 1. droplet size selection mechanism, Macromolecules 29, 8934 (1996).
- Luo [2006] K. Luo, The morphology and dynamics of polymerization-induced phase separation, European Polymer Journal 42, 1499 (2006).
- Hildebrand and Scott [1962] J. Hildebrand and R. Scott, Regular Solutions, Prentice-Hall international series in chemistry (Prentice-Hall, 1962).
- Alder and Wainwright [1959] B. J. Alder and T. E. Wainwright, Studies in molecular dynamics. i. general method, J. Chem. Phys. 31, 459 (1959).
- Rapaport [2004] D. C. Rapaport, The Art of Molecular Dynamics Simulation, 2nd ed. (Cambridge University Press, Cambridge, UK, 2004).
- Buldyrev [2009] S. Buldyrev, Application of discrete molecular dynamics to protein folding and aggregation, in Aspects of Physical Biology, Lecture Notes in Physics, Vol. 752, edited by G. Franzese and M. Rubi (Springer-Verlag, Berlin, Heidelberg, 2009) pp. 97–132.
- Berendsen et al. [1984] H. J. C. Berendsen, J. P. M. Postma, W. F. van Gunsteren, A. DiNola, and J. R. Haak, Molecular-dynamics with coupling to an external bath, J. Chem. Phys. 81, 3684 (1984).
- Luo et al. [2015] J. Luo, L. Xu, C. A. Angell, H. E. Stanley, and S. V. Buldyrev, Physics of the jagla model as the liquid-liquid coexistence line slope varies, J. Chem. Phys. 142, 224501 (2015).
- Xu et al. [2005] L. Xu, P. Kumar, S. V. Buldyrev, S.-H. Chen, P. H. Poole, F. Sciortino, and H. E. Stanley, Relation between the widom line and the dynamic crossover in systems with a liquid–liquid phase transition, Proc. Natl. Acad. Sci. 102, 16558 (2005).
- Lide [2003] D. R. Lide, CRC Handbook of Chemistry and Physics, 85th ed. (CRC Press, Boca Raton, FL, 2003).