Ultrafast modulation of vibrational polaritons for controlling the quantum field statistics at mid-infrared frequencies
Abstract
Controlling the quantum field statistics of confined light is a long-standing goal in integrated photonics. We show that by coupling molecular vibrations with a confined mid-infrared cavity vacuum, the photocount and quadrature field statistics of the cavity field can be reversibly manipulated over sub-picosecond timescales. The mechanism involves changing the cavity resonance frequency through a modulation of the dielectric response of the cavity materials using femtosecond UV pulses. For a single anharmonic molecular vibration in an infrared cavity under ultrastrong coupling conditions, the pulsed modulation of the cavity frequency can adiabatically produce mid-infrared light that is simultaneously sub-Poissonian and quadrature squeezed, depending on the dipolar behavior of the vibrational mode. For a vibration-cavity system in strong coupling, non-adiabatic polariton excitations can be produced after the frequency modulation pulse is over, when the system is initially prepared in the lower polariton state. We propose design principles for the generation of mid-infrared quantum light by analyzing the dependence of the cavity field statistics on the shape of the electric dipole function of the molecule, the cavity detuning at the modulation peak and the anharmonicity of the Morse potential. Feasible experimental implementations of the modulation scheme are suggested. This work paves the way for the development of molecule-based mid-infrared quantum optical devices at room temperature.
I Introduction
Quantum light sources are key to the success of optical quantum technologies [1]. In the visible spectral range, several mechanisms are available to produce quantum light, such as single photon emission by atoms in optical resonators [2, 3], photon blockade in cavity optomechanics [4], or ensemble strong coupling with atomic emitters [5]. In the near infrared (), quantum light generation is a mature technology that has become the workhorse for applications in quantum communication [6, 7] and sensing [8, 9]. Quantum-efficient semiconductor [10] and superconductor [11] photodetectors are broadly available in this frequency range. In contrast, quantum optical tools in the mid-infrared spectral region () are much less developed [12, 13]. Quantum cascade lasers have been used to produce mid infrared quantum light [14] and early demonstrations of quantum light detection in this frequency regime are available [15, 16].
In this work, we introduce a new mechanism for the deterministic generation and dynamical manipulation of quantum light in the mid-infrared frequency range. The mechanism involves ultrafast modulation of the confined mid infrared vacuum field under strong and ultrastrong light-matter coupling. Strong vibration-cavity coupling has been demonstrated with Fabry-Perot cavities [17, 18, 19, 20, 21, 22, 23, 24, 25], plasmonic resonators [26, 27], van der Waals resonators [28] and polar dielectric resonators [29]. Ultrastrong coupling [30, 31] has also been demonstrated in the mid-infrared [32, 33, 34]. The proposed modulation of the light-matter dynamics is based on the transient modification of the dielectric function of the materials that confine the infrared vacuum by driving interband transitions with a driving source. The associated change in boundary conditions for the electromagnetic field results in a parametric change of the cavity vacuum frequency that is related with the dynamical Casimir effect [35]. This frequency modulation mechanism has been demonstrated for mid-infrared resonators using electrical [36], chemical [37] or electromagnetic [38, 39] driving sources.
We consider a scheme where the mid infrared cavity frequency () is modulated over sub-picosecond timescales by using a single femtosecond UV pulse that drives a target cavity boundary material to transiently modify its carrier density. We assume a nanophotonics scenario where the intracavity medium has a single anharmonic molecular vibration in the ground electronic state, protected by design of the photonic structure from the UV source. We show that the photocount and quadrature field statistics of the infrared cavity field is transiently modified by the frequency modulation pulse and correlate the predicted changes with the intrinsic properties of the molecular vibration and the light-matter interaction process.
The article is organized as follows: In Sec. II, we review the theoretical framework for cavity quantum electrodynamics with anharmonic molecular vibrations, and the numerically methods used for unitary wavepacket propagation. We also review the relevant concepts of quantum field statistics. We study the evolution of the intracavity field statistics for a Gaussian frequency modulation in vibrational ultrastrong coupling in Sec. III and discuss strong coupling in Sec. IV. We conclude and discuss possible experimental realizations in Sec. VI.
II Methodology
II.1 MLQR model with cavity frequency modulation
We model light-matter interaction of a confined cavity mode of frequency with a single anharmonic vibration mode of fundamental frequency in the mid-infrared as a Morse oscillator using the multi-level quantum Rabi (MLQR) model [40, 41], recently developed to consistently describe the strong and ultrastrong vibration-cavity coupling regimes in the electric dipole approximation [42]. Taking into account the possible time-dependence of the cavity frequency due to external UV pulse driving, the corresponding MLQR Hamiltonian can be written in coordinate space as (in atomic units)
where the vibrational Hamiltonian includes the nuclear kinetic energy and the potential energy along the mass-weighted normal mode coordinate . The second and third terms describe the quantized cavity oscillator with quadrature operator and frequency . The last term is the electric dipole light-matter coupling, proportional to the amplitude of the vacuum fluctuations at the cavity frequency .
The light-matter coupling strength is given in terms of the dimensionless parameter , which is equivalent to the conventional Rabi coupling ratio [30, 31] for , where and are the ground and first excited vibrational levels, is the electric dipole function [43] and . The onset of the conventional ultrastrong coupling regime is thus reached when [31]. Strong coupling implies .
Under UV pulse driving, the cavity frequency is taken to vary according to a Gaussian function as
| (2) |
where the undriven cavity frequency being resonant with the fundamental vibration frequency (). As anticipated above, we assume the cavity frequency shifts at the UV pulse peak by up to 20% (), red-detuned (minus sign) or blue-detuned (plus sign) relative to the undriven resonance frequency. According to Eq. (LABEL:eq:hamiltonian), the frequency modulation not only changes the vibration-cavity detuning, but also the light-matter interaction strength. For the cases that will be discussed below, the peak modulation corresponds to changes in light-matter coupling energy of for (strong coupling), and for (ultrastrong coupling). Throughout this work, we assume the pulse is centered at fs and the width parameter is fs (FWHM = fs).
| [eV] | [a.u.] | [bohr] | [cm-1] | |
| 6.80 | 1.50 | 4.0 | 31.9 | |
| 9.80 | 1.25 | 4.0 | 22.1 | |
| [Debye] | [bohr] | [bohr] | bohr | |
| 5.08 | 4.0 | 4.0 | 0.6 | |
| 2.54 | 2.7 | 4.5 | 0.6 |
II.2 Dipolar Morse oscillator
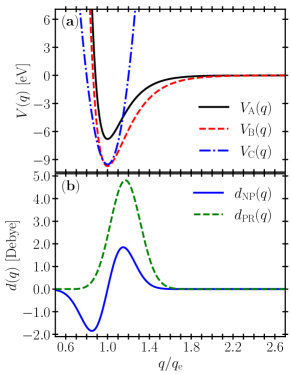
To understand the influence of the spectral anharmonicity and the dipolar structure of molecular vibrations on the unitary evolution of the frequency-modulated cavity field, we combine three different vibrational potentials and two dipole moment functions to search for conditions that are most effective at producing dramatic changes in the quantum field statistics of the infrared field.
For anharmonic vibrations we use the Morse potential [44]
| (3) |
where is the classical dissociation energy, the equilibrium mode coordinate, and the anharmonicity parameter. For , the Morse potential can be accurately truncated at second order in , giving the harmonic oscillator. In Table 1, we list the parameters for the two Morse potentials shown in Fig. 1a. To ensure a fair comparison between anharmonic and harmonic potentials, the parameters in Table 1 give the same vibrational frequency cm-1, which is representative of the vibrational modes used for light-matter coupling in experiments [26, 45, 46]. The harmonic potential in Fig. 1 also has the same .
The electric dipole function along the vibrational coordinate is modeled as [40, 41]
| (4) |
which accurately captures the dipole nature of diatomic and polyatomic molecules, depending on the choice of parameters , , and [46]. The set of dipole parameters used in this work are given in Table 1. These are chosen to describe the behavior of non-polar vibrations (), which due to nuclear symmetry have a vanishing dipole moment at equilibrium (), but acquire a finite dipole moment away from the equilibrium geometry. Examples of this behavior include the degenerate CO stretching mode in iron pentacarbonyl [32]. The other dipole behavior of interest corresponds to polar-right molecules [41], which have a finite dipole moment at equilibrium that further increases as the mode distance increases. Examples of this behavior include lithium fluoride [47]. In Fig. 1b we show the dipole functions that correspond to the parameters in Table 1. Below we study combinations of these potentials and dipole functions to compute the unitary light-matter interaction dynamics of frequency-driven cavity fields.
II.3 MCTDH unitary polariton propagation
For accurately computing the quantum field statistics of cavity photons subject to ultrafast frequency modulation, we solve the time-dependent Schrödinger equation in coordinate space with a Hamiltonian given by Eq. (LABEL:eq:hamiltonian) using the multi-configurational time-dependent Hartree (MCTDH) method [48, 49], explicitly developed for the accurate and scalable treatment of strongly coupled anharmonic oscillators, as they commonly occur in photochemistry [50]. The MCTDH method has been successfully used to study strong and ultrastrong light-matter coupling of realistic molecules with quantized optical [51, 47] and infrared cavity fields [41, 52].
In MCTDH, the system wave function is written in continuous coordinate space by the ansatz
| (5) |
which is an expansion in products of the molecular basis functions and cavity mode functions . To obtain the results below, we set and represent the vibrational motion in an uniform grid with grid points on the interval Bohr. The cavity mode is described by a harmonic oscillator basis in a uniform grid with grid points along the dimensionless interval , which is enough to capture the Fock states that participate in the dynamics.
The wavefunction ansatz in Eq. (5) is inserted in the Schrödinger equation to obtain a set of coupled nonlinear equations for the amplitudes and one-dimensional functions and , which are solved numerically using Runge-Kutta propagators. Eigenstates of the coupled system Hamiltonian can also be obtained in the MCTDH method via propagation in imaginary time [53], which is used to initialize the coordinate-space wavefunction into a Hilbert space vibrational polariton eigenstate [54, 50, 41].
II.4 Cavity Field Statistics
The study of intensity and field quadrature correlations is used in quantum optics to distinguish classical and non-classical light sources [55]. The normalized intensity correlation at zero delay is commonly used to identify light sources in which photons are bunched or anti-bunched [56]. This photocounting behavior is quantified by the Mandel parameter of the intracavity field, given by [57]
| (6) |
where is the expectation value of photon number operator and is the photon number variance. For a classical laser source that has a Poissonian photocount distribution, the Mandel parameter is [56]. For sub-Poissonian light sources we have (Fock state, squeezed vacuum) and for super-Poissonian sources we have (e.g., thermal light, entangled photon pairs).
Phase space squeezing is an alternative metric for characterizing quantum light sources. This is done by comparing the variances of the electric field quadratures and relative to the vacuum Fock state [56]. For vacuum, the normalized quadrature variances are . Quadrature squeezing implies that or , i.e., one of the quadratures components has less quantum noise than the standard vacuum. In terms of the generalized phase space quadrature , the squeezing factor (in dB) is defined as [58], where is a phase space angle that can be experimentally tuned using homodyne techniques. We only consider cases with and in this article.
III Cavity Frequency Modulation in Ultrastrong Coupling
In this Section we study the evolution of the Mandel parameter, the cavity number variance , and the generalized quadrature variance of the intracavity field , for a coupled vibration-cavity system with a photon frequency modulated according to Eq. (2). The ultrastrong coupling regime is assumed () for a system initialized in the ground state or the lower polariton state prior to the modulation pulse. We compare the unitary cavity field evolutions obtained for different types of dipole functions and different signs of the peak modulation parameter . In Sec. IV, a similar analysis is carried out for a strong coupling scenario ().
III.1 Initial Ground State
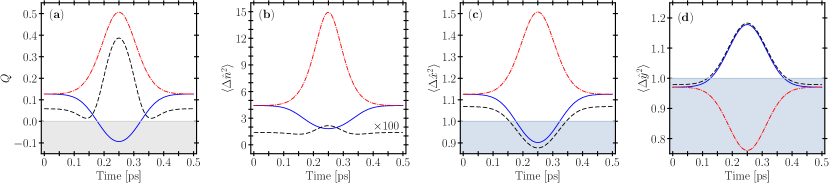
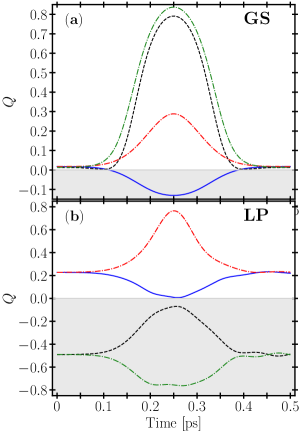
In Figure 2 we show the evolution of the Mandel parameter, number variance, and quadrature variances at and , for a coupled vibration-cavity system that is initially in the ground state before modulation. The Rabi coupling parameter is and the cavity is initially on resonance with the fundamental vibration frequency . Three cases are highlighted, differing in the type dipole function and peak frequency shift : polar-right vibration with blue cavity detuning (); polar-right vibration with red cavity detuning (), and non-polar vibration with blue cavity detuning (). We use the Morse potential in Table 1 in all cases.
Figure 2 shows that without frequency modulation, the ground state for polar-right vibrations is slightly super-Poissonian (), the number variance is relatively large ( photons), there is no squeezing in the -direction, and the -quadrature is only weakly squeezed ( dB) for the chosen . For non-polar vibrations, the ground state behaves qualitatively similar to the polar-right case, but the number variance is two orders of magnitude smaller. Significant differences between polar and non-polar species become more evident under frequency modulation.
For polar-right molecules we find an asymmetry in the evolution of the cavity field observables depending on the sign of the modulation amplitude . For blue frequency modulations (), the ground state becomes transiently sub-Poissonian at the modulation peak (see Fig. 2a), largely driven by a significant decrease of the number variance (see Fig. 2b). The -quadrature also becomes squeezed by dB at the modulation peak (see Fig. 2c), accompanied by the increase in the -quadrature variance (see Fig. 2d). In contrast, for red modulations () the same polar-right vibrational mode generates a cavity field with super-Poissonian statistics () at the modulation peak, associated with a significant increase in the number variance (see Fig. 2b). The -quadrature variance grows relative to the modulation-free value, and the conjugate -quadrature becomes squeezed dB at the modulation peak.
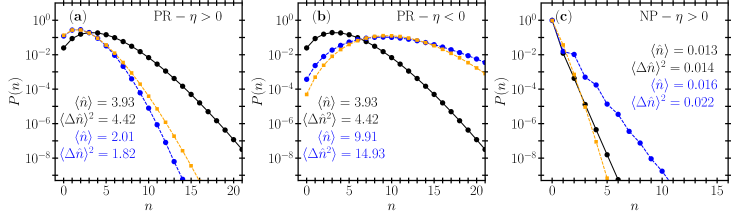
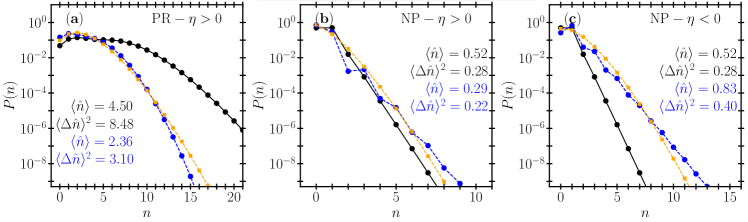
In order to understand this behavior, in Fig. 3 we show the corresponding photocount distributions before and during the cavity frequency modulation. In Fig. 3a, we show the decrease of the average photon number and variance predicted for polar-right molecules at the peak of a blue modulation, relative to the initial coupled ground state. This decrease is responsible for the change in the parameter around the Poissonian limit in Fig. 2a. For comparison, we also show the exact Poissonian distribution for a coherent state with the same average photon number as the system at the modulation peak. For blue modulations the overlap of the driven system with the coherent state distribution can be significant, but for red modulations the deviations from a coherent state are large at low (see Fig. 3b).
The distributions for non-polar vibrations with and without frequency modulation are shown in Fig. 3c. Without modulation, the photon number and number variance of the coupled ground state are orders of magnitude smaller than the case of polar vibrations. This is consistent with previous works [40, 41]. Despite the small absolute numbers, Fig. 3c shows that the photocount distribution broadens at the peak of a blue modulation shown, which explains the increase of the number variance in Fig. 2b.
III.2 Initial Lower Polariton
We now carry out the analysis from the previous section on a coupled system that is initialized in the lower polariton state at ultrastrong coupling (). Excited polariton population is commonly produced in non-linear cavity infrared spectroscopy experiments [46]. We again study polar-right and non-polar vibrations under blue frequency modulation, but now also analyze the dynamics of non-polar molecules under red modulation .
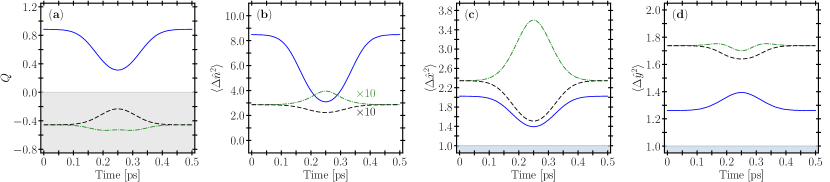
Figure 4a shows that lower polariton state for is super-Poissonian () for polar-right molecules and sub-Poissonian for non-polar vibrations (). The number variance is large for polar-right vibrations ( photons), but is an order of magnitude smaller for non-polar species (see Fig. 4b). Moreover, there is no squeezing in the - or - quadrature in either case. Under pulsed frequency modulation, the cavity observables vary significantly for the molecular species considered, although the sign of the Mandel parameter does not change for the pulse parameters used. In contrast with the ground state analysis in Sec. III.1, frequency modulating the lower polariton does not generate squeezing at the modulation peak (see Figs. 4c and 4d). The corresponding photocount distributions with and without modulation are shown in Fig. 5. The deviation of the number distribution from a classical coherent state is more notorious for both polar and non-polar species. For non-polar vibrations, Figs. 5b and 5c show that the frequency modulation mainly changes the contribution of low- Fock states.
IV Non-Adiabatic Excitations in Vibrational Strong Coupling
In Sec. III we studied the ultrastrong coupling regime of Eq. (LABEL:eq:hamiltonian) by setting . For the Morse potential (see Table 1), this corresponds to the Rabi coupling strength cm-1 and a Rabi splitting of cm-1 in linear transmission for polar-right vibrations (greater than ). Although such splitting magnitudes are currently beyond experimental reach with Fabry-Perot resonators [32], expected improvements in mid-infrared resonator technology may facilitate ultrastrong coupling studies in the near future [33].
In this Section we explore the cavity field statistics subject to a photon frequency modulation under strong coupling conditions, which are experimentally accessible with current resonator technology [19, 20]. For this we set , corresponding to Rabi splittings no greater than cm-1. The main qualitative difference expected in strong coupling is that the polariton spectrum can have energy gaps that are comparable with the bandwidth of modulation pulse . For the modulation pulse assumed in this work ( fs) the bandwidth is cm-1. Whenever an eigenstate state that has a nearby energy gap comparable or smaller than is driven in frequency, non-adiabatic excitations can be expected to remain in the system after the pulse is over [59].
We illustrate this effect in Figure 6, where we compare the evolution of the Mandel parameter a vibration-cavity system initialized either in the ground state (Fig. 6a) or the lower polariton eigenstate (Fig. 6b) before the modulation pulse. The coupling parameter is , which would give a Rabi splitting of 288 cm-1 in linear transmission. Curves are shown for polar-right and non-polar vibrations under red and blue modulations ().
Figure 6a shows that an initial ground state evolves in a qualitatively similar way to the ultrastrong coupling case in Fig. 2a, with small differences in the values of before and during the modulation pulse. The driven wavefunction returns adiabatically to initial ground state after the pulse is over ( ps), because the energy gap to the first excited (lower) polariton level (1648 cm-1 for polar-right vibrations) far exceeds the modulation bandwitdh . In other words, no residual post-pulse excitations remain in the system.
In contrast, Figure 6b shows that although starting from the lower polariton state can lead to an evolution of the parameter with the same trends in Fig. 4a for ultrastrong coupling, the pulse turn-off dynamics is qualitatively different. For , the energy gap between the lower and upper polariton eigenstates is cm-1 for polar vibrations and cm-1 for non-polar molecules, The latter is not much greater than the modulation bandwidth . We therefore expect the system wavefunction to exhibit non-adiabatic excitations after the modulation pulse is over. This manifests in Fig. 6b in an oscillatory behavior of the Mandel parameter as the pulse turns off.
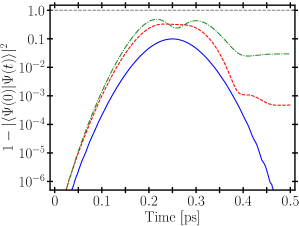
We quantify the non-adiabatic excitations generated on the initial lower-polariton wavefunction in Fig. 7 for polar-right vibrations under red frequency modulation. Analogue results are found for other dipole functions and values of . The degree of adiabaticity of the system evolution is quantified by the autocorrelation function . For an adiabatic pulse modulation, the post-pulse autocorrelation should not differ from unity. Figure 7 shows that this is indeed the case for a driven ground state (solid line), which as mentioned above is associated with a large energy gap to the first excited polariton level (). In contrast, for a driven lower polariton state the post-pulse autocorrelation () can be significantly different from unity, depending on the magnitude of the Rabi splitting. For example, while for the system wavefunction is left with about 0.1% of non-adiabatic excitations after the pulse is over (see Fig. 7, dashed line), for the residual population outside the lower polariton after the pulse is over is already a few percent (Fig. 7, dot-dashed line), which is feasible to detect in nonlinear infrared spectroscopy [46]. This non-adiabatic excitations occur due to the small energy gap between the lower and upper polariton levels, relative to the modulation bandwidth ( for polar right vibrations).
V Dependence on the vibrational anharmonicity
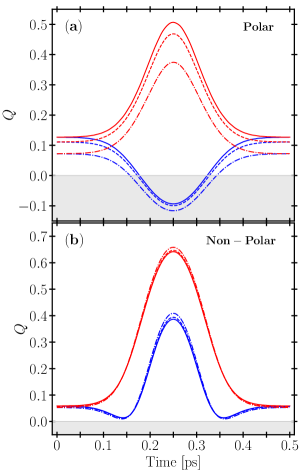
Molecular vibrations can in principle have similar electric dipole behavior but differ in the spectral anharmonicity of the nuclear potential. Here we explore the evolution of the Mandel parameter in ultrastrong coupling (), for the same frequency modulation in the previous sections. We compare the Morse potentials Morse potentials and in Table 1, which have the same fundamental frequency but different anharmonicity parameters. The latter is quantified by the anharmonic shift , where is the energy gap between the and vibrational levels. For we have cm-1 and for we have cm-1. For comparison we also consider the purely harmonic case (). We focus on a system initialized in the ground state, but similar conclusions are found for excited initial states.
In Fig. 8a we show the evolution of the parameter for polar-right molecules in ultrastrong coupling. The curves for under blue modulation (blue solid line) and red modulation (red solid line) of the cavity frequency simply reproduce the results in Fig. 2a. Reducing the anharmonicity does not qualitatively change the dynamics of the field statistics, i.e., the state can still shift from super-Poissonian to sub-Poissonian for blue modulations (), but the magnitude of the changes are slightly different. For example, the ground state parameter before modulation follows the same hierarchy as the degree of anharmonicity, i.e., , where is the harmonic oscillator limit of the ground state at this value of . The figure also shows that the relative variations at the modulation peak relative to the initial state, are fairly insensitive to the anharmonicity parameter . Additional calculations carried out over a broader range values of confirm this statement.
Figure 8b finally shows that at least for a frequency-modulated ground state, no significant dependence with the spectral anharmonicity is expected for the evolution of the parameter for non-polar molecular vibrations. These results are consistent with previous works [40, 41], which show that light-matter systems with non-polar molecules are similar to two-level systems and harmonic oscillators with vanishing permanent dipole moments.
VI Conclusions
| Case | |||||||||
|---|---|---|---|---|---|---|---|---|---|
| i | PR | GS | 0.13 | -0.51 | 0.13 | -0.09 | 0.45 | -0.71 | |
| ii | PR | GS | 0.13 | -0.51 | 0.13 | 0.51 | -1.78 | 1.18 | |
| iii | PR | LP | 0.88 | -3.06 | -1.01 | 0.31 | -1.44 | -1.44 | |
| iv | PR | LP | 0.88 | -3.06 | -1.01 | 1.99 | -4.96 | -0.40 | |
| v | NP | GS | 0.06 | -0.29 | 0.09 | 0.38 | 0.57 | -0.73 | |
| vi | NP | GS | 0.06 | -0.29 | 0.09 | 0.64 | -1.37 | 1.12 | |
| vii | NP | LP | -0.46 | -3.70 | -2.40 | -0.23 | -1.79 | -2.15 | |
| viii | NP | LP | -0.46 | -3.70 | -2.40 | -0.53 | -5.56 | -2.31 |
We have shown that the quantum statistics of mid-infrared cavity fields can be dynamically controlled with an ultrafast modulation of the cavity frequency over sub-picosecond timescales, by changing the reflectivity of the conducting cavity mirrors using femtosecond UV pulses. For shifts of the cavity frequency at the modulation peak, we predict the expected changes in the photocount and quadrature field statistics of the intracavity field by computing the sub-picosecond unitary dynamics of the underlying cavity-vibration polariton Hamiltonian using numerically exact techniques (see Sec. II).
The dynamics of quantum field statistics is described in terms of the shape of electric dipole function, the anharmonicity of the molecular system, light-matter coupling strength, and whether the system is initially prepared in the ground or lower polariton state before the frequency modulation pulse. For a coupled system in the vibrational ultrastrong coupling (VUSC) regime the cavity field dynamics is adiabatic, while under vibrational strong coupling (VSC) non-adiabatic excitations are possible, provided that the energy gap between the lower and upper polariton levels is comparable with the bandwidth of the frequency modulation pulse.
The results obtained in this work are summarized in Table 2, where predicted values of the Mandel parameter and squeezing factor before the modulation () and at the modulation peak () are given for a single Morse potential () in ultrastrong coupling (), for different polarities of the vibrational mode, different initial states, and different cavity frequency modulations.
As a general rule, we find that the dipolar nature of molecular vibrations is more important descriptor of the degree of control that can be expected for the quantum field statistics in mid-infrared cavities than the anharmonicity of vibrational spectrum. We also find that the photon statistics for polar-left vibrations [41] follows the same qualitative behavior with smaller values of and than in the case of polar-right species. Similarly, if the upper polariton (UP) is considered as the initial state before modulation, the Mandel parameter and squeezing factor behaves similar to the LP case, but the dynamics is reversed, i.e., evolution of the photon statistics under blue modulation for LP corresponds to dynamics with red modulation for the UP and viceversa.
Cavity designs for implementing the proposed scheme would build on Ref. [60], where the reflectivity of the conducting cavity mirrors is modulated by promoting interband transitions with ultrafast UV pulses. This mechanism was recently used to shift the infrared resonance frequency of a semiconducting/insulator nanoresonator structure [39]. Similar design principles could be used with infrared Fabry-Perot cavities with conducting mirror layers [61], including protecting layers that prevent UV photons from promoting intracavity molecules to electronic excited states. Given the feasibility of the proposed scheme, this work paves the way for the development of integrated molecule-assisted quantum light sources for applications in quantum metrology and photonic quantum information processing in the mid-infrared frequency range.
Acknowledgements.
We thank B. Simpkins, A. Dunkelberger and J. Owrutsky for technical discussions. J.F.T. is supported by ANID Postdoctoral Fellowship No. 3200565. F.H. is supported by ANID – FONDECYT Regular No. 1181743 and ANID – Millennium Science Initiative Program ICN17_012.References
- O’Brien et al. [2009] J. L. O’Brien, A. Furusawa, and J. Vučković, Photonic quantum technologies, Nature Photonics 3, 687 (2009).
- Daiss et al. [2019] S. Daiss, S. Welte, B. Hacker, L. Li, and G. Rempe, Single-photon distillation via a photonic parity measurement using cavity qed, Phys. Rev. Lett. 122, 133603 (2019).
- Weiher et al. [2019] K. Weiher, E. Agudelo, and M. Bohmann, Conditional nonclassical field generation in cavity qed, Phys. Rev. A 100, 043812 (2019).
- Aspelmeyer et al. [2014] M. Aspelmeyer, T. J. Kippenberg, and F. Marquardt, Cavity optomechanics, Rev. Mod. Phys. 86, 1391 (2014).
- Sáez-Blázquez et al. [2018] R. Sáez-Blázquez, J. Feist, F. J. García-Vidal, and A. I. Fernández-Domínguez, Photon statistics in collective strong coupling: Nanocavities and microcavities, Phys. Rev. A 98, 013839 (2018).
- Kimble [2008] H. J. Kimble, The quantum internet, Nature 453, 1023 (2008).
- Yu et al. [2015] L. Yu, C. M. Natarajan, T. Horikiri, C. Langrock, J. S. Pelc, M. G. Tanner, E. Abe, S. Maier, C. Schneider, S. Höfling, M. Kamp, R. H. Hadfield, M. M. Fejer, and Y. Yamamoto, Two-photon interference at telecom wavelengths for time-bin-encoded single photons from quantum-dot spin qubits, Nature Communications 6, 8955 (2015).
- Clark et al. [2021] A. S. Clark, M. Chekhova, J. C. F. Matthews, J. G. Rarity, and R. F. Oulton, Special topic: Quantum sensing with correlated light sources, Applied Physics Letters 118, 060401 (2021), https://doi.org/10.1063/5.0041043 .
- Vega et al. [2020] A. Vega, S. Saravi, T. Pertsch, and F. Setzpfandt, Pinhole quantum ghost imaging, Applied Physics Letters 117, 094003 (2020), https://doi.org/10.1063/5.0012477 .
- Zhang et al. [2015] J. Zhang, M. A. Itzler, H. Zbinden, and J.-W. Pan, Advances in ingaas/inp single-photon detector systems for quantum communication, Light: Science & Applications 4, e286 (2015).
- Natarajan et al. [2012] C. M. Natarajan, M. G. Tanner, and R. H. Hadfield, Superconducting nanowire single-photon detectors: physics and applications, Superconductor Science and Technology 25, 063001 (2012).
- Shields et al. [2020] T. Shields, S. Prabhakar, A. Dada, M. Ebrahim, G. G. Taylor, D. Morozov, K. Erotokritou, S. Miki, M. Yabuno, H. Terai, C. Gawith, M. Kues, L. Caspani, R. H. Hadfield, and M. Clerici, Mid-infrared quantum interference and polarization entanglement, in OSA High-brightness Sources and Light-driven Interactions Congress 2020 (EUVXRAY, HILAS, MICS) (Optical Society of America, 2020) p. MF1C.7.
- Spitz et al. [2021] O. Spitz, A. Herdt, J. Wu, G. Maisons, M. Carras, C.-W. Wong, W. Elsäßer, and F. Grillot, Private communication with quantum cascade laser photonic chaos, Nature Communications 12, 3327 (2021).
- Yao et al. [2012] Y. Yao, A. J. Hoffman, and C. F. Gmachl, Mid-infrared quantum cascade lasers, Nature Photonics 6, 432 (2012).
- Gabbrielli et al. [2021] T. Gabbrielli, F. Cappelli, N. Bruno, N. Corrias, S. Borri, P. D. Natale, and A. Zavatta, Mid-infrared homodyne balanced detector for quantum light characterization, Opt. Express 29, 14536 (2021).
- Mancinelli et al. [2017] M. Mancinelli, A. Trenti, S. Piccione, G. Fontana, J. S. Dam, P. Tidemand-Lichtenberg, C. Pedersen, and L. Pavesi, Mid-infrared coincidence measurements on twin photons at room temperature, Nature Communications 8, 15184 (2017).
- Shalabney et al. [2015a] A. Shalabney, J. George, J. Hutchison, G. Pupillo, C. Genet, and T. W. Ebbesen, Coherent coupling of molecular resonators with a microcavity mode, Nature Communications 6, 1 (2015a).
- Shalabney et al. [2015b] A. Shalabney, J. George, H. Hiura, J. A. Hutchison, C. Genet, P. Hellwig, and T. W. Ebbesen, Enhanced Raman Scattering from Vibro-Polariton Hybrid States, Angewandte Chemie International Edition 54, 7971 (2015b).
- George et al. [2015] J. George, A. Shalabney, J. A. Hutchison, C. Genet, and T. W. Ebbesen, Liquid-phase vibrational strong coupling, Journal of Physical Chemistry Letters 6, 1027 (2015).
- Long and Simpkins [2015] J. P. Long and B. S. Simpkins, Coherent coupling between a molecular vibration and fabry–perot optical cavity to give hybridized states in the strong coupling limit, ACS Photonics 2, 130 (2015).
- Grafton et al. [2021a] A. B. Grafton, A. D. Dunkelberger, B. S. Simpkins, J. F. Triana, F. J. Hernández, F. Herrera, and J. C. Owrutsky, Excited-state vibration-polariton transitions and dynamics in nitroprusside, Nature Communications 12, 214 (2021a).
- Xiang et al. [2019] B. Xiang, R. F. Ribeiro, Y. Li, A. D. Dunkelberger, B. B. Simpkins, J. Yuen-Zhou, and W. Xiong, Manipulating optical nonlinearities of molecular polaritons by delocalization, Science Advances 5, aax5196 (2019), https://advances.sciencemag.org/content/5/9/eaax5196.full.pdf .
- Dunkelberger et al. [2016] A. D. Dunkelberger, B. T. Spann, K. P. Fears, B. S. Simpkins, and J. C. Owrutsky, Modified relaxation dynamics and coherent energy exchange in coupled vibration-cavity polaritons, Nature Communications 7, 1 (2016).
- Xiang et al. [2018] B. Xiang, R. F. Ribeiro, A. D. Dunkelberger, J. Wang, Y. Li, B. S. Simpkins, J. C. Owrutsky, J. Yuen-Zhou, and W. Xiong, Two-dimensional infrared spectroscopy of vibrational polaritons, Proceedings of the National Academy of Sciences 115, 4845 (2018), https://www.pnas.org/content/115/19/4845.full.pdf .
- Dunkelberger et al. [2018a] A. Dunkelberger, R. Davidson, W. Ahn, B. Simpkins, and J. Owrutsky, Ultrafast Transmission Modulation and Recovery via Vibrational Strong Coupling, The Journal of Physical Chemistry A 122, 965 (2018a).
- Muller et al. [2018] E. A. Muller, B. Pollard, H. A. Bechtel, R. Adato, D. Etezadi, H. Altug, and M. B. Raschke, Nanoimaging and control of molecular vibrations through electromagnetically induced scattering reaching the strong coupling regime, ACS Photonics, ACS Photonics 5, 3594 (2018).
- Metzger et al. [2019] B. Metzger, E. Muller, J. Nishida, B. Pollard, M. Hentschel, and M. B. Raschke, Purcell-enhanced spontaneous emission of molecular vibrations, Phys. Rev. Lett. 123, 153001 (2019).
- Autore et al. [2018] M. Autore, P. Li, I. Dolado, F. J. Alfaro-Mozaz, R. Esteban, A. Atxabal, F. Casanova, L. E. Hueso, P. Alonso-González, J. Aizpurua, A. Y. Nikitin, S. Vélez, and R. Hillenbrand, Boron nitride nanoresonators for phonon-enhanced molecular vibrational spectroscopy at the strong coupling limit, Light: Science & Applications 7, 17172 (2018).
- Folland et al. [2020] T. G. Folland, G. Lu, A. Bruncz, J. R. Nolen, M. Tadjer, and J. D. Caldwell, Vibrational coupling to epsilon-near-zero waveguide modes, ACS Photonics 7, 614 (2020).
- Kockum et al. [2019] A. F. Kockum, A. Miranowicz, S. De Liberato, S. Savasta, and F. Nori, Ultrastrong coupling between light and matter, Nature Reviews Physics 1, 19 (2019), 1807.11636 .
- Forn-Díaz et al. [2019] P. Forn-Díaz, L. Lamata, E. Rico, J. Kono, and E. Solano, Ultrastrong coupling regimes of light-matter interaction, Rev. Mod. Phys. 91, 25005 (2019).
- George et al. [2016] J. George, T. Chervy, A. Shalabney, E. Devaux, H. Hiura, C. Genet, and T. W. Ebbesen, Multiple Rabi Splittings under Ultrastrong Vibrational Coupling, Physical Review Letters 117, 153601 (2016).
- Askenazi et al. [2017] B. Askenazi, A. Vasanelli, Y. Todorov, E. Sakat, J.-J. Greffet, G. Beaudoin, I. Sagnes, and C. Sirtori, Midinfrared ultrastrong light–matter coupling for thz thermal emission, ACS Photonics, ACS Photonics 4, 2550 (2017).
- Yoo et al. [2021] D. Yoo, F. de León-Pérez, M. Pelton, I.-H. Lee, D. A. Mohr, M. B. Raschke, J. D. Caldwell, L. Martín-Moreno, and S.-H. Oh, Ultrastrong plasmon–phonon coupling via epsilon-near-zero nanocavities, Nature Photonics 15, 125 (2021).
- Dodonov [2020] V. Dodonov, Fifty years of the dynamical casimir effect, Physics 2, 67 (2020).
- Jun et al. [2012] Y. C. Jun, E. Gonzales, J. L. Reno, E. A. Shaner, A. Gabbay, and I. Brener, Active tuning of mid-infrared metamaterials by electrical control of carrier densities, Opt. Express 20, 1903 (2012).
- Panah et al. [2017] M. E. A. Panah, L. Han, K. Norrman, N. Pryds, A. Nadtochiy, A. Zhukov, A. V. Lavrinenko, and E. S. Semenova, Mid-ir optical properties of silicon doped inp, Opt. Mater. Express 7, 2260 (2017).
- Dunkelberger et al. [2018b] A. D. Dunkelberger, C. T. Ellis, D. C. Ratchford, A. J. Giles, M. Kim, C. S. Kim, B. T. Spann, I. Vurgaftman, J. G. Tischler, J. P. Long, O. J. Glembocki, J. C. Owrutsky, and J. D. Caldwell, Active tuning of surface phonon polariton resonances via carrier photoinjection, Nature Photonics 12, 50 (2018b).
- Dunkelberger et al. [2020] A. D. Dunkelberger, D. C. Ratchford, A. B. Grafton, V. M. Breslin, E. S. Ryland, D. S. Katzer, K. P. Fears, R. J. Weiblen, I. Vurgaftman, A. J. Giles, C. T. Ellis, J. G. Tischler, J. D. Caldwell, and J. C. Owrutsky, Ultrafast active tuning of the berreman mode, ACS Photonics, ACS Photonics 7, 279 (2020).
- Hernández and Herrera [2019] F. Hernández and F. Herrera, Multi-level quantum Rabi model for anharmonic vibrational polaritons, The Journal of Chemical Physics 151, 144116 (2019).
- Triana et al. [2020] J. Triana, F. Hernández, and F. Herrera, The shape of the electric dipole function determines the sub-picosecond dynamics of anharmonic vibrational polaritons, Journal of Chemical Physics 152, 234111 (2020).
- Andrews et al. [2018] D. L. Andrews, G. A. Jones, A. Salam, and R. G. Woolley, Perspective: Quantum Hamiltonians for optical interactions, The Journal of Chemical Physics 148, 40901 (2018).
- Elsaesser [1991] T. Elsaesser, Vibrational And Vibronic Relaxation Of Large Polyatomic Molecules In Liquids, Annual Review of Physical Chemistry 42, 83 (1991).
- Morse [1929] P. M. Morse, Diatomic Molecules According to the Wave Mechanics. II. Vibrational Levels, Physical Review 34, 57 (1929).
- F. Ribeiro et al. [2018] R. F. Ribeiro, A. D. Dunkelberger, B. Xiang, W. Xiong, B. S. Simpkins, J. C. Owrutsky, and J. Yuen-Zhou, Theory for Nonlinear Spectroscopy of Vibrational Polaritons, The Journal of Physical Chemistry Letters 9, 3766 (2018).
- Grafton et al. [2021b] A. B. Grafton, A. D. Dunkelberger, B. S. Simpkins, J. F. Triana, F. J. Hernández, F. Herrera, and J. C. Owrutsky, Excited-state vibration-polariton transitions and dynamics in nitroprusside, Nature Communications 12, 214 (2021b).
- Triana et al. [2018] J. Triana, D. Peláez, and J. Sanz-Vicario, Entangled Photonic-Nuclear Molecular Dynamics of LiF in Quantum Optical Cavities, Journal of Physical Chemistry A 122, 10.1021/acs.jpca.7b11833 (2018).
- Beck et al. [2000] M. H. Beck, A. Jackle, G. A. Worth, and H.-D. Meyer, The multiconfiguration time-dependent Hartree (MCTDH) method: a highly efficient algorithm for propagating wavepackets, Physics Reports 324, 1 (2000).
- Meyer et al. [2009] H. D. Meyer, F. Gatti, and G. A. Worth, Multidimensional Quantum Dynamics: MCTDH Theory and applications (John Wiley & Sons, 2009).
- Vendrell et al. [2007] O. Vendrell, F. Gatti, and H.-D. Meyer, Full dimensional (15-dimensional) quantum-dynamical simulation of the protonated water dimer. ii. infrared spectrum and vibrational dynamics, The Journal of Chemical Physics 127, 184303 (2007), https://doi.org/10.1063/1.2787596 .
- Vendrell [2018] O. Vendrell, Collective jahn-teller interactions through light-matter coupling in a cavity, Phys. Rev. Lett. 121, 253001 (2018).
- Triana and Herrera [2020] J. Triana and F. Herrera, Self-Dissociation of Polar Molecules in a Confined Infrared Vacuum, ChemXiv:12702419 10.26434/chemrxiv.12702419.v1 (2020), ChemXiv:12702419 .
- Meyer and Worth [2003] H.-D. Meyer and G. A. Worth, Quantum molecular dynamics: propagating wavepackets and density operators using the multiconfiguration time-dependent Hartree method, Theoretical Chemistry Accounts 109, 251 (2003).
- Meyer et al. [2006] H.-D. Meyer, F. L. Quéré, C. Léonard, and F. Gatti, Calculation and selective population of vibrational levels with the multiconfiguration time-dependent hartree (mctdh) algorithm, Chemical Physics 329, 179 (2006), electron Correlation and Multimode Dynamics in Molecules.
- Barnett and Radmore [1997] S. M. Barnett and P. Radmore, Methods in theoretical quantum optics (Oxford University Press, 1997).
- Gerry and Knight [2005] C. Gerry and P. Knight, Introductory quantum optics (Cambridge University Press, Cambridge, 2005).
- Mandel [1982] L. Mandel, Squeezed states and sub-poissonian photon statistics, Phys. Rev. Lett. 49, 136 (1982).
- Andersen et al. [2016] U. L. Andersen, T. Gehring, C. Marquardt, and G. Leuchs, 30 years of squeezed light generation, Physica Scripta 91, 053001 (2016).
- Sarandy et al. [2004] M. S. Sarandy, L. A. Wu, and D. A. Lidar, Consistency of the adiabatic theorem, Quantum Information Processing 3, 331 (2004).
- Ji et al. [2018] H. Ji, B. Zhang, W. Wang, L. Lv, and J. Shen, Ultraviolet light-induced terahertz modulation of an indium oxide film, Opt. Express 26, 7204 (2018).
- Simpkins et al. [2021] B. S. Simpkins, A. D. Dunkelberger, and J. C. Owrutsky, Mode-specific chemistry through vibrational strong coupling (or a wish come true), The Journal of Physical Chemistry C, The Journal of Physical Chemistry C 125, 19081 (2021).