Failure of standard density functional theory to describe the phase behavior of a fluid of hard right isosceles triangles
Abstract
A fluid of hard right isosceles triangles was studied using an extension of Scaled-Particle Density-Functional Theory which includes the exact third virial coefficient. We show that the only orientationally ordered stable liquid-crystal phase predicted by the theory is the uniaxial nematic phase, in agreement with the second-order virial theory. By contrast, Monte Carlo simulations predict exotic liquid-crystal phases exhibiting tetratic and octatic correlations, with orientational distribution functions having four and eight equivalent peaks, respectively. This demonstrates the failure of the standard Density-Functional Theory based on two and three-body correlations to describe high-symmetry orientational phases in two-dimensional hard right-triangle fluids, and points to the necessity to reformulate the theory to take into account high-order body correlations and ultimately particle self-assembling and clustering effects. This avenue may represent a great challenge for future research, and we discuss some fundamental ideas to construct a modified version of Density-Functional Theory to account for these clustering effects.
I Introduction
The experimental realization of two-dimensional fluids of hard polygonal particles to study their phase behaviors is an active line of research. For example, lithographic techniques applied to prepare nonoverlapping particles of a specific polygonal shape, and their adsorption or confinement, produce single monolayers of Brownian particles that diffuse in two dimensions [1, 2, 3]. A vast body of experimental studies on these systems have clarified the importance of entropic particle interactions to stabilize different liquid-crystal and solid phases with exotic symmetries beyond the standard uniaxial nematic (N) symmetry. In particular, tetratic (T) and triatic (TR) liquid-crystal phases were found when the particles have cross sections with rectangular [1], or triangular [2] geometry. Experiments with particles of square sections did not find the T phase [3], but this was due to the roundness of the corners, as proved by Monte Carlo (MC) simulations [4]. The stability of T [5, 6, 7, 8, 9, 10] and TR [11, 12] phases as a function of particle shape was also confirmed by theoretical and simulation works on two-dimensional hard particle fluids. Experiments on monolayers of vibrated granular cylinders [19, 20, 21, 22] and squares [23] also showed the presence of stationary nonequilibrium T-like textures in the arrangement of particles. These results suggested that entropic interactions are also important to determine the orientational ordering patterns observed in dissipative systems. Experiments conducted on vibrated granular rods [24] and equilibrated colloidal silica rods [25] under annular confinement showed the presence of topological defects and domains walls between regions of different orientational and spatial ordering. This in turn suggests similarities between dissipative and equilibrium systems in situations where entropic interactions play a dominant role, i.e. at high packing fractions. Recently the T phase of kite-like particles was also found [26, 27]. How regular polygons order in liquid-crystal and crystalline phases as density is varied strongly depends on the number of polygonal sides, an issue that was intensively studied by MC simulations [28].
Recently Gantapara et al. [11] have conducted MC simulations on hard particles consisting of equilateral and right isosceles triangles. For the latter, the authors found the presence of a seemingly exotic liquid-crystal phase, which they called Rhombic (R), between the isotropic (I) and its crystalline counterpart (the rhombic crystal). This phase seems to exhibit strong octatic (O) correlations, with a high value for corresponding order parameter, . In an O phase the orientation distribution function, i.e. the probability density of a particle to orient with respect to one of the equivalent directors at an angle , has eightfold symmetry, , in contrast with the T phase where the symmetry is .
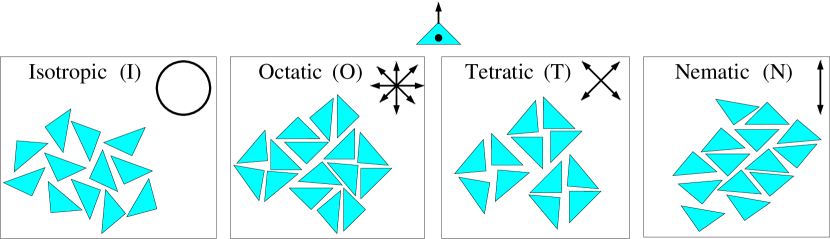
Fig. 1 shows a schematic of the I, O, T and N liquid-crystal phases of hard right triangles. One can anticipate the importance of particle clustering in this system, with particles easily forming square-like dimers or tetramers that build up O or T ordering, corresponding to eight or four equivalent directors, respectively. Note that the axis of a right triangle is defined by a unit vector connecting the barycenter and the right-angled vertex.
The phase discovered by Gantapara et al. is probably the standard T phase since, as shown below, there are good reasons to expect that the phase cannot be purely octatic. In any case, the main focus of the authors of Ref. [11] was on the study of chirality in the crystal phase of hard equilateral and right-angled triangles.
We have recently applied a Density-Functional Theory (DFT) based on Scaled-Particle Theory (SPT) to study the phase behavior of a fluid of hard isosceles triangles as a function of their opening angle [12]. This theory is close in spirit and qualitatively similar in results to the standard Onsager theory [29] and to extensions of Parsons-Lee-type theories [30] applied to two dimensional particles. For the particular case of right-angled triangles, we found that the only stable liquid-crystal phase predicted by the theory was the standard uniaxial N phase, with the symmetry . This is in stark disagreement with the simulations of Gantapara et al. and points to a essential problem of the above theory and, by extension, of the (second-order virial) Onsager theory. We remind the reader that, by contrast, the SPT-based theory correctly predicts the existence of the exotic T phase in fluids of hard rectangles with low aspect ratio and of the TR phase for a fluid of hard equilateral triangles [5, 7, 12].
The failure of DFT to correctly describe, at least qualitatively, the thermodynamically stable symmetry of an oriented fluid is unusual. It means that the important angular correlations that drive the system to the stable symmetry are not present at the level of two-particle correlations but in higher-order terms. This failure brings to mind the inability of DFT to reproduce the intermediate hexatic phase in systems of hard discs, although the origin of the problem is completely different. In this case even the most sophisticated, albeit still approximate, versions of DFT applied to the hard disk fluid predict a first-order transition between the fluid and a crystal with particles at the nodes of a triangular lattice [13]. However, simulations show an intermediate hexatic phase between fluid and crystal exhibiting quasi-long-range bond-orientational ordering [14, 15, 16], associated to two-particle positional correlations. One can speculate on the possibility to construct an accurate hard-disk density functional based on two-body density functions, as proposed for example in Ref. [17, 18]: coupling between first nearest-neighbor bonds and spatial coordinates would be contained explicitly in the theory by construction, and phases with bond orientational ordering could in principle be stabilised.
In the present case, however, the order is orientational and characterised by a one-particle distribution function, namely the orientational distribution function , not by a bond-orientational order. The origin of the failure is therefore different. Retrospectively, it is remarkable how Onsager theory, based solely on two-particle correlations, i.e. on the lowest-order virial expansion of the free energy, can describe oriented phases of fluids and fluid phase transitions. Obviously this is because, for fairly elongated particles, the second-order term is by far the dominant one in the virial expansion. It is therefore even more remarkable that, in the last few decades, Onsager theory and its extensions (e.g. SPT), all based on two-particle orientational correlations, have been applied with success even in situations where the latter condition is clearly not validated, for example in 2D and/or in the case of anisotropic but not very elongated particles. It is plausible that the limits of validity of the theory may be revealed in some cases, and the fluid of hard right triangles is, to our knowledge, the first example of this breakdown.
Motivated by this negative finding, in the present article we report on the results obtained using an extended SPT theory that goes beyond two-body correlations by incorporating three-body orientational correlations through the third virial coefficient. This is the obvious step to take in an attempt to remedy the deficiencies of the standard theory. From the lessons learned in the hard-rectangle case [31], it is known that higher-order correlations are important to improve the predictions on the stability of high-symmetry orientational phases, since they more correctly account for particle configurations typical of these phases. However, the numerical implementation of such a theory is not easy: the third virial coefficient is in fact a functional of the orientational distribution function, , with respect to which the free energy has to be functionally minimised. In order to make calculations feasible, we consider a projection of on Fourier space, and represent the third-virial functional by means of particular low-order moments that dominate the behavior in the neighbourhood of the bifurcation point (from the isotropic to the oriented phase). A combination of MC integration and Gaussian quadratures is used to evaluate these moments with reasonable accuracy. Using these techniques, a bifurcation analysis and the full minimization of the resulting DFT were implemented, which produced valid results at least for packing fractions close to the bifurcation point.
Interestingly, the results from the extended theory are qualitatively similar to the predictions of the standard SPT-based theory: the only orientationally-ordered stable phase is the uniaxial N phase, and the structure of the orientational distribution function has no indication whatsoever of T or O correlations. The obvious conclusion is that third-order correlations are still not the important ones in the stability of these phases. Due to the difficulties associated with the implementation of even higher-order terms, the virial approach suggested by Onsager theory in this system seems hopeless in practical terms.
To understand the problem in more depth, especially in connection to the stability of high-symmetry orientational phases, we have also performed -MC simulations of a fluid of hard right-angled triangles. In line with the findings of Gantapara et al. [11], we found that, under compression from the isotropic fluid, the system becomes ordered in configurations where particles exhibit strong O correlations. Under expansion from a perfect crystal formed by tetramers of triangles arranged in squares, Fig. 9(a) (this is the stable crystal phase according to [11]), we found a (possibly discontinuous) melting transition to a T phase (with fourfold symmetry and a high number of tetramers). This T phase is stable (or metastable) for approximately the same range of packing fractions as that of the O phase obtained on compression, and under further expansion transforms into an isotropic phase via a discontinuous phase transition). All of these symmetries are confirmed from the behaviour of suitable order parameters that describe the T and O symmetries, and are visualised very directly by looking at the orientational distribution function .
Although we have not traced out the stability boundaries of the I, O and T phases, these results definitively answer the question as to the inadequacy of a third-virial DFT to describe the orientational ordering symmetries of a fluid of right-angled triangles. Obviously the inclusion of even more high-order virial coefficients could improve the description of the fluid phase behavior. However, as mentioned above, the numerical implementation of such a theory would constitute a huge numerical task, much more demanding than standard MC simulations on reasonably sized systems. Clearly a radically new approach is needed. One possibility is the formulation of new models based on the self-assembling of particles into clusters or super-particles of different shapes and sizes; these clusters would in turn be oriented in such a way that the final orientation of monomers will exhibit the new exotic symmetries. As recently shown [32], the entropic hard-particle interactions enjoy some similarities with chemical-bonding interactions, which eventually give rise to the formation of clusters of particles or supra-molecular aggregates, respectively. This view could be fruitful in the present system and might represent a worthy activity for the future.
The article is organized as follows. Sec. II is devoted to introducing the theoretical model for a fluid of hard right-angled triangles, a model based on the extended third-virial DFT. In Secs. III and IV we implement a bifurcation analysis and the full minimization of the model, which is valid for densities close to the bifurcation point. Also, in Sec. V we present MC simulations which confirm the presence of orientational symmetries different from uniaxial. Finally some conclusions are drawn in Sec. VI.
II Third-virial DFT
We have already pointed out that the SPT-based DFT (an effective second-order virial theory), fails to predict the stability of the T and/or O liquid-crystal phases. These phases are characterised by an orientational distribution function with four- and eightfold symmetries, respectively: (). By contrast, MC simulations [11] clearly point to the existence of both these symmetries in the region between the isotropic and crystal phases, even though the nature of the stable phase and the relative stability of the two phases still demand clarification (see below).
It is well known that the third and higher-order virial coefficients, with , cannot be neglected if we are to obtain a quantitatively correct description of the phase behavior of hard elongated particles in two dimensions [33, 34]. This can be explained in terms of the nonvanishing limit of the ratio as particle elongation goes to infinity (the so-called Onsager limit). Although the triangular geometry studied here cannot be defined in such terms, we expect the effect of the third virial coefficient to be sufficiently important as to merit its inclusion in a DFT approach. A possible theory was already proposed and applied by us in a study of the hard-rectangle-fluid [31], where the effect of the third virial coefficient was found to be important (although not crucial to determine phase symmetry). The essential idea is to approximate the excess free-energy density functional per particle (in reduced thermal units) as
| (1) |
where is the packing fraction, defined as the product of mean number density, , and particle area of the right isosceles triangle, , with the length of the equally-sized triangle sides. In Eqn. (1) the coefficients are defined as
| (2) |
where , and 3, are the second and third virial coefficients, manifestly functionals of the orientational distribution function :
| (3) |
In turn, the kernels are spatial integrals of products of Mayer functions associated to particles and with relative positions and orientations and , respectively:
| (4) | |||
| (5) |
with the total area. In the above expressions we have implemented the change of variables and (first and second integrals), and and (second integral). The object is the excluded area between two particles. Using these expressions, Eqn. (3) for and 3 becomes
| (6) | |||
| (7) | |||
| (8) | |||
| (9) |
The density expansion of Eqn. (1) gives , and consequently the pressure is (with the Boltzmann factor). The truncated expressions provide the exact low-density limit up to third order in density. Thus our proposed theory treats two- and three-body correlations exactly.
The ideal free-energy density functional per particle is, as usual,
| (10) |
where the thermal volume term has been dropped. Therefore our theory is completely defined as .
III Bifurcation analysis
In this section we perform a bifurcation analysis of the theory presented above. The bifurcation defines the instability of the I phase against orientational fluctuations of some particular symmetry. We begin by considering the first-order Fourier expansion of the function:
| (11) |
with the first-order Fourier amplitudes. The indexes account for uniaxial N, tetratic T, triatic TR, and octatic O symmetries, respectively. Substituting this expression into Eqns. (7) and (9) gives, to lowest order:
| (12) | |||
| (13) |
Consequently,
| (14) | |||
| (15) |
where the following coefficients have been defined:
| (16) |
The Fourier expansion of the ideal free energy Eqn. (10) gives . Inserting Eqns. (14) and (15) into (1), we obtain the expansion of the total free-energy per particle as , with
| (17) | |||
| (18) | |||
| (19) |
with the I phase contribution. is different from zero in the presence of a weak orientational ordering. All that remains is to calculate the coefficients defined in Eqn. (16). As shown in [12], the expression for , for the particular case of right-angled isosceles triangles, is
| (20) |
with the Kronecker-delta. The coefficients cannot be calculated analytically and have been obtained numerically. MC integration was used to evaluate the spatial kernels in (5), while the angular integrals in Eqn. (16) were evaluated using Gaussian-Legendre quadratures. random configurations of three particles with fixed orientations were generated, using the usual protocol: one particle is located at the origin, two particles are generated at random, both overlapping with the first one, thus ensuring that the first two Mayer functions are equal to , and the third Mayer function connecting the latter is checked. In the case of the angular integrals, a density of 12 points per period were used for the four cases . The estimated error of the coefficients is less than .
The minimization of the expanded total free-energy per particle with respect to gives the bifurcation condition for , with given by (III). The solutions to this equation are obviously the same as the zeros of the term enclosed in brackets. We have solved numerically this equation for the values of packing fractions at bifurcation, considering separately the cases and . The results are collected in Table 1. Also included are the results obtained from the SPT approach, which can be obtained easily by considering the first two terms of Eqn. (1) for the excess free-energy per particle. In this case the bifurcation points are given analytically by
| (21) |
| 1 | 2 | 3 | 4 | |
|---|---|---|---|---|
| 0.8249 | 0.9821 | 0.9444 | ||
| 0.7325 | 0.9328 | 0.8353 | ||
| – | 0.1679 | 0.1572 | 0.1195 | |
| – | 0.2469 | 0.2003 | 0.1062 |
A first conclusion that can be drawn from the results of the table is that, compared to the second-virial approximation, the third-virial approximation dramatically decreases the bifurcation packing fractions from the I phase to the orientationaly ordered phases. In general the third-virial approximation gives a value for the I-N bifurcation, , which is quantitatively similar to that for the I phase coexisting with the liquid-crystal phase, as predicted by simulations [11]. Note again that simulations predict a very different symmetry (four- or eight- instead of two-fold) for the latter phase: both, second- and third-virial approaches, predict a stable uniaxial N phase beyond the I phase.
The failure of DFT to predict the correct symmetry for the liquid-crystal phase could have one or two of the following explanations: (i) the importance of four and higher-order particle correlations, quantified through the corresponding virial coefficients, to correctly predict the stability of the T/O phase (note that, strictly speaking, the theory generates these virial coefficients from a density expansion; however, the angular correlations will be poorly represented); (ii) the presence of strong clustering effects, which a low-order virial theory would be unable to account for. In any case, the sequence (see Table 1), together with the fact that from a value a (highly ordered) metastable T solution is found (see discussion in Section IV), and taking into account the corresponding differences and , we can conclude that, within the context of DFT theory, the TR, T and O symmetries can be discarded as possible liquid-crystal symmetries for hard right isosceles triangles.
IV Minimization
A next step beyond the bifurcation analysis consists of analysing the equilibrium solutions of the extended density functional by minimization. An important motivation for this calculation is to examine the orientational distributions and search for the possible existence of secondary peaks in at in the interval (which would point to four- or eightfold orientational symmetry). Then, we are probing the ability of three-body correlations to capture this symmetry. First we introduce a parameterization for the orientational distribution function, which we simply take as a truncated Fourier expansion:
| (22) |
We choose , which will be valid sufficient close to the bifurcation point. Substituting (22) into Eqns. (12) and (13), we obtain
| (23) | |||
| (24) |
After substitution into Eqns. (1) and (10), the total free energy per particle is obtained, with calculated from (17). The excess part over the isotropic contribution, , is now
| (25) |
It is understood that for in the double sum of Eqn. (25). As in Section III the coefficients are evaluated numerically using MC integration and Gaussian quadrature (note that in this case a total of 71 coefficients need to be evaluated instead of only 9 in the bifurcation analysis). The total free energy is then minimized with respect to the Fourier amplitudes () () using a Newton-Raphson procedure.

Fig. 2 shows an example of a minimization of the -extended SPT approach for a packing fraction ; this is not far from the I-N bifurcation point at . The orientational distribution function is represented, together with the result from the second-virial SPT theory of Ref. [12]. In the latter case was calculated using and also , which practically gives the exact result considering that the last Fourier coefficient, , obtained from the minimization has an absolute value of less than . The functions of panel (a) (dashed curve), cannot be distinguished one form the other at the scale of the graph, their mean square difference being . The packing fraction was chosen so as to give the same relative distance from the I-N bifurcation point as the -extended theory (solid curve). We can see that the two theories give a qualitatively similar orientational structure, with the function from the extended theory being more weakly oscillatory because of the smaller density. We also show the functions obtained from the SPT and -extended theories for higher packing fractions corresponding to the same relative departures from the respective bifurcation densities. What is important from these calculations is that neither theory predicts any trace of secondary peaks and, consequently, of tetratic or octatic correlations, in contrast with the simulation results.
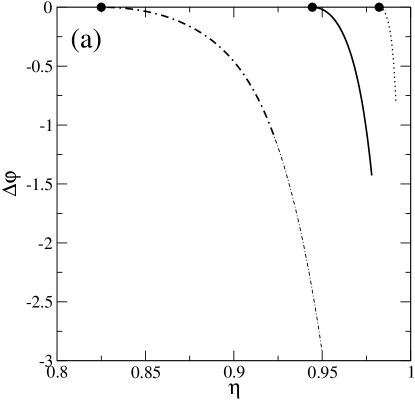
One may wonder which of the following scenarios takes place at densities above the I-O bifurcation: (i) The O and N free-energy branches cross each other at some density, or (ii) the N branch continues to be the lowest one. In order to investigate this point, we minimised the SPT functional restricting the set of Fourier coefficients to only those with index (giving a distribution with perfect O symmetry). A free-energy branch was generated for a density interval starting at the I-O bifurcation point and up to densities where the octatic order parameter is (in this situation the truncated Fourier series still gives correct results). We also calculated the N branch up to densities for which . As expected, we obtained a “metastable” O phase. However, the first scenario above can be discarded, as the difference between the O and N free-energy branches is huge (note that the latter bifurcates at much lower densities); this conclusion results from a simple extrapolation to the region where the O phase is metastable. The situation is even worse in the case of the metastable TR phase, as it bifurcates at higher packing fraction (see the table 1). All these results are shown in Fig. 3(a), where we plot the free-energy differences (N,O,TR) between and I phases calculated from their respective bifurcation points. We remark that the T phase bifurcates from the I phase but within a first-order transition scenario (see comment in Table 1), unlike the N, O and TR phases. This point is elucidated not via Fourier-amplitude minimization (we were unable to obtain a metastable T solution with the proper restrictions over ), but from a simple one-parameter () minimization of a parameterized orientation distribution function,
| (26) |
with the zeroth-order modified Bessel function of the first kind. The results are shown in Fig. 3(b): from the bifurcation point (open circle in the figure), located at a packing fraction (see Table 1), an unstable T branch departs towards lower densities, with a free energy higher than that of the I phase. This branch terminates at (open square in the figure), where the T phase becomes metastable for the first time, with a high order parameter . From this point a second T branch develops towards higher densities, eventually becoming negative at , indicating that the T phase is more stable than the I phase. This is the usual scenario for a first-order phase transition. When further increases from this value, the T free-energy branch also crosses the O branch at . In any case, the free energy of the N phase has by far the lowest free energy, as can be seen in Fig. 3. The crossing of the T and O branches at high packing fractions is interesting. It can be understood by invoking the limit value of the scaled second-virial coefficient (2) as :
Inserting the known analytic expression for , we obtain for the N (), T (), TR () and O () symmetries. This fact explains the reason for the crossing behavior: the double-averaged excluded area with respect to for the T symmetry, although similar in magnitude, is lower than that obtained for the O symmetry. Obviously this occurs only at very high densities, when the orientational order is almost perfect and the above asymptotic expression can be justified. The fact that the O-phase free-energy is lower than that of the T phase at lower densities implies that the opposite behavior is true when the orientational distribution function is less sharply peaked.
Even though these calculations were restricted to the SPT theory, we can be quite confident that the similar scenario results from the theory (note that the latter theory is difficult to implement at high densities due to the prohibitively large number of three-body kernels projected on Fourier space that are necessary to describe a phase with high orientational order).

V Monte Carlo simulations
Gantapara et al. [11] have presented a detailed Monte Carlo simulation study of the fluid and crystal phases of hard right-angled triangles. Their isothermal-isobaric simulations on systems of 1600 particles point to the existence of a liquid-crystal phase between the isotropic fluid and the crystal. Based on the analysis of order parameters and angular correlation functions, this phase was named Rhombic (R) and characterised by the order parameter. Order parameters are defined, in terms of the orientational distribution function, as
| (28) |
These order parameters characterise the N (), T (), TR () and O () symmetries. The term ‘rhombic’ used in [11] reflects the structure of the stable crystal phase, Fig. 4(a), which consists of a square lattice of tetramers, each formed by four triangles in a square configuration [11]. Unfortunately, the information provided by Gantapara et al. does not allow us to ascertain the true symmetry of the liquid-crystal phase. A pure octatic phase would be characterised by and , and by an orientational distribution function with eight equivalent (equal-height) peaks in the interval , fulfilling the condition . A focus on the order parameter in [11] may indicate the occurrence of octatic symmetry in the intermediate phase between isotropic and crystal phases.
To further investigate this issue in more detail, and to obtain a test bed for the DFT results, we performed Monte Carlo simulations on samples of 576 triangles (some selected simulations were also performed to investigate some specific issues). Although our sample sizes are smaller, our results complement the work of Gantapara et al. in the sense that they focus on the complete set of order parameters (rather than only on ), and also on the orientational distribution function.
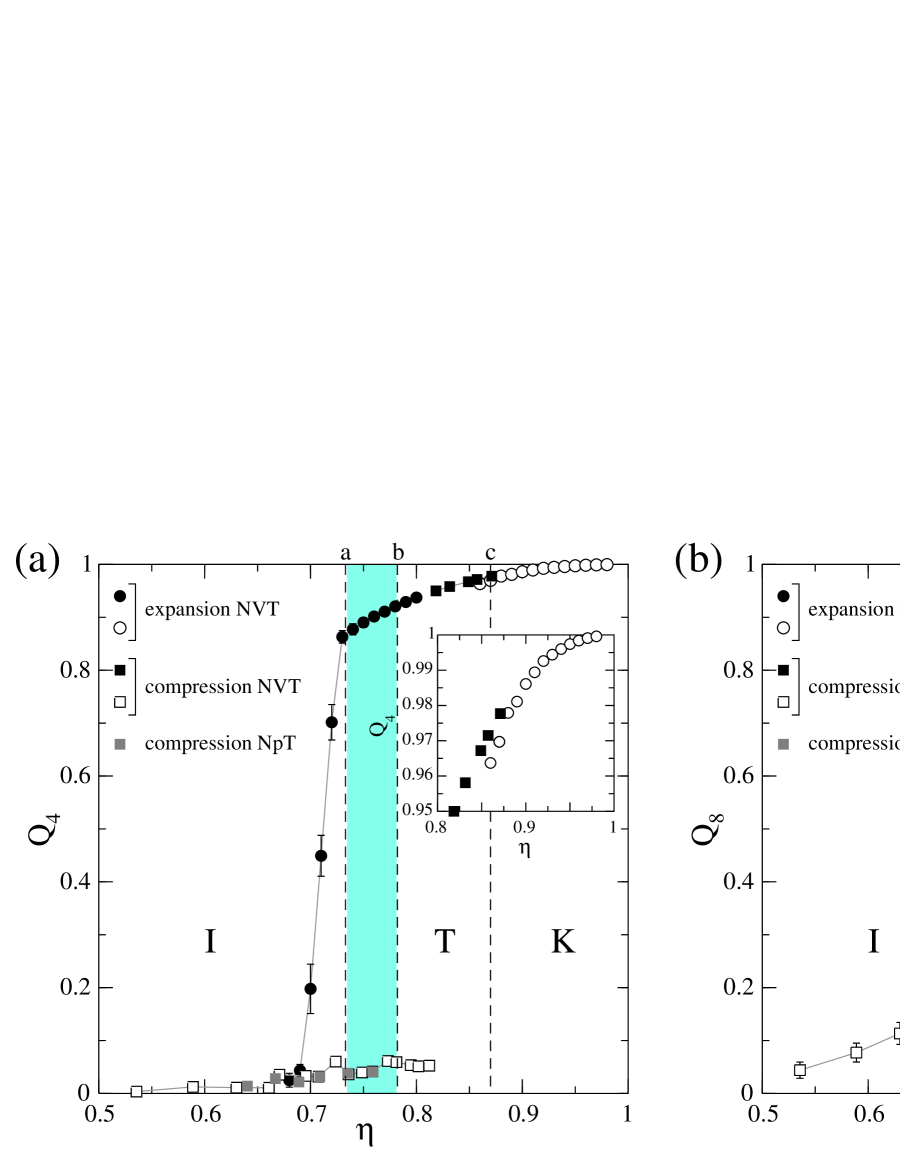
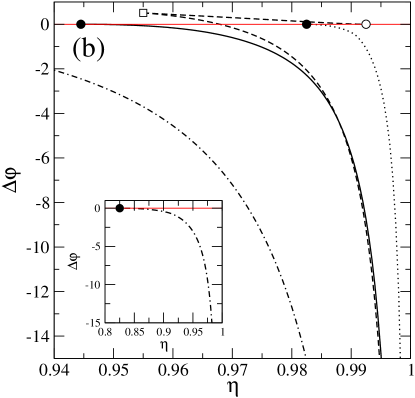
Several runs were performed, following compression or expansion starting from configurations with different symmetries. All runs comprised MC steps for equilibration and MC steps for averaging. runs were times longer. Figs. 5 shows the order parameters , with and , for some of the runs. Results for compression and expansion runs are shown by squares and circles, respectively. Two compression runs in the NVT ensemble were performed. The first (open squares) started at a low density, , in the isotropic fluid region, and continued up to a density . Along this run all order parameters are low except , which shows a steady increase with density. This seems compatible with the results of Gantapara et al. Since their system size is three times larger, changes in the order parameter near the isotropic-liquid-crystal transition are more abrupt in their case. At the end of our compression run values of the order parameters are , , and , pointing to octatic symmetry. The orientation distribution function for a density is plotted in Fig. 6, using open squares. The peak heights are not exactly the same, which may due to statistical fluctuations or imperfect orientational sampling. To check the compression results, additional simulations were performed (grey symbols in Fig. 5). These results confirm the previous findings on the octatic-like phase obtained by compressing the system from the isotropic phase.
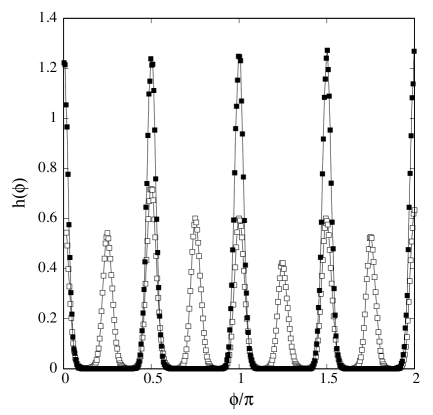
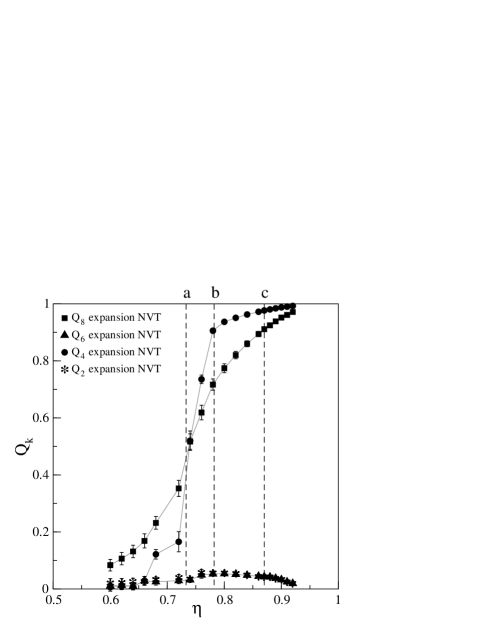
However, the identification of the liquid-crystal phase as an octatic phase is challenged by the results from our expansion runs. These are indicated in Fig. 5 by means of circles. We focus first on the run starting at (filled circles) in a (crystalline) configuration of tetramers, Fig. 4(a). This density was chosen because the free energy calculations reported in Ref. [11] led the authors to conclude that the isotropic and liquid-crystal phase coexist along the density gap –, indicated in Fig. 5 by a shaded region bounded by vertical lines labelled ‘a’ and ‘b’, respectively. A quasiperfect arrangement of tetramers would give . From this perspective, it is no surprise that the largest order parameter in this expansion run is . The system finally collapses to the isotropic phase below . The orientational distribution function along this run (see Fig. 6) confirms that the equilibrium configuration corresponds to a T phase, with four equivalent peaks in the interval , fulfilling the condition . Note that no signs of O symmetry, in the form of local maxima at , , and , are visible. We conclude that the T phase is at least metastable for the system size used, but our analysis cannot say anything definite as to the true stable phase in the interval , either O or T (detailed free-energy calculations would be necessary to settle this question).
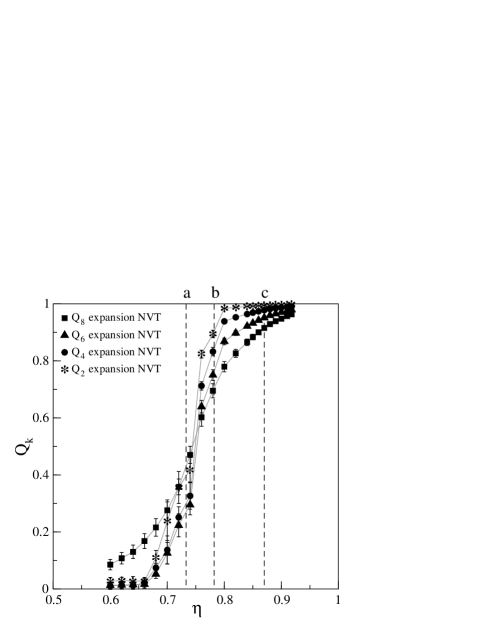
Compression and expansion runs were also conducted to study the transition between liquid-crystal and crystal phases. In the compression run (filled squares) we started from the equilibrated point at of the previous expansion run (filled circles). The expansion run (open circles) starts from a perfect crystal of tetramers, Fig. 4(a), at which, as shown by the simulations of Gantapara et al. [11], is the most stable crystal phase). The path ends at a density of . These runs indicate the presence of a first-order phase transition between T and K (crystal) phases, since the two branches are not connected smoothly, see inset (a vertical line labelled ‘c’ in Fig. 5 at density indicates the density of the reportedly continuous transition [11]).
It is difficult to explain the existence of a strict octatic symmetry for the liquid-crystal phase of hard right triangles on purely theoretical grounds. The reason is that this symmetry requires a delicate balance of particle arrangements so as to give equivalent orientations at multiples of . We are inclined to think that the global symmetry of the stable phase should be tetratic, but the problem persists that simulations indicate two competing liquid-crystal phases, one phase possessing strong octatic correlations and another phase without such correlations.
In any case, the results reported up to this point indicate that the liquid-crystal phase of hard right triangles is not the standard uniaxial N phase, as predicted by DFT, but rather a more symmetric phase with tetratic symmetry and possibly strong octatic correlations. In order to investigate this result from the point of view of simulation, we performed additional simulations, following two strategies. First, we conducted expansion runs from the crystal region, starting with particle configurations different from a square lattice of tetramers. We stress that, according to the free-energy calculations of Gantapara et al. [11], the crystal of tetramers, Fig. 4(a), is slightly more stable than the crystal of dimers, Fig. 4(b). The latter has uniaxial symmetry and can be considered as the crystalline ‘precursor’ of the uniaxial liquid-crystalline phase predicted by DFT. An obvious question is: could the uniaxial N phase be at least metastable with respect to the other, more plausible symmetries? Fig. 7 presents an expansion run from a crystal phase made of dimers with identical orientations at density . The crystal transforms continuously into a fluid phase with the same uniaxial symmetry (all order parameters are high and in the order ). Along the simulations no indication of even weak tetratic or octatic correlations could be detected: the orientational distribution function (not shown) only exhibits peaks at and , with local maxima at other angles being completely absent even at low densities. This is an indication that the uniaxial N phase predicted by DFT may be metastable with respect to other more symmetric phases, at least at the scale of our MC-step simulations.
A second run was performed on the same system but now from a configuration consisting of a square lattice of dimers with random orientations, Fig. 4(c). The results are shown in Fig. 8. This configuration was not considered by Gantapara et al. as a possible candidate for equilibrium crystal phase, but clearly enjoys a higher entropy than the uniaxial crystal of dimers and could compete with the crystal of tetramers (note that the entropy difference per particle between the crystal of tetramers, Fig. 4(a), and the crystal of orientationally ordered dimers, Fig. 4(b), is only per particle at , the only density investigated [11]; the extra entropy of a crystal of orientationally disordered dimers, Fig. 4(c), could easily overcome the free-energy balance with a crystal of tetramers in some density range). The initially crystalline configuration transforms into a fluid tetratic phase at (see Fig. 8). An interesting point is that this tetratic phase is slightly different from the one obtained by compression of the isotropic phase, Fig. 5. Clearly a relatively small system of hard right triangles is very prone to developing metastable phases with a structure sensitively dependent on the initial configuration and the path followed by the simulation.
| phase | uniaxial | tetratic | octatic |
|---|---|---|---|
As a final analysis, we performed simulations at a fixed value of pressure, (which should be right at the liquid-crystal density interval [11]), starting from configurations with uniaxial, tetratic, and octatic symmetries. The average densities obtained are given in Table 2. Note that . As a general rule one expects the stable phase to have the highest density at fixed pressure. Of course, from a thermodynamic point of view, this is no proof that the T phase is more stable than the others, but it certainly gives a hint. Interestingly the O phase is considerably less compact than the T phase, with the uniaxial N phase quite close to the latter.
From the above discussion, we cannot strictly discard the existence of a purely O phase between the isotropic fluid and the crystal of a system of hard right-triangle particles. However, in the region where the O phase could be stable, a competing phase with clear tetratic symmetry also arises in simulations (starting from the crystal of tetramers). The T phase is more plausible than the O phase from the point of view of particle configurations. Even though the simulations indicate that the T phase might be more stable, a definite answer can only come from free-energy calculations.

The different symmetries obtained depend very sensitively on the starting configuration and the path, either compression or expansion, followed in the simulation runs. Obviously the high packing and the two dimensionality of the system causes particles to have a low rotational diffusion and to find difficulties to explore different local symmetries. An additional effect is the clustering tendencies of particles with right linear sectors. A recent study relates the formation of clusters of polyhedral particles with chemical bonding [32]. Local particle configurations vary in type according to the global symmetry of a phase. For hard right triangles several clusters can be identified, see Fig. 9. In the T phase we expect a high fraction of dimers (two triangles or ‘monomers’ in close contact along their long or short sides, forming groups with square and triangular shape, respectively) and tetramers [four close monomers in configurations as shown in Fig. 9(a)], and a low proportion of dimers forming a rhomboid. The latter are present in the isotropic and octatic phases, which means that a compression of the isotropic phase will lead to an octatic texture or frustrated tetratic phase. In turn, a T phase may also form in the absence of tetramers, giving rise to different tetratic configurations with a history-dependent structure.
In any case, our simulations seem to rule out the existence of the uniaxial N phase predicted by the standard SPT-based DFT or the extended SPT theory including the third virial coefficient. The intermediate phase between the isotropic and the crystal phases most likely exhibits strong tetratic and octatic correlations, none of which are detected in the DFT calculations. However, a final answer will have to wait for a more detailed simulation study including free-energy calculations, and the stability of a uniaxial N phase in a limited density interval cannot be ruled out.
VI Conclusions
In the present study we have shown that a SPT-based DFT incorporating the exact second and third virial coefficients is not capable of predicting stable T and O liquid-crystal phases in a fluid of hard right isosceles triangles. In addition, the orientation distribution function of the only stable phase predicted, namely the uniaxial phase, has no signature of T or O correlations. However these symmetries were found in the MC simulations of Ref. [11] and in our own simulations, as shown by the orientational distribution function and the order parameters () in some range of packing fractions.
Our results imply that the stable symmetries of the fluid of hard right triangles are driven by particle correlations involving more than three particles. In view of the practical impossibility to implement higher-order correlations in a DFT model, the results of the present article point to the necessity to formulate some new theoretical description, still within the framework of DFT, but different from its standard form, to describe the phase behavior of right isosceles triangles. Indeed virtually all theoretical DFT models constructed so far for the description of uniform phases of two-dimensional or three-dimensional anisotropic particles are ultimately based on the knowledge of the second virial coefficient. These models have been successfully applied to the description of liquid-crystal symmetries for a vast variety of hard particles, and in general they correctly predict the symmetry of these phases and their stability ranges qualitatively, and even quantitatively in some cases. The present fluid is, to our knowledge, the first example where the standard theoretical tool used by the liquid-crystal community since Onsager formulated his theory breaks down.
However, there are different avenues to remedy the deficiencies of the standard theory, still within the framework of DFT. We suggest that clustering (or self assembling) of particles may be a fruitful view to overcome the difficulties posed by an approach based on a virial expansion. Particle shape alone is enough to identify particularly stable local particle configurations, which can be taken as entities upon which to formulate a DFT model. This approach would automatically incorporate the important correlations through the very identification of the possible clusters, the distribution of which would be obtained in a thermodynamically consistent way, providing a mechanism to explain the peculiar (four- or eightfold) orientational symmetries of the liquid-crystal phases of hard right triangles. For example, the presence of a large amount of dimers and tetramers forming square-like super-particles and both arranged in a T-like configurations can lead to monomer axes, depending on their relative fractions, that orient parallel to four or eight, approximately equivalent, directors. Consequently the angular distribution functions of monomers could approach the symmetries ().
It is reasonable to appeal to the clustering effect to explain why the T and O phases, observed in simulations, cannot be stabilized by the usual implementation of DFT. A more realistic model to account for clustering is to treat the fluid as a polydisperse mixture of clusters of different sizes and shapes. An internal energy for clusters, in the line of standard models for associated fluids, should be introduced. A study of the relation between phase symmetry and particle clustering, and the formulation of a cluster model, which we believe is a promising research line, is left for the future.
To end, we would like to comment on two distinct extensions of the problem. First, our DFT study is restricted only to uniform phases as by construction these are the liquid-crystal orientational symmetries that the present DFT can predict. The study of non-uniform phases can be tackled with a theory optimized for inhomogeneous density profiles. One of the promising versions of DFT is that constructed from fundamental measure theory (see for example Ref. [35]). This theory was formulated for any hard particle geometry. Even though the theory is computationally expensive, it should be possible to fix different crystalline lattices with T symmetry, for example the ones formed by tetramers or by randomly oriented dimers, and minimize the functional with respect to the density profile. The relative stability between different crystalline phases or between the fluid and the crystal could then be studied and compared with the predictions of MC simulations [11].
Finally, one might wonder about the effect of polydispersity in the present system. A perfect nematic phase of monomers and also a perfect tetratic phase of tetramers under compression lead to perfect plane tiling at close packing, with the latter having greater orientational entropy and consequently lower free energy. If polydispersity in the opening angle is present, it could affect the stability of these two phases. In particular the balance between the orientational and configurational entropy can severely be affected in the T phase of tetramers. The stability of the crystal phase of tetramers should be more affected by polydispersity because polydisperse monomers cannot fit into identical tetrameral units to form a crystal. However the effect could be less for the uniaxial crystal formed by monomers, possibly resulting in a stable uniaxial N phase at lower densities.
Acknowledgements.
Financial support under grant FIS2017-86007-C3-1-P from Ministerio de Economía, Industria y Competitividad (MINECO) of Spain. Y. M.-R. acknowledges the support from Grant No. PGC2018-096606-B-I00 (MCIU/AEI/FEDER, UE).References
- [1] K. Zhao, C. Harrison, D. Huse, W. B. Russel, and P. M. Chaikin, Phys. Rev. E 76, 040401(R) (2007).
- [2] K. Zhao, R. Bruinsma, and T. G. Mason, Nat. Commun. 3, 801 (2012).
- [3] K. Zhao, R. Bruinsma, and T. G. Mason, Proc. Natl. Acad. Sci. USA 108, 2684 (2011).
- [4] C. Avendaño and F. A. Escobedo, Soft Matter 8, 4675 (2012).
- [5] H. Schlaken, H.-J. Mögel and P. Schiller, Mol. Phys. 93, 777 (1998).
- [6] K. W. Wojciechowski and D. Frenkel, Comp. Meth. Sci. Tech. 10, 235 (2004).
- [7] Y. Martínez-Ratón, E. Velasco, and L. Mederos, J. Chem. Phys. 122, 064903 (2005).
- [8] A. Donev, J. Burton, F. H. Stillinger, and S. Torquato, Phys. Rev. B 73, 054109 (2006).
- [9] J. Gen and J. Selinger, Phys. Rev. E 80, 011707 (2009).
- [10] S. Mizani, P. Gurin, R. Aliabadi, H. Salehi and S. Varga, J. Chem. Phys. 153, 034501 (2020).
- [11] A. P. Gantapara, W. Qi, and M. Dijkstra, Soft Matter 11, 8684 (2015).
- [12] Y. Martínez-Ratón, A. Díaz-De Armas and E. Velasco, Phys. Rev. E 97, 052703 (2018).
- [13] R. Roth, K. Mecke, and M. Oettel, J. Chem. Phys. 136, 081101 (2012).
- [14] K. J. Strandburg Rev. Mod. Phys. 60, 161 (1988); Erratum Rev. Mod. Phys. 61, 747 (1989).
- [15] C. H. Mak, Phys. Rev. E 73, 065104(R) (2006).
- [16] M. Engel, J. A. Anderson, S. G. Glotzer, M. Isobe, E. P. Bernard, and W. Krauth, Phys. Rev. E 87, 042134 (2013).
- [17] H. Iyetomi and P. Vashishta, Phys. Rev. A 40, 305 (1989).
- [18] A. G. Schlijper and R. Kikuchi, J. Stat. Phys. 61, 143 (1990).
- [19] V. Narayan, N. Menon and S. Ramaswamy, J. Stat. Mech. P01005 (2006).
- [20] T. Müller, D. de las Heras, I. Rehberg and K. Huang, Phys. Rev. E 91, 062207 (20015).
- [21] M. González-Pinto, F. Borondo, Y. Martínez-Ratón E. Velasco, Soft Matter 13, 2571 (2017).
- [22] M. González-Pinto, J. Renner, D. de las Heras, Y. Martínez-Ratón and E. Velasco, New J. Phys. 21 033002 (2019).
- [23] L. Walsh and N. Menon, J. Stat. Mech. 083302 (2016).
- [24] A. Díaz-De Armas, M. Maza-Cuello, Y. Martínez-Ratón and E. Velasco, Phys. Rev. Research 2, 033436 (2020).
- [25] R. Wittmann, L. B. G. Cortes, H. Löwen and D. G. A. L. Aarts, Nat. Commun. 12, 623 (2021).
- [26] Z. Hou, Y. Zong, Z. Sun, F. Ye, T. G. Mason, and K. Zhao, Nat. Commun. 11, 2064 (2020).
- [27] Y. Martínez-Ratón and E. Velasco, Phys. Rev. E 102, 052128 (2020).
- [28] J. A. Anderson, J. Antonaglia, J. A. Millan, M. Engel, and S. C. Glotzer, Phys. Rev. X 7, 021001 (2017)
- [29] L. Onsager, Ann. N.Y. Acad. Sci. 51, 627 (1949).
- [30] S.-D. Lee, J. Chem. Phys. 87, 4932 (1987).
- [31] Y. Martínez-Ratón, E. Velasco, and L. Mederos, J. Chem. Phys. 125, 014501 (2006).
- [32] E. S. Harper, G. van Anders and S. C. Glotzer, PNAS 116, 16703 (2019).
- [33] G. Tarjus, P. Viot, S. M. Ricci, and J. Talbot, Mol. Phys. 73, 773 (1991).
- [34] M. Rigby, Mol. Phys. 78, 21 (1993).
- [35] R. Wittmann, C. E. Sitta, F. Smallenburg, and H. Löwen, J. Chem. Phys. 147 (2017).