X-ray imaging observations of the high-mass -ray binary HESS J0632+057
Abstract
The Chandra X-ray Observatory (CXO) imaged the high-mass -ray binary (HMGB) HESS J0632+057 with the Advanced CCD Imaging Spectrometer (ACIS). We analyzed the CXO data together with 967 ks of archival Swift-XRT observations. On arcsecond scales we find a hint of asymmetric extended emission. On arcminute scales, a region of extended emission (“the blob”), located east of the binary, is seen in both the CXO-ACIS and the Swift-XRT images. The blob does not have a counterpart in the radio, NIR, IR, or optical images. The ACIS spectrum of the blob fits either an absorbed power-law model with , or a thermal plasma model with keV. Since the blob’s is significantly larger than that of the binary we conclude that the blob and binary are not directly related. The somewhat larger very deep XRT image suggests that the binary may be located within a shell (or cavity). The four ACIS spectra taken within the 20 day interval near the light curve minimum suggests that the is varying on timescales of days, possibly due to the inhomogeneous circumbinary environment. The XRT spectra extracted from the wider orbital phase intervals support significant changes in near the light curve maximum/minimum, which may be responsible for the substantial systematic residuals seen near 1 keV, and provide tentative evidence for a Fe line at 6.4 keV. We find no significant periodic signal in the ACIS data up to 0.156 Hz.
1 INTRODUCTION
High-mass -ray binaries (HMGBs) are rare high-mass binaries containing O or Be type stars and a compact object. To date there are 8 HMGBs firmly known with one of them being in LMC and the rest in our own Galaxy. Two Galactic HMGBs with the widest, most elliptical orbits host known radio pulsars (B1269–63 and TeV J2032+4130). In other HMGBs, the nature of the compact objects is unknown with both NSs and BHs being possibilities (see Chernyakova & Malyshev 2020 and references therein). HMGBs with young pulsars represent an extreme form of colliding wind binaries allowing one to probe properties of relativistic pulsar winds. HMGBs with BHs accreting from the companion wind can be used to probe accretion flow physics in the regime where the accretion rate is low and varies periodically with time.
HMGB HESS J0632+057 (hereafter J0632) discovered by Hinton et al. (2009), shows variable emission in TeV -rays as seen with with VERITAS, H.E.S.S., HAWC, and MAGIC observatories (see Adams et al. 2021 and references therein). ESS J0632 is projected near the edge of the star-forming region of the Rosette Nebula. The photometric distance, obtained from the SED fits to the massive star spectrum is kpc (Aragona et al., 2010), is consistent with the distance to the Rosette Nebula star-forming region ( kpc; e.g., Gahm et al. 2007). The binary is located at pc according to Gaia EDR3 distance catalog (Bailer-Jones et al., 2021). Throughout this paper we adopt the 1.5 kpc distance commonly used in the literature. Although the most recent estimate of the distance based on Gaia EDR3 is somewhat larger, it can be affected by unaccounted for systematics due to the uncorrected effects of binary motion impacting the astrometry.
| ObsID | Start Time (MJD) | Exposurea (s) | (s) | Orbital Phaseb | Ctsc |
| CXO CC-mode | |||||
| 13237 | 55605.88101852 | 39,920 | 40,074 | 0.362[0.391] | 10,703 |
| CXO imaging | |||||
| CXO imaging Epoch 1 | |||||
| 20269 | 58152.7673 | 33,630 | 34,075 | 0.402 [0.528] | 463 |
| 20950 | 58153.5007 | 45,476 | 46,077 | 0.404 [0.530] | 539 |
| CXO imaging Epoch 2 | |||||
| 20975 | 58168.6285 | 41,523 | 42,071 | 0.452 [0.579] | 1,157 |
| 20974 | 58170.0665 | 31,658 | 32,070 | 0.456 [0.583] | 1,043 |
a – Live time. Note, for the first two observations the scientific exposure for J0632 is reduced by a factor of 1.5 due to it dithering across the chip gap. b – The binary phases correspond to the start time of the corresponding observation. They are calculated according to M+19 ephemeris ( days) and Moritani et al. (2018) ephemeris ( days), respectively. Zero phase in both cases is chosen to be 54857 MJD. c – Number of photons in 0.5-8 keV within the . Note that the count rates differ so much because of the source being dithered across the chip gap during the Epoch 1 observations.
The optical counterpart of J0632 is a massive B0pe star MWC 148 (HD 259440 = LS VI +05 11) which shows brightness variations at the level of 1%-1.3% in the optical band with the period of days (Zamanov et al., 2021). The variable X-ray counterpart was detected by Swift-XRT and XMM-Newton (Hinton et al., 2009; Bongiorno et al., 2011; Casares et al., 2012; Moritani et al., 2018). A particularly extensive monitoring campaign carried out with Swift-XRT. Analysis of these observations allowed for more precise measurements of the orbital period , , and days according to Malyshev et al. 2019 [hereafter M+19], Moritani et al. 2018, and Adams et al. 2021, respectively) and provided strong evidence for spectral variability as a function of the orbital phase. According to Moritani et al. (2018) fits to the X-ray spectra with an absorbed power-law (PL) model indicate that the object is more absorbed when it is brighter ( cm-2 vs. cm-2) and it also, somewhat less significantly, experiences spectral hardening with the photon index changing from to ). M+19 analyzed the same Swift-XRT data and also found a significant increase in near the peak of the light curve () as well as some evidence of photon index variability, with the spectrum hardening right before and right after the peak of the light curve. Recent NuSTAR observations, confined to a narrow range of orbital phases (), confirm the PL nature of the spectrum and suggest that the slope is changing with the orbital phase Archer et al. (2020). However, neither of these X-ray studies investigated the possibility of extended emission around J0632. Such emission has been firmly detected around the HMGB LS 2883 (Kargaltsev et al., 2014; Pavlov et al., 2015; Hare et al., 2019) and marginally detected around LS 5039 (Durant et al., 2011). On sub-arcsecond scales, extended radio emission has been reported from J0632, LS 2883, LS 5039, LS 2883, and LS I +61 303 (Moldon et al. 2011).
The nature of the compact object in J0632 remains elusive despite the attempts to find pulsations in X-rays (Rea & Torres, 2011; Archer et al., 2020). An alternative way to constrain the compact object type could be the detection of extended emission in X-ray. Chandra X-ray Observatory (CXO) observations of the most famous HMGB LS2883 (which hosts radio pulsar B1269–63) revealed a remarkably dynamic extended emission attributed to the interaction between the pulsar wind and the wind of the massive star (Hare et al. 2019 and references therein). Detecting a similar extended emission in the case of J0632 would support the pulsar nature of the compact object in this system. This prompted us to carry out high angular resolution CXO-ACIS observations of J0632 and report the results here. In addition, we analyzed numerous archival Swift-XRT observations which, once added up, result in a very long cumulative exposure of the J0632 field (967 ks) allowing for a very deep image sensitive to extended emission on larger scales, and providing a high-quality phase-resolved spectrum of the binary. On the other hand, the lack of extended emission, signatures of accretion activity (such as flares, QPOs, or emission lines) would support a slowly rotating NS or a BH scenario for the compact object. To look for these signatures, we analyzed the archival data from CXO-ACIS and Swift-XRT. In Section 2 we describe the observations and the data reduction, while in Section 3 we describe the data analysis and report our findings. We discuss the implications of our results in Section 4, and conclude with a summary in Section 5.
2 Data
In our analysis described below we use four imaging observations performed with CXO-ACIS between 2018-02-03 and 2018-02-21, and publicly available data from 275 Swift -XRT monitoring observations taken over the period from 2009-01-26 – 2018-12-14.
2.1 CXO observations
CXO observed J0632 on four occasions during the two epochs (with two observations per epoch) separated by days (see Table 1) in February 2018. During all observations the target was imaged on the ACIS-I array close to the aim point (offset was ). The detector was operated in Very Faint mode with a time resolution of 3.2 s. The data were processed following standard procedures using CIAO v.4.11 and CALDB v.4.8.4.1. We also used Chart111http://cxc.harvard.edu/ciao/PSFs/chart2/runchart.html v.2 and MARX222https://space.mit.edu/cxc/marx/ v.5.4.0 to produce the observation-specific images of the CXO PSF. Due to the incorrectly implemented offset during the first two observations of J0632, the source fell into the chip gap on ACIS-I array. This led to the loss of about 50% of photons for J0632 and introduced artificial periodic modulation due the dithering of the target across the chip gap. After the problem was recognized, the observations were repeated without any issues (Epoch 2). We only use the second epoch data for the imaging analysis on arc-second scales (Section 3.1.2) as well as for the timing analysis (Section 3.2.1). However, for the large scale image (Section 3.1.1) and spectral (Section 3.3.1) analysis we use data from all 4 CXO observations. The maximum expected pile-up fraction is , hence we neglect the impact of pile-up in our analysis below.
We also included in our spectral analysis the only other archival 40 ks CXO observation that was obtained on 2011 February 13, with ACIS-S3 operated in Continuous Clocking (CC) mode (see Rea & Torres 2011 for details). This observation provided more photons ( net counts in 0.5-8 keV) than all imaging CXO observations taken together because the observation occurred near the light curve peak when the target was bright and the background contribution to be negligibly small (2% of total) even in the CC mode.
2.2 Swift-XRT observations
J0632 has been frequently monitored by XRT between 2009 and 2018, with 275 observations taken during this period. We processed these data using the Swift-XRT data products generator 333https://www.swift.ac.uk/user_objects/ hosted at the University of Leicester (the pipeline is described in detail by Evans et al. 2009). The data products include phase-resolved XRT spectra and the merged image with exposure maps (with and without vignetting).
2.3 Spectral Fitting
We performed all spectral fitting using XSPEC v.12.11.1. For all fits to the binary’s CXO-ACIS spectra, we group them by 1 count per bin prior to fitting and use the cstat implementation of Cash statistic available in XSPEC. For visualization purposes, all fitted spectra shown in the paper are re-binned in XSPEC using the “setplot rebin” command which does not impact the fitting. For the extended “blob” spectrum from CXO, where the background contribution is substantial, we use larger grouping and and fit using the chi-squared statistic. For Swift-XRT spectra, we used binning of 40 or more counts per spectral bin and chi-squared statistic for the fits. Unless specified otherwise, all uncertainties for the parameters inferred from spectral fits are given at 68% confidence level for a single interesting parameter.
3 Results
Below we describe in detail the results of imaging (Section 3.1), Timing (Section 3.2), and Spectral (3.3) analysis of the CXO-ACIS and Swift-XRT observations.
3.1 CXO and Swift images
Thanks to the long combined exposure taken by Swift, both the XRT and ACIS images can provide useful information about arcminute-scale structures. The superb angular resolution of CXO also allows for an arcsecond-scale investigation in the vicinity of J0632.
3.1.1 Arcminute scales
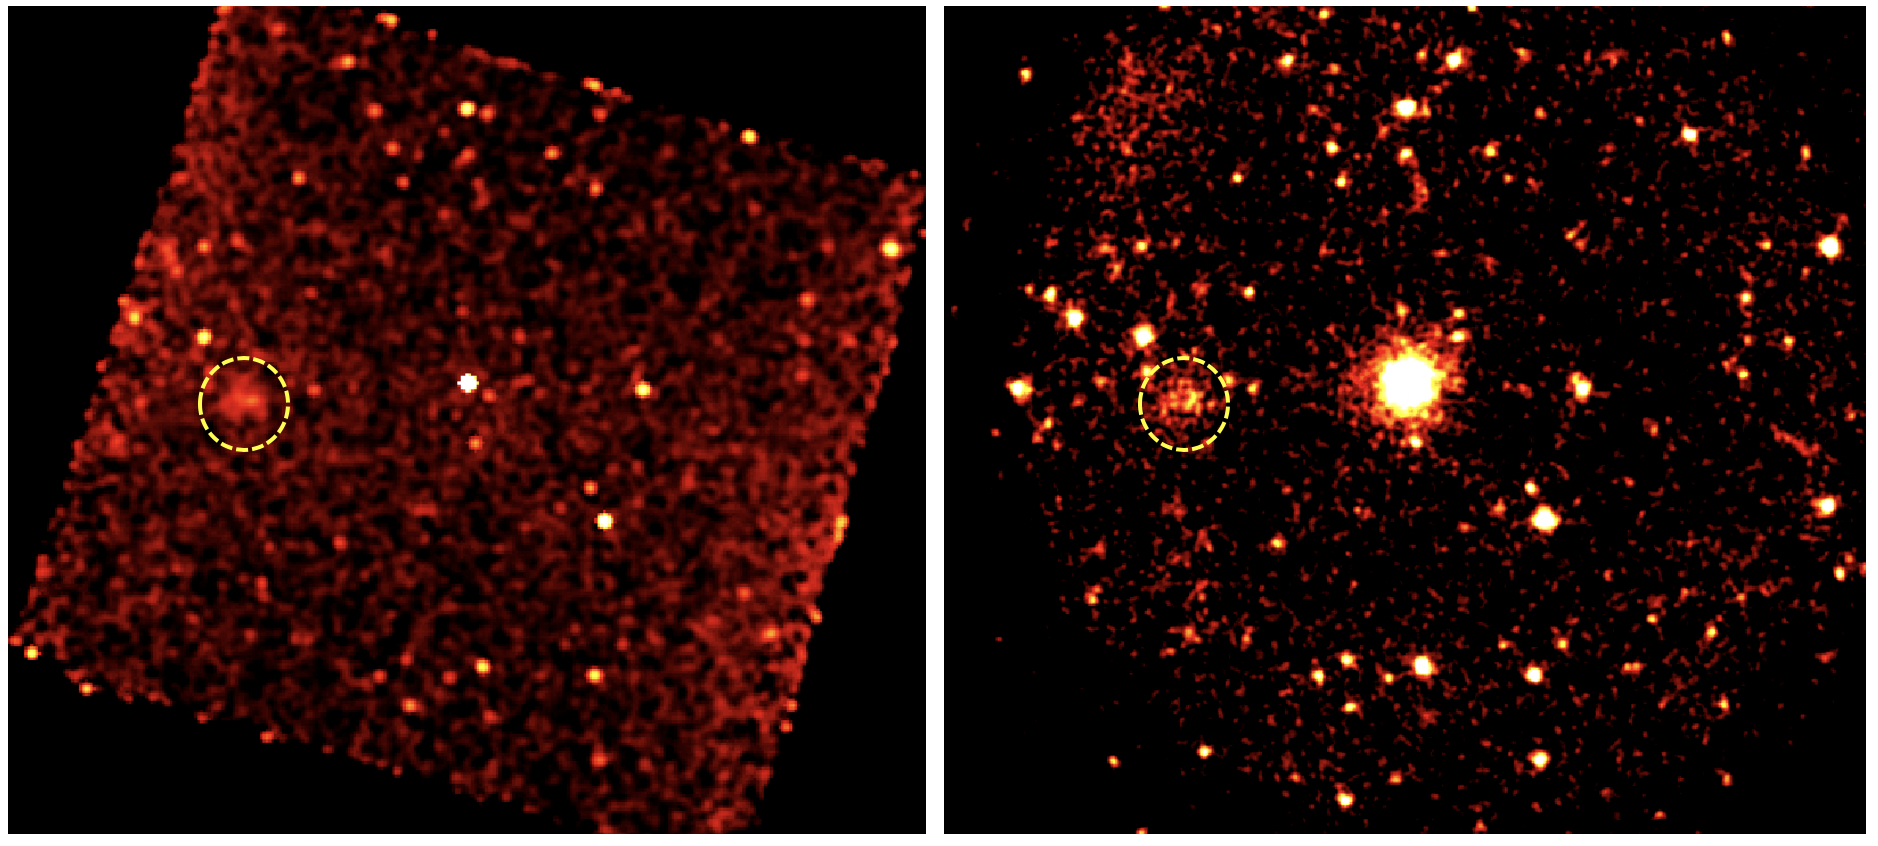
Figure 1 (left panel) shows the combined ACIS-I image of the J0632 field (in 0.7–8 keV) after correction for the exposure map. The binary is the brightest source at the center of the ACIS-I field of view. The only region of extended emission that stands out in the ACIS-I image is the “blob” (shown by the dashed yellow circle), with radius of located east of the binary and centered at R.A. 6h33m21s and decl. .
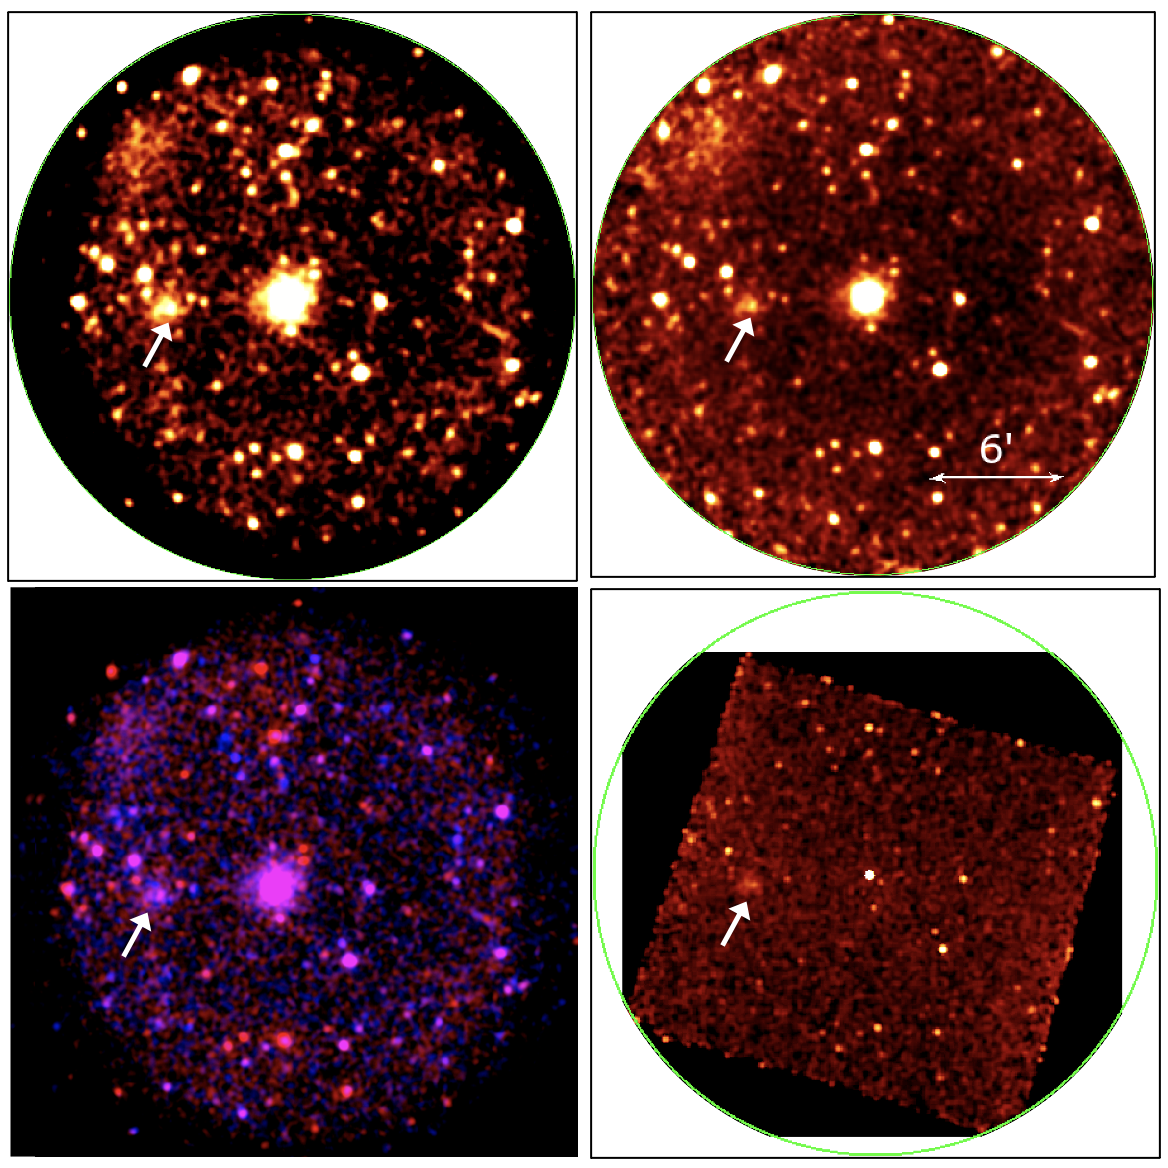
The merged 967-ks image produced from 275 XRT observations of the J0632 field and smoothed with an Gaussian kernel is shown in the top left panel of Figure 2. The top right panel shows the same image divided by the exposure map (which accounts for both the varying exposure time and for the vignetting)444We used the UK Leicester University Swift-XRT data products generator to produce the merged image and the exposure map.. The image in the bottom left panel is the same as above it but in false color showing hard emission in blue (2–10 keV) and soft in red (0.3–2 keV). The smaller CXO ACIS-I image is shown for comparison in the right bottom panel. In addition to the “blob” visible in the CXO ACIS image, the XRT image shows a larger region of extended emission NE of the binary. The diffuse emission appears to be relatively hard, which can be due to its intrinsic spectrum or due to substantial intervening absorption which efficiently removes soft photons (see Section 3.3.1).
Interestingly, the exposure-corrected XRT image also suggest that HESS J06232 is either located inside a “cavity” (region with a lower surface brightness) or surrounded by a shell of brighter emission. We note that the cavity/shell is seen even before the exposure map correction (top right panel) when the sensitivity is the highest at the center of the image due to the vignetting. Naturally, correcting for the vignetting by dividing by the exposure map further enhances the appearance of the cavity/shell. Unfortunately, the size of the XRT field of view is too small to determine reliably whether it is indeed a dimmer cavity within the larger region of enhanced diffuse emission (e.g., hot gas in young stellar cluster), or whether it is simply a region bounded by a shell (e.g., due to an associated SNR). The analysis of the energy resolved images shows that the cavity/shell morphology is pronounced keV and barely noticeable keV. The CXO-ACIS-I field-of-view is even smaller in size, and hence it is not helpful in investigating this large-scale structure. It is also not as deep as the XRT image, due to the much shorter exposure and the substantial sensitivity degradation555https://cxc.cfa.harvard.edu/ciao/why/acisqecontamN0013.html keV.
3.1.2 Arcsecond scales
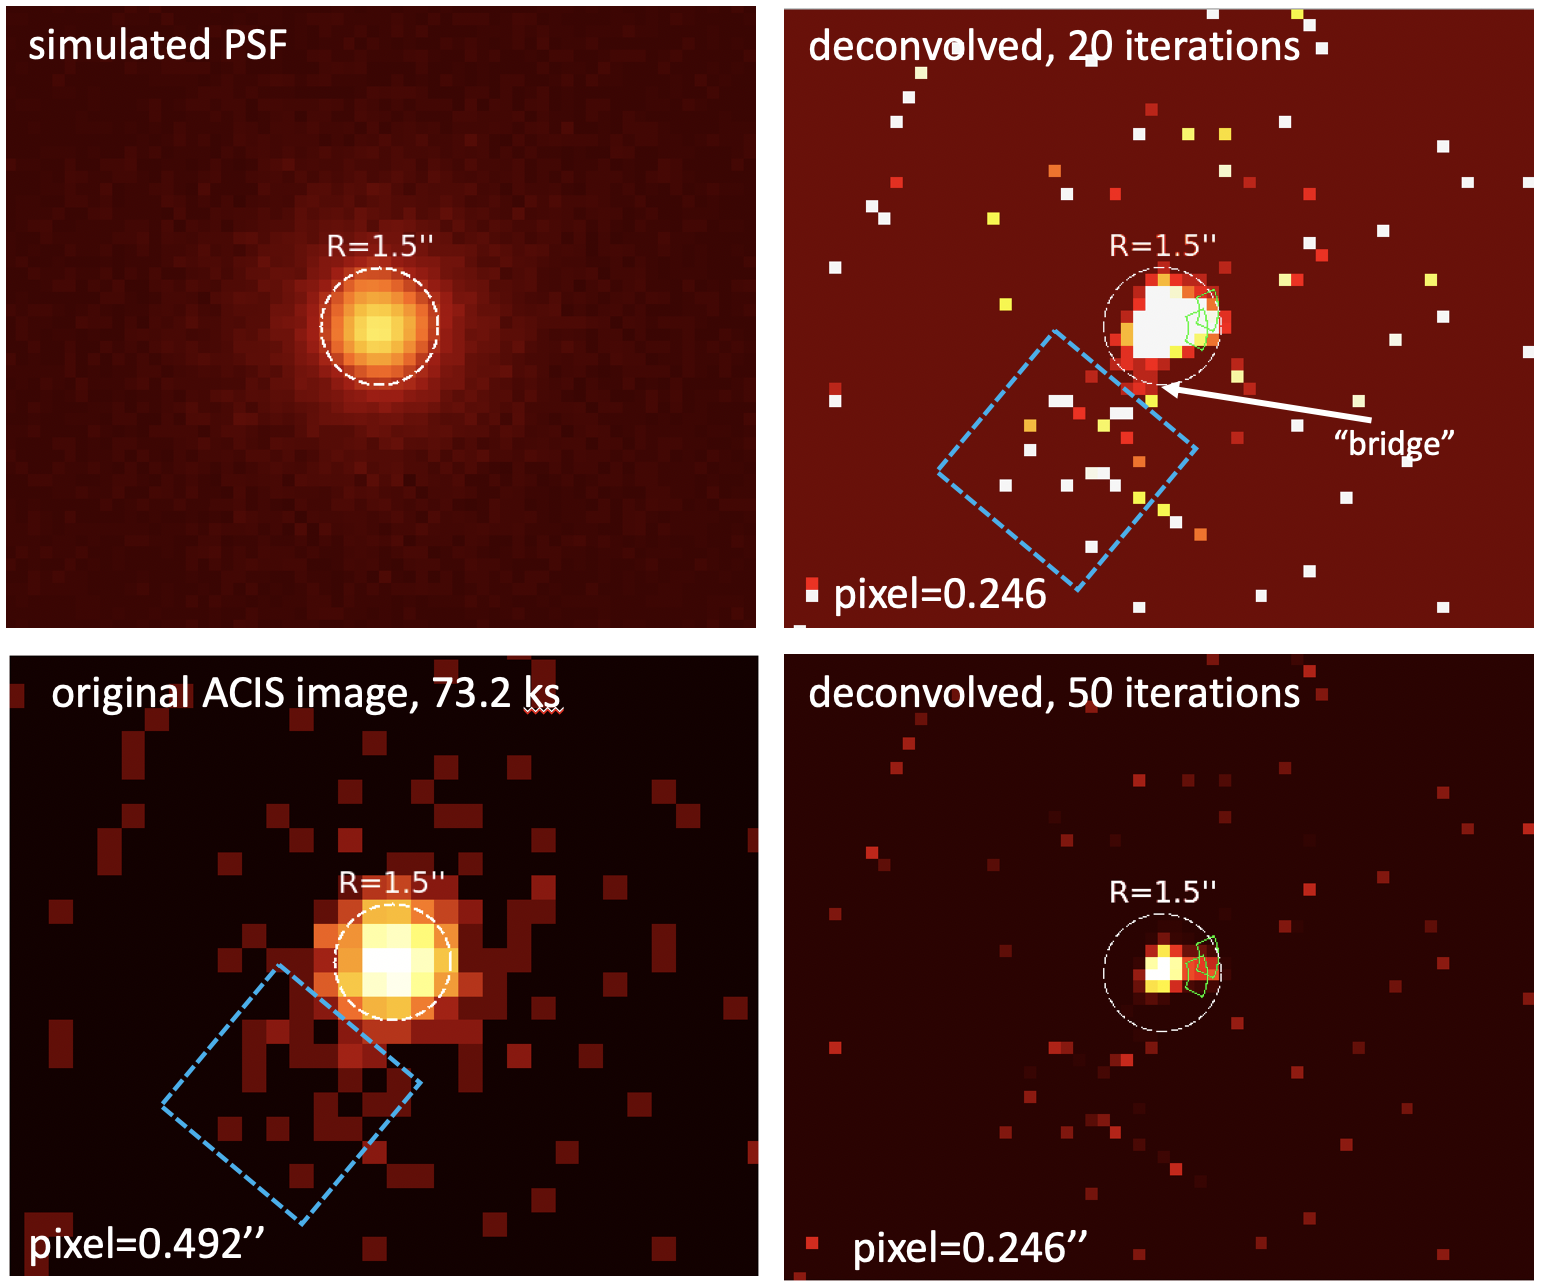
As the next step we performed careful evaluation of emission on smaller angular scales in the vicinity of the binary. Figure 3 shows a zoomed-in view of the binary obtained by combining two ACIS images from Epoch 2. Since these two observations are less than a day apart and the target is placed at nearly the same position with respect to the optical axis of the telescope (with the roll angles being nearly the same), we do not expect any issues in the combined image of J0632’s vicinity caused by non-uniformities on the chip or varying PSF. We also made sure that the images are well-aligned (using the field sources to check the alignment) before co-adding them. Even at the native ACIS resolution (bottom left panel in Fig. 3) there appears to be some excess of photons SE of the binary (within the blue dashed square). This excess seems to be present out to about from the binary but it is only significant at level666There are 24 photons within the dashed rectangle shown in Figure 3. If the same rectangle is placed on the other 3 sides the numbers of photons are 9, 14, and 15 (the average is 12.7 and standard deviation is 3)..
To look for the extended emission on even smaller scales, we followed the CIAO/Chart/MARX recipe777http://cxc.harvard.edu/ciao/threads/psf.html to simulate the observation-specific PSF (top left panel in Fig. 3) and used it with arestore888http://cxc.harvard.edu/ciao/ahelp/arestore.html to produce the deconvolved images with sub-pixel resolution (right panels in Fig. 3). The resulting image (deconvolved with 20 arestore iterations) in the top right panel shows a hint of “bridge” of emission in the direction of the above-mentioned excess (within the blue dashed square). The image also revealed the artifact caused by the known Chandra mirror defect999http://cxc.harvard.edu/ciao/caveats/psf_artifact.html whose position angle is quite different from that of the above-mentioned asymmetric excess. At 50 iterations (bottom right panel) the point source looks more concentrated but the asymmetric excess emission disappears. The latter is not surprising because the deconvolution procedure does not conserve the number of photons.
3.2 Timing
Several different orbital ephemerides have been suggested for J0632 (e.g., Casares et al. 2012; Moritani et al. 2018; Malyshev et al. 2019). There is currently no consensus on which ephemeris is the most accurate, and all suggested ephemerides have substantial uncertainties.
3.2.1 CXO
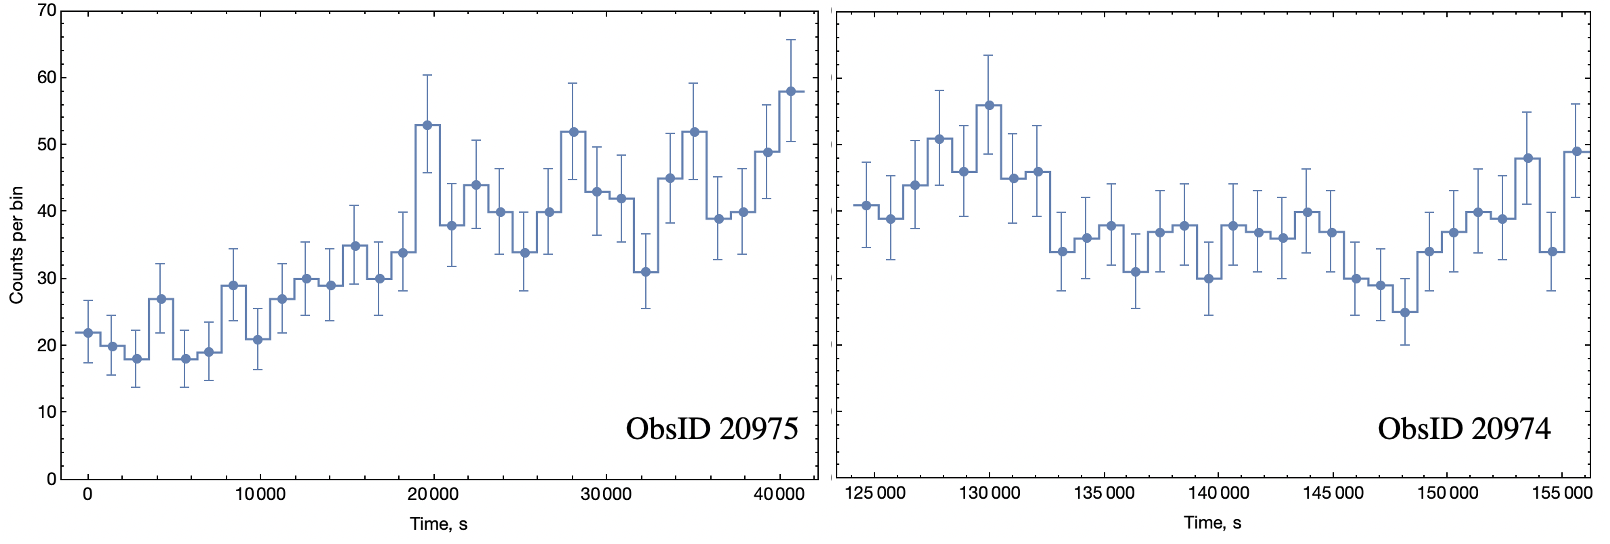
Across these ks observations, the J0632 count rate varues by a factor of 2 which suggests that spectral properties may also vary on these or shorter timescales (see Section 3.3.1). However, the number of photons collected by CXO does not allow us to meaningfully probe spectral changes on shorter timescales. More sensitive XMM-Newton observations must be undertaken to quantify the spectral variability on shorter timescales. Figure 4 shows the light curves101010We do not show light curves from the Epoch 1 observations because they are affected by the dithering across the chip gap. of two CXO observations from Epoch 2 with corresponding to the start time of the first observation (in both cases).
To search for possible periodic signals in the Epoch 2 data we first corrected the arrival times of all photons to the solar system barycenter using the CIAO tool axbary. Because of the uncertain binary ephemeris, we do not attempt to correct the photon arrival times for the binary motion (Römer delay; Blandford & Teukolsky 1976) while looking for a periodic signal in the ACIS-I data. The lack of an accurate orbital ephemerides represents a significant obstacle affecting the sensitivity of the previous searches for pulsations at high enough frequencies (Rea & Torres, 2011; Archer et al., 2020). However, the limited 3.2-s resolution of imaging CXO observations only permits a search for periodic pulsations up to Hz. This frequency is sufficiently low for us not to worry about the Römer delay correction. Indeed, the acceleration velocity of the compact object in J0632 does not exceed cm s-2 (see, e.g., equation B9 in Volkov et al. 2021) which is attained for the ephemeris from Casares et al. (2012). We searched for pulsations separately in each observation from Epoch 2 as well as jointly in both observations. For the joint search with total time span days (or 156,140 s), the native frequency resolution is Hz. The maximum shift in frequency around frequency during the time interval due to the binary motion can be estimated as Hz . Therefore, the maximum possible shift is Hz for Hz. This shift is comparable to the native frequency resolution Hz (the characteristic width of the peak in the Fourier power spectrum). Therefore, the signal should not be washed out substantially even for frequencies close to Hz. It is even more so for the individual observations because their time span is even smaller.
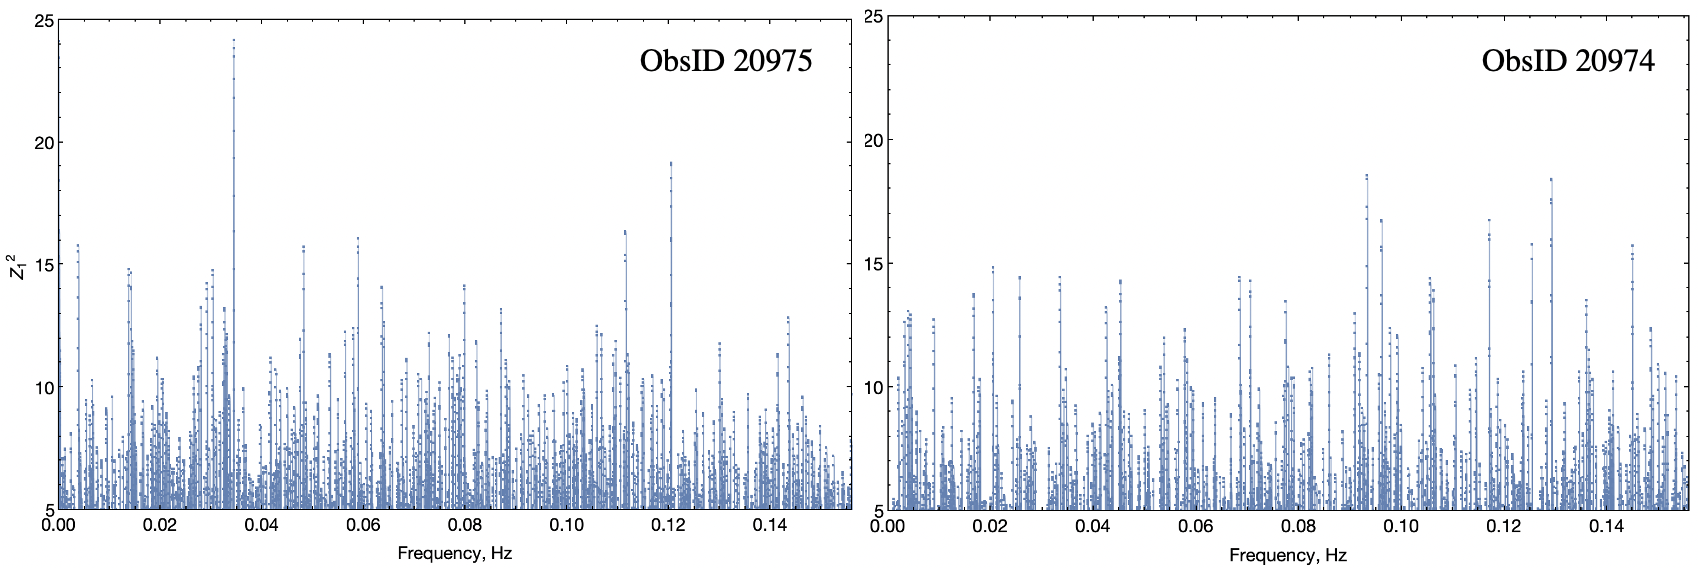
For CXO observations from Epoch 2 we calculated the Rayleigh statistic ( for n=1,2; Buccheri et al. 1983) on the grid of frequencies uniformly distributed between Hz and Hz. The grid provides a factor of 10 better resolution compared to thus ensuring that the peak values are accurately captured. The highest value, at Hz, was found for ObsID 20975. However, the significance of this value is only 96.35% after accounting for trials frequencies. This maximum value of is substantially smaller for the ObsID 20974 data. We also calculated for both observations taken together but the significance of the maximum value turned out to be smaller than 96%. Therefore, we do not find statistically significant periodic signal in the data.
To estimate the upper limits on the intrinsic pulsed fraction (the background correction is negligible) for periods in the range of 6.4 s to 20 ks from ObsID 20975 we solved equation (8) of Fierro et al. (1995) and found the limits to be 27%, 30% and 31% at the confidence levels of 95%, 99%, 99.7%, respectively. These limits are comparable to 32%–48% (in 0.005–8 Hz; at 99.7% confidence) obtained from XMM-Newton observation obtained near and analyzed by Rea & Torres (2011).
3.2.2 Swift
Since each XRT observation collected relatively few photons and the observations were spread over many years we did not attempt to search for a periodic signal from the compact object. We only use XRT arrival times to produce the binary light curve and assign binary phases to the data. Zero phase, , was set to be MJD and the binary period used for the folding was days as reported in M+19 who analyzed a similar amount of Swift-XRT data from the archive. All phases given below rely on the M+19 ephemeris, unless specified otherwise.
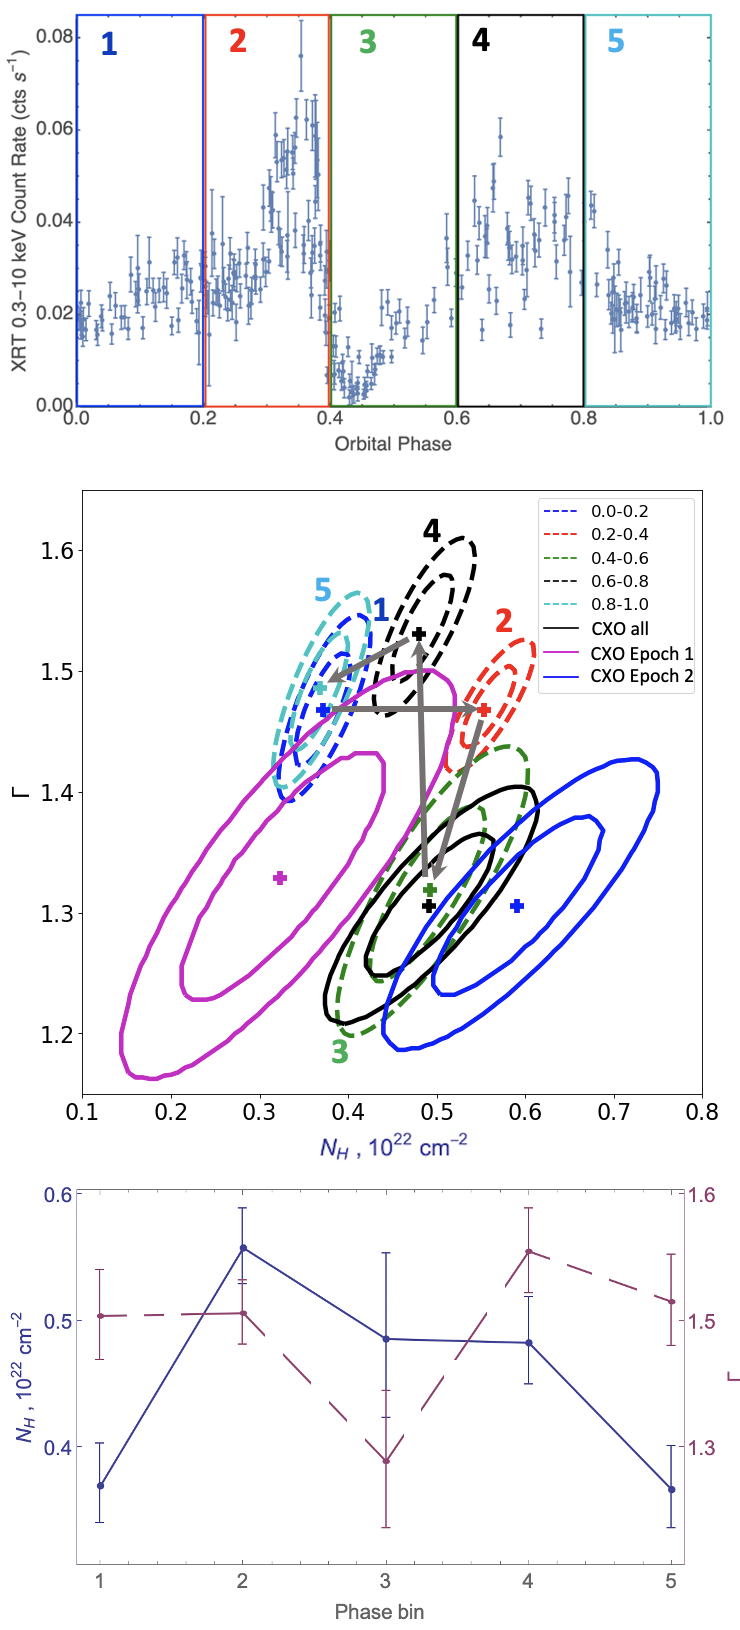
Figure 5 (top panel) shows the J0632 light curve where each datapoint corresponds to average count rate in a single XRT observation. We use the light curve to define 5 equally-sized intervals (0.2 in phase) motivated by the light curve morphology, from which we extract and fit spectra in Section 3.3.2. The XRT data used in our analysis span approximately 10 binary cycles. There are some moderate changes in the shape of the light curve (particularly near the two light curve maxima) between the binary cycles. These changes can be seen from Figure 2 in M+19, but we use our own multi-cycle light curve shape for defining the 5 broad phase bins. We also note that the light curve shown in Figure 2 of M+19 plots flux versus the binary phase. The conversion from from count rate to flux is subject to uncertainty due to impossibility of determining the spectrum from a single XRT observation which, on average, contains only photons from the source. Therefore, if the spectrum changes (which it does as we show below) and the conversion is based on the averaged spectrum, the resulting fluxes will be inaccurate.
3.3 Spectra
3.3.1 CXO
Below we fit the CXO spectra of J0632 from the imaging and continuous clocking (CC) mode observations as well as the spectrum of the resolved extended “blob” located east of the binary using imaging observations only.
Imaging observations: For J0632 we extracted the spectra from all 4 observations using an circle centered on the binary using CIAO’s specextract script. Since the effective area calculation takes into account the reduction of sensitivity due to the dithering across the ACIS-I chip gap, we included in our analysis both Epoch 1 and 2 data. There are a total of 3,168 photons within the extraction aperture from all 4 data sets taken together. Since the source is bright, the background contribution within the extraction aperture is very small and can be neglected for all energies. We first fitted all four spectra of J0632 (see Figure 6, left) simultaneously with an absorbed PL model where normalizations were untied (they are clearly varying between the 4 observations) while the photon index, , and the absorption Hydrogen column density, , were tied together. The fit quality was good with the reduced =0.994 for 86 degrees of freedom (d.o.f). The best-fit PL has and cm-2. The average absorbed flux in 0.5-8 keV is erg cm-2 s-1.
The two epochs of CXO observations differ in binary phase only slightly, by . Both observations took place right after where there is a sharp transition from light curve maximum to the light curve minimum (see below). One can expect to see spectral variability associated with the transition. Therefore, we separately fitted spectra from Epoch 1 and Epoch 2 with an absorbed PL model. For each epoch (consisting of two observations) the spectra were fitted simultaneously with normalizations being untied (due to the variability on small timescales; see Figure 4) and the rest of the fitting parameters being tied together. For Epoch 1 we obtained cm-2, , and fluxes of erg cm-2 s-1 and erg cm-2 s-1 for the first and second observations111111The values are different since the model normalizations were untied., respectively. For Epoch 2 we obtained cm-2, , and fluxes of erg cm-2 s-1 and erg cm-2 s-1 for the first and second observations. These results indicate changes in the hydrogen column density and flux, but no measurable changes in the spectral slope. Since the uncertainties of and are strongly correlated, the differences are best represented by the confidence contours shown in Figure 5. Note that the values of fluxes indicate that the observations took place at the lowest (faintest) state, in agreement with the expectations for these phases (cf. “fluxed” light curve from Swift-XRT shown in the left panel of Figure 2 in M+19).
We also extracted the spectrum of the “blob” (Figure 6, right panel) from an region centered on the blob. In this case we extracted the background spectrum from a source-free circular () region located on the same chip. The total number of counts from all 4 observations is 1,229, of which only 30% are from the “blob” while the rest are from the background. We fitted the spectra from all four observations simultaneously with an absorbed PL model. For visualization (only) purposes, we co-added spectra from all 4 observations (and their responses) and show the total spectrum together with the best-fit model (based on the simultaneous fit to all 4 spectra). The fit quality is good with 0.77 for 21 d.o.f. The best-fit cm-2 and . We also fitted the spectrum with a thermal plasma (mekal) model121212A thermal Bremsstrahlung model gives very similar parameters and quality of the fit. and obtained an equally good fit with cm-2 and keV.
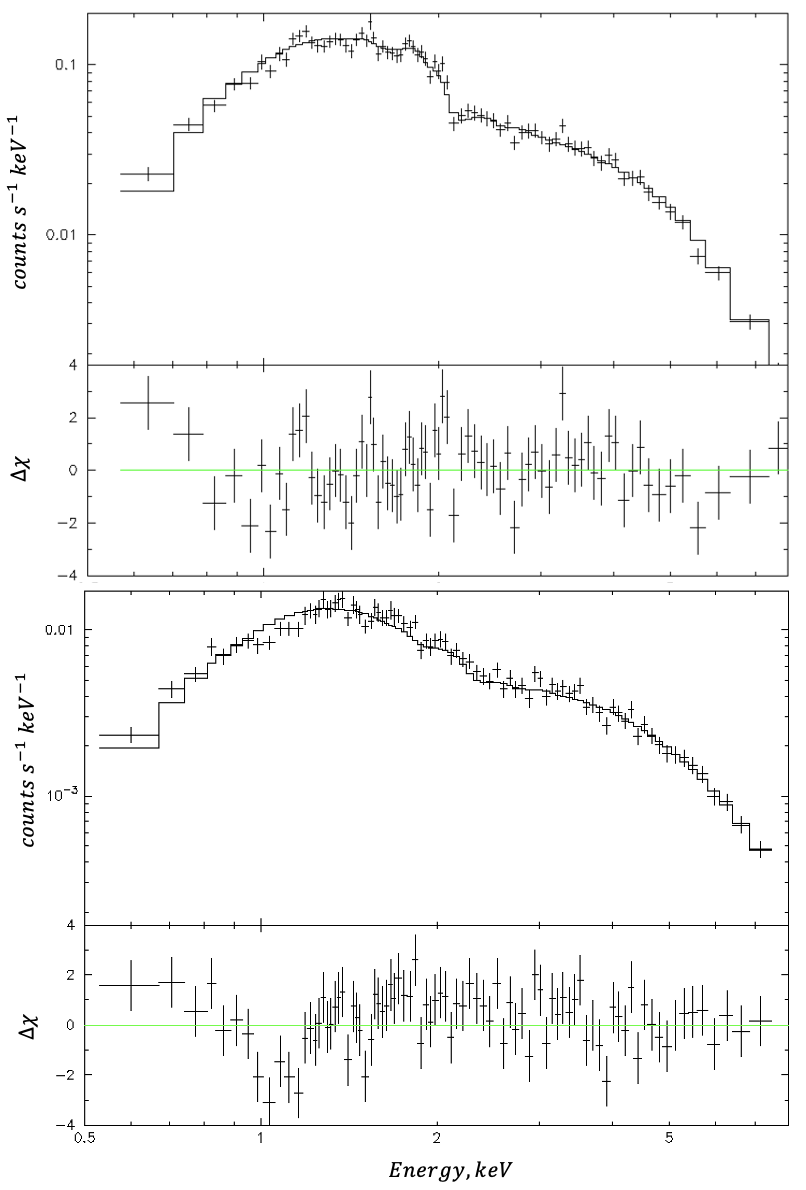
CC-mode observation: We also fitted the spectrum of J0632 from the ACIS CC-mode observation that occurred near . The source spectrum was extracted from a -long box while the background was taken from two -long boxes flanking the source region (with gaps between the source and background regions). Prior to fitting, we grouped the source spectrum by a minimum of 50 counts per bin and fitted it with an absorbed PL model (see Figure 9, top panel). The fit quality was good with the reduced =0.99 for 156 d.o.f. The best-fit PL model has and cm-2. The corresponding absorbed flux in 0.5-8 keV is erg s-1.
3.3.2 Swift
We also perform both phase-integrated and phase-resolved fits to the Swift-XRT spectra and compared the results to those from the CXO spectral fits. We note that, unlike M+19, we used a factor of 2 larger phase bins defined by the global changes in the light curve shape to increase the statistics and sensitivity to spectral changes, if the latter are correlated with the light curve morphology.
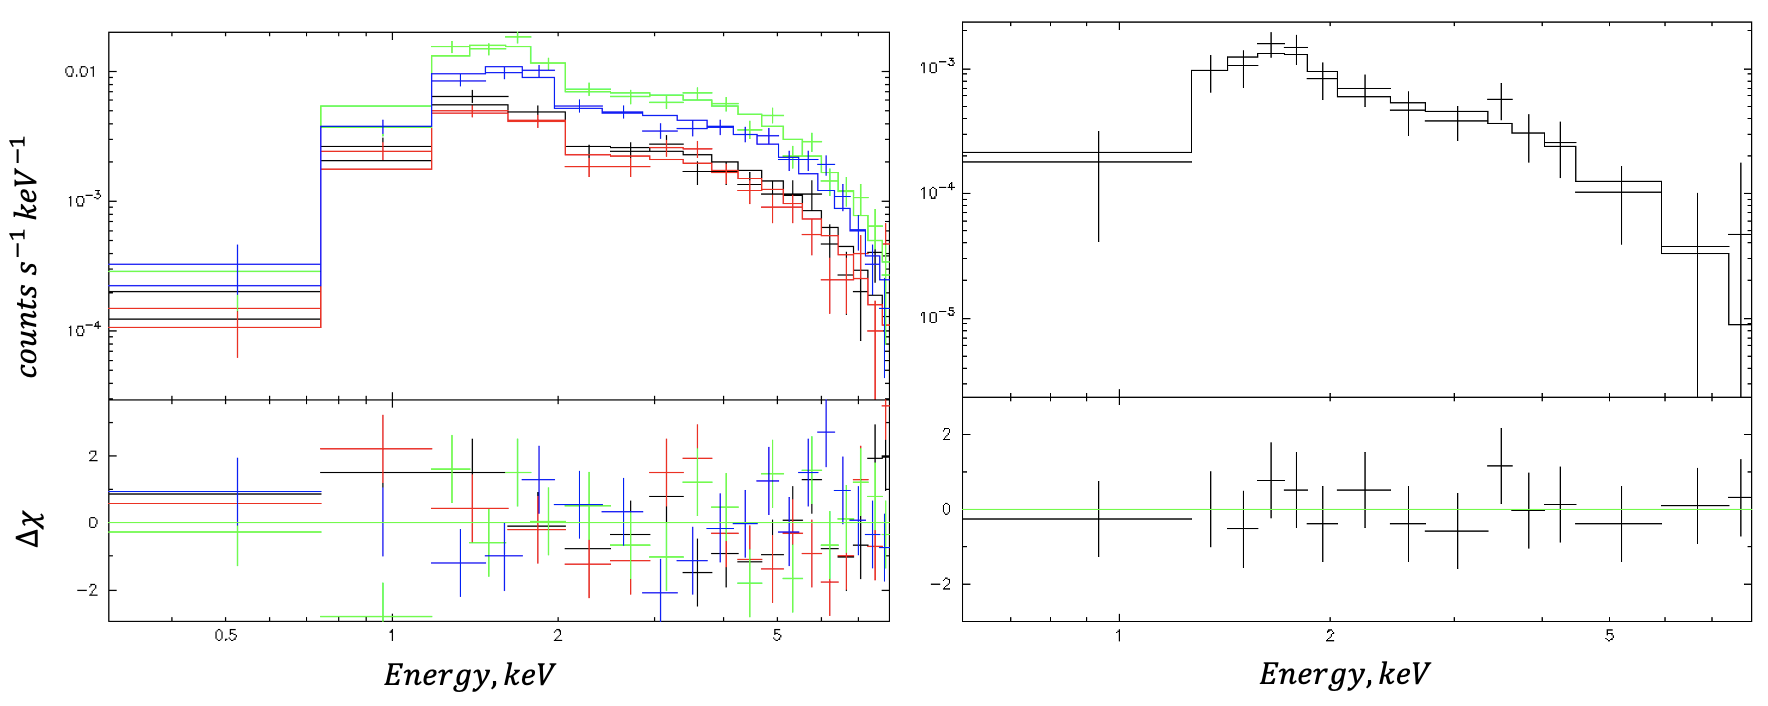
Merged spectrum from all XRT observations: The XRT spectra were extracted from the 275 XRT observations and combined into a single spectrum using the Swift-XRT data products generator131313The pipeline picks an extraction radius based on the source’s count rate in each observation. In most of the XRT observations the count rate in the cts s-1 range, so an pixel () extraction aperture was used. See Evans et al. (2009) for details.. The combined spectrum contains 20,889 photons (cf. 3,168 in all 4 ACIS-I observations). We binned the spectrum requiring a minimum of 50 counts per bin and fitted it in the 0.3-10 keV energy range. The background (taken from a source-free annulus around the source) contribution is only in 0.3-10 keV, and, hence its impact on the fits is negligible except in the highest and lowest energy bins. As can be seen from Figure 7, the fit with an absorbed PL model (best-fit cm-2 and ) is bad ( for ) due to the large systematic residuals around 1 keV and the less substantial residuals between 6.4-6.8 keV. However, if the fit is restricted to keV (Fig. 7; right panel) the spectrum can be adequately described (1.00 for 263) by an absorbed PL model with and cm-2 with the only noticeable residuals localized around 6.4 keV. Alternatively, the entire 0.3-10 keV spectrum fits well ( for ) by an absorbed PL with cm-2, and a Gaussian absorption line centered at keV with width eV. Note that for the fits in the 0.3-10 keV range, the value of does not depend on whether the gabs component is included or not because the value is largely determined by the spectrum at energies below the absorption feature. The value of is only slightly affected by the inclusion of the gabs component. The same spectrum can be described equally well () by a Bremsstrahlung141414or high temperature thermal plasma, e.g., apec. model with cm-2, keV, normalization cm-5, and absorption line with keV and eV. Note that all there fits still exhibit well-localized residuals between 6.4 and 6.8 keV. The larger value for the PL fit restricted to keV energies can be explained by the increase in accounting ro the residuals around 1 keV which does not happen when the lower energies are included.
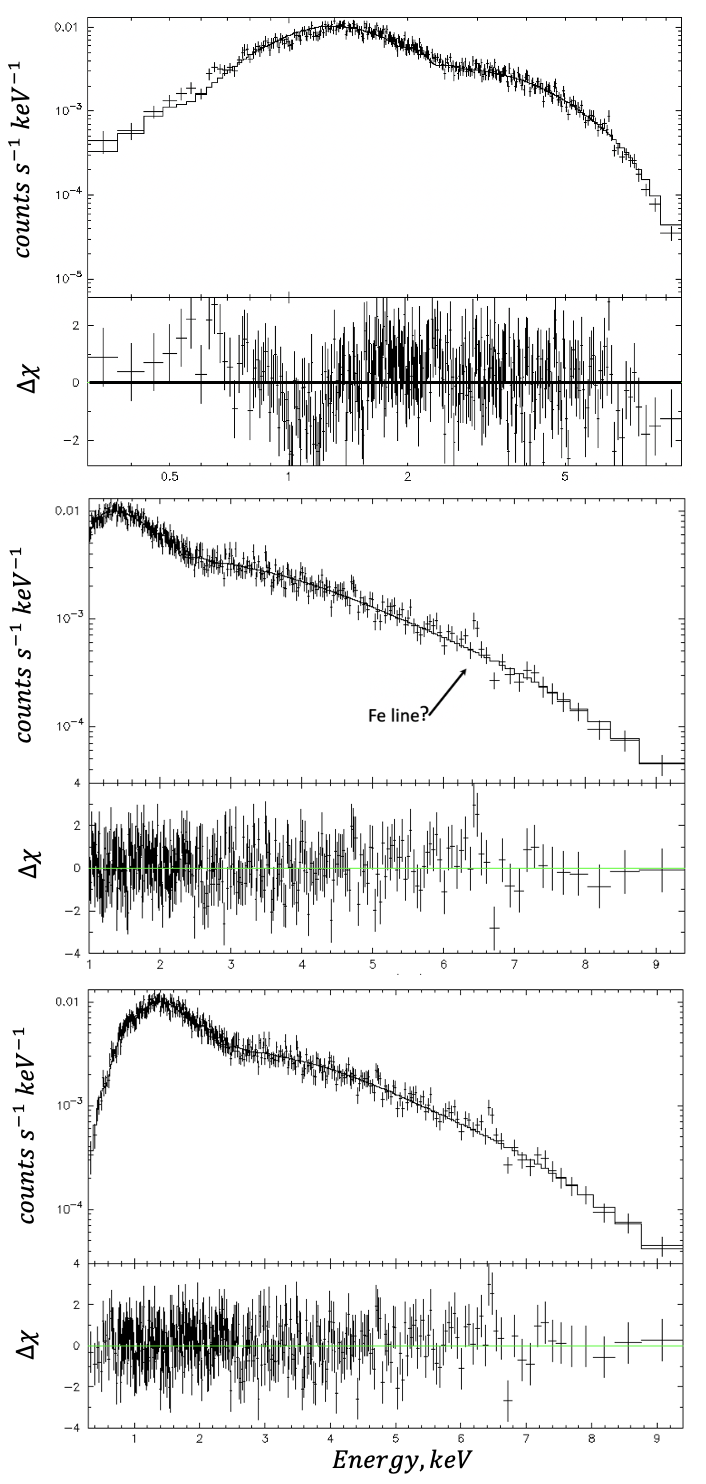
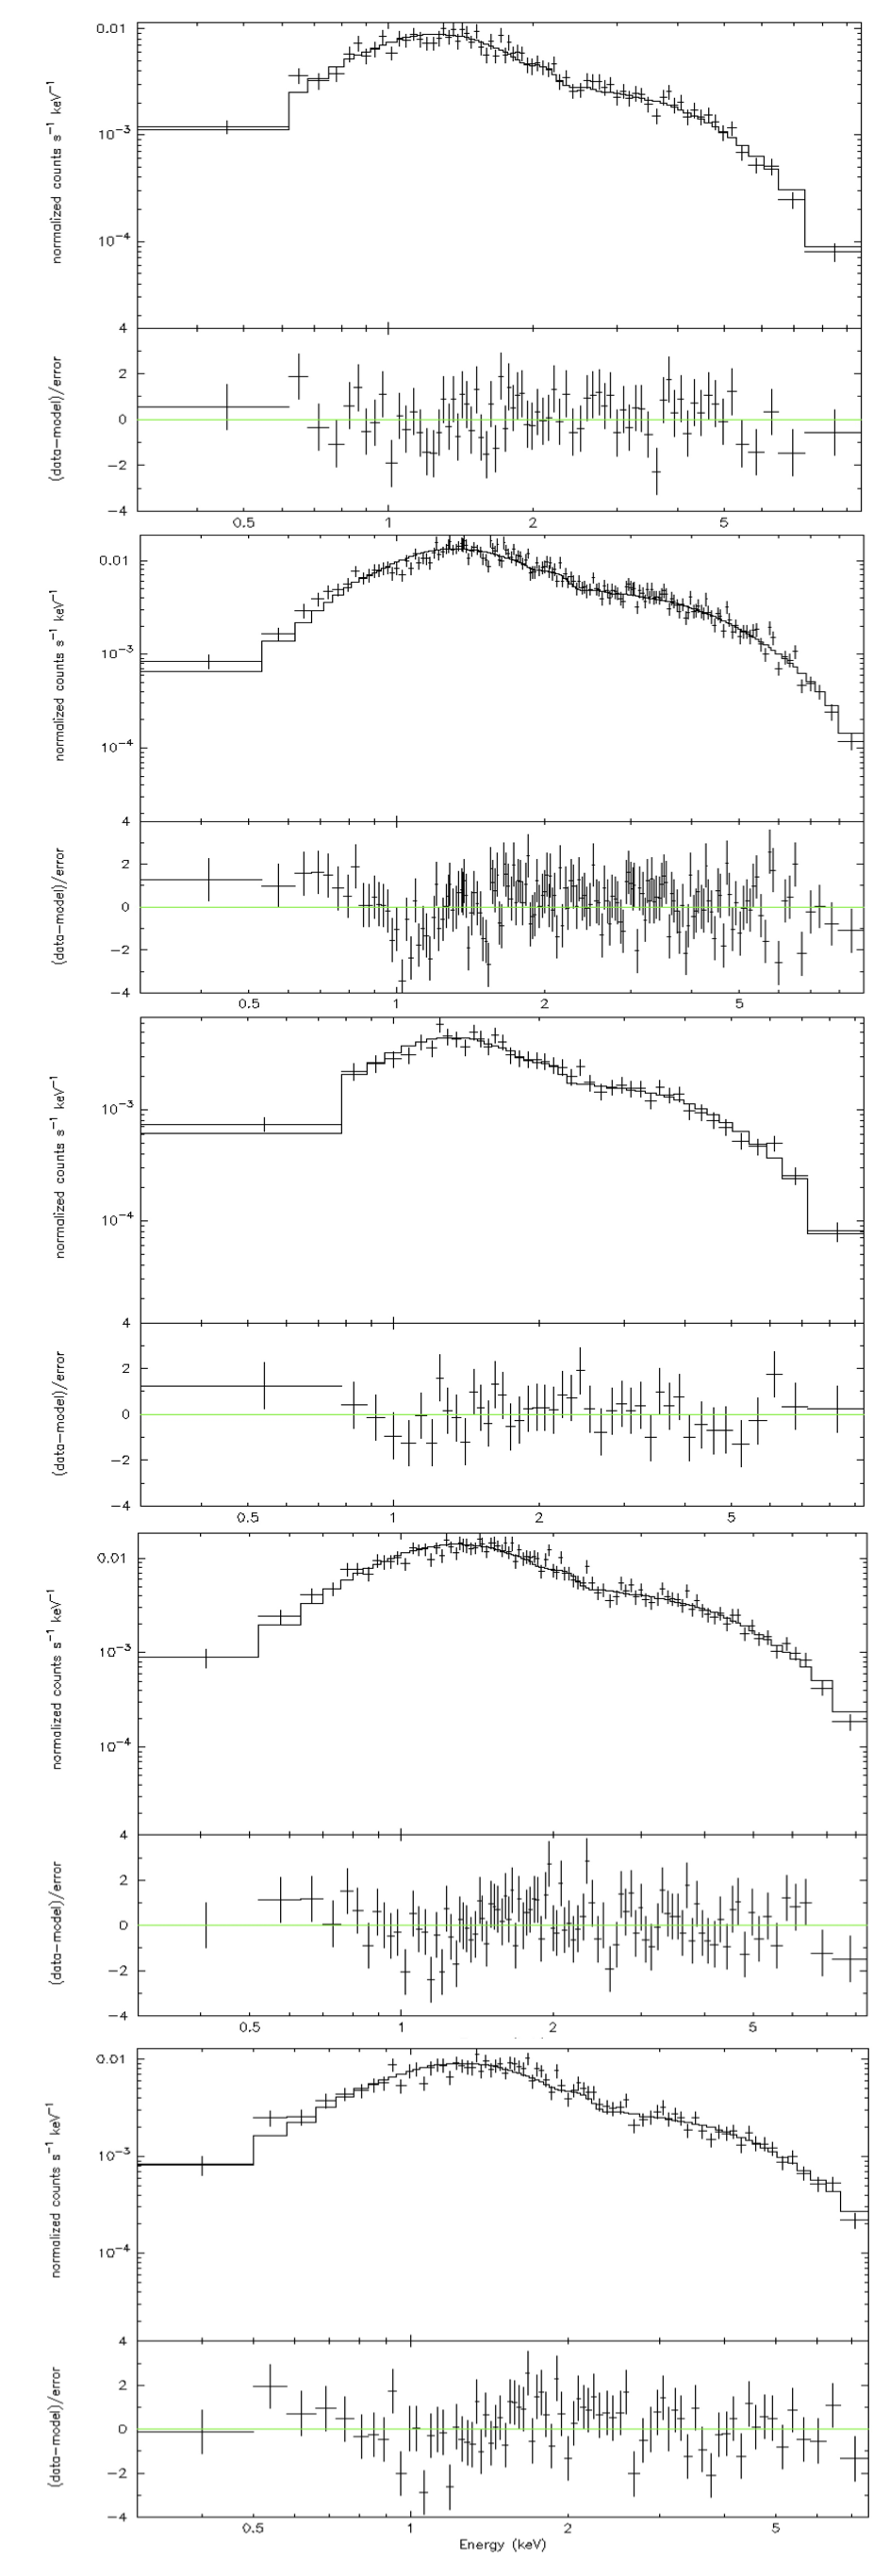
Phase-resolved spectra: Intrigued by the residuals seen in the absorbed PL model fits to the merged spectrum, we explored the phase-resolved spectra to see if the magnitude of these residuals varies with the binary phase. The large residuals around keV (for the simple absorbed PL model) could be the result of combining spectra that vary with time (e.g., the circumbinary contribution to may vary). We combined the spectra from observations belonging to each of the five phase bins (shown in Figure 5, top panel) into five merged phase-resolved spectra using the same Swift-XRT data products generator. The phase-resolved spectra fitted with an absorbed PL model are shown in Figure 8. The best-fit values of and , and the corresponding confidence contours are plotted in Figure 5. The contours imply varying and somewhat less significant changes in . The XRT values of and for the phase bin 3 are consistent with those from the joint fit to all 4 CXO-ACIS spectra. For simplicity, we do not include the component while determining and . We do not expect these values to change substantially if was included, based on what we saw for the phase-integrated spectra (see above). The putative 6.4 keV feature from the phase-averaged XRT spectrum is not noticeable in the phase-resolved spectra, which suggests that the photons contributing to the weak feature in the combined spectrum are not concentrated in one of the 5 phase bins. Conversely, the systematic residuals near 1 keV to be the strongest in the 2nd phase bin (which includes the light curve peak) with the weaker residuals seen in the spectra from some other phase bins (4 and 5). Therefore, we conclude that the large residuals around keV are not likely to be of instrumental origin. Another observation that was taken near the light curve maximum is the CXO-ACIS CC-mode observation that occurred at at . Interestingly, an absorbed PL model fit to this spectrum (see Figure 9) also shows some residuals near 1 keV but they are not exactly the same as in the XRT spectrum from the 2nd phase bin ().
4 Discussion
J0632 is one of the few known Galactic HMGBs for most of which the nature of the compact object remains elusive. Pulsars were only identified in LS 2883/B1259–63 and TeV 2032+4130 which have substantially longer orbital periods (3.5 and years, respectively) compared to J0632. In both cases, extended emission has been resolved with CXO (Hare et al., 2019; Albacete Colombo J. et al., 2020). In the case of TeV 2032+4130, this emission is seen on larger angular scales and is likely to be nonvariable (at least over a decade time scale). The arcminute-scale emission can be attributed to the PWN powered by the young PSR J2032+4127, which is only very infrequently perturbed by the passage of a massive star due to the very elliptical orbit. On the other hand, for a much more compact LS 5039 HMGB with a 4-day orbital period, arcimunte-size X-ray emission has been reported by Durant et al. (2011) while Paredes et al. (2007) found tentative () evidence for a more compact, in diameter, faint extended emission in the 50-ks CXO observation of HMGB LS I +61 303 having orbital period of 26.5 days.
For B1259, most of the arcsecond-scale extended emission is strongly variable. The brightest part of it are the episodic ejections in the direction of the binary apastron likely launched near the time of periastron passage. The ejected clouds, which most likely represent shocked and compressed pulsar wind (with a possible admixture of stellar wind), appear to accelerate and expand as they move from the binary. The ejected blobs are not always visible because they fade and/or dissipate sooner than the next one is ejected during the subsequent periastron passage. Moreover, it appears that the ejecta clumps vary in intensity and sometimes may not be discernible while still contributing to a fainter asymmetric diffuse emission reported first by Pavlov et al. (2011) (Figure 1, bottom panel, in that paper). This faint asymmetric emission is also oriented in the direction of apastron and may represent the remains of multiple smaller and slower moving ejections.
For the only other Galactic HMGB with a known pulsar, TeV J2032+4130 (PSR J2032+4127), the faint arcminute-scale diffuse emission was first noticed in the 50-ks CXO-ACIS observation. Recently, Albacete Colombo J. et al. (2020) re-analyzed 166-ks of CXO data from multiple observations and showed the combined image (in their Figure 1) where the hard diffuse emission surrounding TeV J2032+4130 is seen much more clearly. This hard spectrum supports the PWN interpretation of this emission which must be powered by PSR J2032+4127.
The CXO images of J0632 hint at an asymmetric emission, albeit at a lower significance than for B1259, which may also be extending in the direction of periastron (see Figure 7 in Moritani et al. 2018). Unfortunately, the emission is too faint to say anything definitive about its spectrum or morphology and the direction to periastron is not certain (see Figure 2 in Archer et al. 2020). We note that for B1259–63, the faint asymmetric emission becomes apparent only in deep ACIS exposures. Therefore, a deeper ACIS imaging of J0632 may be warranted.
The evidence for the shell/cavity around J0632 is intriguing. If confirmed with observations having larger field-of-view, it could represent the host SNR of J0632. For the radius of (see Figure 2) the nominal Sedov age estimate gives yrs where cm-3 is the local ISM density and erg is the SN explosion energy.
As one can see, young rotational pulsar of this age is excluded, because it would be much more luminous than observed. It means either the shell-like structure is not associated an SNR forward shock, the distance or the density is much larger than assumed, or the compact object is not a typical rotation-powered pulsar (Kargaltsev & Pavlov, 2008).
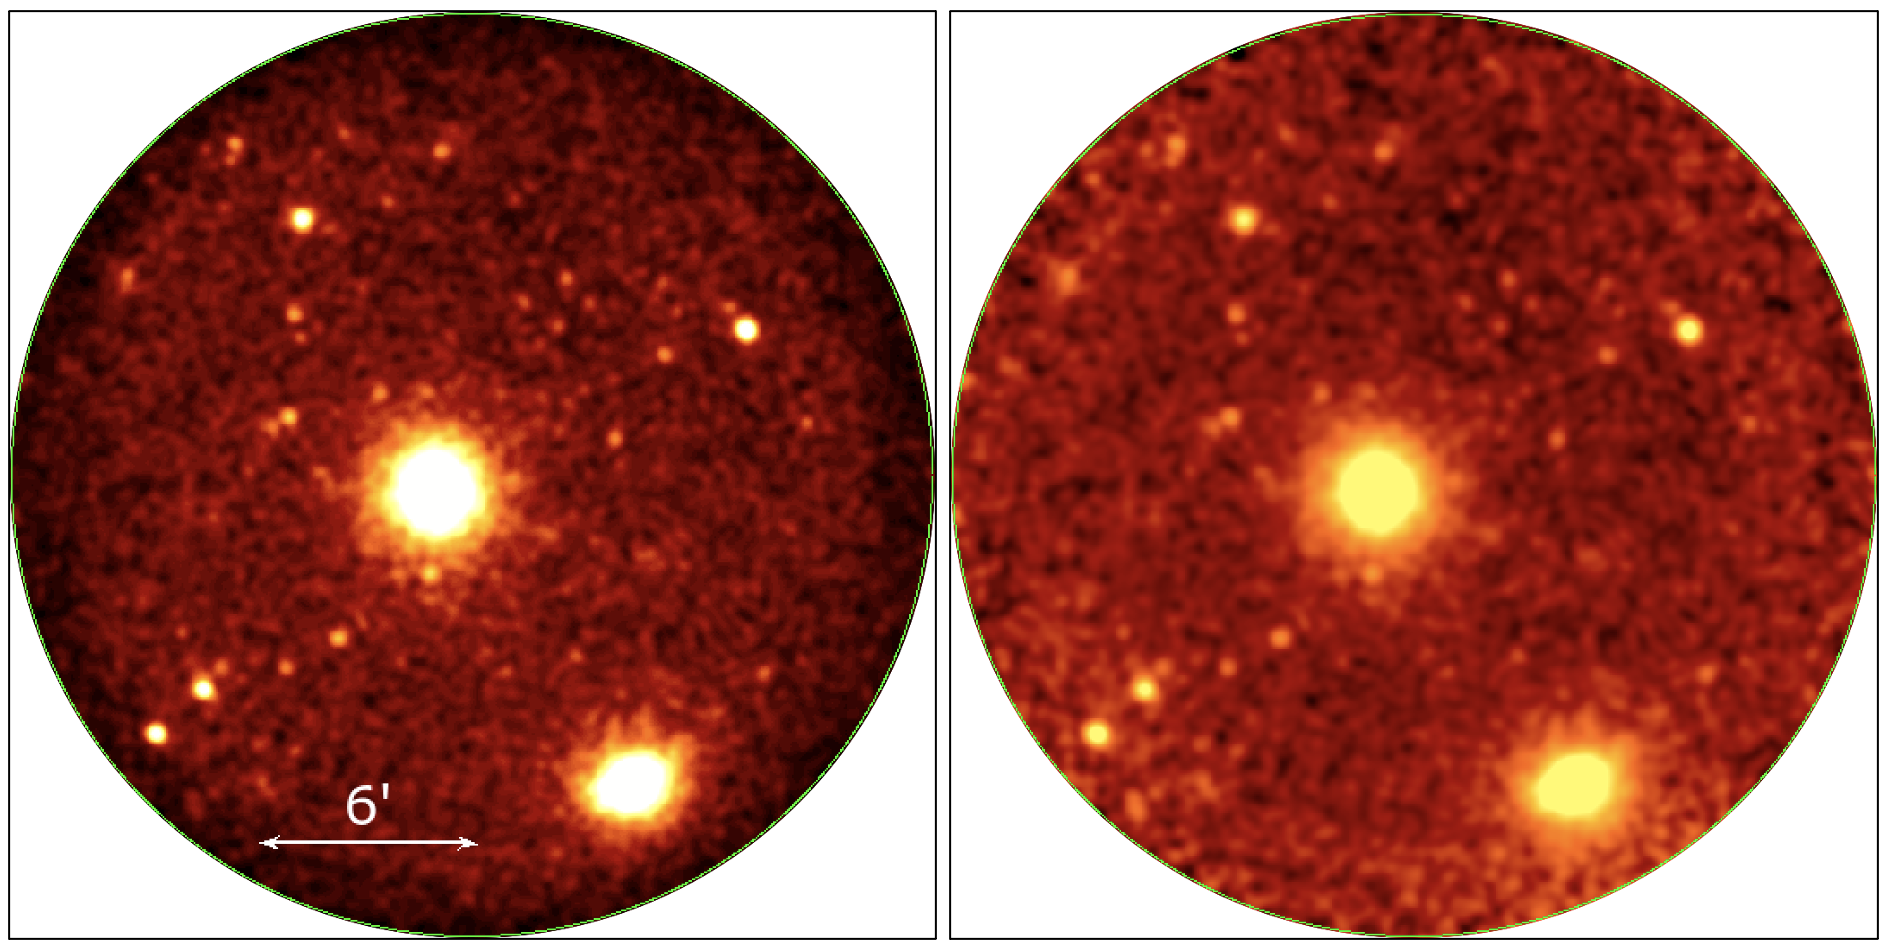
We note that in the case of B1259, where the age of the compact object is kyrs (the pulsar spin down-age), no extended emission was previously reported on arcminute scales. To look for such emission we have co-added 164 archival Swift XRT observations151515Although there are many CXO ACIS observations of B1259–63, only a small subarray was activated during those observations making then not suitable for searching for extended emission on large angular scales. of B1259–63 (310 ks of exposure in total) in a way similar to how we did it for J0632. The resulting images, shown in Figure 10, do not reveal any obvious extended emission on arcminute scales nor they show a shell/cavity similar to what we see for J0632 (cf. Figure 2). The lack of the SNR would not be surprising in the case of B1259 if the spin-down age is a fair estimate of the true age because the host SNR of PSR B1259-63 would have dissipated at the age of 300 kyrs. The non-detection of the shell/cavity in B1259 also helps to conclude that the shell/cavity structure seen in the deep XRT image of J0632 is unlikely to be caused by instrumental effects.
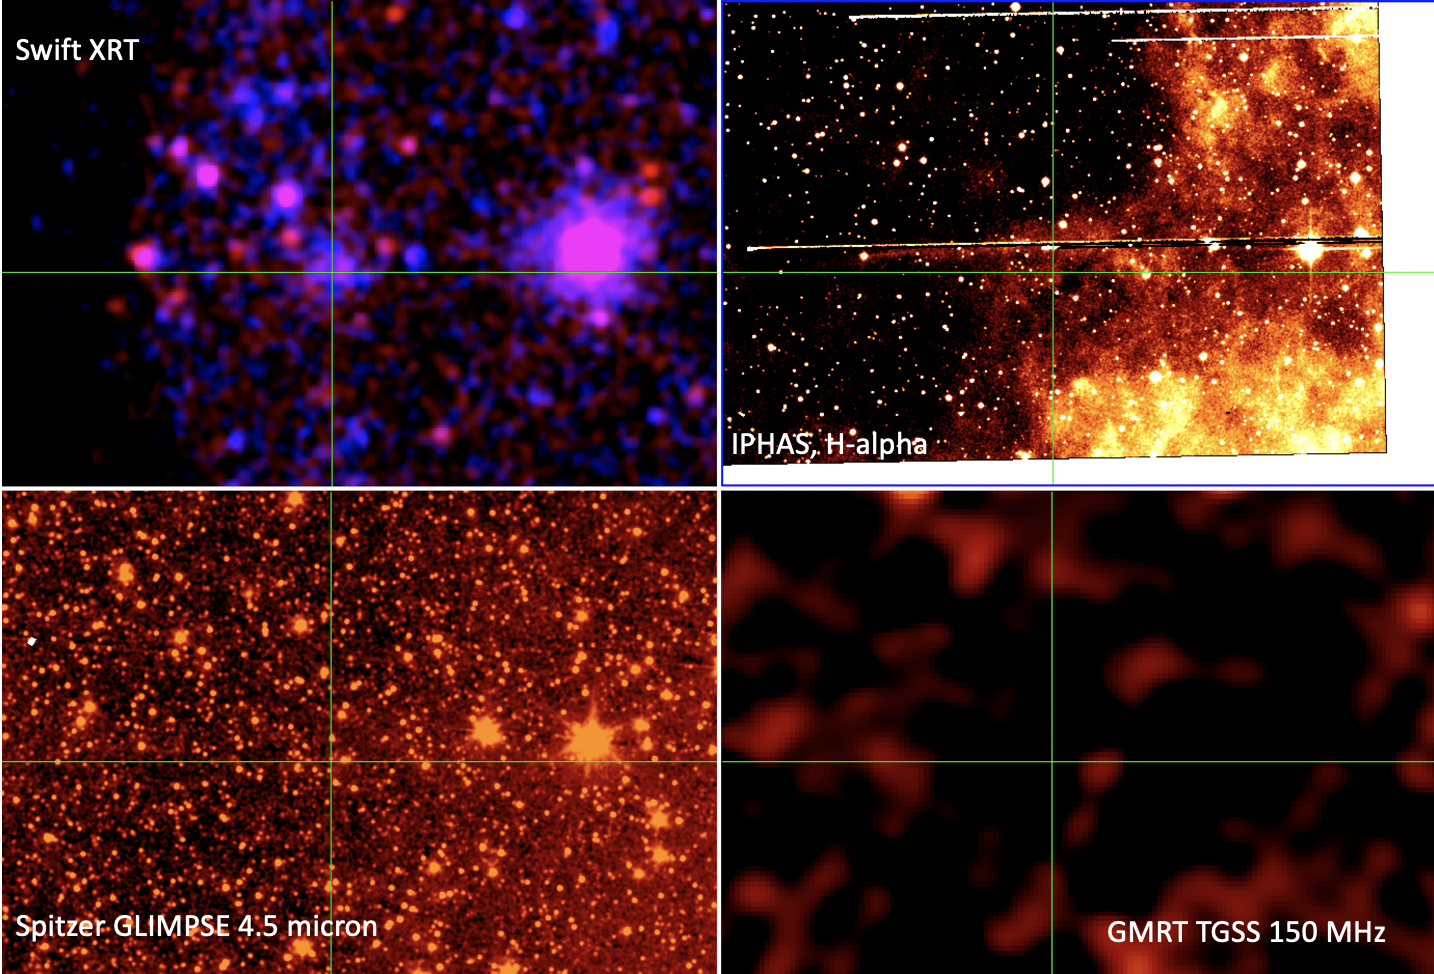
In addition to the shell/cavity structure with non-uniform enhancements, the only other arcminute-scale structure resolved both in ACIS and XRT images is the puzzling blob located east of the pulsar. The blob did not change its position over the period of time of 9 years covered by Swift and CXO observations, which precludes motion with speed that would have resulted in a noticeable, , shift during 9 years (cf. the clumps ejected from B1259 which are moving with an average velocity of ; Hare et al. 2019). The spectrum of the blob, is relatively hard and can be described by an absorbed PL with and cm-2, or by a thermal plasma emission with keV and cm-2. These values are rather uncertain, but appears to substantially larger than that for J0632, thus disfavoring the relation between the two. The spectra of the clumps ejected from B1259 are harder, with (Hare et al., 2019). However, similar to the clumps in B1259, the blob does not appear to have a counterpart at lower wavelengths (see Figure 11) including the Spitzer-IRAC images where a young cluster or a star-forming region would be apparent. If the shell/cavity structure seen in the deep XRT image of J0632 is indeed associated with the host SNR, then the blob could be also part of the SNR structure but the for the blob would still be unexplained.
The recent report of possible magnetar-like periodicity in LS 5039 (Yoneda et al., 2020) prompted us to search for pulsations in ACIS data up to 0.156 Hz, the maximum frequency afforded by the ACIS time resolution in the imaging mode. The strongest evidence of periodicity found, at s, is only significant at the 96% confidence level, which is too low to confidently claim a detection. The limiting maximum frequency of our search (0.156 Hz) is low enough to neglect the Römer delay. Rea & Torres (2011) performed searches up to 180 Hz near the light curve maximum using the CXO-ACIS CC-mode observation and up to 8 Hz using XMM-Newton-EPIC with negative results. However, without a Römer delay correction, which requires knowing an accurate binary ephemeris, it is difficult to find the periodic signal at high frequencies using a simple periodogram approach. Therefore, the non-detection of periodicity does not rule out a young pulsar nature of the compact object in J0632. Once a more accurate binary ephemeris is obtained, it would be worthwhile to revisit the CXO-ACIS CC-mode observation to see if pulsations can be detected. In the absence of an accurate ephemeris, a more promising approach to the detection of possible pulsations would be collecting more photons within shorter time interval(s) for which the binary motion correction is unimportant. This could be done with XMM-Newton (in Small Window mode) or with NICER (given the lack of bright nearby objects).
Thanks to the multiple CXO observations, we are able to explore the spectral variability on short timescales. Despite having both ACIS epochs during the flux minimum state (since they both show similar average fluxes corresponding to that of the minimum state according to XRT measurements; see left panel of Figure 2 in M+19), we observed a difference in values between the two epochs separated by 15-18 days. This may be caused by the observer’s line-of-sight passing through an inhomogeneous circumbinary medium (e.g., clumpy wind of the massive star). If so, one could, in principle, see variation on even smaller timescales if larger number of photons is collected using with XMM-Newton or NICER. For the clumpy wind scenario, measuring variability timescale(s) for could put a limit on the size(s) of the Be-star wind clumps that are farther away from the star than the compact object (for an accreting BH or NS scenario) or the intrabinary shock (for the young pulsar scenario). In the latter case the characteristic size of inhomogeneities can be estimated as cm, which is the distance traveled by the pulsar near the periastron in one day scaled to the velocity expected for the putative pulsar in J0632 near periastron. Therefore, in the variability on timescale of a week caused by the clumpy wind near periastron, then the size of the clump would be roughly about 10 times larger than the star radius at the distance (from the massive star) where the clump meets the pulsar. Since the clumps are expected to expand as they travel away from the massive star this size may be reasonable. Moreover, variations in may be occurring on smaller timescales which cannot be probed with the existing data quality and then the estimate given here is rather an upper limit on the clump size.
To characterize the variability on larger timescales and check if the CXO observations near the light curve minimum result in fluxes which are in agreement with previous measurements, we extracted XRT spectra from 5 spectral bins. One of these bins () encloses the phases of the CXO observations. We found that, for the combined spectrum of all XRT observations within that phase bin, both the best-fit and are in good agreement with those inferred from the CXO spectrum (see Figure 5). The agreement suggests that although does exhibit noticeable fluctuations on a smaller timescales, these fluctuations can average out because the value indicated by the XRT spectral fit is based on multiple XRT observations from multiple binary periods. The evolution of J0632’s spectral parameters with the phase suggest that increases significantly (almost by a factor of 2) during the light curve maximum, stays fairly large (on average) during the light curve minimum, and then returns to a lower value for the rest of the orbit. The spectrum marginally hardens during the light curve minimum but for other 4 phase bins the slope of the spectrum remains approximately the same. The large change in could be naturally explained by increased obscuration near the periastron, when the compact object might be passing through a decretion disk of the Be star (see Figure 4 in M+19; also Adams et al. 2021). We, however, note that the ephemerides calculated by both Casares et al. (2012) and Moritani et al. (2018) place the periastron at very different phases from the light curve maximum (see Archer et al. 2020). If one of these ephemerides is correct, then a different explanation for the increase in during the light curve maximum may be needed. Guided by their numerical simulations and the ephemeris from Casares et al. (2012), Bosch-Ramon et al. (2017) suggest that the sudden drop after the lightcurve maximum is associated with the disruption (in the apastron direction) of the surrounding dense stellar wind shell by the accumulating energetic pulsar wind. This would support having periastron near the lightcurve minimum. Finally, we note that the existing data support correlation between the X-ray flux and unlike the anti-correlation seen in LS 5039 (Volkov et al., 2021). This result is in agreement with the findings reported by M+19 and Moritani et al. (2018) for J0632.
The phase-resolved spectra (see Figure 8) show the substantial phase-dependent residuals (for either the absorbed PL fit) centered around 1 keV and a weak Fe K line near 6.4 keV which does not seem to exhibit strong dependence on the binary phase. The 6.4 keV line is only visible in the merged spectrum, likely, due to its weakness. Therefore, if the line is real, it is likely to be present in the emission associated with the wide range of orbital phases. Although the presence of the 6.4 keV line is frequently associated with the accretion disk in XRBs, it may be also produced by photo-ionization of cold and dense Be wind material in the colliding wind region. However, in this case, the line should be stronger when the pulsar is within (or close to) the decretion disk (assuming its wind does not disrupt it completely). Alternatively, if the pulsar is not very powerful, some residual accretion may be happening even if the pulsar wind stops most of the infalling Be star wind material.
The origin of the large residuals near 1-keV is rather puzzling regardless of whether the X-ray emission comes from the intra-binary shock, shocked pulsar wind, or accretion disk/column/jet near the compact object (if it is not a young pulsar). The residuals can simply be the artifact of combining spectra with (and other spectral parameters) varying over a fairly broad range of phases () since it is difficult to attribute them to the absorption (e.g., from Fe L complex) because Fe K is seen in the emission (albeit it is weak). Although the ACIS CC-mode spectrum (Figure 9, top panel), obtained in a single observation taken in the very narrow range of phases exhibits some residuals near 1 keV they, do not well match those seen in the XRT spectrum from the much broader (but overlapping) range. We also tried to fit the XRT spectrum with thermal plasma models (mekal and apec) and found that a high temperature, keV, is needed to describe its overall shape. At such temperatures, the optically-thin thermal plasma spectrum is very close to the Bremsstrahlung spectrum shown in Figure 7. The spectral feature around 1 keV is, of course, still there. Formally, the feature can be satisfactorily described by a broad Gaussian absorption line (gabs model in XSPEC) which, however, does not shed light onto its origin. A more sensitive observation with XMM-Newton or NICER, which collects enough photons within a short interval of time, may shed light on the origin of these systematic residuals.
5 Conclusions
Although the CXO-ACIS images revealed hints of extended emission in the vicinity of J0632 on arcsecond scales, it is too faint to be credibly interpreted as similar to that detected in the vicinity of the B1259-63 HMGB. We did not find any pulsations in the ACIS data up to 0.156 Hz. Therefore, the nature of the compact object in J0632 remains uncertain. The Swift-XRT images suggest the existence of a cavity/shell around the binary with a radius of about (for cavity) or (for shell) corresponding to a physical size of 2.6 at 4.3 pc at the assumed J0632’s distance of 1.5 kpc. If confirmed by observations with larger field-of-view (e.g., with XMM-Newton), the shell could belong to the host SNR of J0632. The significant variability in appears to be happening on timescales as short as 15-18 days (according to the ACIS data) and may be attributed to the changing circumbinary environment along the observer’s line-of-sight. The substantial variability in (albeit on longer time scales) is also supported by our analysis of XRT data. This variability may be particularly large near binary phases encompassing the light curve peak, but more sensitive observations with a higher cadence are needed in that phase interval to confirm this finding. The analysis of XRT data also revealed a puzzling and apparently phase-dependent spectral feature near keV, which is strongest during the phase interval of the light curve maximum. The combined XRT spectrum also shows hints of a weak 6.4 keV Fe K line whose strength does not appear to noticeably vary with the binary phase.
Facilities: CXO (ACIS), VLA, GMRT, Swift (XRT), Spitzer
Acknowledgements
Support for this work was provided by the National Aeronautics and Space Administration through Chandra Award Number GO8-19040X issued by the Chandra X-ray Observatory Center, which is operated by the Smithsonian Astrophysical Observatory for and on behalf of the National Aeronautics and Space Administration under contract NAS8-03060. JH acknowledges support from an appointment to the NASA Postdoctoral Program at the Goddard Space Flight Center, administered by the Universities Space Research Association under contract with NASA. We are grateful to George Pavlov for helpful discussions. We also thank the anonymous referee for the useful suggestions that helped us to improve the paper.
References
- Abdo et al. (2013) Abdo, A. A., Ajello, M., Allafort, A., et al. 2013, ApJS, 208, 17
- Adams et al. (2021) Adams, C. B., Benbow, W., Brill, A., et al. 2021, arXiv:2109.11894
- Albacete Colombo J. et al. (2020) Albacete Colombo J., F., Drake J., J., Filócomo, A., et al. 2020, arXiv:2006.16022
- Aragona et al. (2009) Aragona, C., McSwain, M. V., Grundstrom, E. D., et al. 2009, ApJ, 698, 514
- Aragona et al. (2010) Aragona, C., McSwain, M. V., & De Becker, M. 2010, ApJ, 724, 306. doi:10.1088/0004-637X/724/1/306
- Archer et al. (2020) Archer, A., Benbow, W., Bird, R., et al. 2020, ApJ, 888, 115
- Bailer-Jones et al. (2021) Bailer-Jones, C. A. L., Rybizki, J., Fouesneau, M., et al. 2021, VizieR Online Data Catalog, I/352
- Blandford & Teukolsky (1976) Blandford, R. & Teukolsky, S. A. 1976, ApJ, 205, 580. doi:10.1086/154315
- Bongiorno et al. (2011) Bongiorno, S. D., Falcone, A. D., Stroh, M., et al. 2011, ApJ, 737, L11
- Bosch-Ramon et al. (2017) Bosch-Ramon, V., Barkov, M. V., Mignone, A., et al. 2017, MNRAS, 471, L150. doi:10.1093/mnrasl/slx124
- Buccheri et al. (1983) Buccheri, R., Bennett, K., Bignami, G. F., et al. 1983, A&A, 128, 245
- Casares et al. (2012) Casares, J., Ribó, M., Ribas, I., et al. 2012, MNRAS, 421, 1103. doi:10.1111/j.1365-2966.2011.20368.x
- Chernyakova et al. (2019) Chernyakova, M., Malyshev, D., Paizis, A., et al. 2019, A&A, 631, A177
- Chernyakova & Malyshev (2020) Chernyakova, M., & Malyshev, D. 2020, arXiv e-prints, arXiv:2006.03615
- Durant et al. (2011) Durant, M., Kargaltsev, O., Pavlov, G. G., et al. 2011, ApJ, 735, 58. doi:10.1088/0004-637X/735/1/58
- Evans et al. (2009) Evans, P. A., Beardmore, A. P., Page, K. L., et al. 2009, MNRAS, 397, 1177. doi:10.1111/j.1365-2966.2009.14913.x
- Falcone et al. (2010) Falcone, A. D., Grube, J., Hinton, J., et al. 2010, ApJ, 708, L52
- Fierro et al. (1995) Fierro, J. M., Arzoumanian, Z., Bailes, M., et al. 1995, ApJ, 447, 807. doi:10.1086/175919
- Gahm et al. (2007) Gahm, G. F., Grenman, T., Fredriksson, S., et al. 2007, AJ, 133, 1795. doi:10.1086/512036
- Hare et al. (2019) Hare, J., Kargaltsev, O., Pavlov, G., et al. 2019, ApJ, 882, 74. doi:10.3847/1538-4357/ab3648
- Hinton et al. (2009) Hinton, J. A., Skilton, J. L., Funk, S., et al. 2009, ApJ, 690, L101
- Kargaltsev & Pavlov (2008) Kargaltsev, O. & Pavlov, G. G. 2008, 40 Years of Pulsars: Millisecond Pulsars, Magnetars and More, 983, 171. doi:10.1063/1.2900138
- Kargaltsev et al. (2014) Kargaltsev, O., Pavlov, G. G., Durant, M., et al. 2014, ApJ, 784, 124. doi:10.1088/0004-637X/784/2/124
- Maier et al. (2019) Maier, G., Blanch, O., Hadasch, D., et al. 2019, 36th International Cosmic Ray Conference (ICRC2019), 36, 732
- Malyshev & Chernyakova (2016) Malyshev, D. & Chernyakova, M. 2016, MNRAS, 463, 3074. doi:10.1093/mnras/stw2173
- Malyshev et al. (2019) Malyshev, D., Chernyakova, M., Santangelo, A., et al. 2019, Astronomische Nachrichten, 340, 465. doi:10.1002/asna.201913605
- Moritani et al. (2018) Moritani, Y., Kawano, T., Chimasu, S., et al. 2018, PASJ, 70, 61. doi:10.1093/pasj/psy053
- Paredes et al. (2007) Paredes, J. M., Ribó, M., Bosch-Ramon, V., et al. 2007, ApJ, 664, L39. doi:10.1086/520674
- Pavlov et al. (2011) Pavlov, G. G., Chang, C., & Kargaltsev, O. 2011, ApJ, 730, 2. doi:10.1088/0004-637X/730/1/2
- Pavlov et al. (2015) Pavlov, G. G., Hare, J., Kargaltsev, O., et al. 2015, ApJ, 806, 192. doi:10.1088/0004-637X/806/2/192
- Prado et al. (2019) Prado, R. R., Hailey, C., Mandel, S., et al. 2019, arXiv:1908.03083
- Rea & Torres (2011) Rea, N., & Torres, D. F. 2011, ApJ, 737, L12
- Volkov et al. (2021) Volkov, I., Kargaltsev, O., Younes, G., et al. 2021, ApJ, 915, 61. doi:10.3847/1538-4357/abfe0e
- Yoneda et al. (2020) Yoneda, H., Makishima, K., Enoto, T., et al. 2020, Phys. Rev. Lett., 125, 111103. doi:10.1103/PhysRevLett.125.111103
- Zamanov et al. (2021) Zamanov, R. K., Stoyanov, K. A., Mart, J., et al. 2021, Astronomische Nachrichten, 342, 531. doi:10.1002/asna.202123856