Nanostructured LaFeO3-MoS2 for efficient photodegradation and photocatalytic hydrogen evolution
Abstract
Fabrication of heterogeneous photocatalysts has received increasing research interest due to their potential applications for the degradation of organic pollutants in wastewater and evolution of carbon-free hydrogen fuel via water splitting. Here, we report the photodegradation and photocatalytic hydrogen generation abilities of nanostructured LaFeO3-MoS2 photocatalyst synthesized by facile hydrothermal technique. Prior to conducting photocatalytic experiments, structural, morphological and optical properties of the nanocomposite were extensively investigated using X-ray diffraction analysis, field emission scanning electron microscopy and UV-visible spectroscopy, respectively. Nanostructured LaFeO3-MoS2 photodegraded 96% of rhodamine B dye within only 150 minutes which is considerably higher than that of LaFeO3 and commercial Degussa P25 titania nanoparticles. The LaFeO3-MoS2 nanocomposite also exhibited significantly enhanced photocatalytic efficiency in the decomposition of a colorless probe pollutant, ciprofloxacin eliminating the possibility of the dye-sensitization effect. Moreover, LaFeO3-MoS2 demonstrated superior photocatalytic activity towards solar hydrogen evolution via water splitting. Considering the band structures and contribution of reactive species, a direct Z-scheme photocatalytic mechanism is proposed to rationalize the superior photocatalytic behavior of LaFeO3-MoS2 nanocomposite.
I Introduction
In recent years, semiconductor photocatalysts have manifested promising potential for the production of clean hydrogen (H2) fuel via water splitting and for the removal of various toxic pollutants from wastewater under solar illumination Appavu ; Guo ; Hu ; Yendrapati ; Mirzaee ; Basith1 ; Wen . Notably, perovskite metal-oxide lanthanum ferrite (LaFeO3) with relatively narrow band gap (2.34 eV) as compared to titania (TiO2) photocatalyst, has emerged as a promising photocatalyst because of its visible-light responsive photocatalytic activity, non-toxicity and excellent structural stability under the photochemical reaction conditions Ismael ; Peng ; Scafetta . Moreover, LaFeO3 has been reported as a promising ferroelectric material possessing spontaneous polarization potential at room temperature Acharya2010 . Although in recent years, significant amount of research is being conducted for synthesizing nanostructured LaFeO3 Mihai ; Parida ; Tijare with high photocatalytic efficiency, it has not been possible yet to employ LaFeO3 nanoparticles for industrial applications due to their high tendency of agglomeration Peng , considerably low charge separation efficiency and consequently, fast recombination rate of photoinduced pairs Ismael ; Peng ; Mihai .
Therefore, currently, numerous research endeavors are being undertaken to alleviate the shortcomings of LaFeO3 nanoparticles which include surface modification, metals and non-metals doping, engineering heterogeneous nanocomposites and introducing lattice defects Peng ; Ren ; Wu2015 ; Wu2018 ; Yang . A number of recent investigations have reported that the photocatalytic efficiency of LaFeO3 nanoparticles can be substantially increased by forming their Z-scheme heterojunctions with other semiconductor photocatalysts such as g-C3N4, SnS2 which have suitable band gap energy and appropriate band edge positions Wu2018 ; Acharya2017 ; Luo . However, according to previous reports, the performance of direct Z-scheme photocatalysts depends largely on the energy band configurations, crystallographic structure, surface states and interfacial features of their constituents which makes it quite challenging to design and develop efficient Z-scheme systems Zhang . Therefore, despite showing promising potential, LaFeO3 based Z-scheme photocatalyst nanocomposites are yet less explored.
In recent years, molybdenum disulfide (MoS2), a layered transition metal dichalcogenide, is being effectively employed in photocatalysis as a promising co-catalyst owing to its unique structure, tunable band gap and intriguing optical properties Chen ; Han ; Splendiani . Especially, mono or few-layer MoS2 nanosheets have been reported to introduce significant improvement in the photocatalytic performance of various pristine metal oxide nanoparticles e.g. ZnO, YVO4 etc. by forming type-II or Z-scheme heterojunctions with them Chen ; Qian . These two-dimensional (2D) ultrathin nanosheets also provide enormous specific surface area and prevent the agglomeration of photocatalyst nanoparticles owing to their favorable dispersion and synergetic effect Jaramillo ; Tama . Moreover, MoS2 nanosheets yield a plenty of exposed active edge sites which can efficiently catalyze the photocatalytic H2 evolution reaction Chen ; Qin . Hence, considering the compatible band structures and promising properties, it is highly intriguing to develop a heterojunction between LaFeO3 nanoparticles and 2D MoS2 nanosheets Acharya2020 and extensively investigate its photocatalytic performance.
Therefore, in the present investigation, we have synthesized LaFeO3 nanoparticles via a facile sol-gel method Hu ; Ahsan and incorporated it with ultrasonically exfoliated few-layer MoS2 nanosheets by adapting a low-temperature hydrothermal synthesis technique Tama ; Das ; Sabarinathan to investigate comprehensively the photodegradation and photocatalytic hydrogen evolution efficiency of LaFeO3-MoS2 nanocomposite. Interestingly, LaFeO3-MoS2 has outperformed both LaFeO3 and commercial Degussa P25 TiO2 nanoparticles in the photodecomposition of a textile dye, rhodamine B (RhB) in aqueous solution as well as solar H2 generation via water splitting. It is noteworthy that colorful organic dyes e.g. RhB may pose some limitations in evaluating the performance of photocatalysts because of their dye-sensitization effect Barbero . Hence, we have further investigated the photocatalytic activities of LaFeO3-MoS2 nanocomposite towards the photodegradation of a colorless probe pollutant, ciprofloxacin antibiotic which cannot directly absorb visible light to cause photosensitization Wen . Notably, the outcome of this experiment provided additional evidence for the superior photocatalytic performance of as-synthesized LaFeO3-MoS2 nanocomposite towards photodegradation.
II Materials and Methods
II.1 Materials
The chemical reagents used were analytical grade lanthanum nitrate hexahydrate [La(NO3)3.6H2O], ferric nitrate nonahydrate [Fe(NO3)3.9H2O], citric acid [C6H8O7], ammonium hydroxide [NH4OH] and molybdenum disulfide [MoS2] powder (manufacturer of all reagents is Sigma-Aldrich, Germany).
II.2 Sample preparation
II.2.1 Synthesis of LaFeO3 nanoparticles
LaFeO3 nanoparticles were synthesized by a citrate based sol-gel technique Hu ; Ahsan . Initially, La(NO3)3.6H2O, Fe(NO3)3.9H2O and C6H8O7 were taken in the molar ratio of 1:1:2 and dissolved in deionized (DI) water under magnetic stirring to form a homogeneous solution. To ensure stability, the pH of this solution was then adjusted to 11 by adding NH4OH. Afterward, the resulting mixture was heated at 85 ∘C for 3 hours until it turned into viscous gel. The viscous gel was further heated at 95 ∘C for 3 more hours to initiate auto combustion. After combustion, the obtained dry gel was ground for 1 hour and finally, calcined for 2 hours at air in a programmable furnace (Carbolite, UK) with a heating and cooling rate of 3 ∘C/min to acquire the desired LaFeO3 nanoparticles by removing volatile substances and carbonaceous materials. We have calcined LaFeO3 nanoparticles at three different temperatures i.e. 600, 700 and 800 ∘C to optimize the calcination temperature in terms of crystallinity and uniform surface morphology. Notably, the crystallite size of LaFeO3 significantly enhanced when calcined at 900 ∘C. Hence, we did not further increase the calcination temperature beyond 800 ∘C. For brevity, LaFeO3 nanoparticles calcined at x ∘C will be referred to as LaFeO3(x) from now on.
II.2.2 Synthesis of few-layer MoS2 nanosheets
Ultrathin few-layer MoS2 nanosheets have been prepared directly from their bulk powder with a high yield of 60% via a facile ultrasound assisted exfoliation technique, which has been described in details elsewhere Das ; Sahoo . Initially, a 5 mg/mL solution of MoS2 powder and isopropanol was prepared. The solution was then ultrasonicated for 90 minutes in a simple ultrasonic bath (Powersonic 510, maximum power 100 W, sonication frequency 37 kHz or 80 kHz) by applying a continuous ultrasound wave having constant 100 W power and 80 kHz frequency. After 4 hours of rest, residue bulk powder and sheets with micron-size thickness were removed from the ultrasonicated solution via careful decantation. Finally, the collected supernatant was dried for 5 hours in a universal drying oven (Labtech, Republic of Korea) at 80 ∘C to obtain MoS2 nanosheets.
II.2.3 Synthesis of LaFeO3-MoS2 nanocomposite
Low-temperature hydrothermal technique is considered beneficial for synthesizing efficient nanostructured photocatalysts because of its ability of inhibiting grain growth, ensuring small particle size with narrow distribution, enhancing crystallinity and minimizing impurities due to the low processing temperature Basith1 ; Shi . Therefore, in this investigation, we have adopted the facile, low-cost hydrothermal technique to incorporate MoS2 nanosheets with LaFeO3(800) nanoparticles Chen ; Tama . At first, 1 mmol of LaFeO3(800) and 0.05 mmol of MoS2 were dissolved in 50 mL of DI water (i.e. 5 mole% MoS2 to LaFeO3 content). After stirring rigorously for 2 hours, the mixture was heated at 150 ∘C for 14 hours in a Teflon-lined autoclave. After cooling down the obtained suspension to room temperature (RT) naturally, centrifugation and continuous rinsing was carried out using DI water and ethanol. Finally, the mixture was dried at 85 ∘C in the oven for 12 hours to get the desired LaFeO3-MoS2 nanocomposite.
II.3 Characterization techniques
The powder X-ray diffraction (XRD) spectra of as-prepared nanomaterials were obtained by a diffractometer (PANalytical Empyrean, UK) equipped with Cu- radiation (wavelength, = 1.5418 Å). Further, FullProf Suite Software was used for extensive analysis of the experimentally acquired XRD data via Rietveld refinement method Rodriguez-Carvajal . Field emission scanning electron microscopy (FESEM) imaging along with the energy dispersive X-ray (EDX) analysis was carried out using a scanning electron microscope (XL30SFEG; Philips, Netherlands) to investigate the surface morphology and elemental composition of the samples. A ferroelectric loop tracer (Marine India, India) coupled with an external amplifier (10 kV) was used to determine the leakage current density as well as polarization vs. electric field (P-E) hysteresis loops of the samples Basith1 . The driving frequency was maintained at 50 Hz during the measurement of P-E loops. The diffuse reflectance spectra (DRS) of as-prepared materials were recorded at RT by a UV-visible spectrophotometer (UV-2600, Shimadzu, Japan) using barium sulfate powder as the reference (wavelength range 200-1100 nm) Yendrapati . A Spectro Fluorophotometer (RF-6000, Shimadzu, Japan) was used to carry out photoluminescence (PL) analysis.
II.4 Photocatalytic degradation of dye and antibiotic
The photocatalytic efficiency of prepared nanomaterials and commercial TiO2 nanoparticles was evaluated in the photodegradation of RhB dye and ciprofloxacin antibiotic in aqueous medium under solar irradiation Tama ; Wei . The details of the photocatalytic experiments are provided in electronic supplementary information (ESI). In order to evaluate the precision and experimental validation, all the photocatalytic activity tests were carried out three times at exactly same experimental conditions. The experimental values are mean of triplicate measurements and their standard deviations have been presented in the figures as error bars at each data point.
II.5 Photocatalytic hydrogen evolution
The photocatalytic H2 evolution test was performed using a slurry-type photochemical reactor containing 40 mg of photocatalyst homogeneously suspended in 60 mL of DI water Basith1 . Initially, the system was purged with argon gas for 30 minutes to remove the dissolved oxygen and then irradiated by the 500 W Hg-Xe lamp (Hamamatsu Photonics, Japan). Under illumination, the evolved H2 gas was collected at 1 hour interval and then, analyzed and measured in the gas chromatography (GC) device (Shimadzu, Japan) equipped with a thermal conductivity detector (TCD) and a gas analyzer. The GC programming was set up with a reverse polarization so that the hydrogen peaks could be attained in the upward direction. The gas analyzer compared the peak intensities of extracted gases to the peaks observed for standard hydrogen gas. The amount of produced hydrogen gas after 4 hours of irradiation was calculated in mol g-1 catalyst from this comparison. For comparison, the hydrogen evolution test was also performed using commercially available TiO2 nanocatalyst under identical experimental conditions. The error analyses were also carried out for these experiments.
III Results and discussions
III.1 Structural characterization
III.1.1 Crystal structure
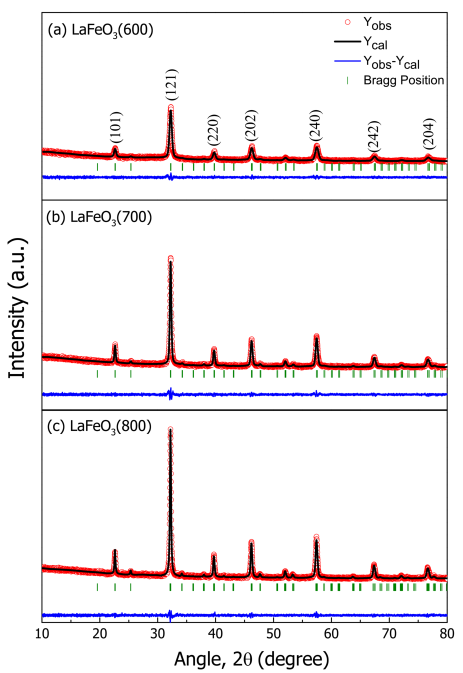
The crystallographic structure and phase of as-synthesized nanomaterials have been investigated by analyzing their powder XRD spectra via Rietveld refinement method. Fig. 1(a), (b) and (c) display the Rietveld refined powder XRD patterns of LaFeO3 nanoparticles calcined at 600, 700 and 800 ∘C, respectively in the same scale. As shown in the figures, the diffraction peaks exhibited by all these samples can be indexed at (101), (121), (220), (202), (240), (242), and (204) planes (JCPDS card file no 37-1493) which conform to the orthorhombic crystal phase (Pnma space group) of LaFeO3 perovskite Acharya2017 ; Zhao . No impurity or secondary phases were detected in these XRD spectra, implying that the phase-purity of LaFeO3 nanoparticles was unperturbed by the varying calcination temperatures. However, the intensity and sharpness of the XRD peaks have considerably enhanced with the increase in calcination temperature which clearly indicates that LaFeO3(800) nanoparticles possess higher degree of crystallinity as compared to the other two samples. Our observation agrees well with several previous investigations reporting that higher activation temperature ensures better crystallization for LaFeO3 nanoparticles Parida ; Wiranwetchayan . The average crystallite sizes of LaFeO3 nanoparticles calcined at 600, 700 and 800 ∘C are estimated to be about 18, 31 and 45 nm, respectively from the XRD patterns by means of the Scherrer equation Scherrer .
The XRD spectra of MoS2 nanosheets and LaFeO3-MoS2 nanocomposite are presented in Fig. 2. As shown in Fig. 2(a), the diffraction peaks demonstrated by MoS2 nanosheets can be readily indexed to single-phase 2H hexagonal structure (P63/mmc space group) (JCPDS no. 37-1492) Chen ; Liu2014 . The observed small intensity of the XRD peaks of MoS2 revealed their few-layer sheet-like structure which is qualitatively in good agreement with our previous investigation Das . Fig. 2(b) exhibits that all the diffraction peaks of LaFeO3 nanoparticles along with the most intense peak corresponding to (002) plane of MoS2 nanosheets are present in the XRD spectrum of LaFeO3-MoS2, implying the successful formation of the nanocomposite. However, the other diffraction peaks of MoS2 are not visible in this XRD spectrum because of their relatively low intensity which can be attributed to the small molar ratio of MoS2 to LaFeO3 in the nanocomposite. Clearly, the Bragg positions evince the simultaneous existence of two phases corresponding to LaFeO3 and MoS2 in the crystal lattice of the nanocomposite. The average crystallite size of LaFeO3-MoS2 nanocomposite has been calculated to be 36 nm by the Scherrer equation which is smaller than that of pristine LaFeO3(800) nanoparticles (45 nm).
Table 1 presents different structural parameters and constituent phases (in wt%) for as-synthesized nanomaterials. The errors on the last significant digit of the crystallographic parameters are indicated by the numbers in the parentheses. Notably, the calculated lattice parameters of LaFeO3 and MoS2 are well consistent with the values reported in literature Ren ; Liu2014 .
The unit cell volume of LaFeO3 nanoparticles was observed to nominally enhance with increasing calcination temperature. It is worth noticing that the calculated percentages of the constituent LaFeO3 and MoS2 phases, 92.92% and 7.08%, respectively, in the nanocomposite are close to their mole percentages used during synthesis. Moreover, the structural variables corresponding to these two phases remained reasonably unaltered in the LaFeO3-MoS2 nanocomposite, implying that no deformation occurred in the crystallographic structure of individual phases during the preparation of the nanocomposite. For further insight, we have tabulated the calculated atomic coordinates of the samples along with the reliability (R) factors (Rwp, Rp, RExp and ) of Rietveld refinement in ESI Table S1. The quality of the refinement is evident from the modest R values, in particular the goodness of fit parameter () of as-synthesized nanomaterials.

| Sample | Constituent | Crystallographic phase (wt%) | Space group | a (Å) | b (Å) | c(Å) | V (Å3) |
|---|---|---|---|---|---|---|---|
| LaFeO3(600) | LaFeO3 | Orthorhombic (100%) | Pnma | 5.551(0) | 7.856(0) | 5.551(1) | 242.10(0) |
| LaFeO3(700) | LaFeO3 | Orthorhombic (100%) | Pnma | 5.557(1) | 7.854(2) | 5.555(1) | 242.47(0) |
| LaFeO3(800) | LaFeO3 | Orthorhombic (100%) | Pnma | 5.569(0) | 7.853(0) | 5.555(0) | 242.90(0) |
| MoS2 | MoS2 | Hexagonal (100%) | P63/mmc | 3.149(0) | 3.149(0) | 12.250(2) | 105.18(0) |
| LaFeO3-MoS2 | LaFeO3 | Orthorhombic (92.92%) | Pnma | 5.569(3) | 7.854(6) | 5.554(4) | 242.90(0) |
| MoS2 | Hexagonal (7.08%) | P63/mmc | 3.160(3) | 3.160(3) | 12.277(2) | 106.14(0) |
III.1.2 Surface morphology
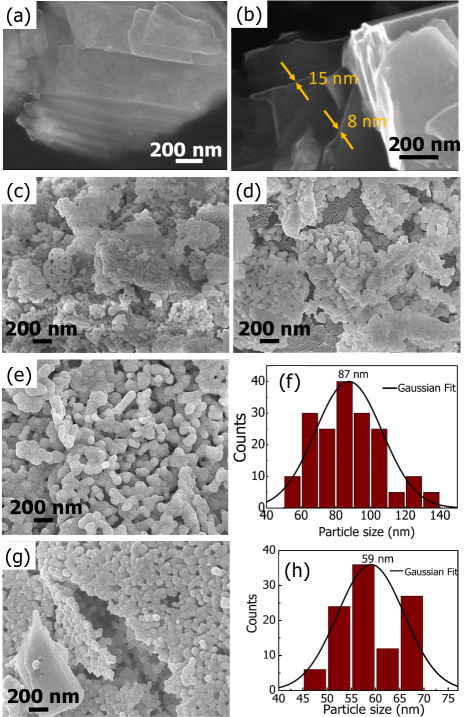
The surface morphology of as-synthesized samples was investigated by FESEM imaging as shown in Fig. 3. The ultrathin lamellar structure of vertically grown 2D MoS2 nanosheets is demonstrated in Fig. 3(a). To show the morphological change of MoS2 due to exfoliation, we have provided two differently magnified FESEM images of bulk MoS2 powder in ESI Fig. S1. It can be seen that bulk MoS2 consisted of numerous tightly stacked indistinguishable MoS2 monolayers which have effectively delaminated to few-layer MoS2 nanosheets after exfoliation. The thickness of individual sheet can be estimated to be between 8 to 15 nm, suggesting that each nanosheet comprises 11-21 MoS2 monolayers (Fig. 3(b)) Splendiani ; Das .
Fig. 3(c), (d) and (e) are the FESEM images of LaFeO3 nanoparticles calcined at 600, 700 and 800 ∘C, respectively. As evident from the figures, at lower calcination temperatures (600-700 ∘C), the particles are irregular in shape with non-homogeneous and porous surface morphology. However, with a further increment in calcination temperature to 800 ∘C, the surface morphology was considerably improved and the degree of agglomeration was reduced to a moderate extent albeit at the cost of slightly increased particle size. Such reduction in agglomeration might be due to the enhancement of total specific surface area and the free energy of the system, whereas the increment in particle size can be imputed to the increased crystal growth rate of the particles at elevated temperature Ahsan ; Wiranwetchayan ; Pang . The size distribution histogram in Fig. 3(f) demonstrates that the particle size of nanostructured LaFeO3(800) lies in the range of 50-140 nm with an average of 87 nm.
Fig. 3(g) and (h) show the FESEM image and corresponding size distribution histogram of LaFeO3-MoS2 nanocomposite. As can be clearly seen, LaFeO3 nanoparticles are successfully assembled on the surface of the 2D MoS2 nanosheets with almost no agglomeration. The satisfactorily homogeneous and non-porous surface of the as-prepared nanocomposite reveals that the growth of LaFeO3 was much more controlled in the presence of MoS2. The improved growth of nanoparticles can be attributed to the presence of LaFeO3-anchoring hydroxyl group over the MoS2 surface Das ; Vattikuti . Additionally, we anticipate that the 2D MoS2 nanosheets have provided sufficient surface sites for anchoring LaFeO3 to prevent aggregation Han ; Tama . Noticeably, the shape of the particles has become nearly spherical and reasonably uniform after incorporating MoS2. Moreover, the particle size distribution of the nanocomposite was found to be considerably narrower (45-70 nm) with smaller average size (59 nm) as compared to LaFeO3 nanoparticles which is qualitatively consistent with the outcome of our XRD analysis. However, for both the nanomaterials, the SEM images exhibit slightly larger average particle size as compared to their crystallite size calculated by Scherrer equation which is a common phenomenon according to other reported works Liu2009 . Finally, based on the observed surface morphology, the as-synthesized LaFeO3-MoS2 nanocomposite can be expected to exhibit better adsorption and photocatalytic efficiency than LaFeO3 nanoparticles owing to their higher degree of uniformity in shape and size as well as increased surface to volume ratio Basith1 ; Peng ; Ren .
III.1.3 Elemental composition
The Table S2 inserted in ESI presents the elemental composition of LaFeO3(800) nanoparticles obtained both via EDX analysis and theoretical calculation Wiranwetchayan . As can be seen in Table S2 of ESI, the experimentally obtained mass and atomic percentages of desired elements La, Fe and O are in excellent agreement with the theoretical values, providing further evidence for the successful synthesis of LaFeO3 nanoparticles without impurities. Moreover, the La:Fe atomic ratio in the as-prepared sample has been found to be 1:1 which is same as the molar ratio of precursors La(NO3)3 and Fe(NO3)3 used in the reaction solution. This indicates that the entire metal contents of the precursors were successfully carried over to the final sample under the synthesis conditions. It is worth mentioning that no carbon content was detected in these nanoparticles which can be ascribed to the complete decomposition of carbonaceous compounds from the gel by the calcination process at optimized temperature i.e. 800 ∘C. ESI Fig. S2 demonstrates the EDX spectra of LaFeO3(800) nanoparticles and LaFeO3-MoS2 nanocomposite. As shown in the Fig. S2 of ESI, along with the peaks of La, Fe and O atoms, the EDX spectrum of LaFeO3-MoS2 contains additional peaks of Mo and S at around 2 keV, confirming the successful formation of the nanocomposite.
III.2 Electric characterization
We have determined the ferroelectric polarization (P) as well as the leakage current density (J) of the as-prepared nanomaterials for varying electric fields (E) of up to 60 kV/cm. The driving frequency was maintained at 50 Hz while increasing the applied electric field. As demonstrated in ESI Fig. S3, the leakage current density of the LaFeO3-MoS2 nanocomposite was considerably smaller as compared to that of the LaFeO3(800) nanoparticles. The high leakage current of the nanoparticles can be imputed to their surface porosity as was evident from SEM analysis Van . We anticipate that the leakage current has been reduced for the nanocomposite due to their non-porous homogeneous surface morphology. ESI Fig. S4(a) and (b) demonstrate the P-E hysteresis loops of LaFeO3(800) nanoparticles and LaFeO3-MoS2 nanocomposite, respectively. As can be observed, the P-E loop of LaFeO3 is more dominated by leakage current in comparison with the nanocomposite Deng . Freely movable charges might be considered responsible for their cigar-shaped unsaturated hysteresis loop Basith1 ; Deng . Interestingly, after incorporating MoS2 nanosheets, the P-E loops tended towards saturation at high electric fields, indicating the improved ferroelectric behavior of the nanocomposite Deng ; Scott . The remanent polarization and coercive field of the nanocomposite enhanced with increasing applied voltage since stronger electric fields contribute more to the reversal of ferroelectric domains due to higher driving power Wu2012 . Moreover, it is noteworthy that the breakdown voltage of LaFeO3-MoS2 (50 kV) was significantly higher than that of LaFeO3(800) nanoparticles (10 kV). The interaction between the free charges of 2D MoS2 and bound charges of LaFeO3 can be associated with the superior ferroelectric behavior of the nanocomposite Jin which is an important characteristic for improving photochemical reactivity Khan . The improved ferroelectric behavior of LaFeO3-MoS2 nanocomposite can be anticipated to facilitate spatially selective adsorption of dye and molecules on their surface by creating electric field in the surrounding medium due to surface polarization Basith1 ; Acharya2010 ; Cui . To be specific, different regions of the surface may experience different extents of band bending depending on the surface polarization and thus, promote different carriers to move to spatially different locations. This phenomenon might result in spatially selective adsorption at surface and facilitate surface redox reactions. Additionally, the internal space charge layer in this ferroelectric nanocomposite may considerably increase the charge separation and migration efficiency by driving the pairs in opposite direction and thus, suppress their recombination Acharya2010 ; Cui and improve photocatalytic performance.
III.3 Optical characterization
III.3.1 Optical band gap

Optical band gap energy of semiconductors is considered as a crucial factor to assess their photocatalytic activity. Therefore, we have measured the UV-visible DRS of as-prepared photocatalysts and estimated their band gaps using Tauc model Scafetta based on eqn. (1)-
| (1) |
where F(R) is a parameter calculated from DRS by Kubelka–Munk function which is proportional to the absorption co-efficient Basith1 and , A, and n signify the energy of photons, proportionality, optical band gap and the electronic transition type, respectively. Notably, Scafetta et al. have reported direct-forbidden transition in bulk LaFeO3 and hence, we have considered n=3/2 to obtain the desired Tauc plots Scafetta . Moreover, from the steady-state photoluminescence (PL) spectroscopy, we observed evidence in support of the direct band gap of the synthesized nanomaterials which will be discussed later. As shown in Fig. 4(a), the direct optical band gaps of as-prepared LaFeO3(800) and LaFeO3-MoS2 have been estimated to be 2.1 and 2.14 eV, respectively from the abscissa intercepts of the tangents to the linear region of the plots Acharya2017 . The nominal difference between the observed band gap values can be associated with the synergetic interaction developed due to incorporation of MoS2 nanosheets Tama . However, for both as-prepared nanomaterials, the band gaps are smaller than that of bulk LaFeO3 (2.34 eV) Scafetta , suggesting their superior potential to exploit broader range of the solar spectrum and exhibit enhanced visible light-responsive photocatalytic activities.
III.3.2 Photoluminescence (PL) spectra at steady-state
The charge-carrier recombination phenomenon in semiconductor photocatalysts can be predicted to a certain extent by performing steady-state photoluminescence (PL) analysis. Generally, an intense PL peak indicates high radiative recombination rate of photogenerated pairs. Fig. 4(b) presents the steady-state PL spectra of as-prepared LaFeO3(800) and LaFeO3-MoS2 for an excitation wavelength of 300 nm Wu2018 . From the position of the PL peaks, the band gaps of LaFeO3 and LaFeO3-MoS2 can be estimated as 2.06 and 2.08 eV, respectively. These values closely match with the band gaps obtained by UV-visible spectroscopy (Fig. 4(a)), providing evidence for the direct transition in these nanomaterials. Moreover, it can be clearly observed that the PL peak intensity of LaFeO3-MoS2 nanocomposite is lower than that of LaFeO3 nanoparticles which suggests that comparatively smaller number of photogenerated electrons and holes have radiatively recombined in the nanocomposite. Such observation implies that incorporation of few-layer MoS2 nanosheets can effectively suppress the radiative recombination of charge-carriers. Notably, our observation agrees well with a number of previous studies reporting that MoS2 nanosheets can substantially quench PL of different metal-oxide photocatalysts by developing heterostructured nanocomposite Tama ; Qin . However, it should be mentioned that quenched PL peak does not always correspond to enhanced photocatalytic activity since information about the non-radiative recombination cannot be extracted from PL characterization.
III.4 Photocatalytic degradation of rhodamine B (RhB) dye
The photocatalytic efficiency of the synthesized catalysts was evaluated towards the degradation of a well-known cationic dye, RhB under solar illumination Basith2 . Initially, we had carried out the experiment at different pH and found out that the degradation percentage was increased at acidic reaction solution. Hence, pH= 3 was taken as the optimum pH to study the photochemical reactions. Further, a blank test was performed to examine the nature of RhB dye under our specified experimental conditions. Only 4% of RhB was found to be decomposed after 150 minutes of irradiation, suggesting its negligible self-photolysis potential. Additionally, prior to irradiation, dark adsorption tests were carried out for all the photocatalysts which demonstrated a nominal amount of RhB (4%) degradation after 1 hour at dark due to chemi-adsorption of the dye molecules on the surface of the photocatalysts. Therefore, considering the outcomes of these two sets of experiments, the decomposition of RhB under solar irradiation can be attributed almost entirely to photocatalysis.
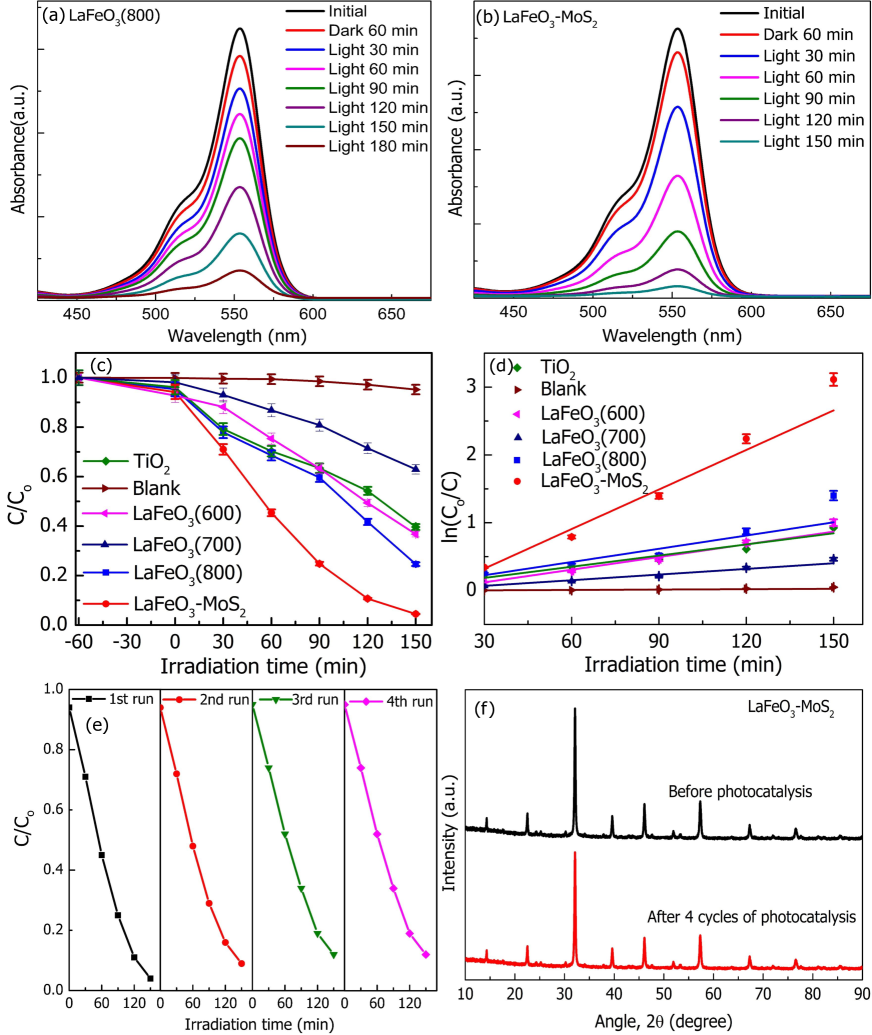
Fig. 5(a) and (b) present the change in the visible absorbance spectra of RhB photodegraded over LaFeO3(800) nanoparticles and LaFeO3-MoS2 nanocomposite, respectively. Here, the gradual decrement in the intensity of the characteristic absorption peak at 553 nm indicates the successful decolorization of RhB via photochemical reactions. Clearly, among the two samples, the peak decreased more rapidly and took less time to ultimately disappear in case of LaFeO3-MoS2 which implies its higher photocatalytic efficiency.
III.4.1 Kinetics of RhB degradation.
Fig. 5(c) demonstrates the degradation profiles of RhB as a function of time under both dark and light conditions in the presence of as-prepared LaFeO3(600), LaFeO3(700), LaFeO3(800) and LaFeO3-MoS2 photocatalysts as well as commercially available TiO2 nanoparticles. The result of blank test has also been included in the figure. The percentage of degradation has been calculated using eqn. (2)-
| (2) |
Here, C0 and C denote the initial and residual concentrations measured at 30 minutes of interval, respectively. It was found that among the three samples of LaFeO3 nanoparticles, LaFeO3(800) nanoparticles have manifested the best photocatalytic performance which might be associated with its highest degree of crystallinity Othman . However, it should be noted that despite possessing better crystallinity, LaFeO3(700) nanoparticles showed lower photocatalytic efficiency as compared to LaFeO3(600) nanoparticles which suggests that along with crystallinity other factors i.e. crystallite size, surface area may also influence the photocatalytic performance.
As can be seen in Fig. 5(c), LaFeO3(800) nanoparticles degraded 75% of RhB dye after 150 minutes of illumination which was reasonably higher than that of (60%) TiO2 nanoparticles. Interestingly, the degradation percentage of RhB increased significantly to 96% when LaFeO3-MoS2 nanocomposite was employed as the photocatalyst under the same experimental conditions. To further assess the kinetics of RhB degradation, the experimental data were fitted to zero-order (eqn. (3)), first-order (eqn. (4)) and second-order models (eqn. (5)).
| (3) |
| (4) |
| (5) |
Here, t denotes illumination time and k is the overall photodegradation rate constant Mishra . The obtained coefficient of determination () and average relative errors revealed that RhB degradation over the photocatalysts followed the first-order kinetic model. In Fig. 5(d), the slope of the linear fit plots provide the value of k1 for respective photocatalysts. The rate constant in the first order kinetics of LaFeO3-MoS2 nanocomposite was found to be 0.02329 min-1, which was almost 3 and 4.25 times higher than that of the LaFeO3(800) nanoparticles (k1 = 0.00932 min-1) and TiO2 nanoparticles (k1 = 0.00548 min-1), respectively. Hence, LaFeO3-MoS2 nanocomposite can be considered as a superior photocatalyst as compared to the other two samples.
III.4.2 Photostability and non-toxicity study
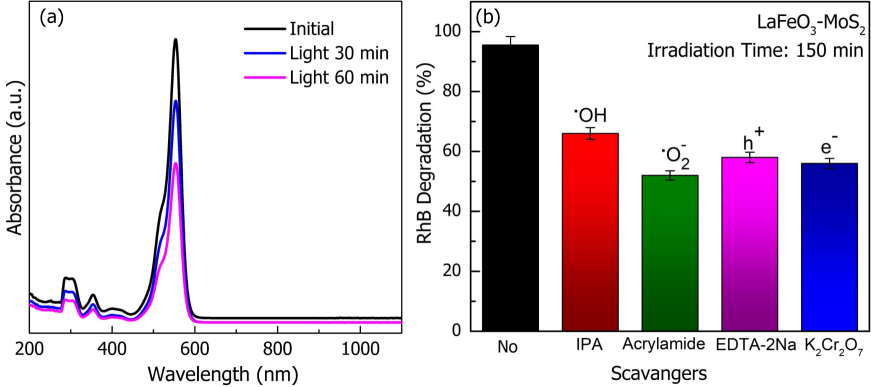
To evaluate the potential for industrial-scale application, we assessed the photostability of LaFeO3-MoS2 nanocomposite by performing a recyclability test Basith1 ; Mishra . As shown in Fig. 5(e), the photocatalytic efficiency of the nanocomposite only slightly reduced after 4 consecutive photodegradation cycles which can be imputed to the inevitable loss of the materials during the recycling process. Furthermore, a comparison of the XRD patterns of the LaFeO3-MoS2 nanocomposite before and after the 4 photocatalytic cycles is shown in Fig. 5(f). No apparent change was observed in the XRD patterns before and after the experiments, suggesting that the nanocomposite did not undergo any structural deformation during the photocatalysis. Finally, we inspected whether any toxic degradation products were evolved in the reaction mixture. For this, the UV-visible absorbance spectra (i.e. ranging from 200 nm to 1100 nm) of RhB were examined before and after being photodegraded by LaFeO3-MoS2. As evident from Fig. 6(a), no additional peaks have emerged after illumination which implies that the photocatalyst did not introduce any carbonaceous molecules or benzene radicals in the solution. Therefore, our as-synthesized LaFeO3-MoS2 nanocomposite can be considered as a promising candidate for the remediation of industrial dye effluents owing to its high photocatalytic efficiency, excellent photostability, reusability and non-toxicity.
III.4.3 Effect of scavengers
To determine the major reactive species responsible for RhB degradation over LaFeO3-MoS2 nanocomposite, we have performed trapping experiments using IPA, acrylamide, EDTA-2Na and K2Cr2O7 as scavengers of hydroxyl () radicals, superoxide () radicals, holes () and electrons (), respectively Acharya2017 ; Tama . As evident from Fig. 6(b), the addition of acrylamide significantly decreased the degradation efficiency, i.e. from 96% to 50%, suggesting that radicals were the dominant active species. Moreover, it was found that the radicals, and also had considerable effect on the phototcatalytic process since IPA, EDTA-2Na and K2Cr2O7 had reasonably reduced the degradation of RhB.
III.5 Photodegradation of colorless Ciprofloxacin in aqueous medium
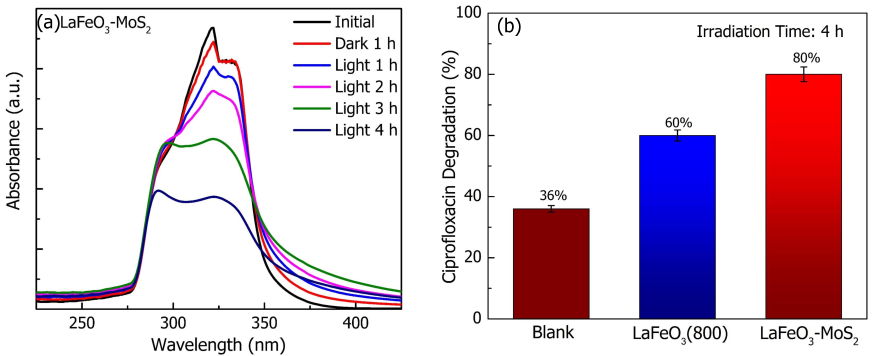
Fig. 7(a) demonstrates the spectral presentation of ciprofloxacin degradation in the presence of LaFeO3-MoS2 nanocomposite under solar illumination. Clearly, the characteristic absorption peaks at 280 and 320 nm gradually decreased, indicating successful decomposition of ciprofloxacin Tama . As shown in Fig. 7(b), after 4 hours of irradiation, 80% of ciprofloxacin was photodegraded by LaFeO3-MoS2 which is reasonably higher as compared to LaFeO3(800) nanoparticles (60%). The kinetics for the decomposition of ciprofloxacin was observed to be first order (see ESI Fig. S5). The blank ciprofloxacin had a very small degradation rate (k1 =0.00197 min-1), implying its low self-degradation potential. The rate constant for LaFeO3-MoS2 (k1=0.00808 min-1) is found to be almost 2 fold higher than LaFeO3(800) (k1=0.00445 min-1) which further justifies the superiority of the synthesized nanocomposite photocatalyst.
Therefore, it is evident that the photocatalytic ciprofloxacin degradation efficiency of LaFeO3 was significantly increased due to incorporation of few-layer MoS2 nanosheets. It is worth noting that a previous investigation Sora has reported 38% and 90% photocatalytic degradation of ciprofloxacin after 5 hours of solar irradiation in the presence of LaFeO3 and LaFeO3+H2O2, respectively. Notably, ingestion of H2O2 exerts toxic effects on human cells and results in morbidity via corrosive damage, oxygen gas formation and lipid peroxidation Watt . Without using such a toxic reagent, we could achieve as high as 80% degradation of ciprofloxacin employing our as-prepared LaFeO3-MoS2 photocatalyst.
III.6 Photocatalytic hydrogen generation
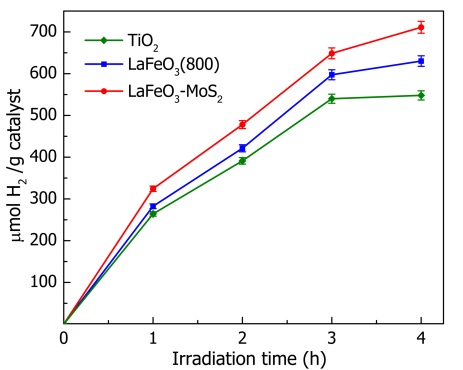
Photocatalytic H2 generation potential of as-synthesized nanomaterials were evaluated through water splitting under solar illumination Basith2 . Fig. 8 demonstrates the amount of produced H2 gas by LaFeO3(800), LaFeO3-MoS2 and commercial TiO2 photocatalysts as a function of time for 4 hours of irradiation. From the figure, the H2 evolution rate (HER) for LaFeO3-MoS2 nanocomposite has been calculated to be 179 mol g-1 h-1, which is higher than that of both LaFeO3(800) (157.5 mol g-1 h-1) and TiO2 nanoparticles (137 mol g-1 h-1). The enhanced H2 evolution potential can be attributed to the abundant catalytically active edge cites provided by few-layer MoS2 nanosheets as well as increased interfacial charge transfer efficiency and high oxidation and reduction potential (will be discussed later) of the nanocomposite Zhang ; Jaramillo .
For further insight, we have carried out a comparative analysis between the outcome of our experiments and some related previous investigations which is presented in Table 2. It is well known that photochemical reactions depend highly on experimental conditions. Therefore, for rational comparison, we have also provided details regarding light source and sacrificial reagents used in the investigations. Noticeably, the H2 evolution rate (HER) of our as-prepared nanocomposite is reasonably higher than that of different LaFeO3 based nanocomposites and alkaline-earth doped LaFeO3 nanoparticles Xu ; Vijayaraghavan . For instance, Xu et al. have reported that maximum HERs of 7 and 121.2 mol g-1 h-1 can be achieved by modifying LaFeO3/g-C3N4 heterojunctions with CdS and NiS co-catalysts, respectively Xu . However, the reported synthesis route involved more precursors and complex steps as compared to our adopted technique. Additionally, our synthesized LaFeO3-MoS2 has also shown significantly higher HER than a number of similar heterostructured photocatalysts such as MoS2/TiO2, MoS2/RGO, MoS2/YVO4 etc Chen ; Kanda ; Min . It is noteworthy that all the referred previous studies had used sacrificial reagents to facilitate the catalytic reactions, whereas our as-prepared LaFeO3-MoS2 nanocomposite has demonstrated satisfactory performance in H2 evolution without using any additional reagents or external energy input. Therefore, the present investigation might open-up a new avenue for low-cost solar H2 production by water splitting.
| Photocatalyst | Light source | Sacrificial reagent/Co-catalyst | H2 yield | Reference |
| ( mol g-1 h-1) | ||||
| 2% CdS modified LaFeO | 300 W Xe lamp; >400 nm | 10 vol. % triethanolamine aqueous solution | 7 | Xu |
| 2% NiS modified LaFeO | 300 W Xe lamp; >400 nm | 10 vol. % triethanolamine aqueous solution | 121.2 | Xu |
| 0.3 molar Mg doped LaFeO3 | Medium pressure 150 W Hg visible lamp | 10 vol. % methanol aqueous solution | 178.4 | Vijayaraghavan |
| 2% Au/LaFeO3 | 500 W Xe lamp | Na aqueous solution | 155 | Huang |
| 0.047 mass% MoS | 300 W Xe lamp; >300 nm | 5% formic acid aqueous solution | 2.2 | Kanda |
| 1 wt% | 300 W Xe lamp AM 1.5G filter | 20 vol. % methanol aqueous solution | 119.5 | Liu2013 |
| 300 W Xe lamp; 420 nm | 15 vol. % triethanolamine aqueous solution | 38.3 | Min | |
| 2.5% | 300 W Xe lamp | 20 vol. % methanol and 0.002 M aqueous solution | 134 | Chen |
| 500 W Hg-Xe lamp | Aqueous solution (no reagent) | 179 | Present work |
III.7 Photocatalytic mechanism
To elucidate the rationale behind the superior photocatalytic activities of LaFeO3-MoS2 nanocomposite, we have critically assessed the possible mechanisms for photodegradation of RhB dye. According to the results of the Tauc plot (Fig. 4(a)) and our previous investigation Das , the band gap () values of as-synthesized LaFeO3 and few layer MoS2 nanosheets are about 2.1 and 1.21 eV, respectively. Therefore, both LaFeO3 and MoS2 can act as photosensitizers under visible light irradiation.
The band edge positions of the semiconductor photocatalysts can be determined using the following empirical formulas Nethercot .
| (6) |
| (7) |
where is the absolute electronegativity, expressed as the geometric mean of the absolute electronegativity of the constituent atoms, which is defined as the arithmetic mean of the atomic electron affinity and the first ionization energy; is the energy of free electrons on the hydrogen scale (4.5 eV); is the band gap of the semiconductor; and are the conduction and valence band potentials, respectively. The CB and VB potentials of LaFeO3 are calculated as -0.03 and 2.07 eV whereas these values for MoS2 nanosheets are found to be -0.14 and 1.07 eV, respectively Acharya2017 ; Zeng ; Jia . Considering the band gap and band edge positions, two types of photogenerated charge-carrier transfer mechanism can be predicted for this photocatalytic system: (i) the traditional type-II double charge transfer mechanism and (ii) a direct Z-scheme mechanism. As illustrated in Fig. 9(a), in the case of type-II mechanism, the photoexcited electrons will flow from the CB of MoS2 to the less negative CB of LaFeO3 whereas, the flow of holes will be from the VB of LaFeO3 to the less positive VB of MoS2. However, the accumulated electrons in the CB of LaFeO3 are incompetent to reduce surface-absorbed O2 to yield radicals since the CB potential of LaFeO3 (-0.03 eV) is less negative than the redox potential of O2/ (-0.046 eV vs. NHE) Wu2018 . Moreover, the VB potential of MoS2 is less positive than the potential at which molecules (or surface ) are oxidized to (1.99 eV vs. NHE) Wu2018 which suggests that the holes in the VB of MoS2 cannot produce radicals in the reaction mixture. However, the trapping experiments have already confirmed that played the vital role in the photodegradation of RhB and was one of the subsidiary reactive species, which certainly would not be the case if type-II mechanism was followed. Therefore, it can be inferred that the photocatalytic reaction over LaFeO3-MoS2 nanocomposite did not occur via the double charge-transfer mechanism path.
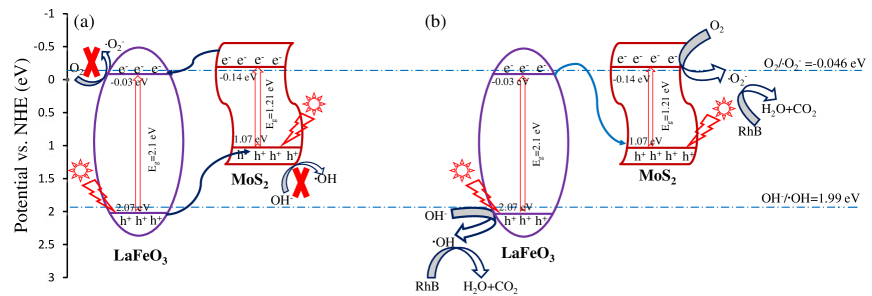
The photocatalytic pathway for RhB degradation can be well explained by a mediator-free direct Z-scheme mechanism Acharya2017 ; Mishra . As shown in Fig. 9(b), the photogenerated electrons from the CB of LaFeO3 migrate to the more positive VB of MoS2 via the heterojunction and recombine with the holes Acharya2017 . Then, the left behind electrons in the CB of MoS2 successfully reduce O2 to radicals since the CB potential of MoS2 is more negative than the redox potential of this half-reaction. Similarly, the holes assembled in the VB of LaFeO3 react with molecules and yield radicals owing to their sufficiently high positive potential to perform this oxidation. Further, the produced and radicals along with the photogenerated electrons and holes react with RhB molecules and cause degradation and thereby, yield non-toxic degradation products. Rationally, all these statements are also applicable for ciprofloxacin degradation over LaFeO3-MoS2 nanocomposite. The proposed Z-scheme mechanism for photodegradation of RhB dye over LaFeO3-MoS2 nanocomposite can be summarized as follows:
| (8) |
| (9) |
| (10) |
| (11) |
| (12) |
| (13) |
The results of photocatalytic evolution tests further substantiate that LaFeO3-MoS2 photocatalyst is more likely to follow direct Z-scheme mechanism, rather than type-II double charge transfer mechanism. Both mechanisms for solar generation are schematically presented in ESI Fig. S6. According to thermodynamic principles, for successful water splitting, the photogenerated electrons must have more negative potential than the reduction potential of / (0 eV vs. NHE) and simultaneously, the holes must be more positive than the oxidation potential of / (1.23 eV vs. NHE) Yendrapati . Therefore, if type-II mechanism would have existed, LaFeO3-MoS2 photocatalyst could not generate via water splitting (see ESI Fig. S6(a)) since the VB potential of MoS2 is less positive than the oxidation potential of /. Contrarily, in the case of direct Z-scheme mechanism, the holes in the VB of LaFeO3 can produce and by oxidizing the surface-adsorbed molecules owing to their adequately high redox potential. Likewise, the electrons accumulated in the CB of MoS2 will also be able to successfully reduce and evolve gas. Hence, it can be inferred that LaFeO3-MoS2 photocatalyst has produced solar via direct Z-scheme mechanism. Moreover, the unsaturated active S atoms with mono- or two-coordination on exposed edges of MoS2 nanosheets might have strong bonds with the ions present in the solution and thus, can easily capture them Chen ; Tama . As a consequence, the reduction of to would have been accelerated, resulting in high HER which is consistent with our experimental findings.
Based on the outcomes and above analysis, the superior photocatalytic performance of as-synthesized direct Z-scheme LaFeO3-MoS2 photocatalyst can be attributed to its enhanced charge separation and transportation efficiency at heterojunction as well as high oxidation and reduction potentials of photoinduced holes and electrons. In addition to these, the excellent crystallinity, favorable surface morphology and improved ferroelectric behavior of the nanocomposite after the incorporation of MoS2 nanosheets might have played significant role to enhance the photocatalytic efficiency Basith1 .
IV Conclusions
We observed that the as-prepared LaFeO3-MoS2 photocatalyst has considerably higher degradation efficiency of RhB as compared to pristine LaFeO3 and commercially available titania nanoparticles. Moreover, the superior performance of the nanocomposite towards the photodecomposition of a colorless micropollutant has ensured that the degradation is solely attributed to photocatalytic process rather than dye-sensitization effect. Such enhanced photocatalytic performance of this nanocomposite can be mainly ascribed to the formation of a direct Z-scheme heterojunction between its constituents which facilitated charge separation via interfacial interaction and provided charges with strong redox ability to drive photocatalysis. Further, the plethora of exposed active edge sites on the surface of lamellar MoS2 might effectively promote the H2 evolution reaction, resulting in significant amount of H2 generation via water splitting. It is worth mentioning that the LaFeO3-MoS2 nanocomposite with high photocatalytic efficiency, non-toxicity and excellent recyclability, can be considered as a promising photocatalyst for numerous practical applications such as removal of harmful textile and pharmaceutical pollutants from wastewater, solar water disinfection, CO2 reduction, low-cost photocatalytic H2 evolution etc. The present investigation might also open up new avenues for the design and synthesis of novel 2D transition-metal dichalcogenides based Z-scheme photocatalysts for environmental remediation, solar energy conversion and related applications.
Acknowledgements
We acknowledge the Committee for Advanced Studies and Research (CASR), Bangladesh University of Engineering and Technology for financial assistance. This work was financially supported partly by the Ministry of Education, Government of Bangladesh (Grant No. 37.20.0000.004.033.020.2016./PS20191017).
Appendix A. Supplementary data
Supplementary data to this article can be found online. See DOI:10.1016/j.mseb.2021.115295
Data availability
The raw and processed data required to reproduce these findings cannot be shared at this time due to technical or time limitations.
References
- (1) B. Appavu, S. Thiripuranthagan, T. Sureshkumar, Mater. Sci. Eng. B 252 (2020) 114472. https://doi.org/10.1016/j.mseb.2019.114472
- (2) X. Guo, K. Wang, Y. Xu, Mater. Sci. Eng. B 45 (2019) 75–84. https://doi.org/10.1016/j.mseb.2019.05.015
- (3) Z. Hu, D. Chen, S. Wang, N. Zhang, L. Qin, Y. Huang, Mater. Sci. Eng. B 220 (2017) 1–12. https://doi.org/10.1016/j.mseb.2017.03.005
- (4) T. P. Yendrapati, A. Gautam, S. Bojja, U. Pal, Sol. Energy 196 (2020) 540–548. https://doi.org/10.1016/j.solener.2019.12.054
- (5) M. Mirzaee, M. Faghani, Mater. Sci. Eng. B 246 (2019) 80–88. https://doi.org/10.1016/j.mseb.2019.05.026
- (6) M. A. Basith, N. Yesmin, R. Hossain, RSC Adv. 8 (2018) 29613-29627. https://doi.org/10.1039/c8ra04599b
- (7) X. Wen, C. Niu, L. Zhang, C. Liang, H. Guo, G. Zeng, J. Catal. 358 (2018) 141-154. https://doi.org/10.1016/j.jcat.2017.11.029
- (8) M. Ismael, M. Wark, Catalysts 9 (2019) 342. https://doi.org/10.3390/catal9040342
- (9) K. Peng, L. Fu, H. Yang, J. Ouyang, Sci. Rep. 6 (2016) 19723. https://doi.org/10.1038/srep19723
- (10) M. D. Scafetta, A. M. Cordi, J. M. Rondinelli, S. J. May, J. Phys. Condens. Matter. 26 (2014) 505502. https://doi.org/10.1088/0953-8984/26/50/505502
- (11) S. Acharya, J. Mondal, S. Ghosh, S. K. Roy, P. K. Chakrabarti, Mater. Lett. 64 (2010) 415-418. https://doi.org/10.1016/j.matlet.2009.11.037
- (12) O. Mihai, S. Raaen, D. Chen, A. Holmen, J. Mater. Chem. A 24 (2013) 7006–7011. https://doi.org/10.1039/c3ta10828g
- (13) K. M. Parida, K. H. Reddy, S. Martha, D. P. Das, N. Biswal, Int. J. Hydrogen Energy 35 (2010) 12161–12168. https://doi.org/10.1016/j.ijhydene.2010.08.029
- (14) S. N. Tijare, M. V. Joshi, P. S. Padole, P. A. Mangrulkar, S. S. Rayalu, N. K. Labhsetwar, Int. J. Hydrog. Energy 37 (2012) 10451-10456. https://doi.org/10.1016/j.ijhydene.2012.01.120
- (15) X. Ren, H. Yang, S. Gen, J. Zhou, T. Yang, X. Zhang, Z. Cheng, S. Sun, Nanoscale 8 (2016) 752-756. https://doi.org/10.1039/c5nr06338h
- (16) H. Wu, R. Hu, T. Zhou, C. Li, W. Meng, J. Yang, CrystEngComm 20 (2015) 3859–3865. https://doi.org/10.1039/c5ce00288e
- (17) Y. Wu, H. Wang, W. Tu, Y. Liu, Y. Z. Tan, X. Yuan, J. W. Chew, J. Hazard. Mater. 347 (2018) 412-422. https://doi.org/10.1016/j.jhazmat.2018.01.025
- (18) J. Yang, R. Hu, W. Meng, Y. Du, Chem. Commun. 52 (2016) 2620-2623. https://doi.org/10.1039/c5cc09222a
- (19) S. Acharya, S. Mansingh, K. M. Parida, Inorg. Chem. Front. 4 (2017) 1022-1032. https://doi.org/10.1039/c7qi00115k
- (20) J. Luo, R. Li, Y. Chen, X. Zhou, X. Ning, L. Zhan, L. Ma, X. Xu, L. Xu, L. Zhang, Sep. Purif. Technol. 210 (2019) 417-430. https://doi.org/10.1016/j.seppur.2018.08.028
- (21) Y. Zhang, L. Wang, S. Yu, H. Jiang, Y. Yun, Y. Sun, J. Shi, Sol. Energy 174 (2018) 770–779. https://doi.org/10.1016/j.solener.2018.09.041
- (22) Q. Chen, C. Zhao, Y. Wang, Y. Chen, Y. Ma, Z. Chen, J. Yu, Y. Wu, Y. He, Sol. Energy 171 (2018) 426-434. https://doi.org/10.1016/j.solener.2018.06.112
- (23) B. Han, Y. H. Hu, Energy Sci. Eng. 4 (2016) 285-304. https://doi.org/10.1002/ese3.128
- (24) A. Splendiani, L. Sun, Y. Zhang, T. Li, J. Kim, C. Chim, G. Galli, F. Wang, Nano Lett. 10 (2010) 1271-1275. https://doi.org/10.1021/nl903868w
- (25) X. Qian, J. Zhang, Z. Guo, S. Liu, J. Liu, J. Lin, Appl. Surf. Sci. 481 (2019) 795-801. https://doi.org/10.1016/j.apsusc.2019.03.176
- (26) T. F. Jaramillo, K. P. Jorgensen, J. Bonde, J. H. Nielsen, S. Horch, I. Chorkendorff, Science 317 (2017) 100-102. https://doi.org/10.1126/science.1141483
- (27) A. M. Tama, S. Das, S. Dutta, M. D. I. Bhuyan, M. N. Islam, M. A. Basith, RSC Adv. 9 (2019) 40357-40367. https://doi.org/10.1039/C9RA07526G
- (28) H. Qin, R. Guo, X. Liu, W. Pan, Z. Wang, X. Shi, J. Tang, C. Huang, Dalton Trans. 47 (2018) 15155-15163. https://doi.org/10.1039/c8dt02901f
- (29) S. Acharya, G. Swain, K. M. Parida, Int. J. Hydrog. Energy 45 (2020) 11502–11511. https://doi.org/10.1016/j.ijhydene.2020.01.158
- (30) R. Ahsan, A. Mitra, S. Omar, M. Z. R. Khan, M. A. Basith, RSC Adv. 8 (2018) 14258-14267. https://doi.org/10.1039/C8RA01585F
- (31) S. Das, A. M. Tama, S. Dutta, M. S. Ali, M. A. Basith, Mater. Res. Express 6 (2019) 125079. https://doi.org/10.1088/2053-1591/ab57dd
- (32) M. Sabarinathan, S. Harish, J. Archana, M. Navaneethan, H. Ikeda, Y. Hayakawa, RSC Adv. 7 (2017) 24754–24763. https://doi.org/10.1039/c7ra03633g
- (33) N. Barbero, D. Vione, Environ. Sci. Technol. 50 (2016) 2130-2131. https://doi.org/10.1021/acs.est.6b00213
- (34) D. Sahoo, B. Kumar, J. Sinha, S. Ghosh, S. S. Roy, B. Kaviraj, Sci Rep. 10 (2020) 10759. https://doi.org/10.1038/s41598-020-67683-2
- (35) E.-W. Shi, C.-T. Xia, W.-Z. Zhong, B.-G. Wang, C.-D. Feng, J. Am. Ceram. Soc 80 (2005) 1567–1572. https://doi.org/10.1111/j.1151-2916.1997.tb03017.x
- (36) J. Rodriguez-Carvajal, Fullprof: A Program for Rietveld Refinement and Pattern Matching Analysis, Abstract of the Satellite Meeting on Powder Diffraction of the XV Congress of the IUCr, Toulouse, France, 1990, p. 127.
- (37) Y. Wei, X. Wei, S. Guo, Y. Huang, G. Zhu, J. Zhang, Mater. Sci. Eng. B 206 (2016) 79–84. https://doi.org/10.1016/j.mseb.2015.12.004
- (38) S. Zhao, Y. Wang, L. Wang, Y. Jin, Inorg. Chem. Front. 4 (2017) 994-1002. https://doi.org/10.1039/c6qi00600k
- (39) O. Wiranwetchayan, S. Promnopas, S. Phadungdhitidhada, A. Phuruangrat, T. Thongtem, P. Singjai, S. Thongtem, Ceram. Int. 45 (2019) 4802-4809. https://doi.org/10.1016/j.ceramint.2018.11.175
- (40) P. Scherrer, Nachrichten von der Gesellschaft der Wissenschaften zu Gottingen 1918 (1918) 98–100. http://eudml.org/doc/59018
- (41) Y. Liu, Y. Zhao, L. Jiao, J. Chen, J. Mater. Chem. A 2 (2014) 13109-13115. https://doi.org/10.1039/c4ta01644k
- (42) G. Pang, S. Chen, Y. Koltypin, A. Zaban, S. Feng, A. Gedanken, Nano Lett. 1 (2001) 723-726. https://doi.org/10.1021/nl0100926
- (43) S. V. P. Vattikuti, C. Byon, C. V. Reddy, R. V. S. S. Ravikumar, RSC Adv. 5 (2015) 86675-86684. https://doi.org/10.1039/c5ra15159g
- (44) J. Liu, L. Fang, F. Zheng, S. Ju, M. Shen, Appl. Phys. Lett. 95 (2009) 022511. https://doi.org/10.1063/1.3183580
- (45) E. Van Besien, M. Pantouvaki, L. Zhao, D. De Roest, M. R. Baklanov, Z. Tokei, G. Beyer, Microelectron. Eng. 92 (2012) 59-61. https://doi.org/10.1016/j.mee.2011.04.015
- (46) H. Deng , M. Zhang , Z. Hu , Q. Xie , Q. Zhong , J. Wei, H. Yan, J. Alloys Compd. 582 (2014) 273. https://doi.org/10.1016/j.jallcom.2013.07.187
- (47) J. F. Scott, J. Phys. Condens. Matter 20 (2007) 021001. https://doi.org/10.1088/0953-8984/20/02/021001
- (48) M. S. Wu , Z. B. Huang , C. X. Han , S. L. Yuan , C. L. Lu, S. C. Xia, Solid State Commun. 152 (2012) 2142. https://doi.org/10.1016/j.jhazmat.2018.01.025
- (49) H. J. Jin, J. Kim, Y. Kim, S. Yoon, Y. Lee, K. Kim, W. Jo, J. Mater. Chem. C 8 (2020) 3724-3729. https://doi.org/10.1039/c9tc05621a
- (50) M. A. Khan, M. A. Nadeem, H. Idriss, Surf. Sci. Rep. 71 (2016) 1-31. https://doi.org/10.1016/j.surfrep.2016.01.001
- (51) Y. Cui , J. Briscoe, S. Dunn, Chem. Mater. 25 (2013) 4215-4223. https://doi.org/10.1021/cm402092f
- (52) M. A. Basith, R. Ahsan, I. Zarin, M. A. Jalil, Sci. Rep. 8 (2018) 11090. https://doi.org/10.1038/s41598-018-29402-w
- (53) S. H. Othman, S. A. Rashid, T. I. M. Ghazi, N. Abdullah, J. Nanomater. 2010 (2010) 1-10. https://doi.org/10.1155/2010/512785
- (54) P. Mishra, A. Behera, D. Kandi, K. Parida, Nanoscale Adv. 1 (2019) 1864-1879. https://doi.org/10.1039/c9na00018f
- (55) I. N. Sora, D. Fumagalli, Environ. Sci. Pollut. Res. 24 (2016) 12556-12561. https://doi.org/10.1007/s11356-016-7640-y
- (56) B. E. Watt, A. T. Proudfoot, J. A. Vale, Toxicol. Rev. 23 (2004) 51-57. https://doi.org/10.2165/00139709-200423010-00006
- (57) K. Xu, H. Xu, G. Feng, J. Feng, New J. Chem. 41 (2017) 14602-14609. https://doi.org/10.1039/c7nj03120c
- (58) T. Vijayaraghavan, M. Bradha, P. Babu, K. Parida, G. Ramadoss, S. Vadivel, R. Selvakumar, A. Ashok, J. Phys. Chem. Solids 140 (2020) 109377. https://doi.org/10.1016/j.jpcs.2020.109377
- (59) S. Kanda, T. Akita, M. Fujishima, H. Tada, J. Colloid Interface Sci. 354 (2011) 607-610. https://doi.org/10.1016/j.jcis.2010.11.007
- (60) S. Min, G. Lu, J. Phys. Chem. C 116 (2012) 25415-25424. https://doi.org/10.1021/jp3093786
- (61) Y. Huang, J. Liu, D. Cao, Z. Liu, K. Ren, K. Liu, A. Tang, Z. Wang, L. Li, S. Qu, Z. Wang, Int. J. Hydrog. Energy 44 (2019) 13242-13252. https://doi.org/10.1016/j.ijhydene.2019.03.182
- (62) Q. Liu, Z. Pu, A. Asiri, A. Qusti, A. Al-Youbi, X. Sun, J. Nanoparticle Res. 15 (2013) 2057. https://doi.org/10.1007/s11051-013-2057-8
- (63) A. H. Nethercot, Phys. Rev. Lett. 33 (1974) 1088–1091. https://doi.org/10.1103/physrevlett.33.1088
- (64) Y. Zeng, N. Guo, Y. Song, Y. Zhao, H. Li, X. Xu, J. Qiu, H. Yu, J. Colloid Interface Sci. 514 (2018) 664–674. https://doi.org/10.1016/j.jcis.2017.12.079
- (65) Y. Jia, H. Ma, C. Liu, Appl. Surf. Sci. 463 (2019) 854-862. https://doi.org/10.1016/j.apsusc.2018.09.008