- MIMO
- Multiple-input Multiple-output
- LIS
- Large Intelligent Surface
- DL
- Deep Learning
- CSI
- Channel State Information
- 5G
- 5th generation of wireless networks
- 6G
- 6th generation of wireless networks
- SNR
- Signal-to-Noise Ratio
- ML
- Machine Learning
- DAE
- denoising autoencoder network
- RSS
- Received Signal Strength
- RTI
- Radio Tomographic Image
- WSN
- Wireless Sensor Network
- ECDF
- Empirical Cumulative Distribution Function
- LoS
- Line of Sight
- ToF
- Time of Flight
- FMCW
- Frequency Modulated Carrier Wave
- MF
- Matched Filter
- USRP
- Universal Software Radio Peripheral
Radio Sensing with
Large Intelligent Surface for 6G
††thanks: This work has been submitted to IEEE for possible publication. Copyright may be transferred without notice, after which this version may no longer be accessible.
This project has received funding from the European Union’s Horizon 2020 research and innovation programme under the Marie Skłodowska-Curie Grant agreement No. 813999.
Abstract
This paper leverages the potential of Large Intelligent Surfaces (LIS) for radio sensing in 6G wireless networks. Major research has been undergone about its communication capabilities but it can be exploited as a formidable tool for radio sensing. By taking advantage of arbitrary communication signals occurring in the scenario, we apply direct processing to the output signal from the LIS to obtain a radio map that describes the physical presence of passive devices (scatterers, humans) which act as virtual sources due to the communication signal reflections. We then assess the usage of machine learning (k-means clustering), image processing and computer vision (template matching and component labeling) to extract meaningful information from these radio maps. As an exemplary use case, we evaluate this method for both active and passive user detection in an indoor setting. The results show that the presented method has high application potential as we are able to detect around 98% of humans passively and 100% active users by just using communication signals of commodity devices even in quite unfavorable Signal-to-Noise Ratio (SNR) conditions.
I Introduction
Services offered by the 5th generation of wireless networks (5G) are expected to be further enhanced. For that purpose, sensing and positioning based on radio signals [1, 2] might play a vital role in combination with a proper beam alignment [3, 4]. So, what will be the new features of the 6th generation of wireless networks (6G)? We envisage that one of the main features of 6G will be integrating sensing and radio-based imaging, providing context information which improves the ultimate goal of communication. It will enable merging communications and new applications such as 3D imaging and sensing [5].
Sensing can be regarded as the ability of wireless systems to process the signals with the aim of describing the physical environment. There are different methodologies to perform sensing using wireless signals. Essentially, some of these methods use dedicated signals and/or specific hardware [6, 7, 8, 9], while others use communication signals of commodity devices to perform the sensing task [10, 11]. As an example of the first type, in [8, 9] they employ Radio Tomographic Image (RTI), which is a Received Signal Strength (RSS)-based technology for rendering physical objects in wireless networks. They create a radio map based on the RSS variations due to objects presence in the scenario by deploying nodes around the room conforming a Wireless Sensor Network (WSN). In turn, by making use of the communication signals occurring in an environment and avoiding dedicated transmissions [10, 11], one can rely on properties of the wireless channel such as the Channel State Information (CSI) using commodity Wi-Fi devices, to perform sensing tasks as human gesture recognition or fall detection. Works like the ones presented in [6, 7] capture the reflections of wireless signals, similar to the radar principle. They use Wi-Fi devices and to estimate the Time of Flight (ToF) they need to rely on the Frequency Modulated Carrier Wave (FMCW) technique. This enables applications such as human pose estimation and breath monitoring. When relying on a radar-like approach, high accuracy is obtained, but needs the addition of customized extra hardware (such as Universal Software Radio Peripheral (USRP) [7]) to generate the signal that sweeps the frequency across time.
In the context of communications, the Multiple-input Multiple-output (MIMO) technique is a fundamental technology in 5G with the main purpose of increasing area spectral efficiency [12]. In massive MIMO, the base station is equipped with a very large number of antennas. Intending to push their benefits to the limit and look towards post-5G, researchers are defining a new generation of base stations that are equipped with an even larger number of antennas. The concept of Large Intelligent Surface (LIS) designates a large continuous electromagnetic surface able to transmit and receive radio waves. In practice, an LIS is composed of a collection of closely spaced tiny antenna elements. While the potential for communications of LIS is being investigated, these devices offer possibilities that are not being understudied accurately, i.e., environmental sensing based on radio images [13].
Due to the increasing interest in both sensing and LIS, and motivated by their future integration in communication systems, in this work, we are focusing on LIS sensing capabilities. Specifically, the contributions of this work can be summarized as follows:
-
•
We present a method that enables reconstructing a radio map of the propagation environment using an indoor LIS deployment in the ceiling. This radio map shows the presence of active and passive (scatterers/humans) users in the environment by relying on environmental communication signals.
-
•
We solve a problem of active and passive multi-user detection in the scenario using the reconstructed radio maps. The solution is based on the k-means clustering of the radio maps, followed by the application of image processing to enhance the quality and computer vision to perform the detection.
Detecting passive users is of great interest as we are relying on environmental radio signals and do not need dedicated devices. This could be quite useful for human intrusion detection or to optimize beamforming towards the passive human enabling the access phase with an optimized radiation pattern. These radio maps could be used for further tasks related to the environmental description and location of scatterers. Hence, we analyze the feasibility of this proposal to determine the precision in users detection and environmental description by exploiting the information provided by the radio propagation environment as a radio map. We measure the detection accuracy as the number of users detected while also verifying the positioning accuracy. Furthermore, this work leverages the potential of the combination between wireless sensing, LIS and computer vision for 6G.
II Problem Formulation and System Description
Let us consider an indoor scenario where users are randomly deployed in a room111Please note we refer as user to anything using a transmitter, such as robots, IoT devices or smartphones.. We assume that all these users are commodity wireless devices that are fulfilling their communication tasks while we take advantage of them to perform the sensing. The goal is two-fold:
-
1.
Construction of radio maps based on commodity devices’ communication signals.
-
2.
Using these radio maps to detect both active users and passive scatterers/objects and/or humans.
For this task, we assume that an LIS of antenna elements is placed along the ceiling, whose physical aperture comprises its whole area. For simplicity, we assume an ideal LIS composed of isotropic antennas and physical effects such as mutual coupling are ignored222The mutual coupling effect is usually modeled as a coupling matrix which accounts for the effect of neighboring antennas [14]. Once the coupling matrix is estimated, its effect can be compensated. This motivated avoiding the addition of extra complexity to the model, as it would not impact on the main findings and conclusions of this work.. The sensing problem reduces to determine, from the superposition of the received signals from each of the users at every of the LIS elements, the coordinates (a.k.a the position) of the users involved in the scenario as well as the passive humans. The superposed complex baseband signal received at the LIS is given by
| (1) |
with the transmitted (sensing) symbol from user , the channel vector from a specific position of user to each antenna-element, and the noise vector. Please note we are considering a narrowband transmission, avoiding frequency selectivity effects.
III LIS radio map generation
Due to the large physical aperture of the deployment in comparison with the distance between the transmitters and the LIS, spherical wave propagation needs to be taken into account. Describing the channel in (1) as the sum of paths, the channel from user to the -th antenna element can be regarded as
| (2) |
where and correspond to the Line of Sight (LoS) component and the reflections, respectively. Then, denotes the square-root of the pathloss, is the distance from the transmitter to the -th element in the LIS; and the term denotes the scatterers acting as virtual sources where encapsulates the pathloss and phase shift of all the reflections involved.
From (2), we can see the spherical-wave channel coefficient at the LIS -th element from an arbitrary user transmission is proportional to [15]
| (3) |
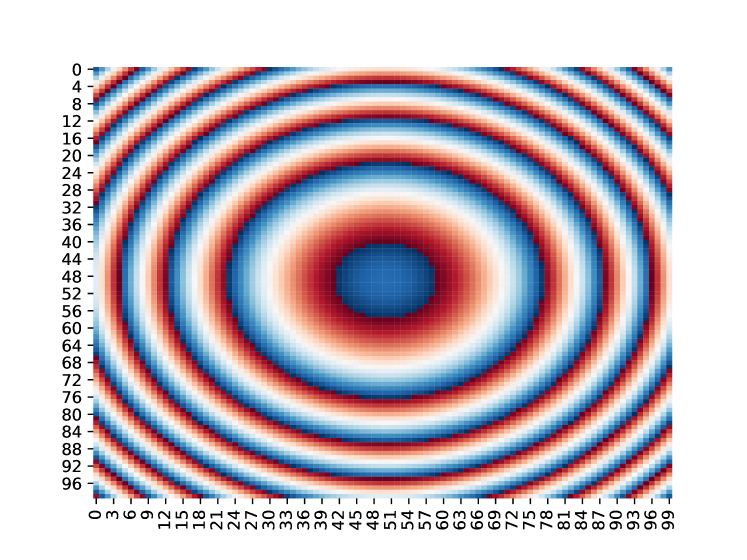
where accounts for the distance from the transmitter to the receiver antenna. In this way, describing the surface in a vectorized notation, we can derive a Matched Filter (MF) such that:
| (4) |
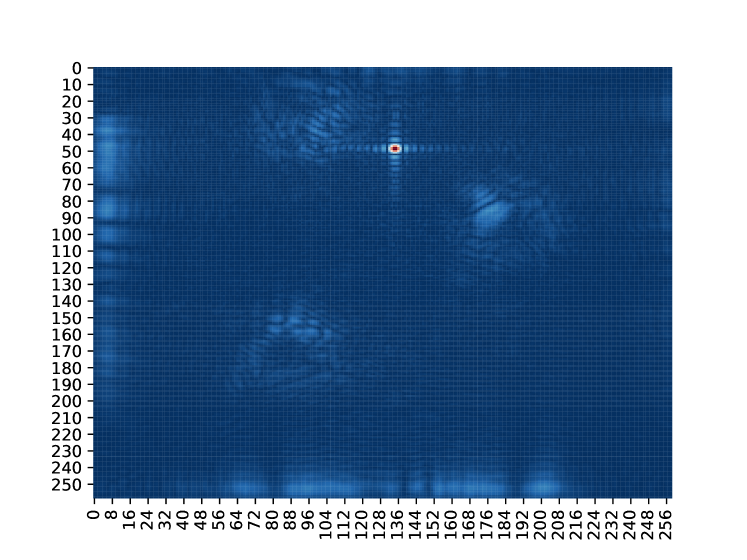
where denotes the current antenna index, represents the convolution is done along all the LIS dimension. Then, denotes the expected spherical pattern (steering vector) for antennas LIS deployment on (3), the received signal from (1) and the filtered output that represents the radio map. As the convolution operator requires both vectors to have the same dimension, we zero-pad such that it matches dimension. Fig. 1 shows the pattern the MF operation is using. We can see the expected spherical wave propagation due to the near-field conditions. Please note for the design of the filter, we have to know the frequency employed and we assume a distance from the transmitter and the LIS receiver in the ceiling. Fig. 2 shows an exemplary radio map obtained by computing . In the exemplary scenario, one active transmitter is used333The radio map reconstruction works regardless of the amount of active . As denoted in eq (1) they are superposed, meaning the radio map reconstruction can be obtained when . In this exemplary case, was used for illustration purposes., while three static scatterers are present in the environment. We see the three scatterers in the environment (the cylindric-like shapes) while we can also identify the highest peak representing the user transmission. The scatterers are captured because from the receiver LIS viewpoint, the scatterers act as virtual sources that are equivalent to LoS components, i.e., in (3) the different reflections are equivalent to a LoS path with complex gain .
IV Active and Passive multi-user detection based on LIS radio map
IV-A Detection of multiple active users
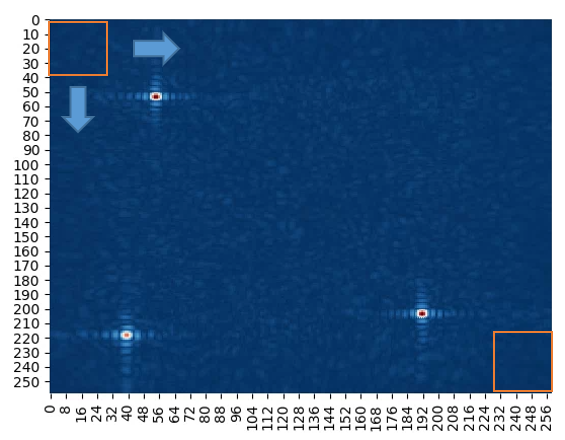
The previous section shows that we can identify the users by locating the local maxima along the entire radio map. In this way, we develop an algorithm to perform that task based on maximum filtering. For that, we slide around the image a kernel of size , with a stride of 1, being a parameter we denote as minimum distance (i.e. we assume peaks are separated by at least the minimum distance). In this kernel, we obtain the maximum value of it, considered to be the local maxima of that sub-region. Then, we sort the obtained local maxima in descending order and get the maximas pixel coordinates corresponding to the total number of users. We compare the energy of these peaks to determine how many active regions (peaks) are in the scenario. This is possible because the MF output energy in the active users positions is maximized. This means we can detect how many active users are in the map by measuring the energy of the obtained local maximas and compare them sequentially in descending order. When the energy value drops up to 90%444This value and were found empirically., we know we have detected all the active users. This means we do not need to know how many active users are deployed a priori. Fig.3 shows an example of this method555For the sake of focusing on the concept of active user detection, we have removed the scatterers in this exemplary map.. The orange box denotes the kernel of size that is used to slide along the radio map. Then, the values are sorted in descending order and we infer the 3 users positions. We show a noisy scenario to highlight that because the MF maximizes the Signal-to-Noise Ratio (SNR) at the output, the users are still nicely captured in the map regardless of a noisy condition.
IV-B Passive human detection
The proposed method assumes that in the scenario, the scatterers are located at fixed positions while the moving entities would correspond to the either active or passive (humans) in the area.
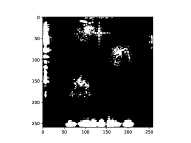
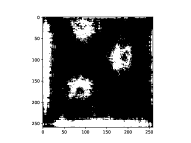
To perform the passive human detection, we first take advantage of an offline scanning period phase in which we measure different transmissions of any active devices to scan the static features of the propagation environment (a.k.a the scatterers). We then obtain measurements of the environment for different random active user positions when no passive humans are in the scenario. Figure 2 shows that we have mainly two dominant ranges of pixel values, either the background (low energy at the output of the MF) or high energy (the active transmitter and scatterers). This leads us to apply a k-means clustering w.r.t. the pixel values of the radio map (with ) to enhance the radio map through its binarization. Figure 4a shows a clusterized version of the radio map presented in Figure 2. It shows the enhanced areas of the static features of the environment as well as the active transmitter. As we are not interested in the active transmitter, we use a technique from the computer vision literature called Template Matching [16] which removes the expected active transmitter pattern from the clusterized map. By combining different active transmissions along the scenario, we can combine several radio maps to obtain an enhanced version that highlights the scatterers presence in the scenario, as shown in Figure 4b. These multiple transmission positions illuminate the scatterers from different angles. Furthermore, these map pixel values are either 0 (black) or 1 (white), being white the representation of the scatterers. We will denote this map as masking map666A similar strategy could be applied to avoid the necessity of an empty room scanning period, in which the passive humans could be averaged out from the masking map..
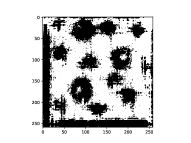
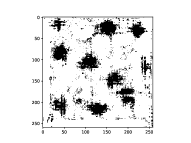
By having this representation of the static elements of the environment, we can now store this masking map locally at the LIS to process new maps and remove the static elements of it when trying to detect humans passively. For this purpose, when there are passive humans in the room, we can obtain combined radio maps to process a negative masking map (meaning scatterers are now black) that we will use to perform a logical OR operation with the locally stored masking map. Figure 4c shows an example of a negative masking map when there is passive humans in the scenario. We see now the scatterers and the humans are represented in black (0 value). Furthermore, when applying an OR operation with the locally stored masking map we obtain Figure 4d, which eliminates the static scatterers of the scenario and highlights the passive humans reflections. We can see in the map that there are some artifacts (salt-pepper noise) as a result of this process. To alleviate it, we define a sliding window algorithm of size that set all the pixel values comprising the window size to 1 (white) if the number of black pixels in that window is lower than a defined threshold . In this way, we can reduce significantly this salt-pepper noise. Figure 5b shows the removal of the artifacts thanks to this procedure.
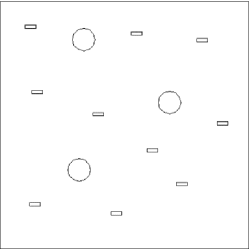
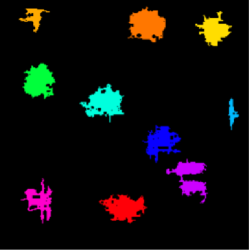
Finally, we are interested in detecting these shapes associated to the passive human positions in the radio maps. For that, we adopt a computer vision algorithm named Component Labeling [17] which compares neighboring pixels to detect a shape that is assigned to the same label. Figure 5a shows the exemplary groundtruth scenario in which these maps are computed while Figure 5b shows the result of detecting the passive humans. They are assigned to different colors (labels) for illustration purposes. Hence, we can infer the passive human positions by obtaining the center pixel coordinates of these shapes .
IV-C Position mapping from pixel to real space
In both presented methods, we infer the positions in the pixel domain. To infer the real position of the users, we have to perform a mapping described as
| (5) |
where is the real inferred mapped coordinate, refers to the inferred pixel coordinate and corresponds to the inter-antenna spacing.
V Exemplary scenario
V-A Simulated scenario
We conducted simulations via ray tracing [18]. The motivation for using ray tracing is twofold:
-
1.
Providing a channel that is not generated from the same model we used to analyze the system. In this way, we can guarantee a match between expected theoretical results and empirical ones.
-
2.
We can control the geometry of the environment to test different conditions.
We simulate a scenario of size m. We deploy an LIS with elements separated . Each active device transmits an arbitrary narrowband signal of 20 dBm at 3.5 GHz. The distance from which the MF is calibrated is . The active are assumed to be m height, being this value randomnly selected. The scatterers are modeled as metallic (with conductivity S/m, relative permittivity and relative permeability 777These values are provided by the software manual [18]. cylinders of 1 m diameter and 2 m height. The passive humans are model as rectangles of dimensions 0.3x0.5x1.7 m (average human dimensions obtained from [19]) with S/m, and [20].
V-B Received signal and noise modeling
From the ray-tracing simulation, the received signal in (1) is obtained as the complex electric field arriving at the -th antenna element, , which can be regarded as the superposition of each ray path from every user, i.e.,
| (6) |
Then, the complex signal at the output of the -th element is therefore given by
| (7) |
with the wavelength, the free space impedance and the antenna impedance. For simplicity, we consider . Finally, in order to test the system performance under distinct noise conditions, the average SNR, , is defined as
| (8) |
where denotes the number of antenna elements in the LIS.
VI Numerical results and Discussion
We evaluate the performance of the proposed method in the scenario described in Section V-A under different conditions. We assume the system can obtain extra samples at each channel coherence interval to perform an S-averaging, diminishing the noise variance contribution.
VI-A Active user detection
We here present as a baseline, a comparison of the sensing performance by tracking users simultaneously transmitting under different dB scenarios. For these results, we set the minimum distance of the sliding window to .
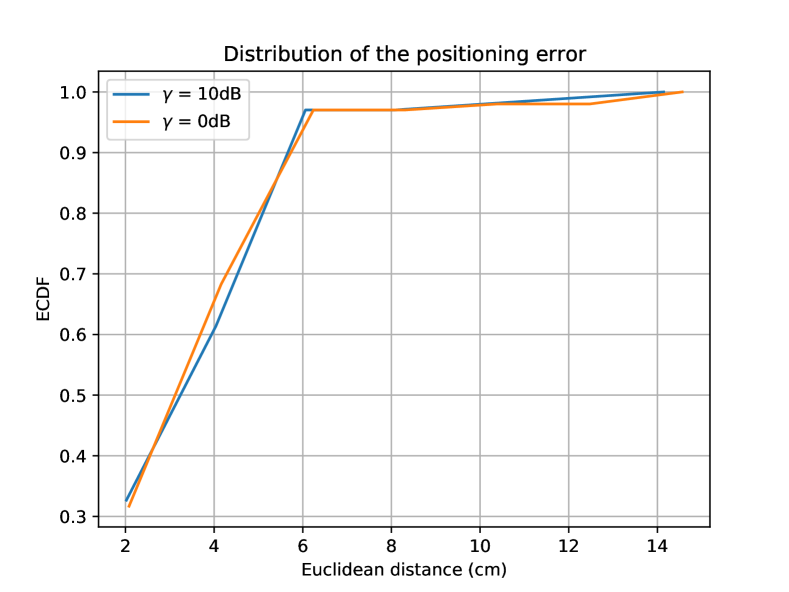
Figure 6 shows the Empirical Cumulative Distribution Function (ECDF) of the euclidean distance between the predicted and the groundtruth positions for a simultaneous transmission. The results show the sensing system can perform a multi-user detection with a quite high accuracy in positioning. This is thanks to the LIS physical aperture, which allows obtaining a high resolution image that creates a pattern discernable while 3 robots are transmitting in the scenario. We can see the positioning error is around 5.5 cm under 90% of the cases, which shows its tracking potential. Also, as we are relying on the MF output which maximizes the SNR, the robustness of the system to noisy scenarios is significant, leading to similar results for both the and dB cases.
VI-B Passive user detection
We here leverage the performance for passive user detection in the scenario using the method described in Section IV.B. We fix dB. For these results, we set for the sliding window algorithm, , averaged measurements and we consider humans at arbitrary positions in the scenario.
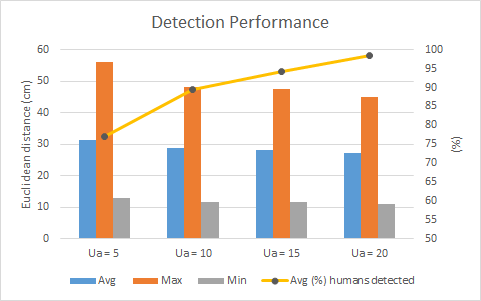
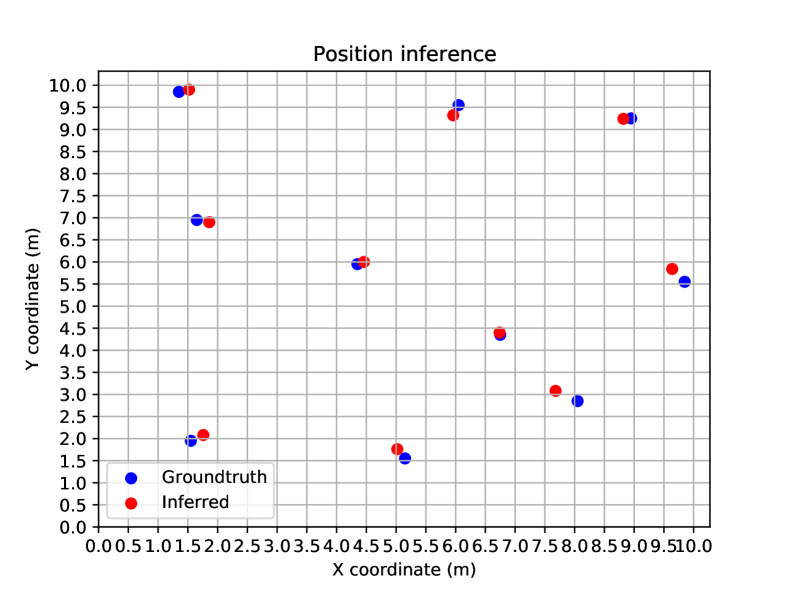
The detection of passive humans is highly impacted by the active users positions. For the sake of generalization, we perform Monte Carlo simulations for obtaining our results under different random configurations. Figure 7 shows the average, maximum and minimum positioning errors of the correctly detected passive humans as well as the average detected humans by using a different number of active users . Please note, we are not using dedicated active transmissions for this task, but we take advantage of the wireless communications occurring from these active devices in the scenario. The results show that the number of active users does not really impact on the positioning performance as it remains similar when using a lower and a higher number of active users . However, by increasing , the number of passive humans detected increases. This is because the more the transmissions, the more reflections we obtain from the human body reflections leading to an easier detection of the passive humans. Furthermore, the detection of this system is quite accurate, as we can detect a minimum of around 80% humans in all the configurations and the average error is around 28 cm. Figure 8 shows an illustration of the inferred positions w.r.t. the groundtruth positions. It shows the positioning accuracy is quite high even with 10 people passively sensed. We would like to remark that it is not necessary having simultaneous transmission from all the active users and the performance would remain similar if we wish to combine signals within a defined coherence time. However, we consider the presented case is more challenging (due to interference) and we wanted to show it still works with no drops in performance.
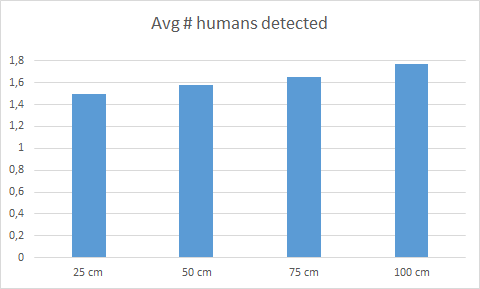
VI-C Passive user detection distance evaluation
Finally, we here evaluate the accuracy of the detection of passive humans by comparing performance under different separations among them. We fix dB. For these results, we set for the sliding window algorithm, , averaged measurements and we consider humans separated 25/50/75/100 cm apart, respectively.
We test different separations and we evaluate the detection performance of the passive humans. Figure 9 shows the average detection of the humans. We can see the system achieves around 1.5/2 detections in the most challenging case (25 cm) while obtaining around 1.8/2 in the most favorable (100 cm). This shows the potential of the system, even when the separation among humans is quite small.
VII Conclusions
Large Intelligent Surfaces are a key ingredient in current studies for improving communications in the forthcoming 6G paradigm. However, one of the main characteristics of 6G resides in the ability of sensing. The presented use case shows computer vision algorithm along with clustering-based machine learning, are a powerful tool to take into account when using an image-based LIS sensing approach. Future lines can be of interest, for example, location assisted analog beamforming according to the user position radio map. Finally, we note that LIS is one of the technologies being considered for future 6G systems, which may change the relevant cost/benefit analysis in that any sensing functionality is then expected to be added onto the system rather than requiring explicit investment on extra dedicated hardware.
References
- [1] Y. Zhang, L. Deng, and Z. Yang, “Indoor positioning based on FM radio signals strength,” in 2017 First International Conference on Electronics Instrumentation & Information Systems (EIIS). IEEE, 2017, pp. 1–5.
- [2] Y.-S. Chiou, C.-L. Wang, S.-C. Yeh, and M.-Y. Su, “Design of an adaptive positioning system based on WiFi radio signals,” Computer Communications, vol. 32, no. 7-10, pp. 1245–1254, 2009.
- [3] X. Song, S. Haghighatshoar, and G. Caire, “Efficient beam alignment for millimeter wave single-carrier systems with hybrid MIMO transceivers,” IEEE Transactions on Wireless Communications, vol. 18, no. 3, pp. 1518–1533, 2019.
- [4] S. Noh, M. D. Zoltowski, and D. J. Love, “Multi-resolution codebook and adaptive beamforming sequence design for millimeter wave beam alignment,” IEEE Transactions on Wireless Communications, vol. 16, no. 9, pp. 5689–5701, 2017.
- [5] M. Latva-aho and K. Leppänen, “Key drivers and research challenges for 6G ubiquitous wireless intelligence (white paper),” 6G Flagship research program, University of Oulu, Finland, 2019.
- [6] F. Adib, Z. Kabelac, H. Mao, D. Katabi, and R. C. Miller, “Real-time breath monitoring using wireless signals,” in Proceedings of the 20th annual international conference on Mobile computing and networking, 2014, pp. 261–262.
- [7] K. Stasiak and P. Samczynski, “FMCW radar implemented in SDR architecture using a USRP device,” in 2017 Signal Processing Symposium (SPSympo). IEEE, 2017, pp. 1–5.
- [8] J. Wilson and N. Patwari, “Radio tomographic imaging with wireless networks,” IEEE Transactions on Mobile Computing, vol. 9, no. 5, pp. 621–632, 2010.
- [9] D. Lee and G. B. Giannakis, “A variational bayes approach to adaptive radio tomography,” arXiv preprint arXiv:1909.03892, 2019.
- [10] H. Wang, D. Zhang, Y. Wang, J. Ma, Y. Wang, and S. Li, “RT-Fall: A real-time and contactless fall detection system with commodity WiFi devices,” IEEE Transactions on Mobile Computing, vol. 16, no. 2, pp. 511–526, 2016.
- [11] Q. Pu, S. Gupta, S. Gollakota, and S. Patel, “Whole-home gesture recognition using wireless signals,” in Proceedings of the 19th annual international conference on Mobile computing & networking, 2013, pp. 27–38.
- [12] E. G. Larsson, O. Edfors, F. Tufvesson, and T. L. Marzetta, “Massive MIMO for next generation wireless systems,” IEEE communications magazine, vol. 52, no. 2, pp. 186–195, 2014.
- [13] C. J. Vaca-Rubio, P. Ramirez-Espinosa, K. Kansanen, Z.-H. Tan, E. De Carvalho, and P. Popovski, “Assessing wireless sensing potential with large intelligent surfaces,” IEEE Open Journal of the Communications Society, vol. 2, pp. 934–947, 2021.
- [14] T. Su and H. Ling, “On modeling mutual coupling in antenna arrays using the coupling matrix,” Microwave and Optical Technology Letters, vol. 28, no. 4, pp. 231–237, 2001.
- [15] Z. Zhou, X. Gao, J. Fang, and Z. Chen, “Spherical wave channel and analysis for large linear array in los conditions,” in 2015 IEEE Globecom Workshops (GC Wkshps). IEEE, 2015, pp. 1–6.
- [16] R. Brunelli, Template matching techniques in computer vision: theory and practice. John Wiley & Sons, 2009.
- [17] A. Rosenfeld and J. L. Pfaltz, “Sequential operations in digital picture processing,” Journal of the ACM (JACM), vol. 13, no. 4, pp. 471–494, 1966.
- [18] Feko, altair engineering, inc. https://www.altairhyperworks.com/feko.
- [19] P. Potkány, M. Debnár, M. Hitka, and M. Gejdoš, “Requirements for the internal layout of wooden house from the point of view of ergonomics changes,” Zeszyty Naukowe. Quality. Production. Improvement, 2018.
- [20] P. S. Hall, Y. Hao, Y. I. Nechayev, A. Alomainy, C. C. Constantinou, C. Parini, M. R. Kamarudin, T. Z. Salim, D. T. Hee, R. Dubrovka et al., “Antennas and propagation for on-body communication systems,” IEEE Antennas and Propagation Magazine, vol. 49, no. 3, pp. 41–58, 2007.