ORCID ID: ]https://orcid.org/0000-0001-8842-1886
Charge-order on the triangular lattice:
Effects of next-nearest-neighbor attraction in finite temperatures
Abstract
The extended Hubbard model in the atomic limit, which is equivalent to lattice fermionic gas, is considered on the triangular lattice. The model includes onsite Hubbard interaction and both nearest-neighbor () and next-nearest-neighbor () density-density intersite interactions. The variational approach treating the term exactly and the terms in the mean-field approximation is used to investigate thermodynamics of the model and to find its finite temperature () phase diagrams (as a function of particle concentration) for and . Two different types of charge-order (i.e., DCO and TCO phases) within unit cells as well as the nonordered (NO) phase occur on the diagram. Moreover, several kinds of phase-separated (PS) states (NO/DCO, DCO/DCO, DCO/TCO, and TCO/TCO) are found to be stable for fixed concentration. Attractive stabilizes PS states at and it extends the regions of their occurrence at . The evolution of the diagrams with increasing of is investigated. It is found that some of the PS states are stable only at . Two different critical values of are determined for the PS states, in which two ordered phases of the same type (i.e., two domains of the DCO or TCO phase) coexist.
Highlights:
• Atomic limit of the extended Hubbard model on the triangular lattice is analyzed. • Phase diagrams of the lattice fermionic gas model are found. • The effects of next-nearest-neighbor attractive interaction are investigated. • The diagrams have complex structure with different multicritical points. • The stability regions of various phase separated states are found.
I Introduction
The classical lattice gas model (equivalent with the Ising model) is useful effective model for description of adsorbed particles on crystalline substrates (cf. pioneering works on the triangular lattice [1, 2, 3, 4, 5, 6, 7]). In the case of a graphine surface or a single layer of graphene as well as (111) face-centered cubic surface, the periodic potential of the underlying crystal surface forms a triangular lattice, which can be occupied by adsorbed atoms, e.g., [8, 9, 10, 11, 12]. Although the adsorbed particles are rather classical, taking into account the quantum properties is necessary for a description of helium atoms adsorption [13, 14, 15, 16]. Thus, in the present work, an extension of the classical lattice gas model to fermionic particles is analyzed. Particular attention is taken for effects of the next-nearest-neighbor attraction on the phase diagrams at finite temperatures.
The investigated model has the form of the extended Hubbard model [17, 18, 19, 20, 16] in the atomic limit (i.e., zero-bandwidth limit) with Coulomb interactions restricted to the next-nearest neighbors (or, equivalently, to the second neighbors) and it can be written as:
| (1) |
where () is the creation (annihilation) operator of a fermionic particle with spin () at the site , whereas and are the number operator of particles with spin at site and the total number operator of particles at site , respectively. denotes the summation over th neighbors independently (). is the onsite interaction, whereas and denote the intersite interactions between the nearest neighbors (NNs) and the next-nearest neighbors (NNNs), respectively. and are numbers of NNs and NNNs, respectively ( for the triangular lattice). The chemical potential is related with the total concentration of particles in the system through , where and is the total number of lattice sites.
Within the variational approach treating onsite term exactly and intersite terms in the mean-field approximation, i.e.,
| (2) |
this model was intensively investigated on the hypercubic lattices, e.g., for [21, 22, 23] and [24, 25, 26, 27]. Moreover, rigorous results for one-dimensional chain were found in [28, 29] as well as the model on two-dimensional square lattice was analyzed by various methods [30, 31, 32, 33, 34, 27]. On the triangular lattice [within the variational approach with decoupling (2)], the evolution of metastable phases in the model was determined for and [35], whereas the full phase diagram (for all temperatures, at and ) for was obtained in [36]. In [36] the effects of only at the ground state were also discussed.
In the present work, the effects of the attractive NNN interaction (i.e., ) are investigated at within the variational approach mentioned, for details cf. [22, 23, 24, 25, 27, 35, 36]. In particular, the evolution of phase diagrams (for fixed , where , , and ) with increasing is presented and an emergence of novel phase separation states (not occurring for or ) is noticed. Because the triangular lattice can be divided into three equivalent sublattices only orderings within unit cell are considered (the three-sublattice assumption), which is justified in the range of model parameters considered.
For , the expressions given in [24] for the triangular lattice and take the following forms (cf. also these in [36, 27]). For a grand canonical potential (per lattice site) one obtains
| (3) |
where is inverted temperature, coefficients are defined as ,
| (4) |
and is a local chemical potential in sublattice () defined as
| (5) |
Here, and denote two other sublattices than (and ). Particle concentration in each sublattice for arbitrary is expressed by
| (6) |
Three equations for determine the solution for a (homogeneous) phase occurring in the system for fixed , , , and . If is fixed, the set is solved with respect to , , and (the third concentration is found as ). This set has usually several solution, thus it is extremely important to find the solution corresponding to the lowest (if is fixed) or free energy (if is fixed). For fixed , the phase-separated (PS) states can also occur, which free energy is determined by the Maxwell’s construction (macroscopic phase separation), e.g., [37, 38, 39, 23, 36, 40].
II Numerical results ( and )
It was shown that in the model (within the approximation used) the following phases can occur: (i) the nonordered (NO) phase with , (ii) the charge-ordered phase with two different concentration in sublattices (the DCO phase, e.g., and other cyclic permutations, equivalent solutions), and (iii) the charge-ordered phase with , , and (the TCO phase; three different concentrations in sublattices, equivalent solutions) [41, 36]. Moreover, for , two PS states were found in some ranges of : (i) PS1:NO/DCO, where the NO and the DCO phases coexist and (ii) PS2:DCO/DCO, where two different DCO phases coexist [35, 36]. Due to the particle–hole symmetry of model (1) the phase diagram is symmetric with respect to half-filling, i.e., or () [17, 22, 35, 36].
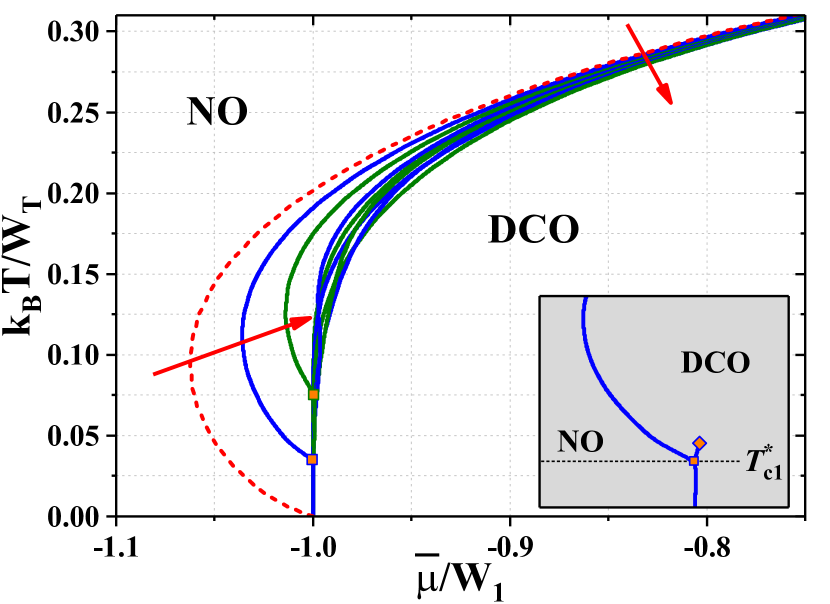
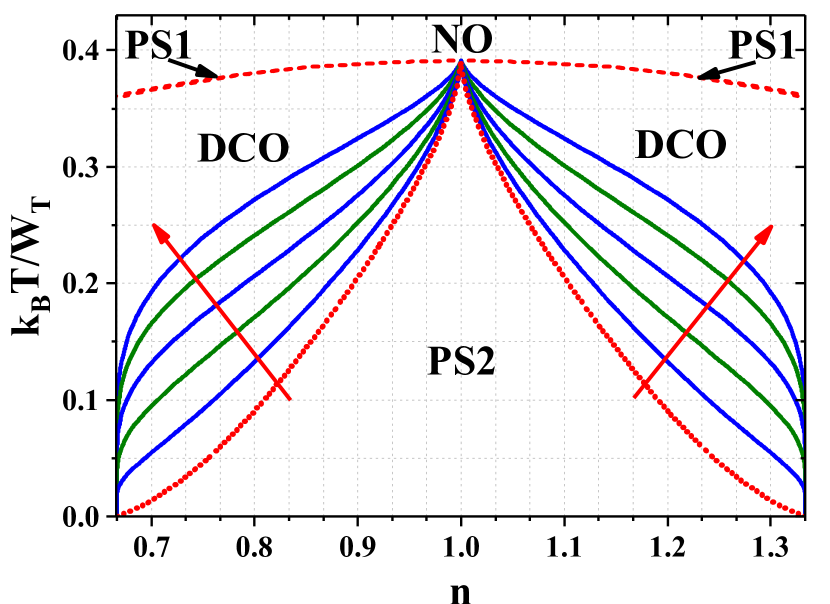
The simplest phase diagram of the model is for . For , the diagram for fixed consists of two regions of the DCO phase and one region of the NO phase. These regions are separated by two kinds of first-order (discontinuous) boundaries: (i) the DCO-NO line with its maximum temperature at half-filling and (ii) the DCO-DCO line at extending from to (it is -independent) [35, 36] (cf. also Fig. 1). As a result, on the diagram as a function of one finds regions of two PS states occurrence: (i) the PS1 state occurring in narrow range of for (it does not exist at , Fig. 2) and (ii) the PS2 state, which is stable for (with concentrations in coexisting domains as and at ; Fig. 3), respectively.
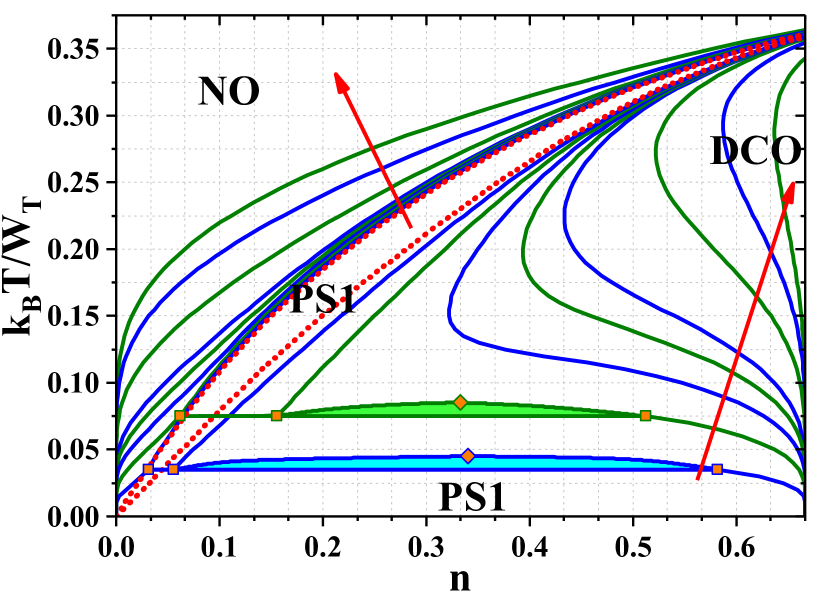
Nonzero extends the regions of the PS states occurrence. For , the PS1 state is stabilized at with and . For (where ) and above some (which is - and - dependent), the PS2 state appears in a narrow region (shadowed regions in Fig. 2). It vanishes continuously at . With increasing for fixed (higher concentrations), at the PS1-PS2 transition occurs, which is associated with the change of the phase in the domain of lower concentration (from the NO to the DCO phase) with simultaneous a discontinuous change of concentration in this domain. For lower concentrations , there is also a transition between two different PS1 states (the PS1-PS1 transition). At the discontinuous change of concentration in the DCO phase domain of the PS1 state occurs. This behavior is associated with a new first-order DCO-DCO boundary inside the DCO region [ending at a bicritical-end (also called as isolated-critical) point, cf. [22, 24, 25, 37]], which is present on the diagram for fixed . This is schematically shown only in the inset of Fig. 1, where three first-order lines merge in the triple point located at . increases with and for the bicritical-end point goes to the DCO-DCO line. On the – diagrams the DCO region shrinks with increasing and simultaneously the re-entrant feature of the DCO-DCO line is destroyed for large . However, the evolution of the DCO-DCO boundary is nonmonotonous (these for can cross each other, approximately, in the range of , Fig. 1). For , the PS2 region is absent (the triple and the bicritical-end points do not exist) and only the PS1 state occurs on the diagram for (the PS1 region separates the DCO and the NO regions for all ).
The evolution of the PS2 region boundaries in the range is shown in Fig. 3. Increasing enlarges the PS2 region existing for with simultaneous change of boundary curvatures.
The above discussed behaviors are generic for all (or ). For the critical behaviors are similar to those discussed above, but the structure of phase diagrams exhibits two lobs of the DCO phase occurrence [36] and the maximal temperature for the DCO-DCO transition is located for corresponding to and (cf. also [22, 24, 25]).
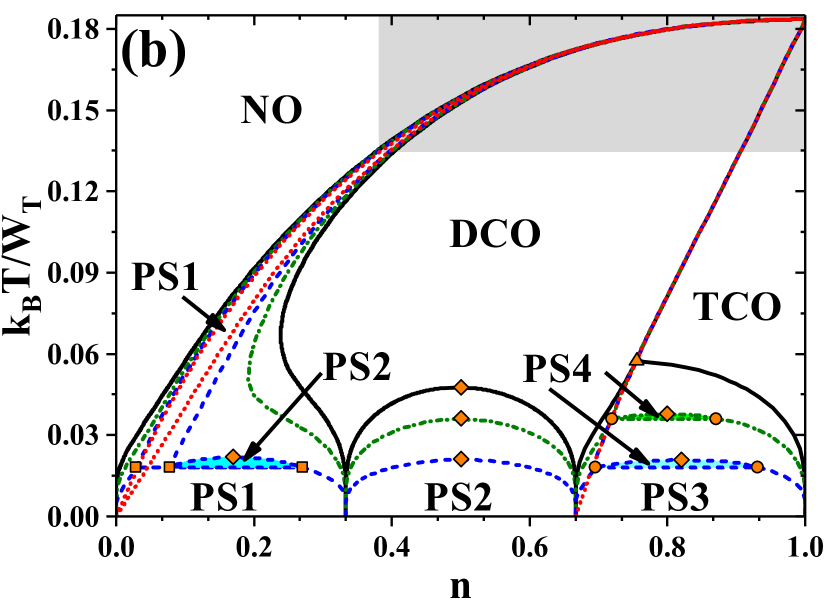
For and (), the TCO phase appears on the phase diagram (Fig. 4). For , the TCO phase is stable near half-filling (in a range of at ) and the TCO-DCO transition is continuous (second order) [36], cf. also Appendix A. For the following qualitative changes occur, which are shown in Fig. 4 for . The evolution of the DCO-NO boundary for fixed is the same as for the case discussed previously. With increasing (for ) the triple point appears [with the DCO-DCO boundary at , not shown in Fig. 4(a); cf., inset of Fig. 1] and the PS1 and PS2 states are present in define ranges of , whereas for only the PS1 state occurs (but now, at , the concentrations in domains of the PS1 state are and ). For smaller other discontinuous DCO-DCO boundary extending from exists [almost straight lines in Fig. 4(a)], which results in the PS2 state occurrence in range (this behavior is not present for ).
The attractive affects also on the DCO-TCO boundary. It changes its order for small and for the DCO-TCO transition is first order (for fixed ). For the PS3:DCO/TCO state, which is a coexistence of the DCO and the TCO phases, is stable (at in the range of ). For (where ) and , the PS4:TCO/TCO state appears in a narrow region [ Fig. 4(b)], which shrinks with increasing and vanishes continuously at . This behavior is connected with the occurrence of a first-order TCO-TCO transition at [not shown in Fig. 4(a)], which ends at a bicritical-end point [the discontinuous DCO-TCO, the continuous DCO-TCO, and discontinuous TCO-TCO lines merge at a critical-end point, schematically shown only in the inset of Fig. 4(a)]. Note that at the PS3-PS4 transition occurs for fixed , which is associated with the TCO-DCO transition in one domain. increases with and for the bicritical-end and the critical-end points merges into one critical point of higher order (cf. [37]). For , the discontinuous TCO-TCO line is no longer present on the diagram and a tricritical point appears, at which the DCO-TCO boundary changes its order. As a result, only the PS3 state occurs for separating the DCO and the TCO regions below the tricritical point. The discussed behavior is similar to those occurring at the boundaries between checker-board charge-ordered phase and the NO phase for for model (1) considered on the hypercubic lattices [24, 25]. Note also that for and one gets that and the TCO phase is no longer present on the diagram, which is the regime discussed at the beginning of this section (cf. Figs. 1–3). Thus, the tricritical point for the PS3 state exists for only in the range .
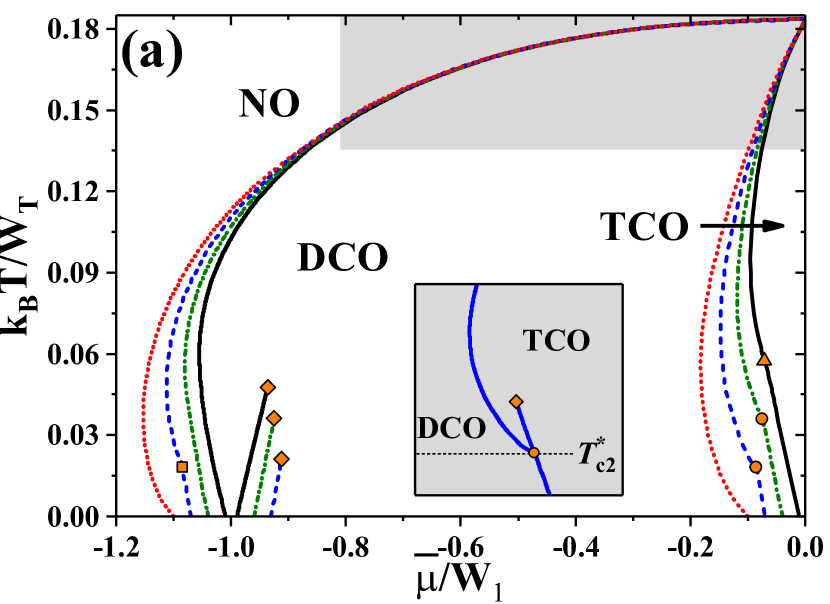
One should note that, for , the phase diagram at high temperatures near half-filling is different than that shown in Fig. 4 (these regions are schematically indicated by gray rectangles). For example, for , the maximum of the DCO-NO transition (for fixed ) is not located at half-filling, discontinuous DCO-DCO transitions appears at (that results in new regions of the PS1 and PS2 states stability for fixed ), the direct discontinuous TCO-NO transitions is present in define range of and [36]. The detailed analysis of these issues in the presence of is beyond the scope of this work. However, the main results for the evolution of the DCO-NO boundaries (with vanishing of the triple point at and associated PS1-PS2 transition) and of the TCO-DCO boundary (with a change of the critical-end point into the tricritical point at and associated PS3-PS4 transition) are still valid (cf. also [22, 24, 25]).
III Conclusions
In this work, the extended Hubbard model in the atomic limit [Eq. (1) with and ] on the triangular lattice was investigated. In particular, the effects of next-nearest-neighbor attraction were analyzed in detail. Increasing affects the boundaries by increasing discontinuity of at the transitions (for fixed ) and extends the regions of phase separation occurrence for fixed (at they are stable for any incommensurate fillings, i.e., , for and , for ). Two different critical values of exist, below which at the first-order transition between two phases of the same type occurs (and corresponding phase separated states for define ranges of concentrations are stable), namely: (i) for the DCO-NO line and emerging DCO-DCO line and the PS2 region at , (ii) for the TCO-DCO boundaries and emerging TCO-TCO line and the PS4 region at . For also the PS2 state is stable for some inside the range of (for and ).
Note that, in the limit, model (1) reduces to the well-known Ising model. In the general case, model (1) can be mapped onto the Blume–Capel model in the field with an effective temperature-dependent single-ion anisotropy [22, 32].
Decoupling (2) of the intersite terms is exact only in limit [42, 43]. Thus, it is an approximation for the triangular lattice in the general case. It overestimates the critical temperatures and stability regions of ordered phases and could not properly describe the purely two-dimensional system investigated, where Berezinskii–Kosterlitz–Thouless-like state exists [41]. However, it is rigorous theory at the ground state for the model considered. The longer-range interaction or small interactions between two-dimensional layers can stabilize long-range order [6, 44].
Hamiltonian (1) is a relatively simple toy model and it is oversimplified in many aspects for description of real materials. However, it can be treated as a benchmark for various approximate approaches for models with finite intersite hopping. One should underline here, that in the case of nonzero hopping, for (and any ) or and , various superconducting states could appear and the stability ranges of the charge-ordered phases might be reduced (cf., e.g., the results for hypercubic lattices [17, 45, 46, 47, 48, 49]). Moreover, an occurrence of the Moiré pattern (which is the triangular lattice with a very large supercell) in the twisted-bilayer graphene (associated with emergence of superconductivity) [50, 51] and hetero-bilayer transition metal dichalcogenides [52, 53] makes further studies of various models on the triangular lattice worthwhile. Also ultra-cold atomic gases on the triangular lattice created by laser trapping [54, 55, 56, 20] are systems, which could enable testing of some theoretical predictions of this work.
Acknowledgments
The author thanks R. Micnas for very useful discussions on some issues raised in this work. The support from the National Science Centre (Poland) under Grant SONATINA 1 no. UMO-2017/24/C/ST3/00276 is acknowledged. Founding in the frame of a scholarship of the Minister of Science and Higher Education (Poland) for outstanding young scientists (no. 821/STYP/14/2019) is also appreciated.
Declaration of competing interest
The authors declare that they have no known competing financial interests or personal relationships that could have appeared to influence the work reported in this paper. The funders had no role in the design of the study; in the collection, analyses, or interpretation of data; in the writing of the manuscript, or in the decision to publish the results.
CRediT authorship contribution statement
Konrad Jerzy Kapcia: Conceptualization, Methodology, Software, Validation, Formal analysis, Investigation, Resources, Data curation, Writing – original draft preparation, Writing – review & editing, Visualization, Supervision, Project administration, Funding acquisition.
Appendix A Equation for continuous boundaries
One defines , , and [cf. (6), ]. Introducing and in (5) one gets , , and , where . In the limit () equation takes the form of (by using de l’Hospital theorem), where . Thus, the equation determining continuous transition temperature (at which ) is
| (7) |
where , , , and [formally, the positive solution of (7) for can exist only for ]. The solutions of (7) with coincide with the second-order TCO-DCO lines presented in Fig. 4 (above critical points). The DCO-NO boundary also coincides with the solution of (7) with , but only at (for , they also agree at ). However, such determined for is two times smaller than corresponding temperature of continuous order–disorder transition for on hypercubic lattices () for the same , cf. [22, 36]. Other solutions of (7) (also those with ) correspond to transitions between metastable or unstable phases being solutions of (6) [57, 36].
References
- Houtappel [1950a] R. M. F. Houtappel, Statistics of two-dimensional hexagonal ferromagnetics with “Ising”-interaction between nearest neighbours only, Physica 16, 391 (1950a).
- Houtappel [1950b] R. M. F. Houtappel, Order-disorder in hexagonal lattices, Physica 16, 425 (1950b).
- Campbell and Schick [1972] C. E. Campbell and M. Schick, Triangular lattice gas, Phys. Rev. A 5, 1919 (1972).
- Kaburagi and Kanamori [1974] M. Kaburagi and J. Kanamori, Ordered structure of adatoms in the extended range lattice gas model, Japan. J. Appl. Phys. 13, Suppl. 2, 145 (1974).
- Metcalf [1974] B. D. Metcalf, Ground state spin orderings of the triangular Ising model with the nearest and next nearest neighbor interaction, Phys. Lett. A 46, 325 (1974).
- Mihura and Landau [1977] B. Mihura and D. P. Landau, New type of multicritical behavior in a triangular lattice gas model, Phys. Rev. Lett. 38, 977 (1977).
- Kaburagi and Kanamori [1978] M. Kaburagi and J. Kanamori, Ground state structure of triangular lattice gas model with up to 3rd neighbor interactions, J. Phys. Soc. Jpn. 44, 718 (1978).
- Caragiu and Finberg [2005] M. Caragiu and S. Finberg, Alkali metal adsorption on graphite: a review, J. Phys.: Condens. Matter 17, R995 (2005).
- Profeta et al. [2004] G. Profeta, L. Ottaviano, and A. Continenza, distortion on the surface, Phys. Rev. B 69, 241307 (2004).
- Rodríguez and Santana [2018] B. C. R. Rodríguez and J. A. Santana, Adsorption and diffusion of sulfur on the (111), (100), (110), and (211) surfaces of fcc metals: Density functional theory calculations, J. Chem. Phys. 149, 204701 (2018).
- Menkah et al. [2019] E. S. Menkah, N. Y. Dzade, R. Tia, E. Adei, and N. H. de Leeuw, Hydrazine adsorption on perfect and defective fcc nickel (100), (110) and (111) surfaces: a dispersion corrected DFT-D2 study, Appl. Sur. Sci. 480, 1014 (2019).
- Xing et al. [2021] H. Xing, P. Hu, S. Li, Y. Zuo, J. Han, X. Hua, K. Wang, F. Yang, P. Feng, and T. Chang, Adsorption and diffusion of oxygen on metal surfaces studied by first-principle study: a review, Journal of Materials Science and Technology 62, 180 (2021).
- Bretz and Dash [1971] M. Bretz and J. G. Dash, Ordering transitions in helium monolayers, Phys. Rev. Lett. 27, 647 (1971).
- Bretz et al. [1973] M. Bretz, J. G. Dash, D. C. Hickernell, E. O. McLean, and O. E. Vilches, Phases of and monolayer films adsorbed on basal-plane oriented graphite, Phys. Rev. A 8, 1589 (1973).
- Aziz et al. [1989] R. A. Aziz, U. Buck, H. Jónsson, J. Ruiz-Suárez, B. Schmidt, G. Scoles, M. J. Slaman, and J. Xu, Two- and three-body forces in the interaction of He atoms with Xe overlayers adsorbed on (0001) graphite, J. Chem. Phys. 91, 6477 (1989).
- Litak and Wysokiński [2017] G. Litak and K. I. Wysokiński, Evolution of the Charge Density Wave Order on the Two-Dimensional Hexagonal Lattice, J. Magn. Magn. Mater. 440, 104 (2017).
- Micnas et al. [1990] R. Micnas, J. Ranninger, and S. Robaszkiewicz, Superconductivity in narrow-band systems with local nonretarded attractive interactions, Rev. Mod. Phys. 62, 113 (1990).
- Georges et al. [1996] A. Georges, G. Kotliar, W. Krauth, and M. J. Rozenberg, Dynamical mean-field theory of strongly correlated fermion systems and the limit of infinite dimensions, Rev. Mod. Phys. 68, 13 (1996).
- Imada et al. [1998] M. Imada, A. Fujimori, and Y. Tokura, Metal-insulator transitions, Rev. Mod. Phys. 70, 1039 (1998).
- Dutta et al. [2015] O. Dutta, M. Gajda, P. Hauke, M. Lewenstein, D.-S. Lühmann, B. A. Malomed, T. Sowiński, and J. Zakrzewski, Non-standard hubbard models in optical lattices: a review, Rep. Prog. Phys. 78, 066001 (2015).
- Bari [1971] R. A. Bari, Effects of short-range interactions on electron-charge ordering and lattice distortions in the localized state, Phys. Rev. B 3, 2662 (1971).
- Micnas et al. [1984] R. Micnas, S. Robaszkiewicz, and K. A. Chao, Multicritical behavior of the extended Hubbard model in the zero-bandwidth limit, Phys. Rev. B 29, 2784 (1984).
- Bursill and Thompson [1993] R. J. Bursill and C. J. Thompson, Variational bounds for lattice fermion models II. Extended Hubbard model in the atomic limit, J. Phys. A: Math. Gen. 26, 4497 (1993).
- Kapcia and Robaszkiewicz [2011] K. Kapcia and S. Robaszkiewicz, The effects of the next-nearest-neighbour density-density interaction in the atomic limit of the extended Hubbard model, J. Phys.: Condens. Matter 23, 105601 (2011).
- Kapcia and Robaszkiewicz [2016] K. J. Kapcia and S. Robaszkiewicz, On the phase diagram of the extended Hubbard model with intersite density-density interactions in the atomic limit, Physica A 461, 487 (2016).
- Kapcia et al. [2017a] K. J. Kapcia, J. Barański, S. Robaszkiewicz, and A. Ptok, Various charge-ordered states in the extended Hubbard model with on-site attraction in the zero-bandwidth limit, J. Supercond. Nov. Magn. 30, 109 (2017a).
- Kapcia et al. [2017b] K. J. Kapcia, J. Barański, and A. Ptok, Diversity of charge orderings in correlated systems, Phys. Rev. E 96, 042104 (2017b).
- Mancini and Mancini [2008] F. Mancini and F. P. Mancini, One-dimensional extended Hubbard model in the atomic limit, Phys. Rev. E 77, 061120 (2008).
- Mancini et al. [2013] F. Mancini, E. Plekhanov, and G. Sica, Exact solution of the 1D Hubbard model with NN and NNN interactions in the narrow-band limit, Eur. Phys. J. B 86, 408 (2013).
- Borgs et al. [1996] C. Borgs, J. Jedrzejewski, and R. Koteckỳ, The staggered charge-order phase of the extended Hubbard model in the atomic limit, J. Phys. A: Math. Gen. 29, 733 (1996).
- Lee et al. [2001] S. J. Lee, J.-R. Lee, and B. Kim, Patterns of striped order in the classical lattice coulomb gas, Phys. Rev. Lett. 88, 025701 (2001).
- Pawłowski [2006] G. Pawłowski, Charge orderings in the atomic limit of the extended Hubbard model, Eur. Phys. J. B 53, 471 (2006).
- Ganzenmüller and Pawłowski [2008] G. Ganzenmüller and G. Pawłowski, Flat histogram Monte Carlo sampling for mechanical variables and conjugate thermodynamic fields with example applications to strongly correlated electronic systems, Phys. Rev. E 78, 036703 (2008).
- Rademaker et al. [2013] L. Rademaker, Y. Pramudya, J. Zaanen, and V. Dobrosavljević, Influence of long-range interactions on charge ordering phenomena on a square lattice, Phys. Rev. E 88, 032121 (2013).
- Kapcia [2019] K. J. Kapcia, Charge order of strongly bounded electron pairs on the triangular lattice: the zero-bandwidth limit of the extended Hubbard model with strong onsite attraction, J. Supercond. Nov. Magn. 32, 2751 (2019).
- Kapcia [2021] K. J. Kapcia, Charge-order on the triangular lattice: A mean-field study for the lattice S = 1/2 fermionic gas, Nanomaterials 11, 1181 (2021).
- Kincaid and Cohen [1975] J. M. Kincaid and E. G. D. Cohen, Phase diagrams of liquid helium mixtures and metamagnets: Experiment and mean field theory, Phys. Rep. 22, 57 (1975).
- Arrigoni and Strinati [1991] E. Arrigoni and G. C. Strinati, Doping-induced incommensurate antiferromagnetism in a Mott-Hubbard insulator, Phys. Rev. B 44, 7455 (1991).
- Bąk [2004] M. Bąk, Mixed phase and bound states in the phase diagram of the extended Hubbard model, Acta Phys. Pol. A 106, 637 (2004).
- Kagan et al. [2021] M. Y. Kagan, K. I. Kugel, and A. L. Rakhmanov, Electronic phase separation: Recent progress in the old problem, Phys. Rep. 916, 1 (2021).
- Kaneko et al. [2018] R. Kaneko, Y. Nonomura, and M. Kohno, Thermal algebraic-decay charge liquid driven by competing short-range Coulomb repulsion, Phys. Rev. B 97, 205125 (2018).
- Müller-Hartmann [1989] E. Müller-Hartmann, Correlated fermions on a lattice in high dimensions, Z. Physik B: Condens. Matter 74, 507 (1989).
- Pearce and Thompson [1978] P. A. Pearce and C. J. Thompson, The high density limit for lattice spin models, Commun. Math. Phys. 58, 131 (1978).
- Pearce and Thompson [1975] P. A. Pearce and C. J. Thompson, The anisotropic Heisenberg model in the long-range interaction limit, Commun. Math. Phys. 41, 191 (1975).
- Robaszkiewicz et al. [1981] S. Robaszkiewicz, R. Micnas, and K. A. Chao, Hartree theory for the negative- extended Hubbard model: Ground state, Phys. Rev. B 24, 4018 (1981).
- Robaszkiewicz et al. [1982] S. Robaszkiewicz, R. Micnas, and K. A. Chao, Hartree theory for the negative- extended Hubbard model. II. Finite temperature, Phys. Rev. B 26, 3915 (1982).
- Oleś et al. [1984] A. M. Oleś, R. Micnas, S. Robaszkiewicz, and K. A. Chao, Ground state of the half-filled extended Hubbard model beyond the Hartree-Fock approximation, Phys. Lett. A 102, 323 (1984).
- Micnas et al. [1988a] R. Micnas, J. Ranninger, and S. Robaszkiewicz, An extended Hubbard model with inter-site attraction in two dimensions and high- superconductivity, J. Phys. C: Solid State Phys. 21, L145 (1988a).
- Micnas et al. [1988b] R. Micnas, J. Ranninger, S. Robaszkiewicz, and S. Tabor, Superconductivity in a narrow-band system with intersite electron pairing in two dimensions: A mean-field study, Phys. Rev. B 37, 9410 (1988b).
- Cao et al. [2018] Y. Cao, V. Fatemi, S. Fang, K. Watanabe, T. Taniguchi, E. Kaxiras, and P. Jarillo-Herrero, Unconventional superconductivity in magic-angle graphene superlattices, Nature 556, 43 (2018).
- Yankowitz et al. [2019] M. Yankowitz, S. Chen, H. Polshyn, Y. Zhang, K. Watanabe, T. Taniguchi, D. Graf, A. F. Young, and C. R. Dean, Tuning superconductivity in twisted bilayer graphene, Science 363, 1059 (2019).
- Wang et al. [2018] G. Wang, A. Chernikov, M. M. Glazov, T. F. Heinz, X. Marie, T. Amand, and B. Urbaszek, Colloquium: Excitons in atomically thin transition metal dichalcogenides, Rev. Mod. Phys. 90, 021001 (2018).
- Xu et al. [2020] Y. Xu, S. Liu, D. A. Rhodes, K. Watanabe, T. Taniguchi, J. Hone, V. Elser, K. F. Mak, and J. Shan, Correlated insulating states at fractional fillings of Moiré superlattices, Nature 587, 214 (2020).
- Becker et al. [2010] C. Becker, P. Soltan-Panahi, J. Kronjäger, S. Dörscher, K. Bongs, and K. Sengstock, Ultracold quantum gases in triangular optical lattices, New J. Phys. 12, 065025 (2010).
- Struck et al. [2011] J. Struck, C. Ölschläger, R. Le Targat, P. Soltan-Panahi, A. Eckardt, M. Lewenstein, P. Windpassinger, and K. Sengstock, Quantum simulation of frustrated classical magnetism in triangular optical lattices, Science 333, 996 (2011).
- Georgescu et al. [2014] I. M. Georgescu, S. Ashhab, and F. Nori, Quantum simulation, Rev. Mod. Phys. 86, 153 (2014).
- Kapcia and Robaszkiewicz [2012] K. Kapcia and S. Robaszkiewicz, Stable and metastable phases in the atomic limit of the extended Hubbard model with intersite density-density interactions, Acta. Phys. Pol. A. 121, 1029 (2012).