Creep effects on the Campbell response in type II superconductors
Abstract
Applying the strong pinning formalism to the mixed state of a type II superconductor, we study the effect of thermal fluctuations (or creep) on the penetration of an ac magnetic field as quantified by the so-called Campbell length . Within strong pinning theory, vortices get pinned by individual defects, with the jumps in the pinning energy () and force () between bistable pinned and free states quantifying the pinning process. We find that the evolution of the Campbell length as a function of time is the result of two competing effects, the change in the force jumps and a change in the trapping area of vortices; the latter describes the area around the defect where a nearby vortex gets and remains trapped. Contrary to naive expectation, we find that during the decay of the critical state in a zero-field cooled (ZFC) experiment, the Campbell length is usually nonmonotonic, first decreasing with time and then increasing for long waiting times. Field cooled (FC) experiments exhibit hysteretic effects in ; relaxation then turns out to be predominantly monotonic, but its magnitude and direction depends on the specific phase of the cooling–heating cycle. Furthermore, when approaching equilibrium, the Campbell length relaxes to a finite value, different from the persistent current which vanishes at long waiting times , e.g., above the irreversibility line. Finally, measuring the Campbell length for different states, zero-field cooled, field cooled, and relaxed, as a function of different waiting times and temperatures , allows to ‘spectroscopyse’ the pinning potential of the defects.
I Introduction
The phenomenological properties of type II superconductors subject to a magnetic field are determined by vortices, linear topological defects that guide the field through the material in terms of quantized fluxes Abrikosov (1957) . The interaction of these flux tubes with material defects has a decisive impact on the material’s properties, as it determines the amount of current density that the superconductor can transport free of dissipation. This phenomenon, known under the name of vortex pinning Campbell and Evetts (1972), has been studied extensively, both in theory and experiment, as one important facet of vortex matter physics Tinkham (2004); De Gennes (1999). Traditional tools to characterize vortex pinning are measurements of critical current densities and full current–voltage (–) characteristics Campbell and Evetts (1972), as well as the penetration of a small ac magnetic test-field that is quantified through the so-called Campbell penetration length Campbell (1969) . In characterizing the pinning properties of the material’s mixed state, the Campbell length assumes a similar role as the skin depth (determining the resistivity in the normal state) or the London penetration depth (determining the superfluid density in zero magnetic field). Although well established as an experimental tool, a quantitative calculation on the basis of strong pinning theory Labusch (1969); Larkin and Ovchinnikov (1979); Blatter et al. (2004) of the ac Campbell response has been given only recently Willa et al. (2015a). In this paper, we extend this ‘microscopic’ description of the Campbell penetration to include effects of thermal fluctuations, i.e., creep.
The penetration of an ac magnetic field into the mixed state of a superconductor has been first analyzed by Campbell Campbell (1969), see also Refs. Lowell, 1972 and Campbell, 1978. This phenomenological theory relates the Campbell length to the curvature of the pinning potential that is probed by small-amplitude oscillations of the vortices. Applying strong pinning theory to this problem provides a lot of insights on the pinning landscape: Within the strong pinning paradigm, vortices exhibit bistable configurations in the presence of a defect. These bistable configurations describe pinned and unpinned (meta-)stable states, see Fig. 1, with a finite pinning force density resulting from an asymmetric occupation of the corresponding branches. While the critical current density is determined by the jumps in energy between pinned and unpinned states at (de)pinning Labusch (1969); Larkin and Ovchinnikov (1979); Blatter et al. (2004), it turns out Willa et al. (2015a, 2016) that the Campbell length is given by the jumps in the pinning force . Interestingly, the relevant jumps determining depend on the vortex state, e.g., the critical (or zero-field cooled, ZFC) state first defined by Bean Bean (1962) or the field cooled (FC) state. Even more, the pinned vortex state depends on the time-trace of its experimental implementation, that leads to hysteretic effects in as shown in Refs. Willa et al., 2015a, 2016 both theoretically and experimentally.
When including thermal fluctuations in the calculation of the pinning force density , different jumps in the pinning energy become relevant that depend on the time evolution of the vortex state due to creep. While this relaxational time dependence leads to the decay of the persistent current density , the corresponding velocity dependence leads to a rounding Buchacek et al. (2018, 2019a) of the transition Thomann et al. (2012) between pinned and dissipative states in the current–voltage characteristic; again the quantitative nature of the strong pinning description allows for a detailed comparison of the temperature-shifted and rounded excess-current characteristic predicted by theory with experimental data on superconducting films Buchacek et al. (2019b).
In the present paper, we determine the Campbell length including the effect of thermal fluctuations. We determine the relevant jumps in the pinning force which depend on the time during which the original, e.g., critical, state has relaxed due to creep. For this ZFC situation, we find that the evolution of the Campbell length is the result of two competing effects, the change in the force jumps and, furthermore, an increase in the trapping area of vortices; the latter describes the area around the defect where a nearby vortex gets and remains trapped, see Fig. 1. Contrary to expectation, we find that for intermediate and very strong pinning, the Campbell length first decreases with time and then starts increasing for long waiting times; at marginally strong pinning, we find decreasing.
Relaxation also appears for the case of field cooled states, as these drop out of equilibrium upon changing temperature and relax when the cooling or heating process is interrupted. In a FC experiment, the Campbell penetration exhibits hysteretic phenomena in a cooling–heating cycle. The relaxation of the Campbell length then depends on the type of pinning and the location within the hysteresis loop. At intermediate and large pinning, we find three different phases, one where monotonously decreases with time, one where it monotonously increases towards equilibrium, and a third phase where relaxation is slow due to large creep barriers; at marginally strong pinning, we find mainly decreasing in time. Several of these findings have been observed in experiments Prozorov et al. (2003); Pasquini and Bekeris (2005) and we will discuss them below. We conclude that measuring the Campbell length for different states, ZFC, FC, and relaxed as a function of different waiting times , provides insights into the pinning mechanism and gives access to the jumps at different locations of the pinning curve, see Fig. 3(c); such measurements and analysis then allow to ‘spectroscopyse’ the pinning potential of defects.
In the following, we first recapitulate relevant aspects of the strong pinning theory and of creep (Secs. II and III that focuses on transport) and then proceed with the calculation of the Campbell penetration depth in the presence of thermal fluctuations, see Sec. IV. We first focus on the critical (or zero-field cooled, ZFC) state in Secs. IV.1 and IV.2 and then extend the analysis to the case of field cooling (FC) in Secs. IV.3 and IV.4. Section V summarizes and concludes our work.
II Strong pinning theory
A complete derivation of strong pinning theory starting from an elastic description of the vortex lattice (we assume a lattice directed along with a lattice constant determined by the induction ) that is interacting with a random assembly of defects of density has been given in several papers; here, we make use of the discussion and notation in Refs. Blatter et al., 2004; Thomann et al., 2017; Willa et al., 2016; Buchacek et al., 2019a, see also Refs. Kwok et al., 2016; Willa et al., 2018a, b for numerical work on strong pinning. It turns out, that in the low density limit , where denotes the coherence length and is the Labusch parameter, see Eq. (4) below, this complex many-body problem can be reduced to an effective single-vortex–single-pin problem. The latter involves an individual flux line with an effective elasticity that accounts for the presence of other vortices. Here, is the vortex line energy, denotes the London penetration depth, is the anisotropy parameter for a uniaxial material Blatter et al. (1994), and is a numerical, see Refs. Kwok et al., 2016; Willa et al., 2018b; the result derives from the elastic Green’s function of the vortex lattice, see Ref. Blatter et al., 1994, involving shear () and dispersive tilt ( and assuming a field that is aligned with the material’s axis. Second, the problem involves the pinning potential of individual defects; for a point-like defect, is determined by the form of the vortex core with taking a Lorentzian shape and denoting the in-plane coordinate. Below, we will consider a potential of general form whenever possible and focus on Lorentzian-shaped defect potentials in order to arrive at numerically accurate results; results for non-Lorentzian shaped potentials remain qualitatively the same.
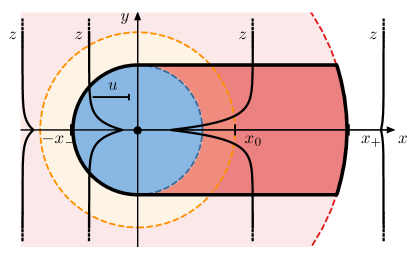
The generic setup involves a vortex line driven along with asymptotic position that impacts on the defect located, say, at the origin. The simplest geometry is that of a head-on collision with and increasing for an impact from the left; given the rotational symmetry of the defect potential , the geometry for the collision at a finite impact parameter , follows straightforwardly. Assuming a head-on collision to begin with, the geometry simplifies considerably and involves the asymptotic vortex position and the deformation of the vortex, see Fig. 1; it turns out, that the problem is fully characterized by its value at the pin, with the vortex line smoothly joining the tip position at with the asymptotic position at , see Fig. 1. The detailed shape of the vortex line then follows from a simple integration Blatter et al. (2004); Willa et al. (2016). The cusp at is a measure of the pinning strength.
The energy (or Hamiltonian) of this setup involves elastic and pinning energies and is given by
| (1) |
Minimizing this energy with respect to at fixed asymptotic position , we find the vortex tip position by solving the nonlinear problem
| (2) |
see Fig. 2 for a graphical solution of this self-consistency problem. This (microscopic) force-balance equation develops multiple solutions when the pin is sufficiently strong, as quantified by the conditions
| (3) |
for the appearance of a local maximum in , see Fig. 3(b). The condition (3) defines the Labusch parameter
| (4) |
(with providing the maximal force derivative at ) that determines the Labusch criterion
| (5) |
for strong pinning. Defining the force scale and estimating the force derivative or curvature produces a Labusch parameter , hence, strong pinning is realized for either large pinning energy or small effective elasticity . For the Lorentzian potential, we obtain a maximal force derivative at and hence .
Within the (symmetric) bistable regions and opening up at , the force-balance equation Eq. (2) exhibits multiple solutions corresponding to free (, elasticity dominated) and pinned (, pinning dominated) solutions, see Fig. 2, as well as an unstable solution that sets the barrier for creep, see below.
A vortex approaching the defect from the left gets trapped by the pin at and is dragged towards the pinning center. Upon leaving the defect, the vortex gets strongly deformed, see Fig. 1 and depins at . Inserting the solutions , , and of Eq. (2) back into Eq. (1), we obtain the pinning energy landscape
| (6) |
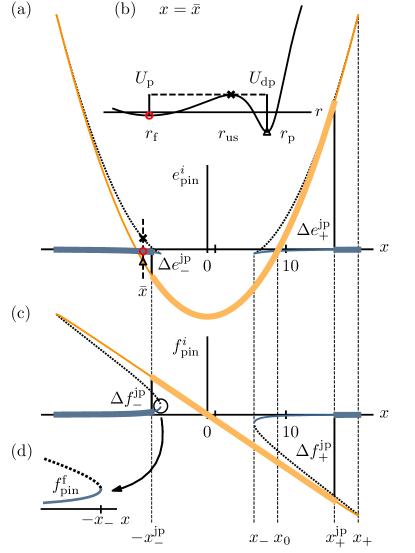
with its multiple branches shown in Fig. 3(a). The same way, we find the pinning force acting on the vortex tip; inserting the different solutions , , and , we obtain the pinning force with its multiple branches as shown in Fig. 3(c). Note that the pinning force can be written as the total derivative of the energy ,
| (7) |
where we have used the force-balance equation (2) to arrive at the last relation.
The energy and force experienced by the vortex are shown in Fig. 3. Due to the presence of multiple branches, we see that a right-moving vortex undergoes jumps in energy and force at the edges and of the bistable intervals (for a left moving vortex, corresponding jumps appear at and ). These jumps are the hallmark of strong pinning and determine physical quantities such as the critical current density or the Campbell penetration depth . In the following, we evaluate the characteristic quantities defining the pinning landscape of Fig. 3 in the limits of very strong () and marginal () pinning.
II.0.1 Bistable interval and extremal tip positions
The extent of the bistable interval is easily found in the very strong pinning limit with : With reference to Fig. 2, we approximate and drop against in (2) to find
| (8) |
The lower boundary is conveniently obtained from the condition . For large , we have residing in the tail of the pinning potential; assuming a defect potential decaying as , we obtain
| (9) |
Inserting this result back into Eq. (2), we find that
| (10) |
For a Lorentzian potential, we have and and hence
| (11) |
The lower boundary relates to via and with , we obtain
| (12) |
The marginally strong pinning case can be quantitatively described via an expansion of the pinning force around the inflection point defined through and using the Labusch parameter in the form ,
| (13) |
We use as our small parameter and set otherwise (however, beware of additional corrections in through ). For a Lorentzian potential, the shape parameter assumes the value . The cubic expansion (13) is antisymmetric about the inflection point , thus producing symmetric results for pinning and depinning.
The tip locations
| (14) |
at (de)pinning are defined by the conditions , see Fig. 2; making use of the expansion (13), we find
| (15) |
Inserting this result into the force-balance equation (2) and using (13), we find the boundaries
| (16) |
of the bistable region with
| (17) |
The pair and of asymptotic and tip positions depends on the details of the potential; while derives solely from the shape and thus does not depend on the elasticity , as given by (2) involves and shifts . For a Lorentzian potential, we have
| (18) |
and
| (19) | |||||
Besides the tip positions and at (de)pinning, we also need the tip positions and that are not associated with a special point on the free and pinned branches. They are obtained by solving the force-balance equation (2) at using the expansion (13) with the ansatz and ; the resulting equation for ,
| (20) |
is solved by ( the result (15) obtained before) and , hence
| (21) |
with given in (15).
II.0.2 Branch crossing point
At very strong pinning, the bistable region is arranged asymmetrically around the branch crossing point , see Fig. 3; we find the latter by equating the pinning energies (1) for the free and pinned branches: with at large , we have the free and pinned vortex tip positions
| (22) |
as follows from the force-balance equation (dropping the force term ) and Fig. 2. With and , we find that
| (23) |
For the Lorentzian potential, we find .
When strong pinning is marginal, , the branch crossing point coincides with . Its location depends on the detailed shape of the potential; for a Lorentzian, we have (see Eq. (18))
| (24) |
II.0.3 Activation barrier
Finally, we briefly discuss the barriers for thermal activation between bistable branches, specifically, the barrier scale at the branch crossing point. The latter is given by
| (25) |
and therefore depends on the unstable and pinned/free tip position at . At large , the vortex free and pinned vortex tip positions are given in (22). We find the unstable solution by using the asymptotic decay and dropping the term against in the force-balance equation (2), with the result that
| (26) |
for a Lorentzian potential, ; indeed, the ratio is parametrically small at large . The barrier scale then evaluates to
| (27) |
with small corrections .
In the marginally strong pinning case, we find the tip positions by solving the force-balance equation (2) with the expansion (13) at , with the three solutions , providing the unstable solution , and the free and pinned meta-stable solutions arranged symmetrically with ,
| (28) |
Making use of these results in the definition (II.0.3) for and expanding to fourth order in , we find that
| (29) |
where the last equation applies to the Lorentzian shaped potential. In deriving (29), we have used the expansion (13) as well as the force balance equation (2) to convert the elastic energy to a pinning energy .
III Transport
One of the central features of superconductivity is dissipation-free transport. We briefly discuss the results of strong pinning theory for critical current densities and the effect of thermal fluctuations resulting in a slowly decaying ‘persistent’ current.
The transport properties of a type II superconducting material is determined by the vortex dynamics as described by the (macroscopic) force-balance equation
| (30) |
a non-linear equation for the mean vortex velocity , with the Bardeen-Stephen viscosity Bardeen and Stephen (1965) (per unit volume; is the normal state resistivity) and the Lorentz force. The pinning force density is directed along ; it depends on the velocity , that turns finite beyond the critical force density , and on the temperature driving thermal fluctuations, i.e., creep—we will discuss these effects shortly.
The pinning force density is given by the sum over all force contributions ; assuming a uniform distribution of defects, we have to take the average with the appropriate branch occupation of vortices. For a vortex approaching the defect head-on along , the free branch terminates at and the vortex jumps to the pinned branch, gaining the energy (denoted as in Fig. 3). Moving forward, the vortex remains pinned until the branch ends at , where the jump to the free branch involves the energy (denoted as in Fig. 3). The critical pinned-branch occupation for head-on trajectories then is , while for a finite impact factor , the branch occupation coincides with characteristic function of the trapping area shown in Fig. 1. The critical branch occupation is maximally asymmetric, what produces the largest possible pinning force. Other branch occupations produce different pinning forces, e.g., the radially symmetric equilibrium occupation , with the branch cutting point shown in Fig. 3, leads to a vanishing pinning force.
Averaging the pinning force over and with the vortex population described by the critical branch occupation , we obtain the critical pinning force density (we exploit the anti-symmetry of )
| (31) |
with the energy difference and the unit vector along ; the -component of the pinning force density vanishes due to the antisymmetry in . Following convention, we have included a minus sign in the definition of . The branch-occupation restricts the integral to the trapping area shown in Fig. 1; the integration over brings forward the constant energy jumps at the two semi-circular boundaries, hence
| (32) |
where we have defined the transverse trapping length . The result (III) for the pinning force density shows that all vortices hitting the left-side semi-circle of diameter get pinned, see Fig. 1, and contribute equally to the pinning force density, a consequence of the rotationally symmetric pinning potential . We confirm that the multi-valued energy landscape in Fig. 3 is central for obtaining a finite pinning force density ; for jumps are absent and the integral over the corresponding smooth periodic function in Eq. (III) vanishes. This is the realm of weak pinning with a mechanism that is collective, resulting in a density scaling Blatter et al. (2004) .
III.1 Critical current density
We obtain the critical current density from the force balance (30) by setting and choosing the maximal pinning force density associated with the most asymmetric branch occupation ,
| (33) |
with the sum of (positive) jumps in the pinning energy and . Note that strong pinning does not necessarily imply a large critical current density , as our approximation of independent pins requires a small density .
III.2 Creep effects on transport: persistent current
Starting with a non-equilibrium initial state at time , thermal fluctuations (or creep) drive the system towards equilibrium. To fix ideas, we start from a critical or ZFC state (and a head-on collision) characterized by the critical pinned-branch occupation and let it decay through creep; the extension of the result to the 2D situation is straightforward. The presence of thermal fluctuations then increases the probabilities for pinning near and depinning near , that leads to a reduction of the pinning force density . We account for such thermal hops of vortices into and out of the pin through proper calculation of the thermal pinned-branch occupation probability via solution of the rate equation Brazovskii and Larkin (1999); Brazovskii and Nattermann (2004); Buchacek et al. (2019a) (we set the Boltzmann constant to unity, )
| (34) |
where
| (35) | |||||
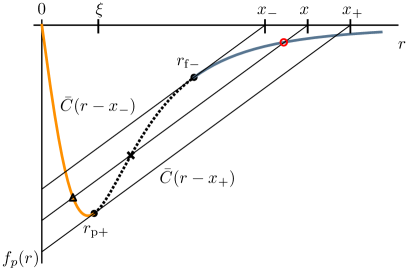
denote the barriers for pinning and depinning (cf. Eq. (6)) and , are the corresponding attempt frequencies. It follows from Fig. 3(a) that the barriers and for pinning and depinning vanish, implying that modifications of the pinned-branch occupation probability are largest near and where we can simplify the rate equation (34) by dropping one of the terms. One finds Buchacek et al. (2019a), that after a finite waiting time , thermal fluctuations produce a shift in the jump positions for pinning and depinning (and a small rounding of the steps in that we can ignore): the jump from the free to the pinned branch appears earlier at and so does the location of depinning, , with the solution of the rate equation (34) well approximated by the step function .
The renormalized jump positions and are determined by the relations Buchacek et al. (2019a)
| (36) |
with the diffusion time ( is the sample dimension) and to be determined self-consistently Buchacek et al. (2019a) from . Equation (36) tells us, that thermal fluctuations driven by the temperature can overcome (de)pinning barriers of size after a waiting time . As a result, waiting a time at temperature , the pinned-branch occupation probability changes from to at all positions within the intervall and drops from to for , thereby reducing the asymmetry of the critical occupation probability .
The waiting time then determines the shape of the pinned-branch occupation probability : at short times, thermal relaxation is weak and remains close to . On the other hand, for finite and long waiting times , with the barrier at the branch cutting point , see Fig. 3, relaxation is strong and approaches the symmetric equilibrium occupation . Going to very long times beyond , both of the terms in (34) accounting for pinning and depinning hops near become equally important in establishing the precise equilibrium shape of the pinned-branch occupation probability.
Generalizing from the head-on collision to a finite-impact geometry is straightforward; evaluating the pinning force density Eq. (III) with replaced by , we obtain the result
| (37) |
that depends on the temperature and the waiting time . The premature pinning and depinning processes at and modify the trapping length and reduce the (sum of) jumps in the pinning energy, . For times , the pinning force density (37) takes the analytical form Buchacek et al. (2019a)
| (38) |
with the dimensionless creep parameter
| (39) |
The exponent derives from the vanishing of barriers on approaching the boundaries of the bistable region, , with the value universal for a smooth pinning potential ; higher-order terms relevant away from the edges produce the corrections in (38). The coefficient subsumes all dependencies on the Labusch parameter and has been calculated in Ref. Buchacek et al., 2019a; it involves the competing effects of an increasing trapping length and a decreasing jump in the total pinning energy . As the latter is the dominating one for not too strong pinning parameters below , the pinning force density usually decreases under the influence of creep. The relative importance of these two effects will be modified in the analysis of the Campbell penetration depth below, where the role of is replaced by .
Inserting the result (38) back into the force-balance equation (30), we immediately obtain the persistent current density: in a typical relaxation experiment (i.e., after a short initial waiting time), we can neglect the dissipative term in Eq. (30) and we arrive at the persistent current density in the form
| (40) |
The result (40) is valid for times . For large times beyond , we go over to the TAFF region (thermally assisted flux flow Kes et al. (1989)) where the creep dynamics governed by the slow behavior turns into a diffusive vortex motion (and thus ohmic response). The vortex front at then moves into the sample following the diffusion law with the diffusion constant Blatter et al. (1994) and . The current decays algebraically, until the sample (of size ) is fully penetrated at . Thereafter, the remaining persistent current decays exponentially, .
The above scenario applies to the strong pinning paradigm where barriers saturate in the limit of vanishing currents, . In reality, correlations between different pinning centers are expected to become relevant at very small drives , implying growing barriers and glassy response instead.
Below, we will study the influence of creep on the linear response under a small external ac magnetic field, that is, again a typical relaxation experiment involving the waiting time determining the evolution of the vortex state. It will be interesting to see that creep affects the persistent current and the ac penetration depth very differently, with vanishing at long times while remains finite.
IV ac linear response
Probing the superconductor with a small ac field on top of the (large) dc external field provides us with valuable information on the pinning landscape. Rather than telling about the jumps in the energy landscape when measuring , the Campbell penetration depth informs us about the force landscape, specifically, the jumps , see Fig. 3.
Solving the force-balance equation (30) for the displacement field (we denote coarse grained quantities averaging over many vortices with capital letters, see Ref. Willa et al., 2015b) assuming a phenomenological Ansatz Campbell (1978) for the pinning force density , one finds that the ac field penetrates the superconductor over a distance given by . At the low frequencies typical of such penetration experiments, we can drop the dissipative contribution and obtain the phenomenological result
| (41) |
due to Campbell Campbell (1978). In the following, we discuss the Campbell penetration physics within the strong pinning paradigm, first for the zero-field cooled (ZFC) or critical state and subsequently for the field cooled (FC) situation, including also hysteretic effects appearing upon cycling the temperature up and down in the experiment.
IV.1 Campbell penetration depth in ZFC state
Within our quantitative strong pinning theory, the action of the ac field on the zero-field cooled state is to reshuffle vortices at the boundaries and , producing a restoring force density proportional to the displacement of the vortices. We compute the change in the pinning force density by subtracting from (III) the expression with the displaced branch occupation ,
| (42) |
With directed along , the scalar product in the last line of (IV.1) is non-vanishing only along the circular sections of the trapping area in Fig. 1; furthermore, the gradient is strongly peaked (with unit weight) on the circular boundaries and directed parallel to , the radial unit vector. The scalar product then evaluates to
| (43) |
with the polar angle restricted to angles on the left circular segment of the trapping boundary and with on the right one. Inserting the expression (43) into (IV.1) and writing (with the modulus of ) directed along the radial coordinate, the change in the pinning force density can be evaluated as
| (44) | ||||
with the effective angle . The expression (44) is originally calculated for a left-shift of the vortex critical state; after a short initialization period Willa et al. (2015b), the same result applies for positive displacements as well, and with , not to be confused with the barrier at the branch-cutting point .
In the large limit, , see Eqs. (11) and (12), and the curvature in the boundary of the trapping region at becomes negligible, see Fig. 1. We can then approximate , and the strong pinning expression for the effective curvature in the ZFC state reads
| (45) |
with the force jumps and , where we have returned to the original notation for the two jumps at and for convenience (i.e., the difference is equal to the modulus in Eq. (44)). The factor in the numerator of (45) has its origin in the different geometries of the circular boundaries at and at .
In the opposite limit of marginally strong pinning with , and the trapping region acquires an approximately circular geometry. The angle can be expanded as , with , allowing to approximate the effective angle as
| (46) |
The bistable region is symmetric around , see Eq. (16), and we have as well as , that produces the following simple expression for the Campbell curvature
| (47) |
where we have again returned to the original notation for the jump at , . The above results differ from those in Ref. Willa et al., 2016 in the more accurate handling of the geometry in the trapping boundary, leading to the appearance of and factors .
The derivation (44) applies to the critical state—the corresponding result for other vortex states is obtained by the proper replacement . E.g., for the equilibrium distribution with a radially symmetric jump at , the result reads
| (48) |
Note that, at , the jump at is larger (by a factor ) than the jumps at or at .
Physically, the expressions describe the average curvature in the pinning landscape that, upon integration, is given by the sum of jumps in the pinning force . This should be compared with the average pinning force in Eq. (III) that provides the critical force density and is given by the sum of jumps in the pinning energy . Furthermore, the results for the Campbell curvature involve the precise geometry of the trapping area with its circular boundaries, while the pinning force density (III) depends only on the total width . The above interpretation of in terms of the average curvature naturally relates the strong pinning result to the phenomenological derivation of by Campbell Campbell (1978). Finally, we obtain the microscopic expression for the Campbell penetration depth within strong pinning theory,
| (49) |
IV.2 Creep effects on in ZFC state
At finite temperatures, the analysis of the vortex system’s linear response proceeds in a manner analogous to the one above ignoring thermal fluctuations, with the following modifications: i) the oscillations in the vortex lattice induced by the small field now reshuffle those vortex lines close to the thermal jump points at and , implying that the relevant jumps in force are and , and ii) the trapping area involves the renomalized jump locations , producing the thermally renormalized angles and . After a short initialization period, that is not relevant for the present discussion, the field penetration is determined by the effective curvature
| (50) |
Equation (50) is the central result of this work; it allows us to trace the evolution of the Campbell penetration length as a function of time during a relaxation experiment. The expression (50) fully characterizes the dependence of on the pinning parameters for times .
At short times and very strong pinning , the branch occupation is highly asymmetric and , leading to . The Campbell curvatures then reads
| (51) |
with the thermally enhanced trapping length . In the marginally strong pinning limit, we have and , leading to a saturation of the effective angle . In this regime, relaxation behaves symmetrically on both sides of the bistable region with , see Eq. (13). Using , the Campbell curvature takes a simple form analogous to Eq. (47),
| (52) |
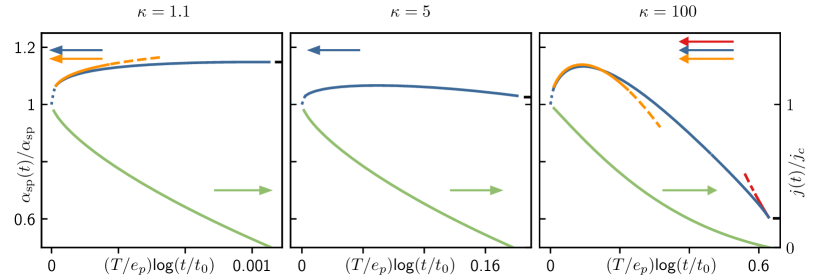
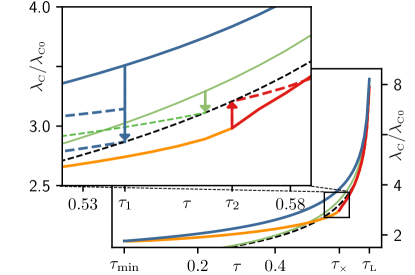
A numerical evaluation of the Campbell curvature , Eqs. (50) and (52), as a function of the creep parameter at different pinning strengths is shown in Fig. 4 (blue lines). For comparison, we also show the decaying persistent current density (40) in the region . The plots show that first increases with time and decreases at long times (but not in the marginal case with close to unity). From a phenomenological perspective, this can be understood as a change in the relative occupation of shallow and deep pinning wells in the course of relaxation. Furthermore, we find that, while the persistent current density ultimately vanishes on approaching the equilibrium state, the Campbell curvature remains finite and large. We will discuss these findings in detail later; before, we analyze their physical origin with the help of analytic considerations in the limits of moderately strong () and very strong () pinning.
IV.2.1 Short and intermediate times
Following Eq. (50), we have to determine the thermally renormalized jumps and as well as the corresponding trapping parameters. Here, we first analyze the situation at short times , where the jump positions and remain close to the edges of the bistability intervals ,
| (53) |
with small asymptotic shifts . Furthermore, we begin our discussion with a study of the very strong pinning regime, where the bistable interval is well separated from the defect potential, as and are both much larger than , see Eqs. (8) – (10) for more precise expressions for .
In this limit, Eq. (51) for is applicable, with the renormalized trapping length straightforwardly relating to , . Since , we find that , with thermal fluctuations assisting vortex trapping. Hence, the task of finding is reduced to the calculation of the shift in the jump position.
Next, we focus on the total force jump . It is convenient to determine the difference in force jumps between the shifted and original jump positions and in the form
with and , as well as corresponding expressions at . Above, we have introduced the ratio
| (55) |
between the semi-circular and rectangular areas appearing in the trapping geometry of Fig. 1, see Eq. (45). Taking a closer look at Fig. 3, we see that the differences in (IV.2.1) involve a large term on the linear pinning branch near , a corresponding term near , as well as a term on the (curved, see Fig. 3(d) inset) free branch near , the remaining term being obviously small at large .
The shifts at and are easily obtained from combining Eqs. (2) and (7),
| (56) |
With and , we find that and
| (57) |
follows from the shifts .
For the calculation of the curvature term , see Fig. 3(d), we have to include both shifts in and in (56) and find that
| (58) |
with
| (59) |
Note that increases with , see Fig. 2, hence we have in the above equation. As a result, we obtain the thermal change in force jumps
| (60) |
leaving us with the task to find the shifts and in the asymptotic and free tip positions, the terms from Eqs. (57) and (58) cancelling out.
Next, we determine the shift in the tip position by expanding the microscopic force balance Eq. (2) around the branch endpoint (where ) and find that , hence the tip shift
| (61) |
scales with the square root of the asymptotic shift . The corresponding result for involves .
At large , we can evaluate this expression within the tail of the defect potential; assuming, as before, an algebraic decay , we find that and relating to via Eq. (10), we obtain the shift in the tip position
| (62) |
Approximating the force jump in the absence of fluctuations by its leading term, we arrive at a compact result for the scaled Campbell curvature at large ,
| (63) | |||
Here, the linear terms and are universal, while the square-root- or curvature term depends on the shape of the defect potential, with the numerical prefactor describing a potential with an algebraic tail decaying as . The result (63) involves several competing elements: The first factor with a linear correction is due to the enhanced trapping distance and always leads to an increase in the Campbell curvature . On the other hand, the second factor originating from the renormalized force jump contributes with competing terms: While the positive term arising from the curvature in at , see Fig. 3(d), is the dominating one at small shifts, i.e., short times, the negative contribution deriving from the pinned branch at becomes relevant at intermediate and larger times.
Note that this competition between trapping area and force jumps appears as well in the discussion of the pinning force density in Eq. (37), but with the force jump replaced by the jump in pinning energy. This competition has been encoded in the prefactor of (38) that involves the corresponding two factors related to trapping and energy jumps. However, this time, the total energy jump misses the positive square-root term present in (63) and involves terms linear (negative) and quadratic (positive) in (since for large ). It turns out that the negative linear term in the total energy jump dominates over the positive correction in the trapping area, up to very large -values beyond , such that decreases monotonously. Increasing beyond this very large value, the situation gets reversed and we find a regime where creep enhances the pinning force density, with quite interesting new observable effects that will be discussed in a separate paper Gaggioli et al. (2022).
Going beyond small values of , the result (63) has to be modified, since the square root approximation for breaks down. This is easily seen when considering Fig. 3 for larger values of , where the curvature in the free branch flattens out and vanishes. In this regime, we have , where we have used the force balance equation (56) as well as the result (10) for and . The result (63) then is replaced by
| (64) | |||
at large . Note that, while is parametrically small in as compared to , this is not the case for the ratios and , since pinning and depinning appear on very different scales and , respectively.
Next, we wish to evaluate the expressions (63) and (64) in terms of experimental parameters, i.e., as a function of temperature and waiting time . We first find the shifts in the jump positions for the free and pinned branches near and , respectively. These are determined by the condition (36), telling us that we have to evaluate the depinning and pinning barriers Buchacek et al. (2019a) as given by Eq. (35) close to and , respectively, see Fig. 3(b). The expressions for and involve the free and pinned tip position and discussed above, cf. Eq. (59), as well as the unstable positions at . The latter are arranged symmetrically with respect to and , and .
While the shift is given in Eq. (61), the shift involves the derivative at short distances that depends on the details of the pinning potential. Using the dimensional estimate , we find that
| (65) |
For a Lorentzian potential, we have the more precise results and . Expanding the pinning/depinning barriers and away from and , we find the barriers (in compact notation)
| (66) |
where the second derivative has to be evaluated at ( for the pinning barrier (the depinning barrier ). Focusing on a Lorentzian potential, we arrive at
| (67) | |||||
| (68) |
with contributions from and . After a waiting time , thermal fluctuations at temperature can overcome barriers of size , rendering smaller barriers ineffective. Making use of Eq. (36) as well as the creep parameter defined in (39), we obtain the final results for the thermal shifts
| (69) | |||||
Indeed, is small, but the ratio dominates for .
Returning back to the evaluation of the Campbell curvature (63), we find the renormalized trapping length (with the numericals appertaining to a Lorentzian potential)
where we have used that in the last expression. Combining Eqs. (60) and (69), the final result for the renormalized total force jump is
These results then provide us with an expression for the (scaled) Campbell curvature in the large- – small-time limit
| (72) | |||
where we have used that , keeping only the leading term in . Equation (72) expresses the generic large- result (63) in terms of the creep parameter with the numericals describing the situation for a Lorentzian pinning potential.
Going beyond small values of , we have to use Eq. (64); the condition then translates to a creep parameter . Evaluating (64) using the thermal shifts in (69), we find the result for larger values of to take the slightly modified form,
In the above result, we have accounted for the improved normalization that includes the subdominant term for better precision, ; it is this result that compares well with the numerical result shown in Fig. 4. Finally, the approach to equilibrium with and beyond is discussed in Sec. IV.2.2 below.
The above analysis applies to large , where the shift in the force jump with its various contributions from free and pinned branches could be physically well motivated. In the following, we focus on the opposite limit of marginally strong pinning with serving as the small parameter (and setting otherwise). In this regime, the Campbell curvature is described through Eq. (52), which involves only the force jump at . Making use of the microscopic force balance equation (56), we find the simple formula
| (74) |
expressing the change in the total force jump by the shifts in tip positions alone. The expressions (61) for the shift in the vortex tip positions and involve the second derivative at the edges (obtained with the help of the expansion Eq. (13)) and we find
| (75) |
symmetric at and .
Besides the shift associated with the edge of the bistability region, we also need the free tip position near ,
| (76) |
that is not associated with a special point on the free branch. It is obtained by evaluating the force-balance equation (2) on the free branch close to ,
| (77) |
with the tip position given in (21). Solving Eq. (77) with the help of the expansion (13), we find the (symmetric) tip shifts expressed through ,
| (78) |
independent of .
Finally, we derive the asymptotic shifts using the expansion for the pinning/depinning barriers (66) and find . This result simplifies considerably when focusing on the Lorentzian potential, where .
The renormalized total force jump is obtained by inserting the above tip shifts into Eqs. (IV.2.1) and we obtain the shift in the force jumps
where we have focused on the Lorentzian potential, the generalization to an arbitrary potential being straightforward once the shape parameter is known.
To find the total force jump in the absence of fluctuations, we need the free and pinned vortex tip positons at the edge , see Eqs. (15) and (21), that lead us to the result
| (80) |
The trapping scale in Eq. (52) depends on the details of the potential, see Sec. II. For the Lorentzian potential, we find the results and , see Eq. (18), that takes us to the final result for the curvature at moderately strong pinning , to leading order in ,
| (81) |
Note that the last (negative) term is just the square of the second (positive) contribution.
Let us discuss the results (72), (IV.2.1), and (81) and compare them with the numerical findings, with all of these shown in Fig. 4. First, we translate the time range where our analysis is valid to the creep variable , that results in the region . Note that going beyond , we have to include both terms in Eq. (34); instead, here, we simply terminate our approximate analysis with the same result (up to irrelevant details in the form of the steps at ) for the equilibrium distribution .
The barriers at the branch crossing point have been derived both for strong and marginal pinning in Sec. II, see Eqs. (27) and (29). We then find our analysis to be valid for values of the creep variable inside the ranges
resulting in very different relaxation ranges for the two situations.
Fig. 4 summarizes all results graphically: the numerical evaluation of Eq. (50) in blue, the asymptotic expressions (81) and (IV.2.1) for moderate and large at short times in orange, and the long-time asymptotics discussed below, see Eq. (95), in red. Starting with the simpler result (81) for moderately strong pinning , we see that the increase in the curvature term in the renormalized force jump produces an increase in the Campbell curvature. The negative contribution in formally dominates the curvature term only at values of the creep parameter that reside beyond the criterion (IV.2.1), and hence the ratio (81) increases monotonously.
At very strong pinning , again, the increase in the trapping area and the curvature term in the force jump jointly produce an increase in the Campbell curvature at small values of the creep parameter. In this rise, the curvature term is the dominant one only at very small values . The curvature term goes over into the linear correction at , but this crossover is hidden by the dominant increase in the trapping area. The increasing Campbell curvature implies a decreasing Campbell length .
At larger values of , the competition is among the two terms in Eq. (IV.2.1), positive and in the trapping area and negative () in the force jump, that describes an inverted parabola in . At large , the positive correction in the trapping area dominates and we obtain a maximum in the Campbell curvature at , where we have focused on the leading order in only. This saturates at large at a value , i.e., within the relevant time range found in (IV.2.1). With decreasing the correction in the trapping factor diminishes and at the negative term in the force correction drives the initial slope of the inverted parabola negative, resulting in a monotonically decreasing Campbell curvature. However, we should not trust the large result Eq. (IV.2.1) at these intermediate values of any more. Indeed, as shown in Fig. 4, at , we have already crossed over from the monotonously increasing behavior predicted at marginal pinning to the non-monotonic result typical for large values of .
The above results can be compared with different experimental findings: The increasing curvature that we find at small times produces a decreasing-in-time Campbell length , in agreement with experimental results on Bi2Sr2CaCu2O8 (BiSCCO) by Prozorov et al., see Ref. Prozorov et al., 2003. On the other hand, measurements on YBa2Cu3O7 (YBCO) by Pasquini et al. Pasquini and Bekeris (2005) show a Campbell length that increases with time under the effect of creep; this is consistent with our long-time decrease in that appears for intermediate and large values of the strong-pinning parameter .
In Fig. 4, we complete these results with the curves , Eq. (40), for the persistent current densities. While vanishes on approaching equilibrium, this is not the case for the Campbell curvature . This is due to the vanishing jumps at in the pinning energy, see Fig. 3, while the force jumps remain large at and hence , with the latter defined in Eq. (48). The observation of a finite Campbell penetration depth above the irreversibility line Prozorov et al. (2003) in a BiSCCO sample confirms this finding.
IV.2.2 Long time limit
On a timescale , the jumps shift close to and the branch occupation approaches the radially symmetric equilibrium distribution with a jump at . For marginally strong pinning with , the maximal barrier is small and the relaxation to equilibrium happens rapidly. The bistable region is narrow, with and given in Sec. II, Eqs. (16) and (24), and hence the above evaluation of the force jumps at remains accurate when . As shown in Fig. 4, Eq. (81) then captures the corresponding long-time limit successfully.
In the very strong pinning limit , equilibrium is only slowly approached and the bistable region starts out broad and asymmetric, leading to stark changes in the trapping geometry and in the total force jump as the branch occupation relaxes. Our analysis then has to be adapted to cope with this different situation. We start by evaluating the asymptotic equilibrium value , and then study how this is approached as .
We simplify our previous result for at equilibrium, Eq. (48), by making use of the force balance Eq. (56) in order to express the jumps through the free and pinned tip positions at ,
| (83) |
The branch cutting point has been determined in Sec. II, Eq. (23). For the Lorentzian potential, we find . Combining Eq. (83) with the results for and the associated tip positions and , see Eq. (22), we arrive at the result
| (84) |
that depends only on the defect density and depth . Quite remarkably, while the persistent current density vanishes upon approaching equilibrium, the Campbell curvature and penetration depth remain finite. This is in agreement with the experimental findings in Ref. Prozorov et al., 2003, where a finite Campbell length was observed above the irreversibility line in a BiSCCO sample.
On approaching equilibrium, the thermal jumps reside close to and we can write with small corrections . Using the general result Eq. (50) for the Campbell curvature with , see Eq. (46) and making use of the smallness of , we have to evaluate
| (85) |
With and in the vicinity of , we find the changes in the force jump away from
| (86) | |||||
| (87) |
For long times , the relevant creep barriers (35) are to be evaluated close to the equilibrium value , justifying the expansions
| (88) | ||||
| (89) |
with the total derivatives assuming the simple form
| (90) | ||||
| (91) |
as all derivatives and cancel due to Eq. (56); indeed, both barriers decrease when going away from equilibrium. Combining the above relations, we can express the change in the force jumps and in terms of the barrier difference
| (92) |
to find
| (93) | |||||
| (94) |
Combining Eq. (86) and (93) also provides us with the expressions for that we need in (85). As a result, we have reduced the problem to the determination of the three vortex tip positions , , at the asymptotic vortex position . These have been found in Sec. II, Eqs. (22) and (26).
Inserting the results for the force jumps and jump points into Eq. (85) and focusing on a Lorentzian potential, we find the scaled Campbell curvature near equilibrium,
| (95) |
where we have used the form (48) for with and . Again, we find a competition between the trapping length and the force jump that act the same way as before, with the opposite signs compensated by evaluating away from the longest time . The result is shown in the large panel of Fig. 4 and agrees well with the full numerical result close to equilibrium, where .
Going to very large times , we enter the TAFF regime Kes et al. (1989) with a diffusive vortex motion characterized by the TAFF resistivity, and , cf. the corresponding discussion of the asymptotic decay of the persistent current density in Sec. III.2 above. The Campbell penetration depth then transforms into the dispersive TAFF-skin depth : In the Campbell regime, vortices displace by at frequency , resulting in a typical velocity . The typical velocity due to the dissipative motion follows from Faraday’s law, , combined with Ohm’s law , hence . Equating the two, we find the crossover frequency where and we enter the dispersive skin-effect regime at low frequencies . Physically, as drops below , the ac oscillation of the vortex in the well is prematurely (i.e., before completion of one cycle) terminated by an escape out of the well.
Note that the Campbell response requires sufficiently small frequencies as well: Following the derivation of Eq. (41), the Campbell penetration physics requires frequencies that transforms to the condition with . As a result, we find the bounded regime for the application of the Campbell response at very long times , with a crossover to the usual skin-effect (with ) at very low and at very high frequencies (with ).
IV.3 Campbell penetration depth in FC state
The FC state is characterized by a homogeneous distribution of the magnetic field inside the sample and hence is associated with a vanishing current- and pinning-force density. Correspondingly, at , the branch occupation is rotationally symmetric assuming a value in a disk with radius centered around the defect (we note that in Ref. Willa et al., 2016, the trapping area for was handled the same way as for ; it was described by the transverse trapping length and its circular geometry was ignored). The determination of the jump position as a function of the FC state preparation and its relaxation through creep is the main objective of this section.
Ignoring the initialization processWilla et al. (2015b), as we did in the discussion of the ZFC case above, we determine the restoring force using Eq. (IV.1) with replaced by ; accounting for the radial symmetry of the problem, we find the restoring force density
| (96) |
directed along the displacement parallel to the -axis, ; the force jump is to be evaluated at the radial jump position . The Campbell curvature then reads
| (97) |
and depends on temperature through the position of the jump in multiple ways: first, the pinning parameter determining the shape of the pinning force landscape in Fig. 3 depends on and through the parameters of the mean-field Ginzburg-Landau theory which are functions of and with the upper critical field Willa et al. (2016)—this dependence generates interesting hysteretic phenomena in cyclic measurements of the Campbell penetration depth with varying temperature Willa et al. (2015a, 2016) and will be the subject of Sec. IV.3.1. Second, thermal fluctuations, i.e., creep, drive the vortex state towards equilibrium, that corresponds to a relaxation of the initial jump position after field cooling towards the equilibrium position characterizing —these creep phenomena associated with the relaxing FC state will be discussed in Sec. IV.4.
IV.3.1 Hysteresis of penetration depth in FC state
We start with the discussion of the field-cooled state and the appearance of hysteretic effects. Here, we have in mind a setup where we fix the magnetic field and vary the temperature , typically in a (repeated) cooling–warming cycle. By changing the temperature , the vortex lattice elastic constant and the pinning energy are modified through their dependence on the Ginzburg-Landau parameters and on the reduced temperature and reduced field (we ignore rounding effects appearing at small temperatures). These mean-field dependencies on and entail a change in the pinning parameter within the – phase diagram that varies with the nature of the defect,
| (98) |
with the prefactor and exponents and depending on the type of defect/pinning (the dependence derives from the field dependence in the effective elasticity; at very small fields, we enter the single vortex strong pinning regime where our analysis has to be adapted, see Ref. Blatter et al., 2004). The cases of small insulating (, , ) or metallic defects (, , ), of -pinning (with local changes in the transition temperature and , , ) or -pinning (with local changes in the mean free path and , , ) have been discussed in Ref. Willa et al., 2016, but other situations may produce alternative dependencies (here, is the size of the defect and the coherence length of the superconducting material at ). Depending on the type of defect, strong pinning may turn on smoothly at the phase boundary (this is the case for insulating and metallic defects with ) or collapse from infinity (this is the case for - and -pinning with ). However, owed to the factor with a large exponent characterizing - and -pinning, this divergence at is strongly suppressed at the small fields where our analysis is valid. As a result, at small fields, strong pinning always turns on smoothly upon decreasing the temperature below the phase boundary . Also note that thermal fluctuations near the transition shift the onset of pinning to below .
In a first step, we establish the onset of strong pinning upon decreasing the temperature below at a given field value . Figure 5 shows the pinning force profile at the onset of strong pinning where the function develops an infinite slope at the point . This happens at the Labusch temperature that is defined through the condition . The point corresponds to the asymptotic position associated with the inflection point of at the Labusch point , hence with and , as discussed in Sec. II, Eqs. (13) and (18). At , this point coincides with the branch crossing point , see Eq. (24).
Decreasing the temperature below , the singularity at develops into the finite bistable interval with a width initially centered around . Depending on the relative increase in and the decrease in , the bistable interval may grow to the right (or left) of with () or enclose the initial instability at with . Going to smaller temperatures, pinning becomes stronger and the bistable interval increases asymmetrically around ; again, the competition between the growing and the decreasing determines the evolution of the bistable interval with decreasing temperature.
Depending on which of the above scenaria is realized, the system will exhibit quite a different behavior. To fix ideas, let us start with the specifc case of an insulating defect with , and a small field ; the evolution of the Labusch parameter within the – phase diagram is shown in Fig. 6(a). Decreasing below , one finds that the slope and hence the bistable interval moves to larger values of , . Going to smaller temperatures with larger values of , one finds that and increases with decreasing temperature, hence the interval continues shifting to the right as goes down, see Fig. 6(b).
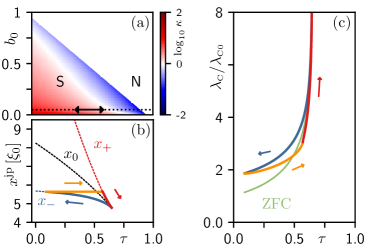
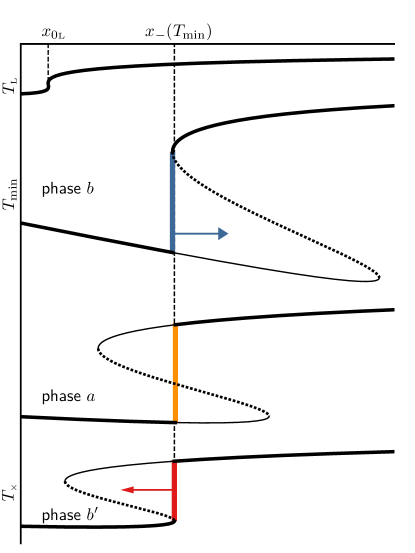
This is the situation illustrated in Fig. 5: With parts of the -shaped force profile turning unstable, the jump position , starting out at , gets pinned to the left (pinning) edge of the -profile, —we name this the phase . This behavior continues until the further decrease in temperature is stopped at the minimal temperature of the cycle where reaches its maximal value . Upon raising the temperature, we enter phase of the cycle where the bistable region shrinks and moves leftward; the jump position then stays fixed at its maximum, until the right end of the bistable region coincides with the jump at at the crossover temperature , . From onwards, the jump position is pinned to the right edge of the -profile, with ; this is denoted as phase in Fig. 5. The complete hysteretic loop traced out by over the three phases , , and is shown in Fig. 6(b). Finally, the changeover between phases , , and produces a pronounced hysteresis in the Campbell penetration depth , as illustrated in Fig. 6(c).
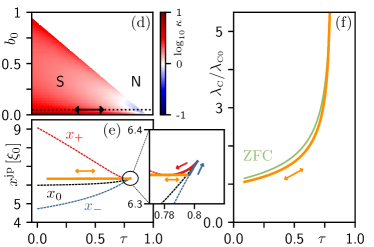
Having established the cycle for the insulating defect, let us briefly discuss other possibilities. Another typical situation is shown in Figs. 6(d–f), where we show the Labusch parameter for the case of -pinning in (d), together with the evolution of , , and as well as the resulting cycle in (e), and the Campbell penetration depth in (f). In this case, we find that , hence the shaped instability in initially moves to the left, . However, as shown in Fig. 6(e) and the expanded box, the upper edge quickly turns around with further decreasing and we change over from a narrow phase to an phase that completely dominates the cycle. With the jump remaining fixed close to deep in the bistable regime over the entire cycle, we find essentially no hysteresis for the case of -pinning, except for a narrow region close to .

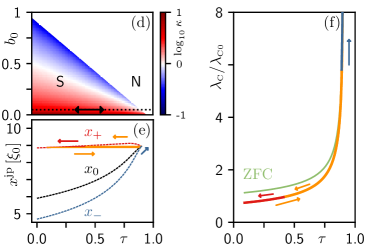
The two other cases, -pinning (with ) and the metallic defect (with ) closely resemble the behavior of the insulating defect and of -pinning, respectively, see Fig. 7, with an important difference remaining, though. Indeed, focusing on the metallic defect and the -pinning, with both not developing a hysteresis, we notice that for -pinning the phase is realized deep in the bistable interval with far away from the edges , while for the metallic defect, the phase resides close to the edge with , i.e., close to phase . As we have already learnt in Sec. IV.2, creep is strong when the barriers are small, which is the case when the jumps at are close to the edges , see Fig. 3. On the other hand, creep is weak when the jump resides deep within the bistable interval, e.g., away from the edges where barriers become large. Hence, we conclude that creep is strong in phases and where the jump is pinned to the edges, but is weak, deep in the phase . And hence, we expect that for -pinning creep will be small, while the metallic defect will exhibit stronger creep.
We thus conclude, that ‘reading’ a temperature cycle of the Campbell penetration depth allows us to gain quite some insights into the pinning mechanism:
For an insulating defect and for pinning, the cycle is hysteretic with strong creep upon cooling in the -phase, weak creep upon heating in the -phase, and again strong creep in the final heating phase close to where the -phase is realized. For a metallic defect, the cycle is non-hysteretic but creep is reasonably strong since the system straddles the regime at the edge of the -phase/-phase. Finally, for -pinning, the cycle is again non-hysteretic but with weak creep as the system resides deep in the -phase. We note, that other pinning types may occur exhibiting cycles that are yet different from those analyzed here.
Below, we determine the Campbell curvatures for the different phases , , . These results then produce the Campbell penetration depth shown in figures 6(c) and (f) and 7(c) and (f). While for the and phases the jump positions at the edges are well defined, for the phase the jump position depends on the way the phase is entered. E.g., for the cooling-warming loop with underlying insulating defects or with -pinning, we have since we enter the phase from the phase, while for metallic defects, we enter the phase upon the onset of strong pinning and hence . In a third case, realized for -pinning, the phase is entered through the phase with and the temperature where changes sign; this situation is realized for -pinning close to , see Fig. 6(e). All these different cases produce different values for .
IV.3.2 Campbell curvatures for FC phases
We now determine the Campbell curvatures for the different phases , , potentially appearing in a hysteresis loop, first in the marginal strong pinning situation valid close to and thereafter at large potentially realized at small temperatures. For convenience, we scale the results for the curvatures using the corrresponding ZFC results , where we denote field-cooled results via an upper index FC or with specific phase indices , while the ZFC expressions remain without upper index. Furthermore, while the results for the and phases can be pushed to closed expressions, this is not the case for the phase, as for the latter the jump position , while constant in temperature, resides somewhere within the bistable interval , as discussed above.
Let us start close to the Labusch point where the ZFC result for the Campbell curvature follows from Eq. (47) with the trapping scale and the force jump (80), providing the result
| (99) |
For the Lorentzian-shaped potential, this reduces to the simple expression , where we have used that to leading order in .
For the FC state at marginal pinning , we evaluate the Campbell curvature (97) using the jump radius that is same to leading order in for all three phases , , . We find the force jumps with the help of the force balance equation (56), , and make use of Eqs. (14) and (21) for the tip positions at the characteristic points relevant in phase and of the cycle. Furthermore, at small values , the bistable interval is narrow and symmetric around ; we then choose as a representative point (with the largest force jump) and make use of
| (100) |
As a result, we find the force jumps,
| (101) | ||||
| (102) |
relevant, respectively, for the , , and phases of the temperature cycle. For a Lorentzian potential, provides the force jumps and . Inserting these results in the expression (97) for the Campbell curvature, we find, to leading order in ,
| (103) | ||||
| (104) |
Finally, comparing the FC and ZFC results, we obtain the ratios
| (105) |
valid in the vicinity of the Labusch temperature . Given the symmetry between and of the bistable region within the marginally strong pinning limit, the force jumps in the and phases are equal to the force jump (80) in the ZFC state, and hence the FC Campbell curvature is identical to the ZFC result in the limit . For the representative point in the phase, the force jump is larger by a factor , resulting in a larger ratio for the Campbell curvature.
Including the next (4th) order term in the expansion (13) for , we find an asymmetric correction to in Eq. (15),
| (106) |
where the indices refer to pinned and free branches, respectively. For a Lorentzian potential, we have . Accounting for these 4th order corrections in the evaluation of the force jumps (101), the results for the and phases separate, in fact, symmetrically with respect to the ZFC result, , as the latter involves jumps both at and . In Fig. 9, we show our analytic results for at marginally strong pinning and find that they compare well with the numerical results in the limit discussed here.
At smaller temperatures, the pinning parameter grows larger and the Campbell curvature has to be evaluated in the limit. Using the expressions (8)–(10) for the endpoints and , we find that the Campbell curvature in the ZFC state scales as
| (107) |
for an algebraically decaying potential and for the Lorentzian. For the FC state, we approximate the relevant force jumps in the phases , , and as (cf. Eq. (10))
| (108) | |||||
with depending on the specific situation, see the discussion above. We then arrive at the following results for the curvatures in phases , , and of the hysteretic temperature cycle,
| (109) | |||||
Making use of the large- expressions (11) and (12) for and focusing on a Lorentzian potential, we find
| (110) | ||||
| (111) |
resulting in the following ratios valid at large
| (112) | ||||
| (113) |
The expression in (109) for the phase cannot be brought to a simpler closed form as depends on the preparation. The above results differ from those in Ref. Willa et al., 2016 due to the more accurate handling of the (circular) trapping geometry in the FC situation. At small temperatures and large , the equivalence between the Campbell curvature in the phases and is broken, and the corresponding results are substantially different from the ZFC ones, a consequence of the asymmetric nature of the bistable region at large . Note the result (113) that turns out large; the scaling follows from the different trapping areas, for the FC case and for the ZFC state.
IV.4 Creep effect on the hysteresis loop in FC state
We now proceed to include the effect of thermal fluctuations or creep on the Campbell length in the FC case. Thermal fluctuations drive the vortex state towards equilibrium, that corresponds to shifting the original position of the force jump towards , thereby approaching the equilibrium distribution . This relaxation can be experimentally observed at any place along the temperature cycle, with a specific example (assuming insulating defects) shown in Fig. 8, by interrupting the temperature sweep and letting the system relax. Alternatively, creep tends to close the hysteresis loop when cycling the temperature at an ever slower rate.
The relaxation of the FC states is largely different in the three phases , , and of the cycle: when the force jump is pinned to the edges or in the phases and , the activation barriers are initially small (as they vanish at ) and hence relaxation is large. On the other hand, deep in the phase, the jump location resides away from these edges and the initial barriers are already large to start with, resulting in a slow relaxation. Nevertheless, there is an interesting crossover to the fast creeping and phases at the edges of the phase; in the following, we first focus on relaxation of the phases and and discuss the slow relaxation of phase and its relation to the and phases at the end.
Before deriving the expressions for the time evolved curvatures , we summarize our results in Fig. 8 on the example of a hysteretic cooling/warming hysteretic cycle as it appears for the insulating defect or for -pinning. Depending on which part of the temperature cycle the relaxation process takes place (by stopping the change in temperature), the Campbell length either grows or decreases in approaching the equilibrium state. The inset in Fig. 8 shows three cases, relaxation during the phase (on cooling, in blue, with decreasing ), at the end of the phase/start of the phase (upon heating, in red, with increasing ), and relaxation of the ZFC state in green (decreasing ). The various relaxation traces approach the equilibrium value shown as a black dashed line. Stopping the relaxation by further cooling/heating, the penetration depth returns back to the FC lines (dashed blue/red lines). The relaxation in the phase is slow away from its edges at and as the activation barriers become large. Hence, we find that combining cooling, heating, and relaxation allows us to install numerous different vortex states, permitting us to spectroscopize the pinning force and thus probe the pinning potential of defects in a material.
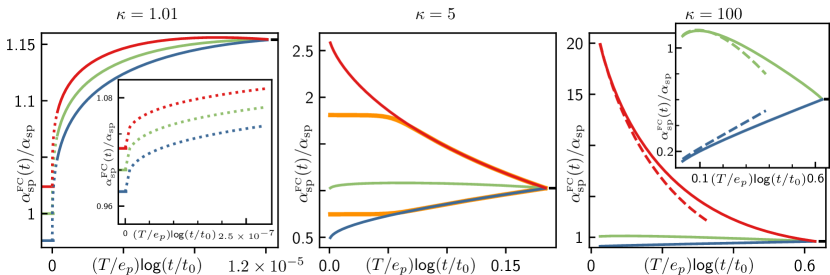
We now return back to the general discussion and derive the time evolution of the Campbell curvatures for the phases and . In describing the effect of creep on the Campbell curvature, we make heavy use of the results obtained in Sec. IV.2; specifically, we can make use of the shifts and , of the vortex asymptotic and tip position as determined through the dimensionless thermal barrier defined in Eq. (39).
Very close to the Labusch point , the bistable region is symmetric around and the force jumps at and are equal, hence, relaxation of the Campbell curvature along phases and of the temperature cycle are the same to leading order and identical with the result Eq. (81) for the ZFC state with the properly chosen Labusch parameter . The beyond leading-order correction (106) to the tip positions shifts the and curves for the curvatures symmetrically down and up with respect to the ZFC result, see Fig. 9.
Going to lower temperatures, the pinning parameter grows larger and the equivalence between the FC curvatures and and the ZFC result is lifted. Using the expression to evaluate the force jumps, and dropping the pinned against the free vortex tip position, i.e., for , we find that
| (114) | |||||
| (115) |
where and . Combining these results for the force jumps with the renormalized trapping radii
| (116) | ||||
| (117) |
the general expressions for the relaxation of the Campbell curvature during the phases and of the temperature cycle assume the form (cf. Eq. (63) for the ZFC and note that ; here, is always chosen at the appropriate temperature )
| (118) | ||||
| (119) |
We observe that, contrary to the situation in the ZFC state where we found a competition between an increasing trapping area and a decreasing force jump, in the FC states, the changes in the trapping area and in the force jumps work together. In particular, the trapping area shrinks with time in the phase. Hence, relaxing the state during phase always leads to an increasing curvature, larger then the ZFC result, i.e., a decreasing Campbell penetration depth , while the opposite applies during phase , see Fig. 9.
Focusing on the phase for a Lorentzian potential, we can make use of the results (69) for and and find that
| (120) |
This result is valid at short times, where is dominated by the square root behavior of the force profile close to . Going beyond short times, such that , the deviation is approximately linear, as discussed in the derivation of Eq. (64), and the Campbell curvature reads
| (121) |
In the analysis of the relaxation during phase , we proceed the same way: we make use of the result (69) for and note that to find the result
| (122) |
for the Lorentzian potential. With the above results, we find that the relaxation of the and phases under FC conditions is always faster than the relaxation for a ZFC experiment, see Eqs. (72) and (IV.2.1).
The upward (downward) relaxation of the Campbell curvatures is illustrated in Fig. 9, middle and right panels, with the curves (blue and red) enclosing the ZFC result (green). This implies a reverse behavior in the Campbell penetration length , which decreases with time in the phase and increases in the phase, see the example of a cooling–warming cycle for the case of insulating defects in Fig. 8.
Finally, we discuss the behavior of the phase upon relaxation. The phase can be entered either via the phase (see, e.g., Fig. 6(b)), via the phase (see, e.g., Fig. 6(e) very close to , or directly from at (see Fig. 7(e)). To fix ideas, here we focus on the situation where the phase is entered from the phase; the jump location then resides in the interval and the (depinning) barrier is finite right from the start at . Rather then reanalyzing this new situation ‘microscopically’, let us consider a substitute process where we start in the phase and let it decay in time (at the same point in phase space). Then, after a time , the jump location will reach and from there on, the further decay of the phase traces the decay of the phase. As a result, we find that
| (123) |
with the waiting time given by the usual estimate or
| (124) |
For the case where we enter the phase from the phase, we have to shift instead, , and substitute by . In general, when , we shift , while is to be shifted when .
Translating the seemingly trivial linear-in-time shift to the plot of Fig. 9 produces an interesting outcome, see the orange line in the middle panel. With , we have a smaller force jump and hence starts out at a lower value then the curve, . Next, the slope at small times relates to the slope of at , , via
and hence is small by the factor . As a result, we find that evolves flat in and then bends over to at , see Fig. 9, within a -time interval of unit size or a -interval of order , which is small on the extension of the creep parameter.
In an experiment, where the relaxation of the Campbell curvature (or length) is plotted versus -time, the phase will start out with a seemingly slow decay (a flat curve) as compared to the decay of the phase, see Fig. 9. This is owed to the vanishing of the barrier for the phase at small times, hence the phase decays much faster than the phase. Once the waiting time is reached, the decay of the phase has slowed down such as to catch up with the decay of the phase. The detection of the phase in an experiment then depends on its time resolution: this will be successful if resides within the observable time window of the relaxation experiment. If is too large (note that exponentially depends on the barrier and the temperature ) as compared to the time window of the measurement, only the flat part of the curve will be observed, with apparently no relaxation of the Campbell length. On the other hand, if is too short to be caught by the experiment then one will resolve a phase type relaxation and the feature appertaining to the phase (flat part) is lost. The absence of relaxation in the Campbell length observed Prozorov et al. (2003) in a BiSCCO sample finds a simple explanation in terms of large barriers that are present in the phase of the hysteresis loop.
V Summary and outlook
Strong pinning theory delivers a quantitative description of vortex pinning in the dilute defect limit. This fact is particularly prominent in the context of the Campbell ac response: not only can we describe a multitude of different vortex states, the zero-field cooled state and various types of field cooled states, we also can accurately trace the time evolution of these states and their signatures in Campbell penetration depth measurements. The strong pinning theory thus provides access to hysteretic and relaxation effects in the ac response that are otherwise, e.g., via weak collective pinning theory, at least so far, not available.
In this work, we have studied the effects of thermal fluctuations at finite temperatures , or creep, on the Campbell penetration depth that tracks the force jumps in the strong pinning landscape of Fig. 3. The proportionality , first found in Ref. Willa et al., 2015a, provides a satisfying connection to the curvature appearing in Campbell’s original Campbell (1969) phenomenological description: the jump effectively averages the curvatures in the pinning landscape. Remarkably, ac penetration experiments provide new information on the pinning landscape, different from standard critical current density measurements that tell about the jumps in energy.
In our analysis of the zero-field cooled (ZFC) state, we found an interesting relaxation behaviour of the Campbell curvature (or penetration depth ) with a non-monotonous time-evolution at medium to large values of the pinning parameter , increasing first at small waiting times and then decreasing towards a finite equilibrium value . At small values of , the marginal strong pinning situation, we found the curvature rising monotonously; numerical analysis shows that non-monotonicity appears at still rather small values of . The decay to a finite value in the Campbell curvature is very different from the decay to zero of the persistent current density , a fact owed to the different limits of and at the branch crossing point , see Fig. 3.
The relaxation of the field cooled (FC) states provides a rich variety of results as well: first of all, we find numerous types of hysteresis loops, depending on the characteristics of the defects, with insulating and metallic point-like defects, - and -pinning studied in more detail here, see also Ref. Willa et al., 2016. This different behavior is owed to the competition between an increasing and a decreasing as the temperature is decreased, with the scaling of determined by the type of pinning. Depending on the relative motion between the bistable interval (with and at large ) and the initial instability point upon decreasing , the jump location gets pinned at the edges or stays put somewhere in between—these three cases define the phases and , as well as the phase, that appear in the hysteresis loop when cycling the temperature down and up. The appearance of these phases within a loop again depends on the defect type, with insulating defects and -pinning exhibiting all phases in the sequence (cooling) to (heating) to (heating), while the loops for -pinning and metallic defects are dominated by the phase. The three phases behave quite differently, with the phase providing a smaller penetration depth at large (where ), while in terms of creep, the phase sticks out by its slower decay. Further experimental signatures for these phases are the decay (increase) in magnitude of under creep for the () phases and a plateau, i.e., an initially much slower relaxation (both up or down is possible) in the phase due to the presence of large thermal barriers. Such characteristic differences then allow to make conjectures about the underlying pinning landscape.
In the present work, we have made an additional step towards better precision in our analytic results. Using the Lorentzian-shaped potential describing a point-like defect as an example, we have provided analytic results including numerical factors; this further illustrates the value of the strong pinning concept as a quantitative theory. Furthermore, care has been taken to properly treat the trapping geometry of strong pinning, see Fig. 1. It turns out, that this geometry affects transport and ac response in different ways: while in transport only the transverse trapping length shows up, when dealing with the (ZFC) ac response, pinning (involving a semi-circle of radius ) and depinning (at a circular segment of radius ) are weighted with separate factors. Furthermore, in the FC situation, trapping always appears on a circle with a radius spanning the entire bistable region, depending on the induced vortex state; this feature has been missed in our previous analysis Willa et al. (2016).
Several of the predictions made in the present work have been observed in experiments measuring the Campbell penetration length. Examples are the decreasing in a BiSCCO sample Prozorov et al. (2003) that is consistent with an increasing Campbell curvature at short times or marginally strong pinning, see Fig. 4, the increasing in an YBCO superconductor Pasquini and Bekeris (2005) that is consistent with the long time behavior of the Campbell curvature at intermediate and very strong pinning, see again Fig. 4, the finite equilibrium value of the Campbell length , see Eq. (84), that has been observed in a BiSCCO sample above the irreversibility line, and the absence of creep in the field cooled (FC) state of a BiSCCO single crystal Prozorov et al. (2003), here explained in terms of an phase that is characterized by the presence of large barriers, see also Fig. 9.
In the present study, we have focused on the low-field regime where the trapping length stays below the vortex lattice constant, . At larger field values, multiple vortices start competing for the same defect and our single-pin–single-vortex description has to be extended to include several vortices, see also Refs. Willa et al., 2018a, b. This becomes particularly relevant in very anisotropic and layered material with , where can become large and easily goes beyond even at moderate field values already. Related to the possibility of such very strong pinning is the prediction Gaggioli et al. (2022) of a creep-enhanced critical current due to a dominant increase in the trapping area at very large . Furthermore, since pinning remains active also beyond Thomann et al. (2017) it would be interesting to measure and analyze the Campbell penetration physics in the dynamical vortex state.
Acknowledgments
We thank Martin Buchacek and Roland Willa for discussions and acknowledge financial support of the Swiss National Science Foundation, Division II.
References
- Abrikosov (1957) A. Abrikosov, Sov.Phys.JETP 5 (1957) 5 (1957).
- Campbell and Evetts (1972) A. Campbell and J. Evetts, Advances in Physics 21, 199 (1972), https://doi.org/10.1080/00018737200101288 .
- Tinkham (2004) M. Tinkham, Introduction to Superconductivity, Dover Books on Physics Series (Dover Publications, 2004).
- De Gennes (1999) P. G. De Gennes, Superconductivity of Metals and Alloys, Advanced book classics (Perseus, Cambridge, MA, 1999).
- Campbell (1969) A. M. Campbell, Journal of Physics C: Solid State Physics 2, 1492 (1969).
- Labusch (1969) R. Labusch, Crystal Lattice Defects 1 (1969).
- Larkin and Ovchinnikov (1979) A. I. Larkin and Y. N. Ovchinnikov, Journal of Low Temperature Physics 34, 409 (1979).
- Blatter et al. (2004) G. Blatter, V. B. Geshkenbein, and J. A. G. Koopmann, Phys. Rev. Lett. 92, 067009 (2004).
- Willa et al. (2015a) R. Willa, V. Geshkenbein, R. Prozorov, and G. Blatter, Physical Review Letters 115, 207001 (2015a).
- Lowell (1972) J. Lowell, Journal of Physics F: Metal Physics 2, 547 (1972).
- Campbell (1978) A. Campbell, Philosophical Magazine B 37, 149 (1978), https://doi.org/10.1080/01418637808226649 .
- Willa et al. (2016) R. Willa, V. B. Geshkenbein, and G. Blatter, Phys. Rev. B 93, 064515 (2016).
- Bean (1962) C. P. Bean, Phys. Rev. Lett. 8, 250 (1962).
- Buchacek et al. (2018) M. Buchacek, R. Willa, V. B. Geshkenbein, and G. Blatter, Physical Review B 98, 094510 (2018).
- Buchacek et al. (2019a) M. Buchacek, R. Willa, V. B. Geshkenbein, and G. Blatter, Physical Review B 100, 014501 (2019a).
- Thomann et al. (2012) A. U. Thomann, V. B. Geshkenbein, and G. Blatter, Physical Review Letters 108, 217001 (2012).
- Buchacek et al. (2019b) M. Buchacek, Z. L. Xiao, S. Dutta, E. Y. Andrei, P. Raychaudhuri, V. B. Geshkenbein, and G. Blatter, Phys. Rev. B 100, 224502 (2019b).
- Prozorov et al. (2003) R. Prozorov, R. Giannetta, N. Kameda, T. Tamegai, J. Schlueter, and P. Fournier, Phys. Rev. B 67, 184501 (2003).
- Pasquini and Bekeris (2005) G. Pasquini and V. Bekeris, Phys. Rev. B 71, 014510 (2005).
- Thomann et al. (2017) A. U. Thomann, V. B. Geshkenbein, and G. Blatter, Physical Review B 96, 144516 (2017).
- Kwok et al. (2016) W.-K. Kwok, U. Welp, A. Glatz, A. E. Koshelev, K. J. Kihlstrom, and G. W. Crabtree, Rep. Prog. Phys. 79, 116501 (2016).
- Willa et al. (2018a) R. Willa, A. Koshelev, I. Sadovskyy, and A. Glatz, Supercond. Sci. Technol. 31, 014001 (2018a).
- Willa et al. (2018b) R. Willa, A. E. Koshelev, I. A. Sadovskyy, and A. Glatz, Physical Review B 98, 054517 (2018b).
- Blatter et al. (1994) G. Blatter, M. V. Feigel’man, V. B. Geshkenbein, A. I. Larkin, and V. M. Vinokur, Rev. Mod. Phys. 66, 1125 (1994).
- Bardeen and Stephen (1965) J. Bardeen and M. J. Stephen, Physical Review 140, A1197 (1965).
- Brazovskii and Larkin (1999) S. Brazovskii and A. Larkin, J. Phys. IV France 09, Pr10 (1999).
- Brazovskii and Nattermann (2004) S. Brazovskii and T. Nattermann, Adv. Phys. 53, 177 (2004).
- Kes et al. (1989) P. H. Kes, J. Aarts, J. van den Berg, C. J. van der Beek, and J. A. Mydosh, Superconductor Science and Technology 1, 242 (1989).
- Willa et al. (2015b) R. Willa, V. B. Geshkenbein, and G. Blatter, Physical Review B 92, 134501 (2015b).
- Gaggioli et al. (2022) F. Gaggioli, G. Blatter, and V. Geshkenbein, unpublished (2022).