VLA Radio Study of a Sample of Nearby X-ray and Optically Bright Early-Type Galaxies
Abstract
Many massive early-type galaxies host central radio sources and hot X-ray atmospheres indicating the presence of radio-mechanical active galactic nucleus (AGN) feedback. The duty cycle and detailed physics of the radio-mode AGN feedback is still a matter of debate. To address these questions, we present 1–2 GHz Karl G. Jansky Very Large Array (VLA) radio observations of a sample of the 42 nearest optically and X-ray brightest early-type galaxies. We detect radio emission in 41/42 galaxies. However, the galaxy without a radio source, NGC 499, has recently been detected at lower frequencies by the Low-Frequency Array (LOFAR). Furthermore, 27/42 galaxies in our sample host extended radio structures and 34/42 sources show environmental interactions in the form of X-ray cavities. We find a significant correlation between the radio flux density and the largest linear size of the radio emission and between the radio power and the luminosity of the central X-ray point-source. The central radio spectral indices of the galaxies span a wide range of values, with the majority of the systems having steep spectra and the rest flat spectra. These results are consistent with AGN activity, where the central radio sources are mostly switched on, thus the duty cycle is very high. 7/14 galaxies with point-like radio emission (Fanaroff-Riley Class 0; FR 0) also show X-ray cavities indicating that, despite the lack of extended radio structures at 1–2 GHz, these AGN do launch jets capable of inflating lobes and cavities.
1 Introduction
The radio-mechanical feedback mode is thought to play a dominant role in the evolution of massive early-type galaxies, which host hot ( K) X-ray emitting atmospheres. In the absence of balancing heating, the atmospheric gas should cool radiatively and form stars, building much larger and bluer galaxies than are seen. X-ray studies with Chandra and XMM-Newton as well as radio observations have shown that in these galaxies jet-inflated radio lobes displace the hot gas, creating ‘cavities’ in the X-ray emitting plasma (e.g. Fabian et al., 2003) and driving weak shocks and turbulence that heat the surrounding medium essentially isotropically (for a recent review see Werner et al., 2019). This feedback mode appears to be maintaining a remarkably long-lived delicate balance between heating and cooling in the hot X-ray emitting atmospheres of these systems (McNamara & Nulsen, 2007).
Burns (1990) showed that as much as 70 of the central dominant galaxies (CDGs) in clusters are radio loud. Later, Mittal et al. (2009) found that all strong cool cores host a central radio source and Sun (2009) argued that all central brightest cluster and group galaxies with a radio emitting active galactic nucleus (AGN) are located in cool cores. Kolokythas et al. (2018) used the Giant Metrewave Radio Telescope (GMRT) to study the Complete Local-volume Groups Sample (CLoGS), consisting of 53 local galaxy groups, at 235 MHz and 610 MHz and also found a high radio detection rate of 87. These results showed that the duty cycle of AGN in clusters and groups with short cooling times must be high. Moreover, the duty cycle for the X-ray cavities in clusters of galaxies of around 70 was found, although lower mass systems like groups and giant elliptical galaxies showed also lower duty cycles (between 30-50) (Dunn et al., 2005; Dunn & Fabian, 2006; Nulsen et al., 2009; Dong et al., 2010; Bîrzan et al., 2012, 2020). The ability to detect cavities depends on a number of factors including their location, size, age, the level of disturbance of the surrounding halo, the depth of the observation, and the instrument used, so estimates are likely subject to bias, and perhaps systematically underestimated as you go from the brightest clusters to fainter systems.
Results for the duty cycle in a population of massive galaxies are, however, somewhat less clear. Best et al. (2005) studied galaxies in the redshift range of 0.03 z 0.1 and found that the fraction of galaxies with a radio-loud AGN increased with the stellar mass of the galaxy, reaching a maximum fraction of 30-40. For a volume limited sample of very local (up to 15 Mpc) infrared luminous galaxies, Goulding & Alexander (2009) found that only 27 of the galaxies host an AGN. Other studies found a higher fraction. The K-band absolute magnitude limited () sample of 396 early-type galaxies (Brown et al., 2011) showed the presence of radio continuum emission for all sources in the NRAO Very Large Array Sky Survey (NVSS) data combined with the single-dish data from the Green Bank Telescope (GBT), and Parkes Radio Telescope survey (PKS). Sabater et al. (2019) used observations at lower frequencies (120–168 MHz) from the LOw-Frequency ARray’s (LOFAR’s) Two-Metre Sky Survey (LoTSS) to investigate sources up to redshift 0.3 and confirmed previous findings of the high rate of radio source detection in the central region of massive galaxies.
A different approach was taken by Dunn et al. (2010), who focused on a volume-limited study of the 18 nearest ( Mpc) optically and X-ray brightest early-type galaxies. Compared to other studies, their selection criteria also included X-ray luminosity, ensuring that the investigated galaxies really inhabit massive halos. Remarkably, their study revealed that nuclear radio emission is present in 17 out of the observed 18 galaxies. Furthermore, at least 10 of the galaxies with observed central radio emission also exhibited obvious spatially-extended jets in the Very Large Array (VLA) images. The authors concluded that the results present a severe challenge for models in which radio jets are considered a relatively rare and sporadic phenomenon (e.g. Binney & Tabor, 1995; Kaiser & Binney, 2003) and the active ‘radio-mode’ feedback most likely represents the default state for large elliptical galaxies.
Here, we extend the Dunn et al. (2010) study to the 42 optically and X-ray brightest, nearest ( Mpc) early-type galaxies, with declination greater than -40 degrees (to ensure coverage by the VLA) to observe their radio properties, investigate the duty cycles, and search for correlations between the radio plasma and their hot atmospheres, as well as emission line nebulae. Our sample includes both galaxies at the centres of groups and clusters and field ellipticals with their own hot X-ray emitting atmosphere. Our focus on the nearest systems, as well as the relatively long baseline of the VLA A configuration (35 km), ensures a good sensitivity and spatial resolution.
Sections in this paper are arranged as follows: The selection criteria for our sample are stated in Section 2. The radio morphology categories used in the paper are described in Section 3 and followed by Section 4, which presents the observations and data reduction for radio (Section 4.1) and X-ray (Section 4.2) data.
The main results from the radio data reduction are summarized in Section 5 and Table 1 followed by the radio detection rates (Section 5.1) and the X-ray cavity and central X-ray point-source rates (Section 5.3), the multifrequency correlations (Section 5.4, Table 2), and values of the central spectral indices (Section 5.5, Table 3). These results are discussed in Section 6.
In Section 7, we conclude with a summary of the results.
The observed radio morphologies and relevant multifrequency data for every source are described in Appendix A. The Chandra X-ray data overlaid by radio contours obtained in multiple VLA configurations at 1–2 GHz are presented in Appendix B, for both point-source-like (Appendix B.1) and extended (Appendix B.2) radio morphologies. The
Table C1 in Appendix C includes information about the radio observations. Finally, Appendix D includes Table D1 with additional sources excluded from the main sample.
Throughout the paper, the spectral indices, , are defined by flux density, and radio powers as 111The K correction was not applied given the redshift distribution of sources in our sample.. The distances were determined through the redshift-independent surface brightness fluctuation method due to proximity of the sources in our sample (see Table 1). The following cosmological parameters were used in this paper: (Planck Collaboration et al., 2016), and .
2 Sample Selection
We base our study on the extended sample of the nearest X-ray and optically brightest massive early-type galaxies discussed in Dunn et al. (2010). Their parent sample is the catalog of Beuing et al. (1999), which contains 530 elliptical and elliptical/lentilcular galaxies brighter than the total Johnson B-band magnitude of and has a 90 completeness. Beuing et al. (1999) also provide X-ray luminosities or upper limits for 293 galaxies, based on ROSAT All-Sky Survey (RASS) data. These measurements were updated by O’Sullivan et al. (2001), who also used data from ROSAT pointed observations.
An extensive Chandra X-ray study of this sample was performed by Lakhchaura et al. (2018), who slightly modified the selection criteria and increased its completeness. Our paper is a radio counterpart to the X-ray study of Lakhchaura et al. (2018). Our final selection criteria combine the criteria of Dunn et al. (2010) and Lakhchaura et al. (2018) and are as follows:
-
•
lower limit of the X-ray luminosity within 10 kpc from the center of galaxy:
in the 0.5–7 keV band -
•
upper limit of the optical absolute magnitudes: (total Johnson B-band magnitudes)
-
•
volume restriction: all sources are within the distance of 100 Mpc
-
•
declination cut: DEC -40 degrees to ensure radio coverage with the VLA
We note that while the X-ray luminosities of O’Sullivan et al. (2001) were total luminosities, which also included the contribution from point sources, such as the central AGN and X-ray binaries, our X-ray luminosities based on the measurements of Lakhchaura et al. (2018) only refer to the hot X-ray emitting atmospheres within 10 kpc 222According to Goulding et al. (2016) most of our galaxies have their effective radius, , up to 10 kpc from the core. from the center of the galaxy. Additionally, the intrinsic 2–10 keV central X-ray point source luminosities were estimated from the power-law components of the spectral models for a sub-sample of galaxies, for which central X-ray point source emission was detected (Lakhchaura et al., 2018).
Given these selection criteria, our volume-limited sample of the X-ray and optically brightest nearby early-type galaxies (41 giant elliptical galaxies and 1 lenticular) has a high level of completeness. There are 6 sources which meet our volume and X-ray/optical brightness criteria, but have no dedicated VLA L-band observations or sufficient Chandra data. Furthermore, for additional 2 sources, IC 310 and NGC 4203, the X-ray emission is strongly dominated by the central point source and the contribution of the X-ray atmosphere cannot be determined reliably (see Appendix D and Table D1). The small incompleteness will not significantly affect our conclusions. NVSS total intensity maps, which were less sensitive than the dedicated observations presented in our work, reveal emission from a central radio source at 1.4 GHz in the majority of non-included galaxies (5 out of 8 galaxies).
The main goal of our study is to extend the radio sample of Dunn et al. (2010) to the 42 nearest X-ray and optically brightest galaxies with the highest resolution VLA A configuration data in the L-band spanning the frequency range 1–2 GHz and centered at 1.5 GHz.
We obtained new VLA A observations for 18 giant elliptical galaxies (proposal ID: 15A-305, PI: N. Werner) to complement the available archival radio data for the entire sample333 Unfortunately, NGC 1521 was missed while proposing for the new VLA observations.. The highest resolution array configuration was chosen to match the resolution of images from the Chandra X-ray observatory. Moreover, to be sensitive not only to the fine structure of the central region, but also to more diffuse and extended radio emission, we decided to complement the high resolution VLA A configuration data with data from the more compact C and D VLA configurations.
3 Radio morphology categories
We define four categories of radio sources (see Figu-
re 1) depending on the total extent of radio emission: point sources, compact sources, diffuse sources, and sources with prominent jets and lobes. In some cases, the compact and diffuse sources reveal small-/large-scale jets and lobes, which we classify as a subcategory of the compact (e.g. NGC 5129) or diffuse (e.g. NGC 741) sources with jets/lobes.
The point-source category (PS) is defined for those sources with an extent smaller than twice the restoring beam size of their total intensity VLA map. Galaxies with radio emission larger than this threshold are indeed labeled as extended. In addition, compact sources (C) are defined when showing their total extent smaller than 5 kpc. On the other hand, diffuse (D) sources are those classified as having their radio emission extending to more than 5 kpc from the nucleus with a rather dispersed morphology, without well-defined large-scale jets/lobes. Lastly, for the sources in the category of prominent jets/lobes (J/L), the radio jets and lobes are the most prominent features (e.g. IC 4296) and well collimated and narrow (i.e., with opening angles less than a few tenths of degrees) extending more than 5 kpc from their radio core.
![[Uncaptioned image]](/html/2111.02430/assets/ngc3091_categories_extent_cross_apjs.png) |
![[Uncaptioned image]](/html/2111.02430/assets/ngc5129_categories_extent_cross_apjs.png) |
![[Uncaptioned image]](/html/2111.02430/assets/ngc4636_categories_extent_cross_apjs.png) |
![[Uncaptioned image]](/html/2111.02430/assets/ngc1407_categories_extent_apjs.png) |
![[Uncaptioned image]](/html/2111.02430/assets/ngc507_categories_extent_cross_apjs.png) |
![[Uncaptioned image]](/html/2111.02430/assets/3c449_categories_apjs.png) |
4 Observations and data reduction
4.1 VLA Radio Observations and Analysis
We reduce and analyse VLA data obtained both before (historical VLA data) and after the major upgrade in 2011 (Karl G. Jansky VLA/EVLA data; Perley et al., 2009, 2011).
The major data size difference is in the increased bandwidth of the observations due to the upgrade to the Wideband Interferometer Digital ARchitecture (WIDAR) correlator system. The older historical data consisted of only one or two spectral windows with tens of channels with a channel width of 100–1000 kHz, whereas the Karl G. Jansky VLA data have tens of spectral windows with up to hundreds of channels with a channel width of 3000 kHz, which makes the size of the data set significantly larger. This affects our approach to the calibration methods we used for the two different data sets. For the Karl G. Jansky VLA data ( 20-100 GB), we used the more effective pipeline calibration method and in the case of historical data, a manual calibration approach was chosen, following the ‘Jupiter continuum calibration tutorial’ available on the VLA NRAO website444
https://casaguides.nrao.edu/index.php/Jupiter:_continuum
_polarization_calibration.
4.1.1 Historical VLA data
The pre-upgrade or historical VLA data sets were analysed for 33 galaxies in multiple configurations (details are given in Table C1) and observed for a large fraction of sources in our sample (i.e., more than 80%) in two spectral windows between 1.4–1.7 GHz. The important calibration steps for the historical data sets can be summarized as follows: The first step is to flag the imported data according to the suggestions from the NRAO observation log555http://www.vla.nrao.edu/cgi-bin/oplogs.cgi (if available), then we run tfcrop (Time-Frequency Crop), the automatic flagging algorithm. The flux density for the corresponding VLA primary flux calibrators (Table C1) is set from a model (Perley & Butler, 2013) with the casa task setjy. Since there are only one or two single-channel spectral windows for most of the pre-upgrade historical data, we do not need to solve for the antenna delays and do the bandpass calibration. The next step is to determine the solution of the total gains for the flux density calibrator and finally, apply those gain solutions to the target.
4.1.2 Karl G. Jansky VLA data
The new Karl G. Jansky VLA observations at 1–2 GHz presented here include 20 sources in A configuration from our project (ID: 15A-305, PI: Werner) and 10 archival observations in various VLA configurations (Table C1). The details of the data reduction and imaging were described in our recent paper on the giant elliptical galaxy IC 4296 (Grossová et al., 2019).
A similar approach is used to calibrate666 casa pipeline v1.3.11 and CASA (v4.7.2.; McMullin et al., 2007) and image all sources from the 2015 project. The corresponding flux density calibrators for each observation are listed in Table C1.
The imaging was performed with the MultiTerm MultiFrequency synthesis (MTMFS) clean algorithm (Rau & Cornwell, 2011) with the briggs (robust=0) weighting scheme (Briggs, 1995). The second order Taylor polynomial (nterms=2; McMullin et al., 2007) was used to account for the spectral behaviour of the sources. The various spatial scales of radio emission require an individual approach to each source with different combinations of weightings, gridders, convolvers, and uv-tapers. When the dynamic range of the total intensity images reaches high enough values777We consider the dynamic range high enough when the ratio of the peak intensity to the RMS noise of the image is about 100., a few cycles of phase and possibly one cycle of amplitude and phase self-calibration are performed.
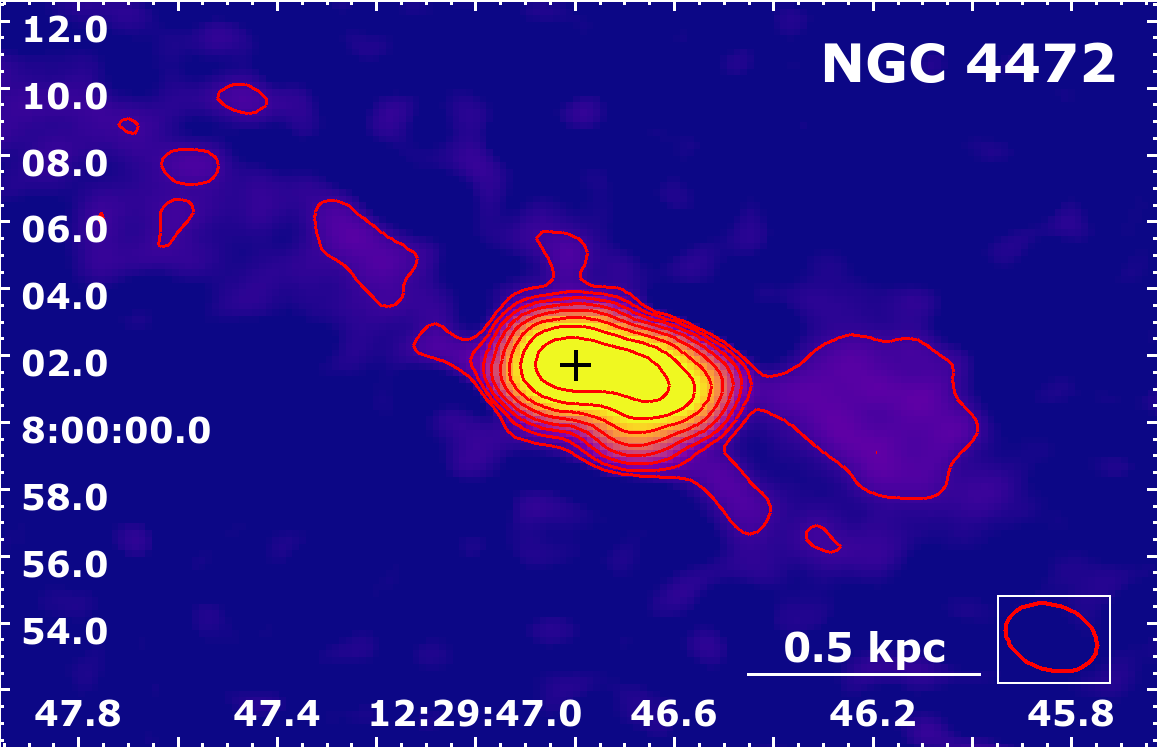
An example of the final total intensity map is presented for the giant elliptical galaxy NGC 4472 in Figu-
re 2.
4.1.3 Total flux densities and uncertainties
The final total flux densities centered at 1.5 GHz () for each source are derived using the imstat casa task. It is worth noting that, for sources in the sample observed only in A or B configuration, the final flux density might be lower than the ‘true’ total flux density, because of the missing short baselines. On the other hand, we are mainly interested in central cores, where the flux density values are not affected by the missing short baselines.
The corresponding measurement uncertainties for the flux densities () are determined as follows (e.g.: Klein et al., 2003; Rajpurohit et al., 2018):
| (1) |
where is the specific calibration uncertainty, which is about 4 for VLA observations (Perley & Butler, 2013). , the noise uncertainty, is defined as the off-source root-mean-square (RMS) noise () of the image multiplied by the square-root of the number of points () in pixels per area, which covers the entire radio emission of the source divided by the beam area () in pixels. The term accounts for a possibly wrong zero level, but may be neglected for interferometric observations (Klein et al., 2003).
The RMS noise values were determined from four circular off-source regions in the image using casaviewer and the median was taken as the final . The casa tool for image analysis, ia.beamarea, gives an area that is covered by the beam or in pixels. Finally, we create a polygonal region enclosing the source’s entire radio emission and save it into a casa region file with the extension ‘.crtf’. The casa task imstat with a parameter region=’*.crtf’ is used to determine the integrated flux density at 1.5 GHz () and the number of points (npts) or pixels within that specific region of the source emission.
The value of the peak intensity at 1.5 GHz () and the corresponding uncertainties are determined accordingly.
4.1.4 Spectral index maps
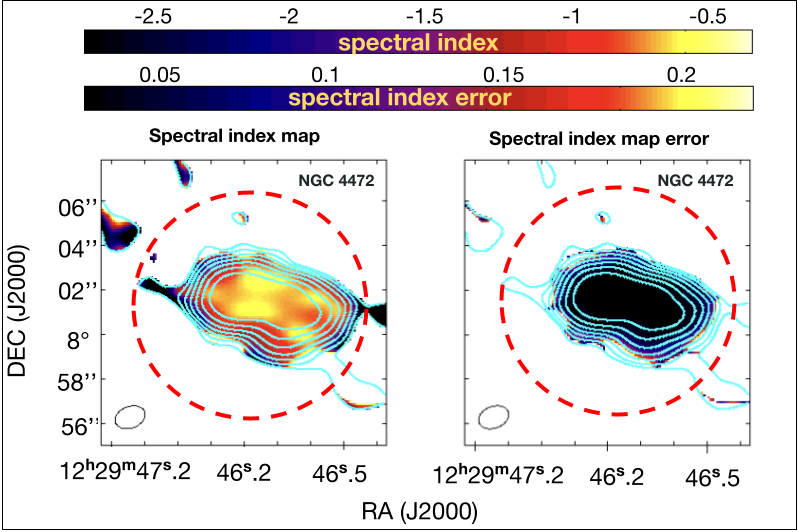
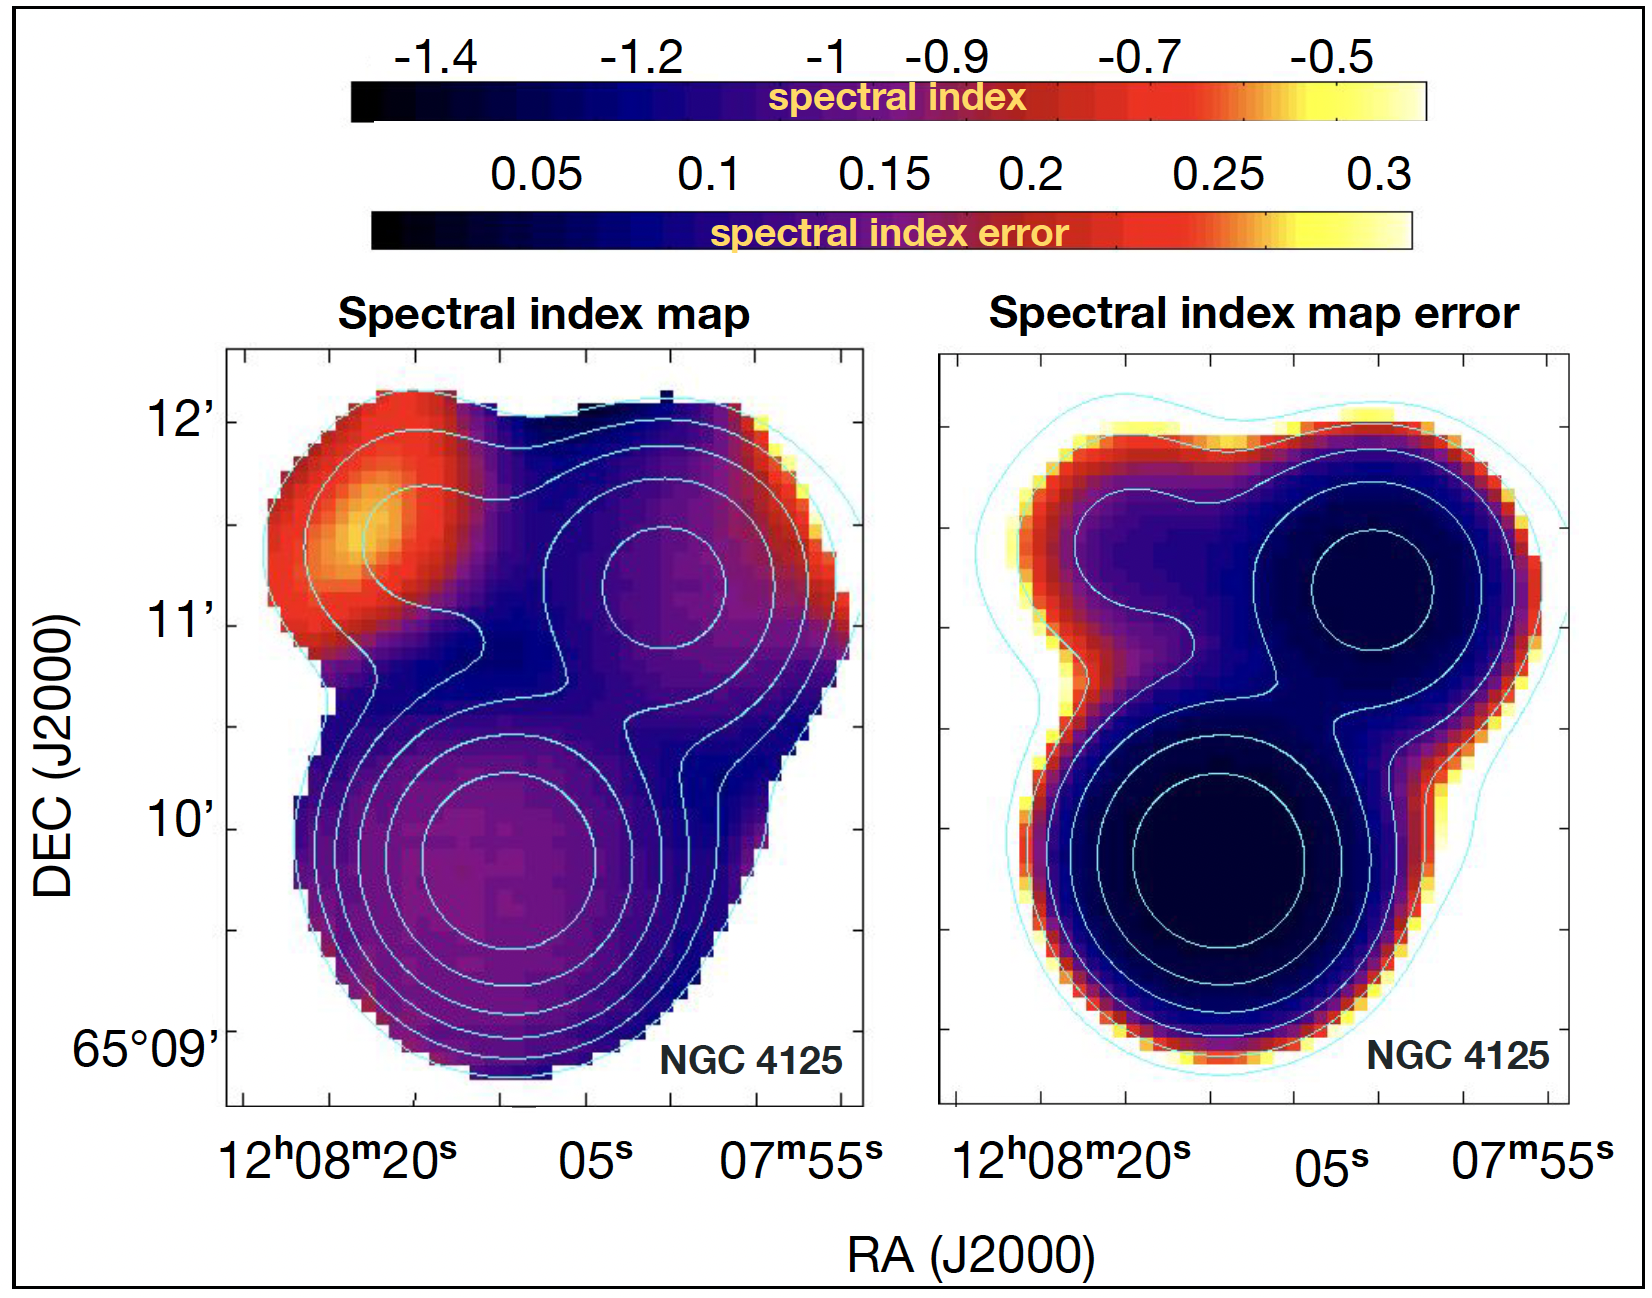
To investigate the most recent activity of the AGN in our sample, we produce in-band spectral index maps from our 15A-305 VLA A configuration project for 18 giant elliptical galaxies. Each observation contains 16 spectral windows spanning the frequency range between 1–2 GHz.
We adopted two different approaches to estimate the spectral index. First, we used the MultiTerm MultiFrequency (MTMFS) deconvolution algorithm in the tclean casa task. It produces two Taylor coefficient images: tt0 as an equivalent of a Stokes I image, thus containing the information on the emission at a reference frequency, and tt1 as a Taylor expansion term. The spectral index is then defined as: . The final output of the spectral index map is stored in the casa product file, ‘.alpha.image.tt0’ with the corresponding measurement uncertainty values saved in the casa product, ‘.alpha.image.alpha.error.tt0’. To focus only on the emission above 5, we applied this threshold value through the task widebandpbcor to the final ‘alpha image’ and with a parameter calcalpha, we recalculated the spectral index map. In the casaviewer, a circular region for each source with the diameter of 0.7 kpc is defined to investigate the spectral index at the same physical scale in all 18 galaxies. The size of the central region (0.7 kpc) was chosen to be applicable to all of our sources taking into account the different distances. This region was then used to extract the mean spectral index values from the threshold-adjusted casa ‘alpha images’.
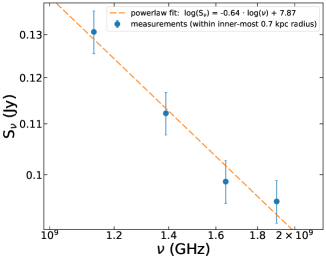
For our second approach, we estimated the spectral index fitting flux densities measured in the central regions as described in the following. We split the 12 spectral windows888The 12 spectral windows were left after flagging the original 16 spectral windows. into 4 chunks and ‘cleaned’ them separately with specific reference frequencies (1.1, 1.3, 1.7 and 1.9 GHz). Then, we smoothed the image chunks with the casa task imsmooth to gain the same restoring beam size (resolution). Lastly, in casaviewer, we extracted the flux densities from a circle of 0.7 kpc diameter centered at the radio core (consistent with the peak of radio intensity or the point from which the symmetrical jets/lobes are streaming out and are confirmed by the position of the center listed in the literature or NASA/IPAC Extragalactic Database (NED)999https://ned.ipac.caltech.edu/) and calculated the spectral indices as a slope of the log-log fit with the extracted flux densities on the y-axis and the corresponding frequencies on the x-axis.
Comparison between the two methods adopted to estimate the spectral index are shown in Figure 3 for the case of NGC 4472 and results appear in good agreement.
Although, the latter method is simpler, because the spectral index maps (‘alpha images’) are automatically created during the tclean task with the parameter nterms=2. For further analysis of spectral indices, we concentrate only on this approach.
4.2 X-ray Chandra Observations and Analysis
We use archival Chandra Advanced CCD Imaging Spectrometer (ACIS) observations first reported and described in Lakhchaura et al. (2018).
The archival Chandra observations were processed using the standard CIAO (v4.13; Fruscione et al., 2006) procedures and a most recent calibration files (CALDB 4.9.4). For galaxies observed multiple times, the individual observations were reprojected and merged. Most galaxies were observed in the VFAINT mode using the ACIS-S chip, however, for a couple of galaxies we combined the ACIS-S and ACIS-I observations and for some of the galaxies there were only ACIS-I observations available.
The observations were deflared using the lc_clean algorithm within the deflare routine. The images were generated from the merged observations using the fluximage procedure with a binsize of 1 pixel (0.492 arcsec). The images were background-subtracted using blanksky background files, which were scaled to match the observations in the keV band, and exposure corrected using the corresponding exposure maps. The point sources were found using the wavdetect tool, inspected visually and filled with a mean surrounding surface brightness using the dmfilth procedure (CIAO 4.13).
The two-dimensional surface brightness distribution of each image obtained by this procedure was modelled using a projected version (Ettori & Fabian, 2000) of a classical beta model (Cavaliere & Fusco-Femiano, 1976). The fitting was performed in the SHERPA (v4.13; Freeman et al., 2001) package using the Cash statistics (Cash, 1979) and Monte Carlo optimization method (Storn, 1995). The fitted models were subtracted from the original images and the resulting residual images were used for further analysis. Individual X-ray cavities were searched by eye using residual images and their reliability was checked using the Poisson statistics to be at least 4 under the surrounding background. The detection of these cavities is further supported by a novel machine learning method (a.k.a CADET; Plšek et al. in prep.).
5 Results
Here, we report the results of radio observations for a sample of 42 early-type galaxies (41 giant elliptical galaxies and 1 lenticular galaxy). Our sample contains the most optically and X-ray luminous early-type galaxies within the luminosity distance of 100 Mpc at declination that is accessible by the VLA (for more details see Section 2). All details are reported in Table 1.
| Source | Config | Distance | Scale | Radio | Extent | Beam | PA | e | e | RMS noise | |
|---|---|---|---|---|---|---|---|---|---|---|---|
| Name | VLA | (Mpc) | (kpc/) | Class | (kpc) | () | (deg) | (Jy/b) | (Jy) | (W/Hz) | (Jy/b) |
| 3C 449 | A | 0.352 | J/L | 36.6 | 78.2 | ||||||
| 3C 449 | C | 0.352 | J/L | 446.7 | 5.5 | ||||||
| IC1860 | A | 0.465 | PS | - | 8.9 | ||||||
| IC 4296 | A | 0.230 | J/L | 108.1 | -12.5 | ||||||
| IC 4296 | D | 0.230 | J/L | 437.0 | -7.7 | ||||||
| NGC 57 | A | 0.375 | PS | - | 70.1 | ||||||
| NGC 315 | A | 0.272 | J/L | 13.4 | 66.4 | ||||||
| NGC 315 | B | 0.272 | J/L | 154.2 | 82.0 | ||||||
| NGC 315 | C | 0.272 | J/L | 326.1 | -13.2 | ||||||
| NGC 410 | A | 0.320 | PS | - | 66.6 | ||||||
| NGC 499 | A | 0.295 | NS | - | -61.5 | - | - | - | |||
| NGC 507 | A | 0.290 | D | 13.2 | 67.9 | ||||||
| NGC 507 | C | 0.290 | D† | 36.0 | 62.8 | ||||||
| NGC 533 | A | 0.299 | C† | 1.1 | -62.3 | ||||||
| NGC 533 | B | 0.299 | C | 2.8 | -12.5 | ||||||
| NGC 708 | AB | 0.312 | D† | 15.0 | 89.6 | ||||||
| NGC 708 | C | 0.312 | D† | 38.6 | -72.7 | ||||||
| NGC 741 | A | 0.313 | D† | 16.1 | 50.9 | ||||||
| NGC 741 | C | 0.313 | C† | 137.7 | 0.2 | ||||||
| NGC 777 | A | 0.282 | C | 1.6 | 73.7 | ||||||
| NGC 777 | C | 0.282 | NS | - | 30.4 | - | - | - | |||
| NGC 1132 | C | 0.427 | PS | - | -7.4 | ||||||
| NGC 1316 | BA | 0.102 | J/L | 11.8 | 29.9 | ||||||
| NGC 1316 | CD | 0.102 | D | 257.7 | -28.5 | ||||||
| NGC 1399 | A | 0.098 | J/L | 22.5 | 13.6 | ||||||
| NGC 1404 | A | 0.097 | PS | - | 13.6 | ||||||
| NGC 1404 | CD | 0.097 | NS | - | 25.4 | - | - | - | |||
| NGC 1407 | A | 0.113 | D | 4.0 | 36.1 | ||||||
| NGC 1407 | B | 0.113 | D | 6.0 | -10.7 | ||||||
| NGC 1407 | C | 0.113 | D | 7.1 | -3.0 | ||||||
| NGC 1550 | A | 0.327 | C† | 10.1 | 56.3 | ||||||
| NGC 1550 | C | 0.327 | D† | 36.2 | -11.9 | ||||||
| NGC 1600 | A | 0.222 | D† | 4.0 | -3.5 | ||||||
| NGC 2300 | A | 0.201 | PS | - | 89.4 | ||||||
| NGC 2300 | D | 0.201 | PS | - | 15.2 | ||||||
| NGC 3091 | A | 0.235 | PS | - | -24.3 | ||||||
| NGC 3923 | A | 0.102 | PS | - | 5.0 | ||||||
| NGC 3923 | CD | 0.102 | NS | - | -88.2 | - | - | - | |||
| NGC 4073 | A | 0.292 | PS | - | -51.5 | ||||||
| NGC 4125 | D | 0.104 | PS | - | 17.7 | - | - | - | |||
| NGC 4261 | A | 0.141 | J/L | 7.9 | -22.9 | ||||||
| NGC 4261 | C | 0.141 | J/L | 55.5 | 51.8 | ||||||
| NGC 4374 | A | 0.090 | J/L | 4.3 | 47.6 | ||||||
| NGC 4374 | B | 0.090 | J/L | 13.3 | -4.5 | ||||||
| NGC 4374 | C | 0.090 | J/L | 18.7 | -45.2 | ||||||
| NGC 4406 | A | 0.087 | PS | - | -1.4 | ||||||
| NGC 4406 | D | 0.087 | NS | - | -6.0 | - | - | - | |||
| NGC 4472 | A | 0.081 | C† | 2.6 | -72.7 | ||||||
| NGC 4472 | C | 0.081 | D† | 12.4 | -32.6 | ||||||
| NGC 4486 | A | 0.081 | J/L | 4.4 | 49.1 | ||||||
| NGC 4486 | B | 0.081 | D† | 9.7 | -51.1 | ||||||
| NGC 4486 | C | 0.081 | D† | 46.5 | 0.8 | ||||||
| NGC 4552 | A | 0.078 | PS | - | 13.6 | ||||||
| NGC 4552 | C | 0.078 | C† | 7.8 | -26.5 | ||||||
| NGC 4636 | A | 0.077 | C | 2.9 | -74.7 | ||||||
| NGC 4636 | C | 0.077 | C | 3.7 | 116.7 | ||||||
| NGC 4649 | A | 0.080 | C | 0.3 | -8.5 | ||||||
| NGC 4649 | D | 0.080 | D† | 6.4 | -6.8 | ||||||
| NGC 4696 | A | 0.182 | D† | 7.9 | 8.5 | ||||||
| NGC 4696 | BC | 0.182 | D† | 10.9 | -34.6 | ||||||
| NGC 4778 | A B | 0.288 | PS | - | -41.5 | ||||||
| NGC 4778 | C | 0.288 | PS | - | -2.0 | ||||||
| NGC 4782 | A | 0.236 | J/L | 30.2 | -177.1 | ||||||
| NGC 4782 | BA | 0.236 | D† | 55.9 | 16.0 | ||||||
| NGC 4936 | A | 0.152 | PS | - | 12.9 | ||||||
| NGC 5044 | A | 0.174 | C† | 1.4 | -17.6 | ||||||
| NGC 5044 | BA | 0.174 | D† | 23.1 | -54.2 | ||||||
| NGC 5044 | D | 0.174 | D | 24.3 | 2.1 | ||||||
| NGC 5129 | A | 0.422 | C† | 4.0 | -5.5 | ||||||
| NGC 5419 | A | 0.247 | D | 6.1 | 16.4 | ||||||
| NGC 5419 | B | 0.247 | D | 13.5 | 0.6 | ||||||
| NGC 5419 | CD | 0.247 | D | 181.8 | 19.8 | ||||||
| NGC 5813 | A B | 0.142 | D | 2.7 | -33.3 | ||||||
| NGC 5813 | B | 0.142 | D | 4.1 | -21.9 | ||||||
| NGC 5813 | D | 0.142 | D | 19.5 | 20.2 | ||||||
| NGC 5846 | A | 0.132 | C | 4.2 | 8.3 | ||||||
| NGC 5846 | B | 0.132 | C | 2.7 | -20.3 | ||||||
| NGC 5846 | CD | 0.132 | D | 19.4 | -61.7 | ||||||
| NGC 7619 | A | 0.245 | C | 2.2 | 58.8 | ||||||
| NGC 7619 | C | 0.245 | PS | 104.2 | -47.0 |
Note. — (1) sources marked with ‘*’ are our new VLA A observations obtained within the project 15A-305; (3) distances marked with are based on redshift measurements; References: L:Lakhchaura et al. (2018); B:Blakeslee et al. (2009); M: Mieske et al. (2005); (5) radio morphological categories: J/L: jets/lobes; D: diffuse and D†: diffuse with signs of jet/lobe-like morphology; C: compact and C† with signs of small-scale jet/lobe-like morphology; PS: point source-like radio emission; NS: no radio source detected.
5.1 Multi-scale radio emission
5.1.1 Central radio emission
Our results show a high radio core101010A radio core is point-like radio emission within
twice the beam size located at the center of host galaxy. detection rate of (41/42) for the early-type galaxies in our sample within the frequency range between 1–2 GHz, centered at 1.5 GHz (Table 1).
For the remaining galaxy, NGC 499, no central radio emission has been detected in the available VLA observations in the L-band (1–2 GHz). However, an archival single-dish Arecibo observation at 2.38 GHz (Dressel & Condon, 1978), an observation by the NVSS survey at 1.4 GHz (Brown et al., 2011, although, only with a 2 detection) and most recently a low-frequency observation with LOFAR (Bîrzan et al., 2020) detect a faint nuclear point-like radio source in the centre of NGC 499. Thus, due to the previously confirmed presence of radio emission from NGC 499 in the above-mentioned studies, the detection rate in our sample could be considered to be 100.
The non-detection of the radio emission from NGC 499 in the highest resolution VLA A configuration data could be due to the shallow observations with a resulting RMS noise of 12.0 Jy/beam, which is twice the sensitivity limit for our faintest detected radio source in our sample: NGC 4406 (Table 1). Observations with LOFAR at 150 MHz detected a radio core with a total integrated flux density of 0.0460.009 Jy. Assuming a spectral index of about -0.7, we estimate that NGC 499 would have a radio source with the total flux density of 0.009 Jy at 1.5 GHz, which is still above the threshold of the archival VLA A observation, potentially indicating a steeper spectrum. We note that the much higher flux density of 0.26 Jy reported by Condon & Broderick (1988) at 1.4 GHz frequency does not agree with all other available radio measurements.
5.1.2 Extended radio emission
For 67 (28/42) of the galaxies in our sample, we detect a diffuse, extended morphology.
It is worth noting that we present only a lower limit for the number of galaxies with extended radio emission. Due to our main interest in detecting the radio cores, the highest resolution A configuration data are prioritized. Sensitivity to the diffuse, extended emission was sacrificed at the expense of the higher resolution of the fine structures in the central region. The more compact configuration observations (C or D) are missing for a fraction of sources (11 sources out of 42) in our sample.
5.2 Radio morphology
The morphology of the radio emission at 1–2 GHz varies widely within our sample of early-type galaxies.
On the one hand, the total intensity radio maps reveal well-collimated large-scale radio jets and lobes extending up to hundreds of kiloparsecs (e.g. NGC 315 ; Figure B2.1c) or small-scale jets residing within a few kpc from the radio nucleus (e.g. NGC 5129; Figure B2.3h). On the other hand, we also observe many galaxies, where the jets and lobes are disturbed by the influence of the surrounding hot gas or interaction with other galaxies: narrow or wide angle tails (e.g. NGC 507; Figure B2.1d; and IC 4296; Figure B2.1b), tails tracing the path of the interaction with another galaxy (e.g. NGC 741; Figure B2.1g), S-shaped radio emission (e.g. NGC 1316; Figure B2.2a), diffuse morphology with no clear jets or lobes (e.g. NGC 1407; Figure B2.2c) and relic-like large-scale diffuse emission (e.g. NGC 5419; Figure B2.4a). A more detailed definition of our categories is given in Section 3.
For IC 4296 (Figure B2.1b), NGC 57 (Figure B1.1b), NGC 533 (Figure B2.1e), NGC 1550 (Figure B2.2d), NGC 4261 (Figure B2.2f), NGC 4374 ( Figure B2.2g), NGC 4472 (Figure B2.2h), NGC 4552 (Figure B2.3b), NGC 5129 (Figure B2.3h) and NGC 5419 (Figure B2.4a), we found new, previously unobserved and undescribed radio morphology at the high resolution of about 1–2 arcseconds in the frequency range of 1–2 GHz (red contours in Figures in Appendix B.2).
Details of radio morphologies together with relevant information on the multifrequency data for each source individually are given in Appendix A.
5.3 Comparison with X-ray data
5.3.1 X-ray cavity rate
The hot X-ray emitting atmospheres embedded in galaxies are closely related to the activity of their central radio-emitting AGN (e.g.: McNamara et al., 2005; Werner et al., 2019).
In our sample, we compared Chandra X-ray images with the total intensity radio images searching for signatures of interaction as X-ray cavities. We reported also all known X-ray cavities from the literature.
We also detected X-ray cavities for 7 sources with only point-like radio morphology and for NGC 499 (Panagoulia et al., 2014; Kim et al., 2019). Cavities in NGC 1132 and NGC 4778, which host point-like radio sources were previously detected by Dong et al. (2010) and Morita et al. (2006). Additionally, Plšek et al. (in prep.) found potential cavities for another five point-like radio sources: NGC 2300, NGC 3091, NGC 3923, NGC 4073, NGC 4125 (see Discussion 6.5.2 for more details).
In our sample we can summarize that 34 out of 42 (81) early-type galaxies show detectable X-ray cavities in their hot X-ray atmospheres.
5.3.2 Central X-ray point source rate
In the parent X-ray study, Lakhchaura et al. (2018) found nuclear X-ray point sources for 32 of early-type galaxies (16 out of 49 in their study), from which 14 X-ray point sources are relevant to our study.
It is worth noting that while radio emission is detected in 98(–100) of the sources from our sample, only about 33 (14/42) of the systems also host a detectable central X-ray point source.
5.4 Multifrequency correlations
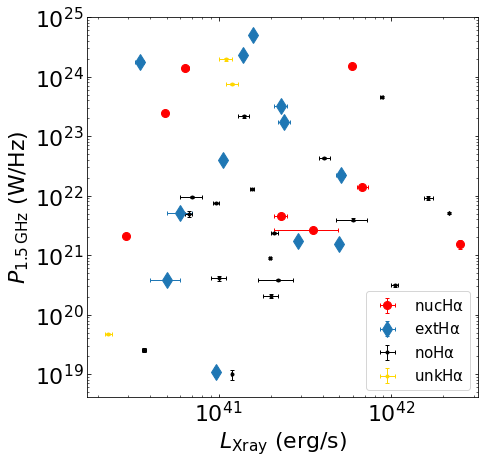
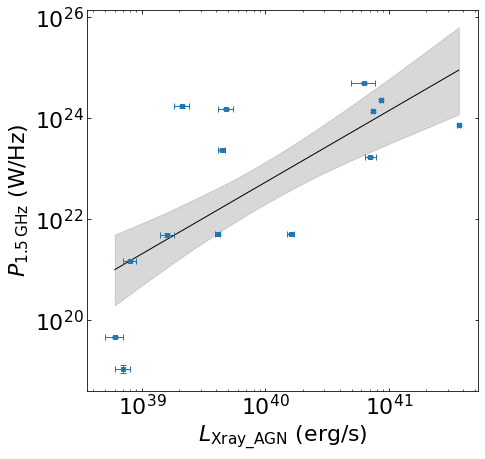
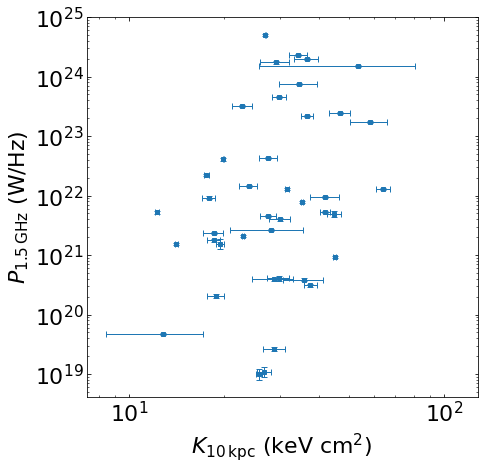
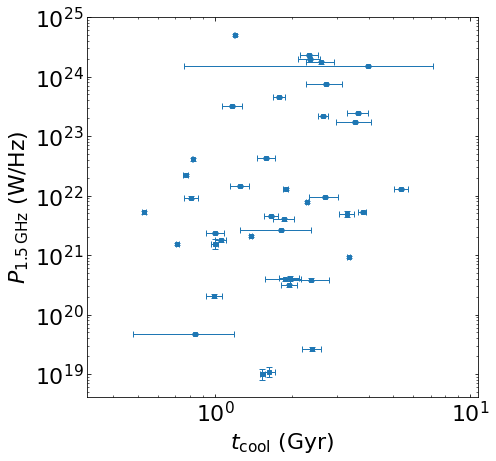
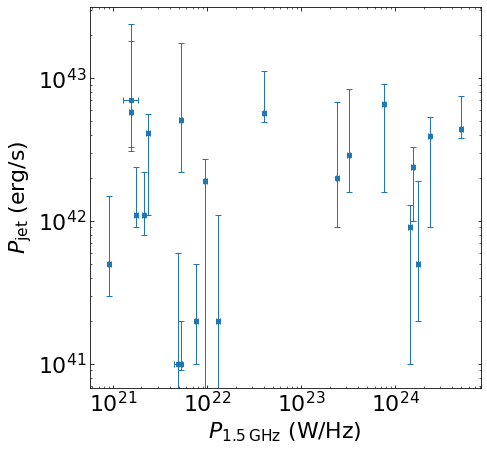
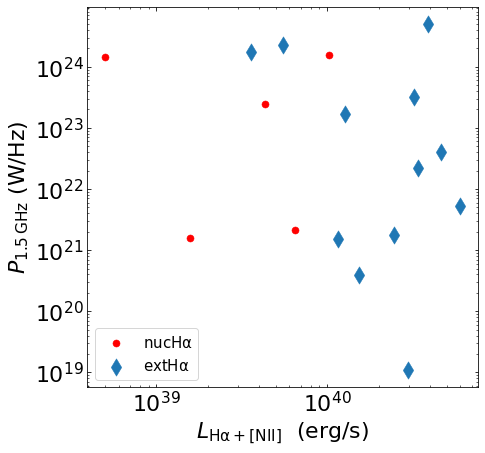
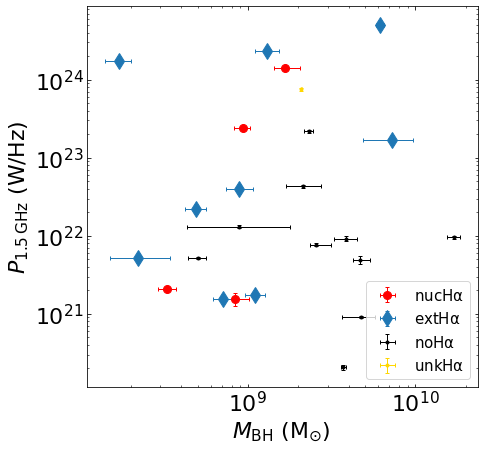
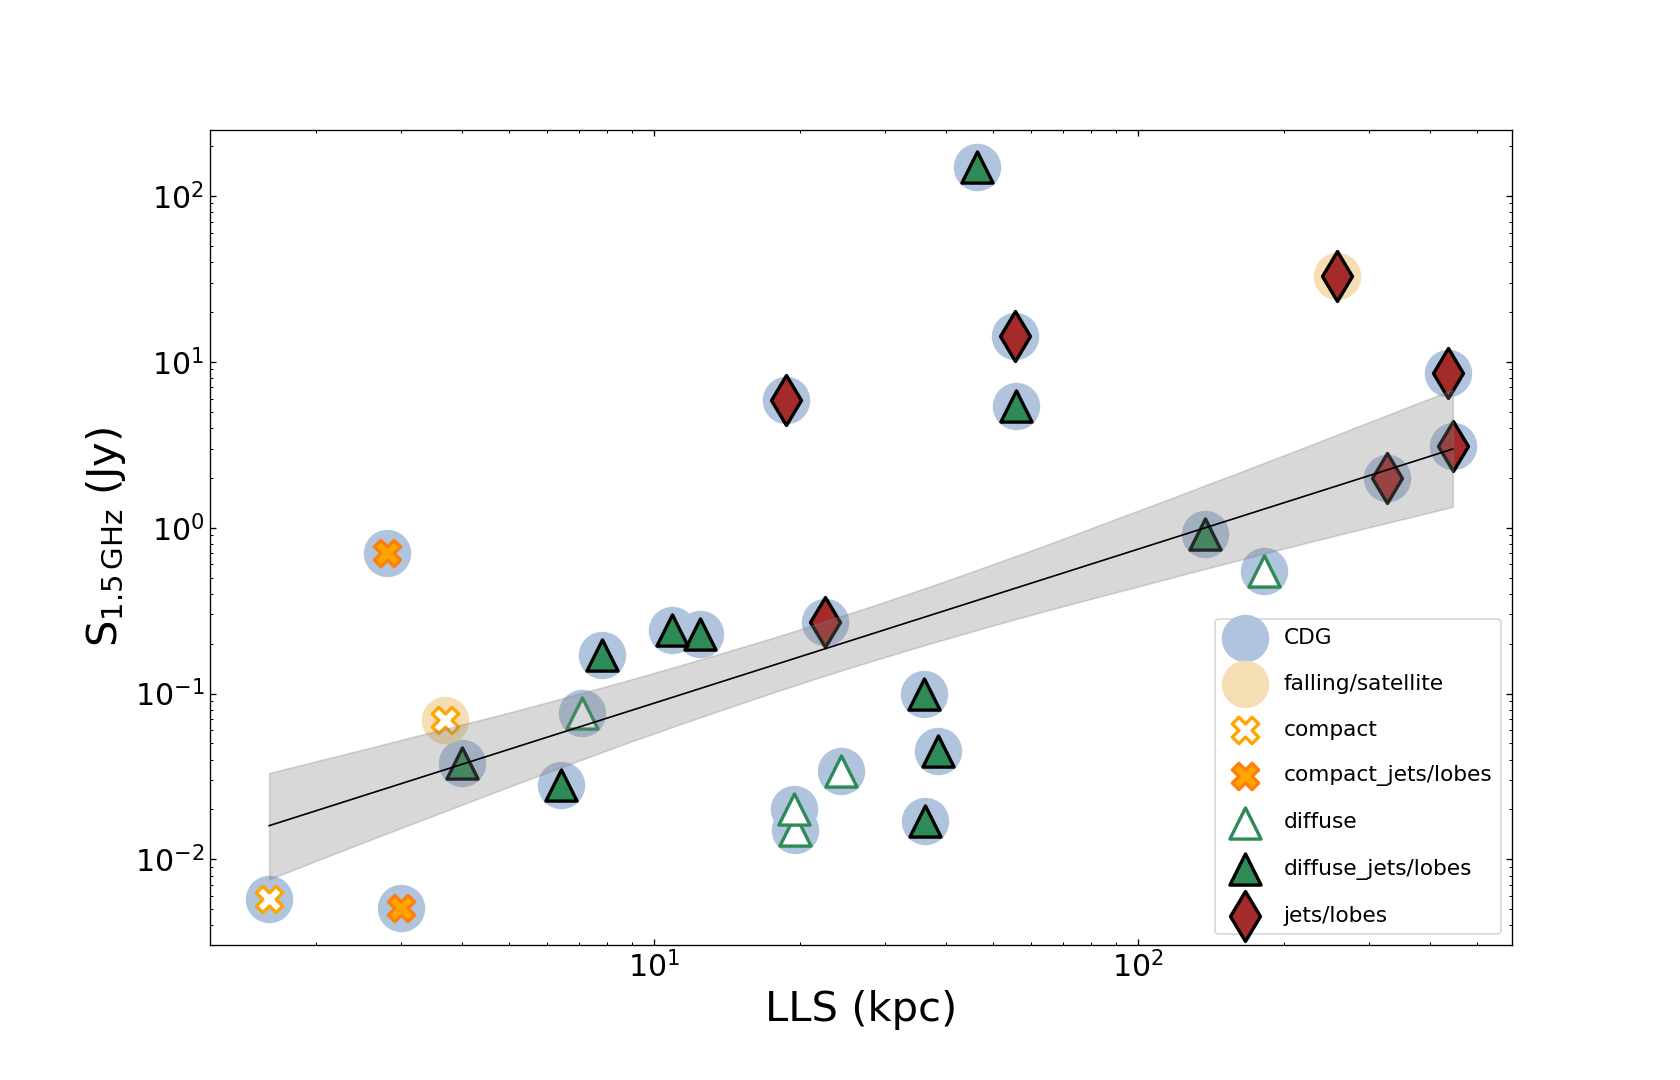
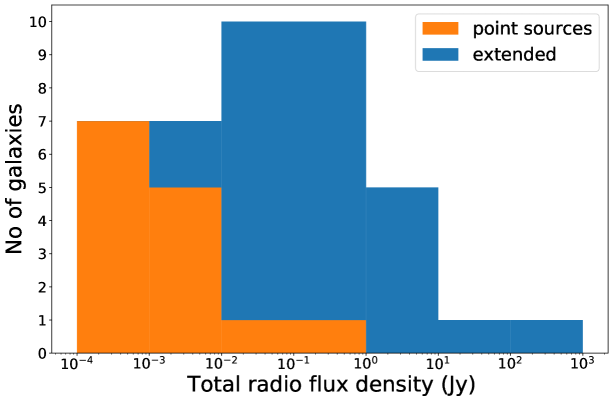
We investigate the correlations and trends between the radio power at 1.5 GHz () and the X-ray luminosity within 10 kpc from the center of the galaxy (Figure 4; top), the luminosity of the central X-ray point source or AGN (Figure 4; bottom), entropy and cooling time of the hot X-ray emitting gas (Figure 5; top and bottom, respectively), the power of the jet estimated from X-ray cavities (Figure 6; top), the luminosity of H[N II] nebulae (Figure 6; middle), the mass of the central supermassive black hole (Figure 6; bottom), and the largest linear size of the radio emission (Figure 7). Moreover, the flux density distribution for point-like and extended radio sources is presented in Figure 8.
The details of the H[N II] nebulae emission extent and other information about multiphase gas is given in Appendix C.2 and Table C2.
The Spearman and Pearson correlation coefficients are used to derive the trends between two investigated quantities without accounting for the measurement uncertainties. Moreover, a Bayesian approach to linear regression taking into account the corresponding measurement uncertainties for both and variables, as well as the upper limits was used within the linmix package111111https://github.com/jmeyers314/linmix (Kelly, 2007).
The statistical significance of the trends is represented by the probability derived from the null hypothesis test (i.e., the -value).
| Investigated | Spearman | Pearson | linmix | |||||
|---|---|---|---|---|---|---|---|---|
| Relations | Fitted points | -value | -value | |||||
| vs. | ||||||||
| all | ||||||||
| nuc/extH | ||||||||
| no H | ||||||||
| all | ||||||||
| all | ||||||||
| all | ||||||||
| all | ||||||||
| all | ||||||||
| all | ||||||||
| nuc/extH | ||||||||
| no H | ||||||||
| vs. | all | |||||||
Significant trends, with Spearman and Pearson correlation factor of 0.71 and corresponding -value of 0.004 are obtained when comparing the radio power with the luminosity of the central X-ray point source (Figure 4; bottom) and the radio flux density with the largest linear size of the detected radio emission (Figure 7).
Negligible correlations are found when comparing the radio power with the jet power required to inflate the cavities; the luminosity of the X-ray atmosphere (Figure 4; top), and the luminosity of the warm ionized nebulae, traced by H[N II] line emission (Figure 6; middle), the mass of the supermassive black hole (Figure 6; bottom) as well as various thermodynamical properties of the X-ray emitting hot gas like entropy (Figure 5; top) and cooling time (Figure 5; bottom) (Lakhchaura et al., 2018).
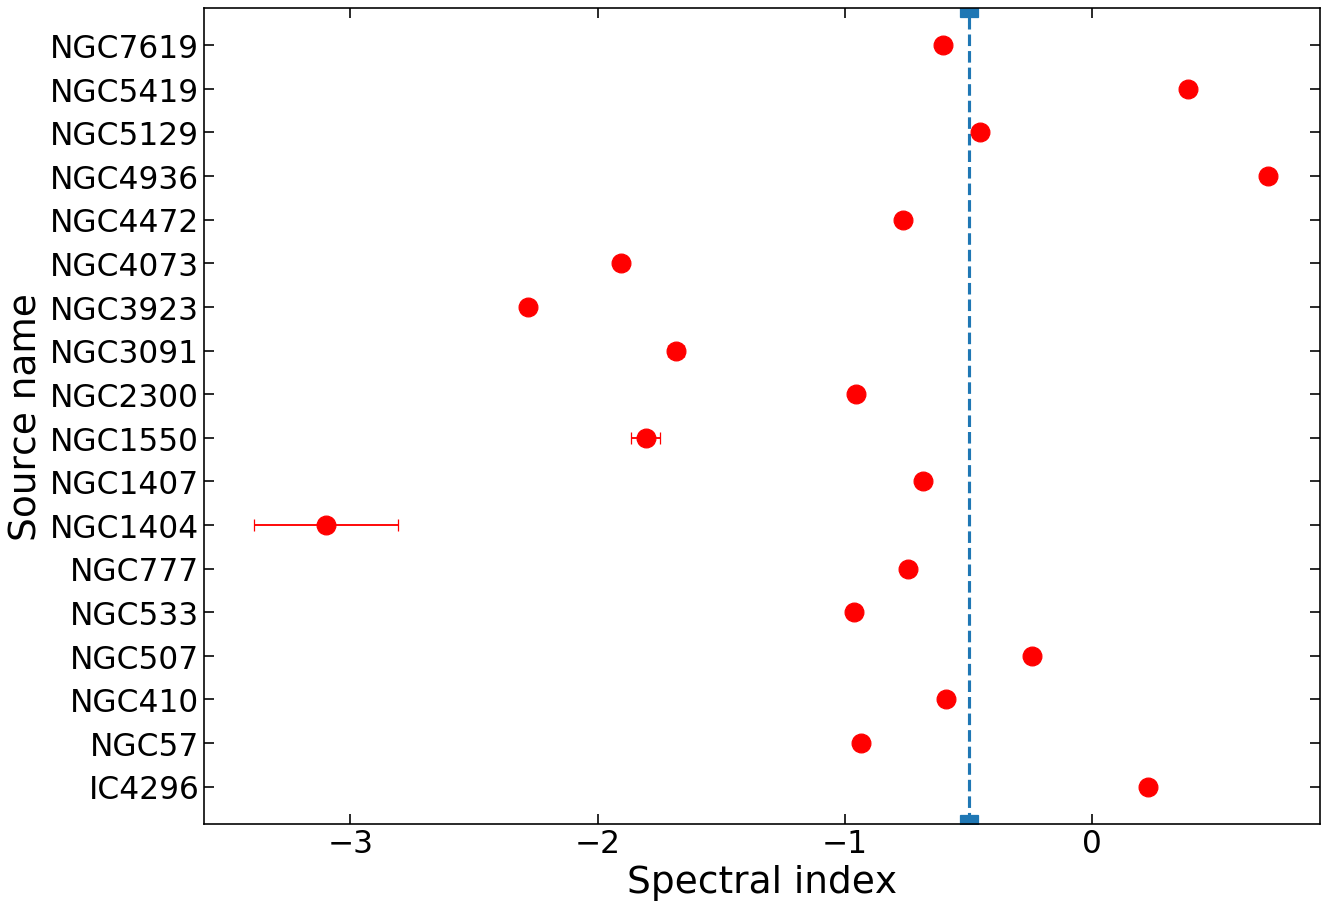
5.5 Nuclear spectral indices
To estimate the age of the radio emitting plasma in the innermost central regions (within 0.7 kpc radius of the radio core) of the early-type galaxies, we determined in-band spectral indices for 18 out of 42 galaxies observed with the upgraded VLA A configuration. The description of the approach we used to determine the spectral indices for the subsample of our galaxies can be found in Section 4.1.4.
The final central spectral indices are presented in Table 3 and Figure 9. Interestingly, about 1/3 of our sources have inverted or flat radio spectra (), while the majority showed steep spectral indices (). This result is consistent with a scenario where some of the sources were recently active, while for some, the spectral shape is in agreement with synchrotron cooling.
| Source | Spectral index |
|---|---|
| IC 4296 | 0.2240.005 |
| NGC 57 | -0.9340.014 |
| NGC 410 | -0.6980.055 |
| NGC 507 | -0.2890.058 |
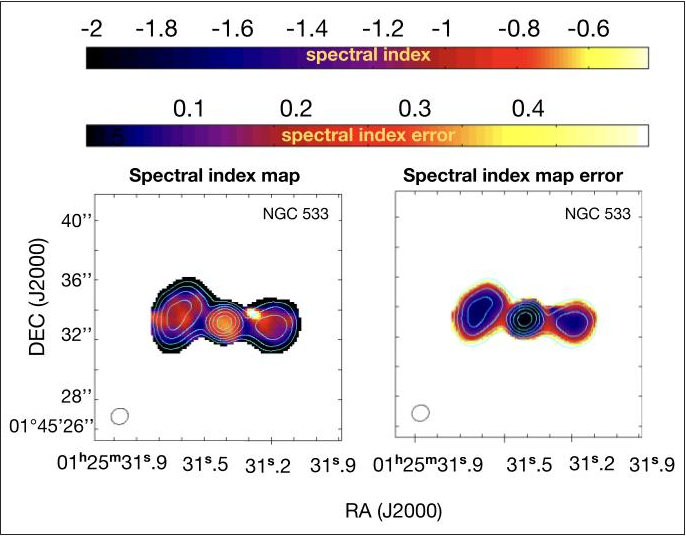
| NGC 533 | -0.9780.068 |
| NGC 777 | -0.7570.080 |
| NGC 1404 | -2.5540.621 |
| NGC 1407 | -0.7270.025 |
| NGC 1550 | -1.6280.387 |
| NGC 2300 | -0.9540.004 |
| NGC 3091 | -1.2590.227 |
| NGC 3923 | -2.0740.851 |
| NGC 4073 | -0.6470.053 |
| NGC 4472 | -0.5480.228 |
| NGC 4936 | 0.4910.042 |
| NGC 5129 | -0.5060.006 |
| NGC 5419 | 0.3420.002 |
| NGC 7619 | -0.6140.014 |
6 Discussion
6.1 High detection rate
The early-type galaxies in our sample show a very high radio detection rate at frequencies between 1–2 GHz. For 41 out of the sample of 42 galaxies, we detected at least point-like emission in the central region. A significant fraction, 27/42 galaxies, shows extended radio emission from jets and lobes. For 26 out of these 42 galaxies, the presence of X-ray cavities was detected. Moreover, X-ray cavities were also detected for 8 sources without jets/lobes. Altogether, 34 sources show signatures of interaction with the X-ray emitting medium. This suggests that most of these systems are operating in the radio-mechanical or maintenance mode AGN feedback.
Our high detection rate of radio sources appears to be consistent with previous findings (e.g.: Dunn et al., 2010; Brown et al., 2011; Sabater et al., 2019). At first glance, these results indicate a very high AGN duty cycle. It is, however, worth noting that the detected extended radio emission does most likely not always represent the current state of AGN activity and is often a remnant from a previous cycle.
6.2 Origin of radio emission
To investigate whether the origin of the observed radio emission is solely related to AGN activity or could also be linked to star formation121212Especially for low luminosity galaxies with no significant extended emission known as FR 0s (Baldi et al., 2015), the synchrotron emission at GHz frequencies could also be due to particles accelerated in star forming regions (see e.g., Condon, 1992; Lacki & Thompson, 2013), we follow the analysis of Kolokythas et al. (2018). We determine the far-ultraviolet (FUV) fluxes of the galaxies with point-source-like radio emission using the Galaxy Evolution Explorer (GALEX) Survey GR6 catalog131313https://galex.stsci.edu/GR6/?page=mastform to estimate the star formation rate (SFR) (Bell, 2003), from which we determine the expected radio power (Salim et al., 2007). If the expected radio power from the FUV estimated SFR is at least half of the observed radio power, star formation could potentially be the dominant radio emission mechanism.
Our analysis shows that for 5 out of the 14 galaxies with point-like radio morphology, namely NGC 1404, NGC 3091, NGC 3923, NGC 4073 and NGC 4406, star formation could dominate the observed radio emission (see Table 4). However, 3/5 sources where the radio emission could potentially be dominated by star-formation activity, also host ghost cavities, indicating that radio-mode AGN activity is also present in these galaxies (see Section 6.5.2). Importantly, 7/14 point-like galaxies display cavities indicating that despite the lack of extended radio structures at 1–2 GHz, these galaxies host a radio AGN capable of inflating lobes and cavities. The two galaxies, which lack observable signatures of radio mode AGN feedback are NGC 1404 and NGC 4406, which are falling through and being stripped by the ICM of the Fornax and Virgo clusters, respectively.
Using FUV fluxes as an indicator of star formation, Kolokythas et al. (2018) found that for 5 of the 26 galaxies in their high richness subsample of the Complete Local-volume Groups Sample (CLoGS), the star formation could have a significant contribution to the radio emission.
| Source | FUVflux (a) | SFRFUV | 50 of | |
|---|---|---|---|---|
| Name | (Jy) | (10-2 /yr) | (W/Hz) | (W/Hz) |
| IC1860 | ||||
| NGC 57 | ||||
| NGC 410 | ||||
| NGC 410 | ||||
| NGC 1132 | ||||
| NGC 1404 | ||||
| NGC 1404 | ||||
| NGC 1404 | ||||
| NGC 1404 | ||||
| NGC 2300 | ||||
| NGC 2300 | ||||
| NGC 3091 | ||||
| NGC 3091 | ||||
| NGC 3923 | ||||
| NGC 3923 | ||||
| NGC 4073 | ||||
| NGC 4073 | ||||
| NGC 4125 | ||||
| NGC 4406 | ||||
| NGC 4406 | ||||
| NGC 4406 | ||||
| NGC 4936 | ||||
| NGC 7619 | ||||
| NGC 7619 | ||||
| NGC 7619 |
Note. — (a) Multiple measurements of the FUV flux were found in the catalogue for some sources.
6.3 AGN duty cycle
To study the duty cycle of radio mode AGN activity in more detail, we estimate the spectral indices in the nuclear regions for a subsample of our early-type galaxies (Table 3). The distribution of the central spectral indices could help us place better constraints on the duty cycle of the AGN.
From in-band VLA analysis of the mean spectral indices of the radio emission within 0.7 kpc from the central region, we determined that approximately 1/3 of the sources have a relatively flat () spectral index. The rest of the galaxies have steep spectra. This result indicates that the age of the radio emitting plasma in the centres of these galaxies spans a range of values and while the radio mode AGN activity is variable, it has a relatively high duty cycle.
This analysis could also motivate a more in-depth investigation of the nuclear activity of these AGN. For example, higher resolution VLBI observations would offer a closer look at the central regions and their most recent state of activity. From our sample, an example is provided by the recently active source NGC 5044, where Schellenberger et al. (2020b) confirm ongoing jet activity using VLBA and summarize the presence of multiple generations of X-ray cavities.
Another example in the sample is NGC 1407, where we see a small-scale young jet in the core (Giacintucci et al., 2012). A recent study of NGC 1316 (Maccagni et al., 2021) using the upgraded Karoo Array Telescope (MeerKAT), as well as VLA and ALMA data, found a highly variable central radio source in the last three cycles of its activity. One cycle, forming large diffuse radio lobes, could have started around 20 Myr ago. The second cycle started possibly around 3 Myr ago, forming a flattened S-shaped structure. The current activity appears to be 1 Myr old.
6.4 Correlations with radio power
We investigated the possible correlations between the radio power and the X-ray luminosity of the hot halo as well as the central point source, the thermodynamical properties of the hot gas, the H[N II] luminosity, and the jet power calculated from the X-ray cavities and between the radio flux density and the largest linear size of the radio emission (Table 2 and Figure 4, 5, 6, 7).
We see a significant correlation with Spearman and Pearson coefficient of 0.64 with -value of 0.004) between the total radio flux density and the largest linear size of the radio emission. The larger the total extent of the radio emission, the more powerful the source is (Singal, 1993; Lara et al., 2001; Shabala & Godfrey, 2013; Tang et al., 2020). While the distances of our sources span a factor of 6, the radio fluxes span four orders of magnitude. The range of radio power is thus too large to be accounted for by the more powerful sources being more distant.
Similarly, a significant correlation with Spearman and Pearson coefficient of 0.71 with the -value of 0.004) is found between the radio power and the X-ray luminosity of the central X-ray point source141414To take into account biasing due to the same D dependence, we compared X-ray luminosity of the atmosphere () within 10 kpc radius from the core with the radio flux () instead of the radio power (), resulting in a slightly lower correlation coefficient of 0.61 and -value of 0.01. The correlation is consistent with a scenario where the X-ray emission comes from an unresolved X-ray jet or the base of the jet.
The relation between the luminosity of the hot X-ray atmospheres within 10 kpc radius from the central region and the radio power at 1.5 GHz shows no correlation. The lack of trends could, at the first glance, appear surprising. It is worth noting that the lack of any trend detected here could be affected by the limited range of X-ray luminosities in the innermost regions up to radius of 10 kpc spanning over approximately one order of magnitude in comparison with a large span of radio power values ( 6 orders of magnitude; Figure 4; left). Moreover, for a stable continuous accretion of the hot atmospheric gas, at a given black hole mass, one would expect higher accretion rates and thus more powerful jets for lower entropies and shorter cooling times. However, the gas with typical cooling times seen in early-type galaxies is expected to be thermally unstable (e.g. Fabian & Nulsen, 1977; Nulsen, 1986). Assuming that the ambient medium cools and forms dense clouds with very small volume filling fractions that fall toward the central black hole, the accretion rate can for short moments rise by orders of magnitude, triggering a feedback response (Gaspari et al., 2013; Voit et al., 2015; McNamara et al., 2016). Since the infall of dense clouds with a range of masses is essentially chaotic, the power of a given triggered outbursts can also have a range of values. Thus, we are not expecting any trend between the thermodynamic properties of the atmospheric gas and the observed radio emission.
The radio power showed no correlation with the radio power and the jet power computed using X-ray cavities (Lakhchaura et al., 2018, and references therein) and H[N II] luminosity (Lakhchaura et al., 2018) and the mass of the central supermassive black hole151515The supermassive black hole masses were adapted from Kormendy & Ho (2013) and Saglia et al. (2016) using direct measurements and from Lauer et al. (2007) and Makarov et al. (2014), who derived the masses from the scaling relations and taken from (Lakhchaura et al., 2018)..
The H[N II] emitting gas represents only a fraction of the cold/warm gas mass in the centres of these galaxies and the observed nebulae are not necessarily located in the vicinity of the supermassive black hole. Therefore, the lack of correlation is not entirely surprising. Results of the statistical analysis are consistent with previous ones found in the literature (Franceschini et al., 1998; Liu et al., 2006). Weak correlations with CO emitting cold molecular gas have previously been observed by Babyk et al. (2019).
6.5 Interaction with the X-ray gas
6.5.1 Widening radio jets
One of the signatures of the interaction between the radio plasma and the hot X-ray gas could be seen in the widening of the jets after they pierce through the relatively dense galactic atmosphere.
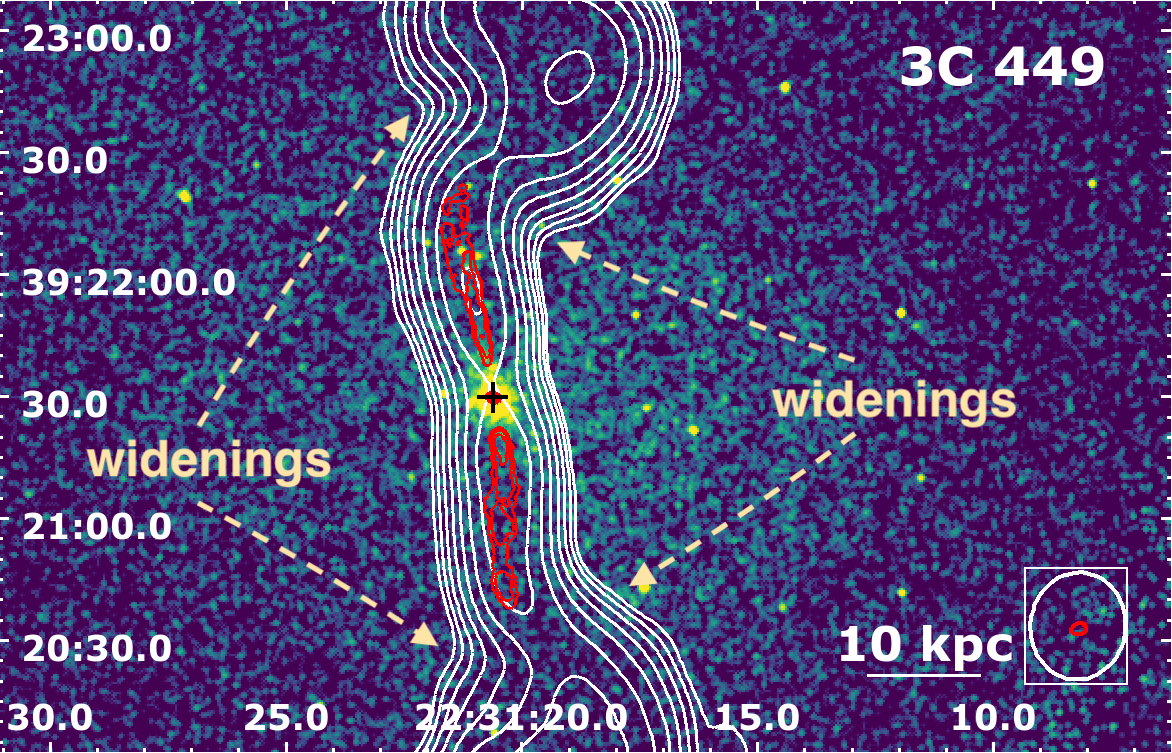
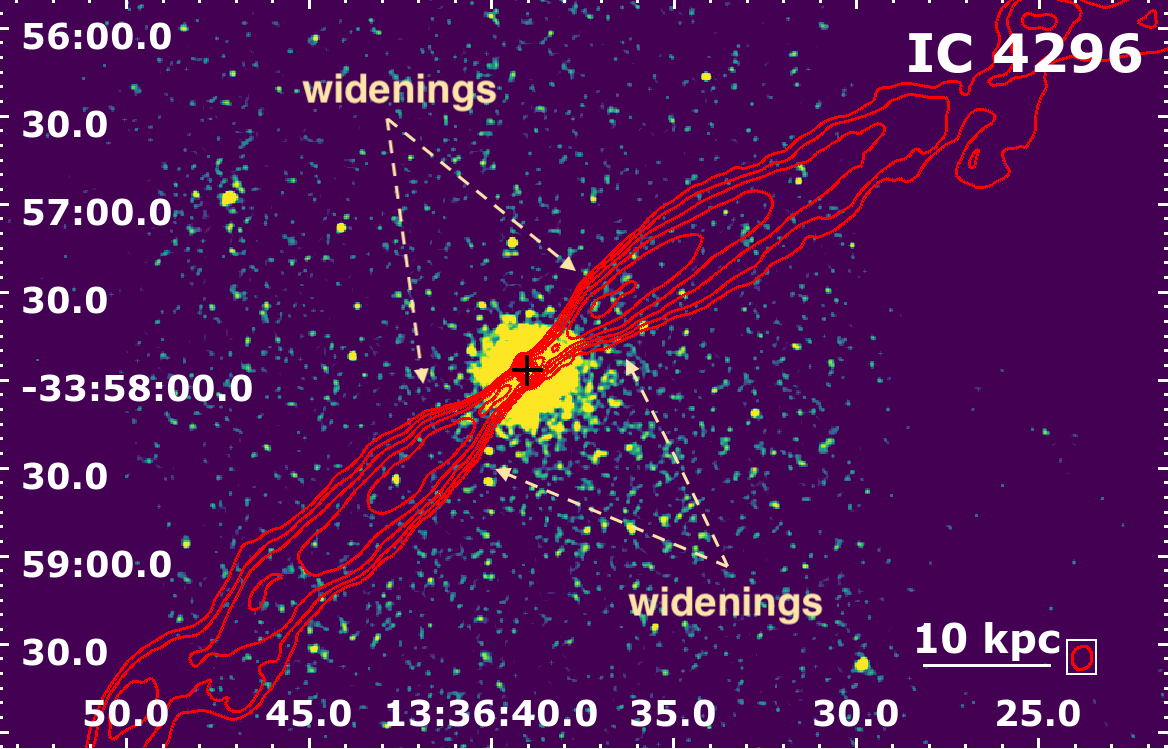
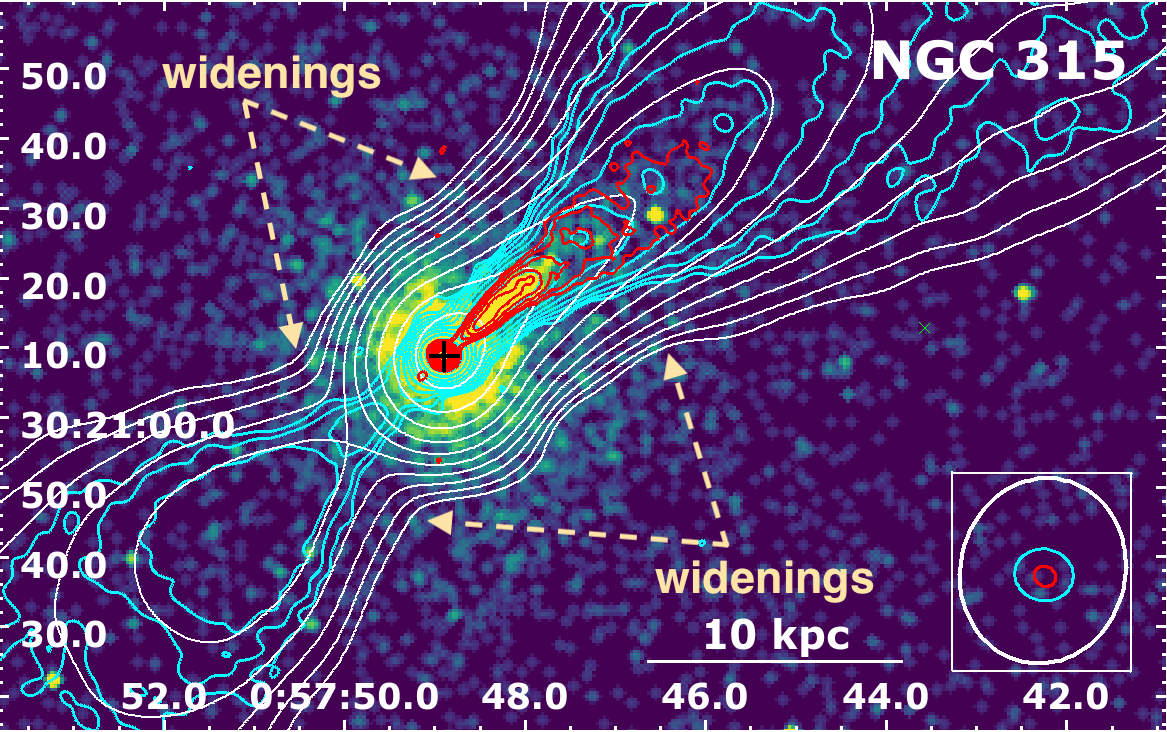
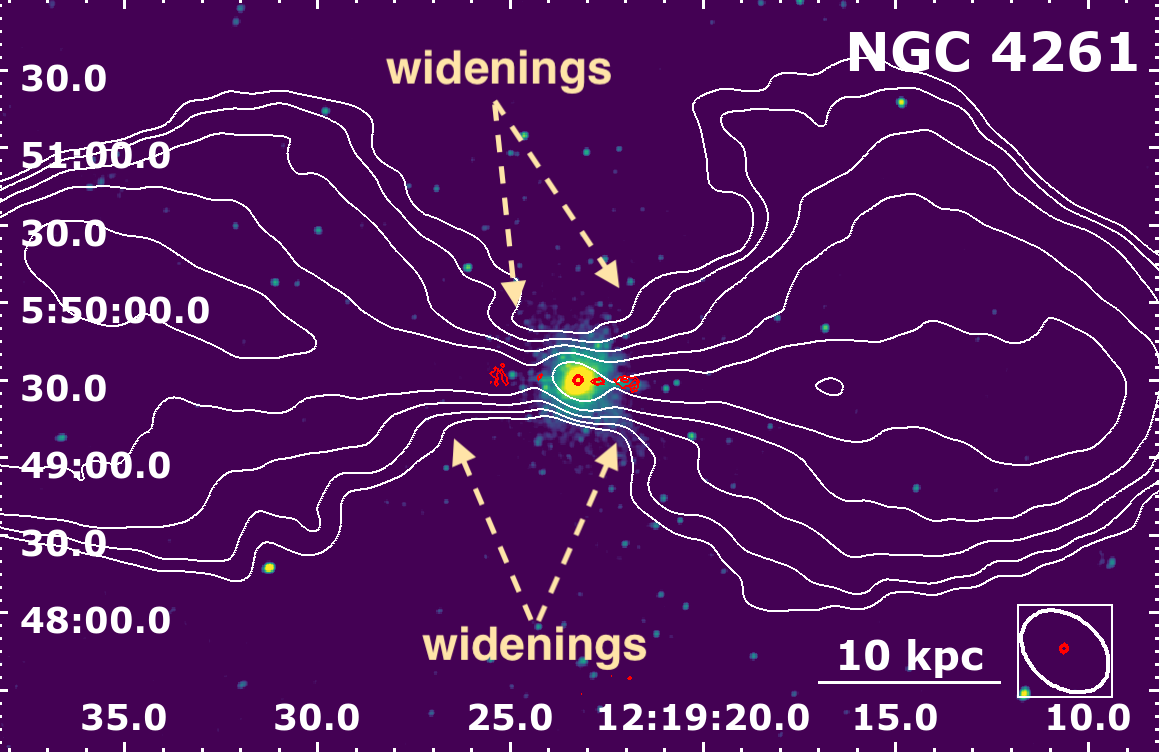
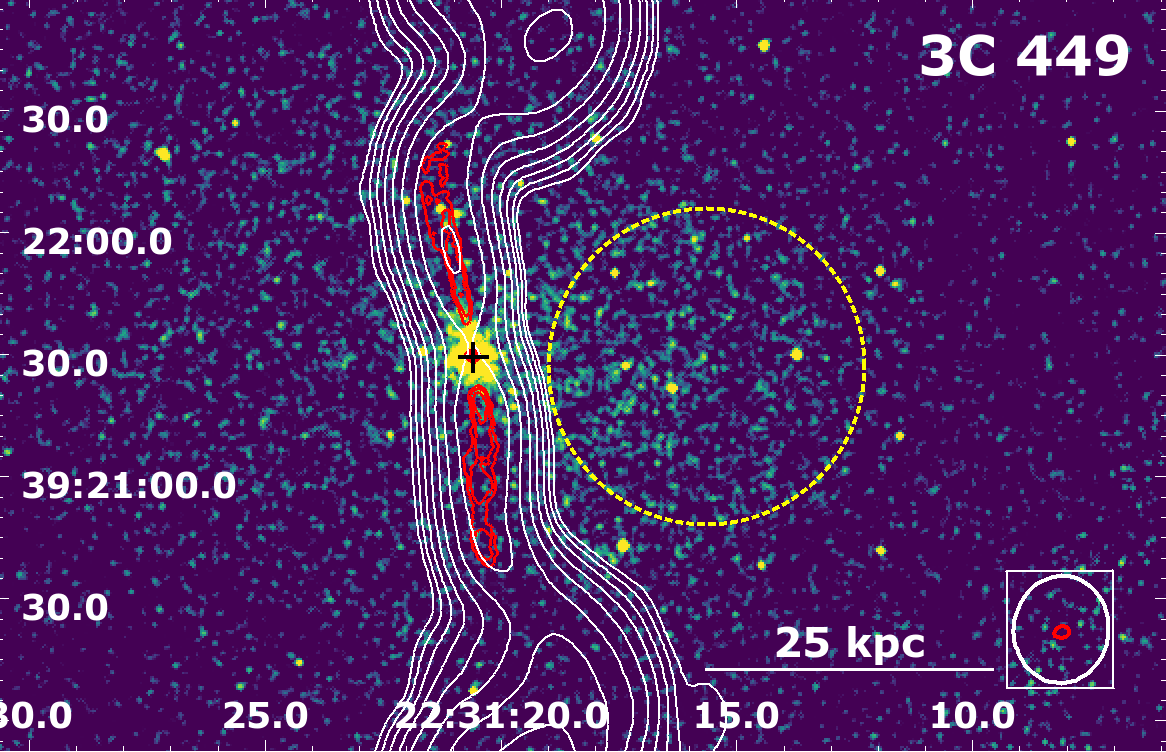
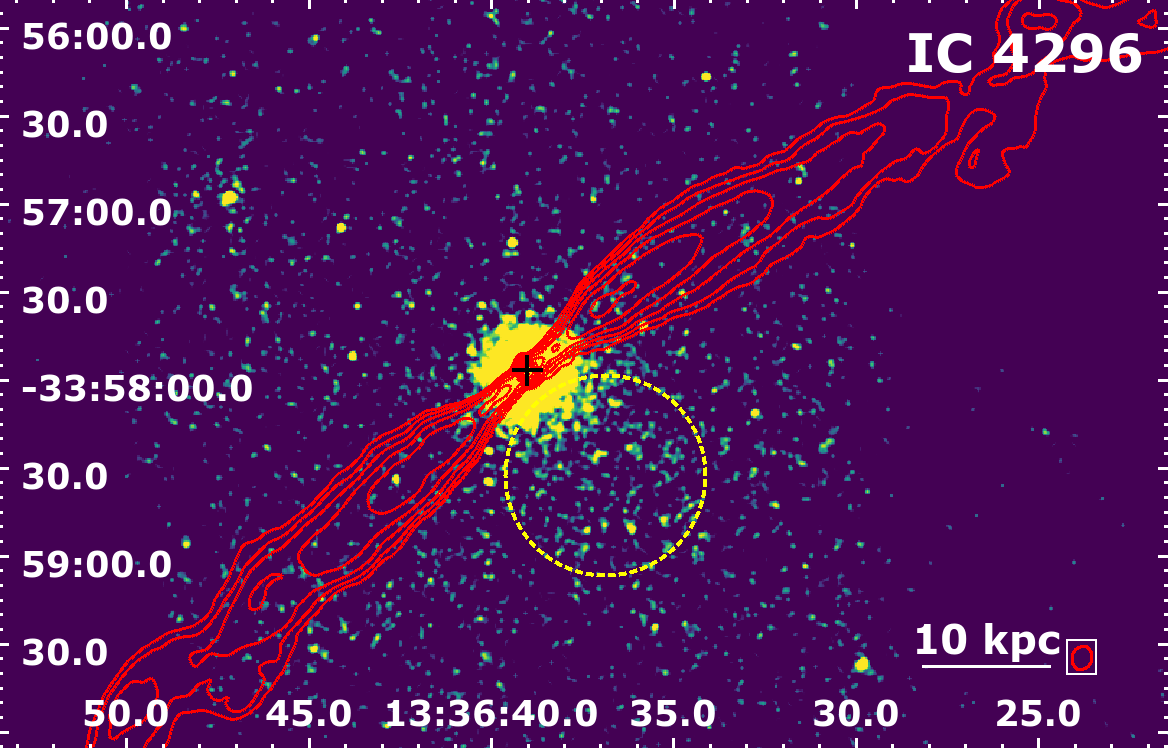
The radio contours in 3C 449, NGC 315, NGC 4261 and IC 4296161616The mechanism was described for IC 4296 by e.g.: Killeen & Bicknell (1988); Grossová et al. (2019) (Figure 10) widen significantly at about 10-20 kpc as the relativistic plasma in jets is released from the higher pressure environment of the hot X-ray gas. In other words, if the ambient gas pressure drops below a certain value, then the jets can widen significantly.
The widening and the corresponding brightening of the jets could be connected to the lower ambient ICM pressure and possibly to additional thermal energy from the interaction of the radio and X-ray plasma that will increase the pressure of the radio jet causing it to expand (e.g. Gizani & Leahy, 1999).
6.5.2 Ghost X-ray cavities
Evidence for the past interaction between the radio and X-ray plasma, in the form of ‘ghost’ cavities171717In some systems the relativistic radio emitting plasma filling the cavities has aged and stopped produce detectable 1–2 GHz radio emission, giving rise to ‘ghost’ cavities., was also observed in the giant elliptical galaxy NGC 499 (Panagoulia et al., 2014; Kim et al., 2019), which is the only galaxy in our sample with a non-detection of a radio source at 1–2 GHz (Section 5.1.1) using our VLA data. Similarly, X-ray cavities have been observed in seven galaxies with only a central point source in radio. Those previously known are: NGC 1132 (Dong et al., 2010) and NGC 4778 (Morita et al., 2006). Additionally, Plšek et al. (in prep.) found potential cavities for another five sources: NGC 2300, NGC 3091, NGC 3923, NGC 4073, and NGC 4125.
The lack of radio emission filling the volume of X-ray cavities is most likely due to the old, aged plasma present in lobes. Assuming the lobes rose and expanded at the sound speed of 1 keV gas, then the radio plasma in the ghost cavities has aged at the time scales Myr thus barely visible at the observed radio frequencies unless other mechanisms occur.
6.5.3 Possible X-ray tail
We observe an X-ray tail in the so-called cross-cone region between the jets (yellow circles in the images of IC 4296 and 3C 449; Figure 11) due to the relative motion of the intracluster/group medium and the centrally located jetted galaxy in a system that experiences ICM sloshing. With a large opening angle of the jets and the presence of potential ’warm‘ spots, the galaxies can be categorised as Wide Angled Tail (WAT) galaxies (e.g.: Owen & Rudnick, 1976; O’Donoghue et al., 1990; Leahy, 1993; Missaglia et al., 2019).
.
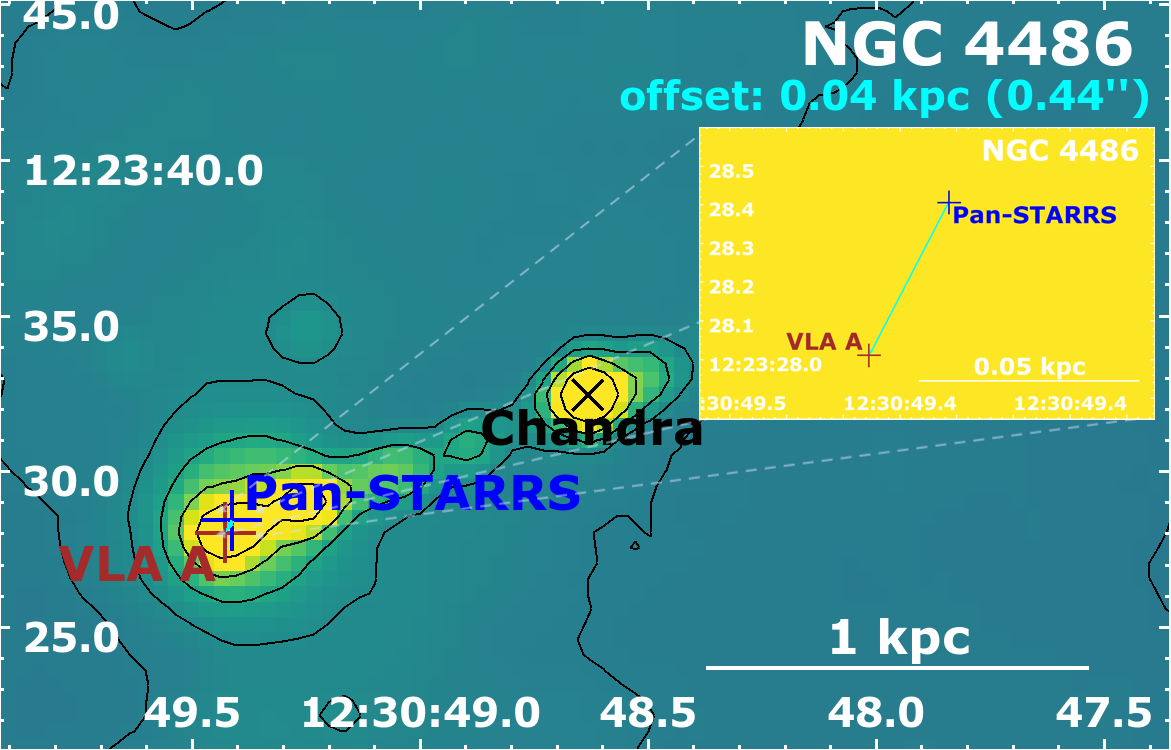
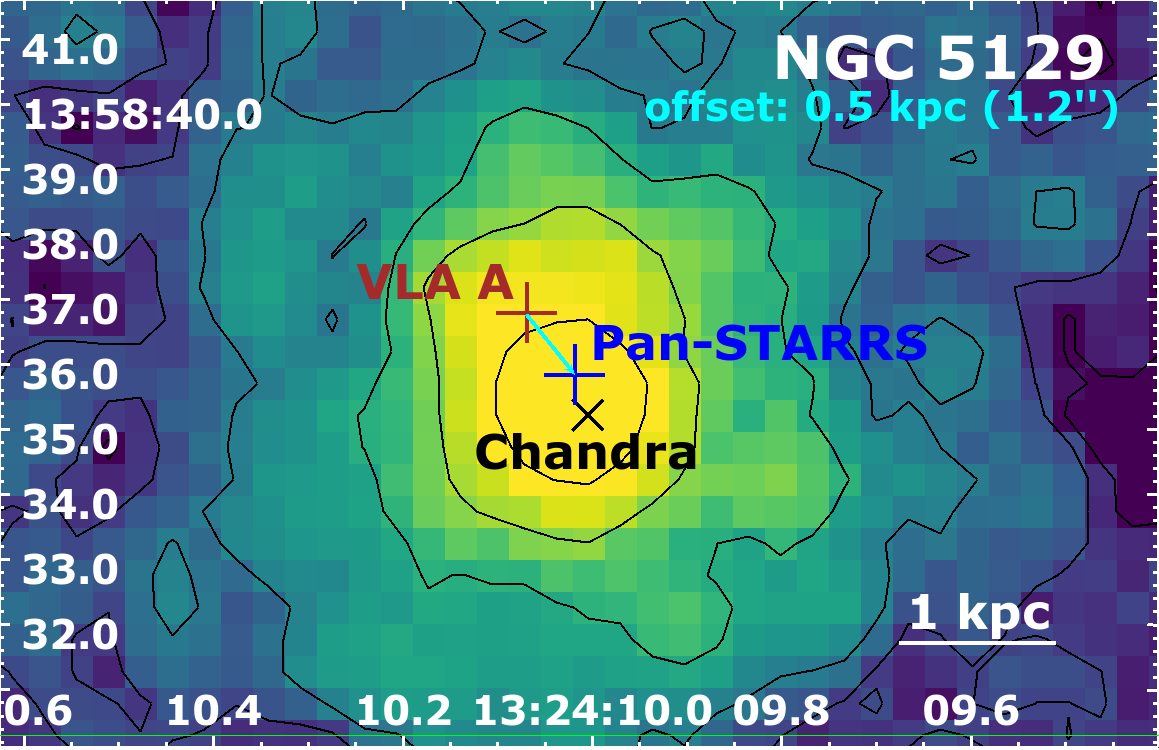
6.6 Offset radio sources
In some cases, the radio emission is observed to be offset from the optical/X-ray emission of the host galaxy. Several mechanisms can be responsible for such misalignment. One possibility is, that the offset radio emission might belong to a merging galaxy where only one nucleus is active (a so-called ‘offset AGN’ Steinborn et al., 2016) or to a recoiled black hole kicked out of the system at large velocities (ranging from hundreds to thousands of km s-1) when the central black holes of merging galaxies coalesce.
To date, there have been tens of observed candidates for such black holes ejected by gravitational wave recoil (also supported by simulations, e.g. Campanelli et al., 2007; Blecha et al., 2016, 2013; Chiaberge et al., 2017; Condon et al., 2017; Komossa, 2012). The broad line region can be carried away by the recoiling black hole and the AGN can continue to be active (e.g.: Komossa, 2012). Moreover, due to previously published candidates for an offset black hole within our sample, namely NGC 4486 and NGC 5813, we investigate this mechanism for three more potential candidates (NGC 3923, NGC 5129 and NGC 4125).
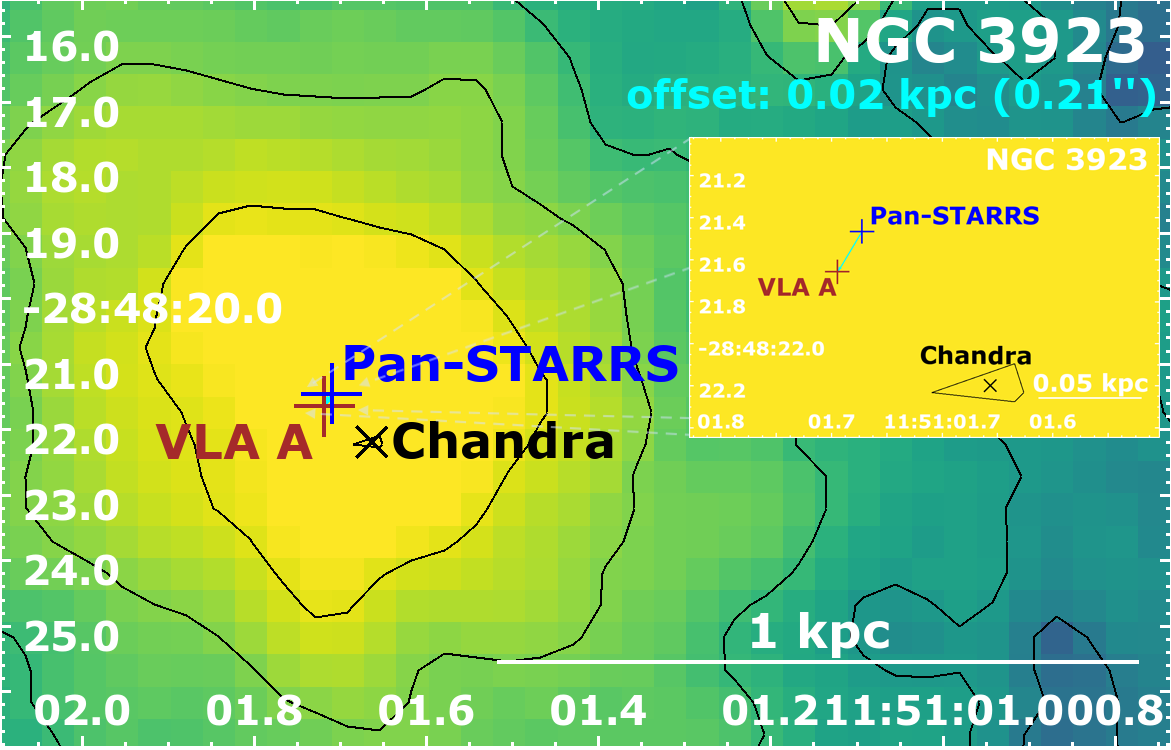
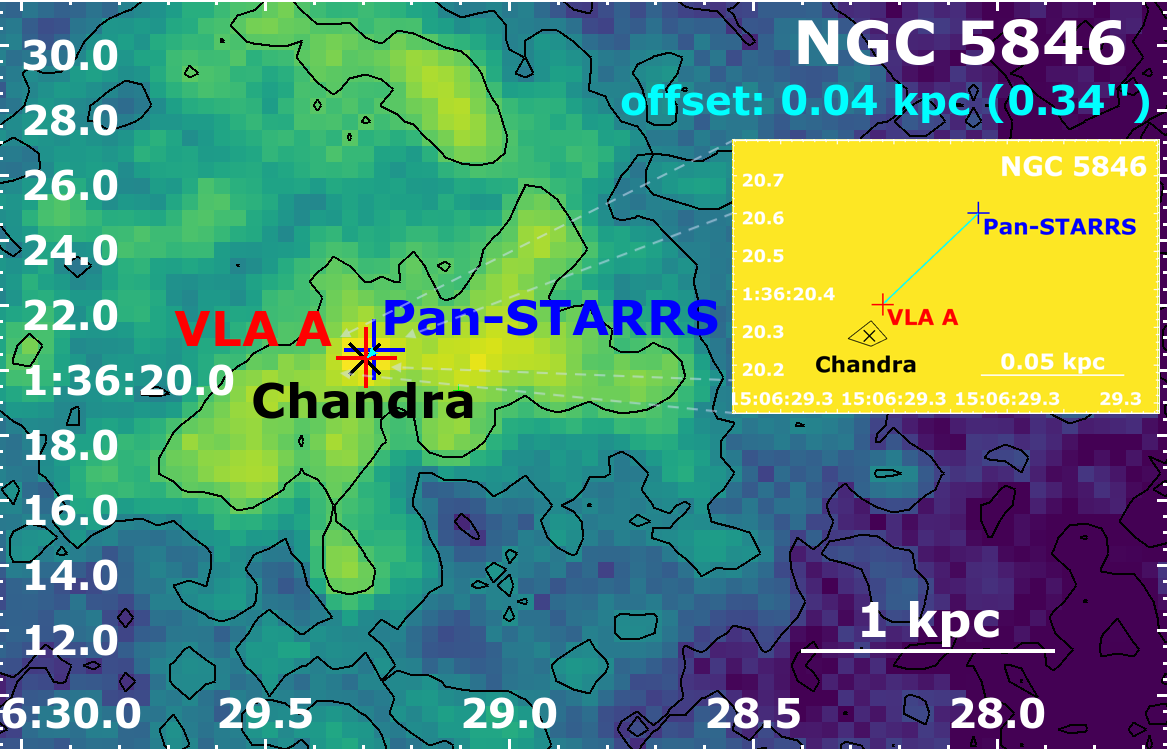
6.6.1 Small offsets: NGC 3923, NGC 4486, NGC 5846, NGC 5129
Multifrequency studies were carried out to search for such recoiling black holes (Lena et al., 2014; Barrows et al., 2016; Skipper & Browne, 2018; Ward et al., 2021). Even in the cases of the giant elliptical galaxies M 87 (NGC 4486) and NGC 5846, a pc-scale displacement of the SMBH from the center of the host galaxy was observed and ascribed to the recoil mechanism (Batcheldor et al., 2010; Lena et al., 2014). Although, the apparent supermassive black hole offset in M 87 could be just due to the variation of the flux as suggested by López-Navas & Prieto (2018).
In our analysis, we present a previously unpublished candidate for the radio/X-ray offset from the optical core of 1.2 arcseconds (0.5 kpc), which may be the result of a displaced supermassive black hole from the central potential of the host giant elliptical galaxy NGC 5129. And we confirm the previous findings for NGC 4486 and NGC 5846, where we also find small offsets of the central radio emission relative to the optical/X-ray emission. Moreover, we found a previously unpublished small offset of 0.21 kpc for the radio emission in the central regions of NGC 3923.
All small-scale offsets are shown in Figure 12.
6.6.2 Intriguing radio lobe emission in NGC 4125
The most intriguing is the offset radio emission located 46 arcseconds (4 kpc) from the radio core of NGC 4125 (Figure 13; top). The unusual position of the radio emission has been previously reported by Krajnović & Jaffe (2002), who claimed that due to the missing optical counterpart, it is probably a background source. However, our analysis, where we estimated how distant a potential background source would need to be if its optical counterpart is not seen by the Panoramic Survey Telescope and Rapid Response System (Pan-STARRS)181818https://panstarrs.stsci.edu/ showed that it is quite unlikely that the observed radio emission is connected to a background source.
Our analysis takes into account the limiting apparent magnitude of the Pan-STARRS survey of 23 mag. We derived that a galaxy similar to M 87, with an absolute magnitude of -21.5, would need to be at least at the luminosity distance of 6300 Mpc (corresponding to a redshift of 0.95) to be missed by the optical survey. At this luminosity distance, the potential background radio source would have a size of 1 Mpc (assuming a linear scale 8 kpc/arcseconds) and large radio power of 101025 W/Hz, corresponding to twice the power of the giant radio halo in the cluster merger ‘El Gordo’ (Lindner et al., 2014) at the redshift of
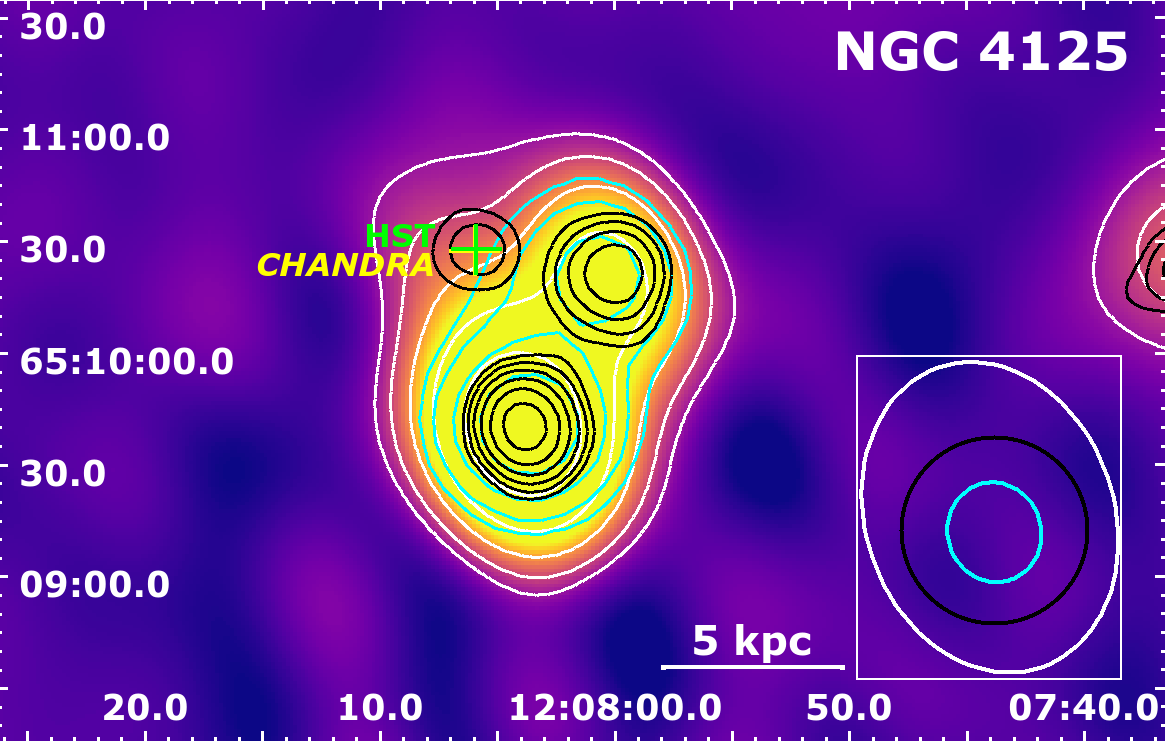
Moreover, we examined the archival data from TIFR GMRT Sky Survey (TGSS) at 148 MHz and Westerbork Synthesis Radio Telescope (WSRT) data at 1.4 GHz and created a spectral index map between these two frequencies (Figure 13; bottom). We found a flat spectral index at the position of the radio/X-ray/optical core of NGC 4125 and steeper spectral indices in a clear double morphology of the radio emission resembling a FR II radio galaxy, which would potentially disfavor the recoiled black hole scenario. A ‘kicked-out’ black hole, which recoils and moves with a high velocity relative to the galaxy, would be expected to form narrow tail structures along its path (Blecha et al., 2011), whereas we observe an apparently untouched radio emission from potential hotspots (especially in the north-western side).
The analysis of the X-ray Chandra data reveals possible X-ray cavities (Plšek et al.; in prep.) perpendicular to the core of NGC 4125, thus they do not correspond to the offset radio emission in the form of radio lobes.
Burke-Spolaor et al. (2017) found a similar offset radio source in the central dominant galaxy (CDG) of the galaxy cluster Abell 2261 with a missing optical and X-ray counterpart (Gültekin et al., 2021). Interestingly, the radio morphology of the emission resembles the one in NGC 4125 with its pear-like shape.
Further analysis needs to be carried out to investigate the origin and source of this unusual double-lobe radio emission.
6.7 Fanaroff-Riley Class II radio sources?
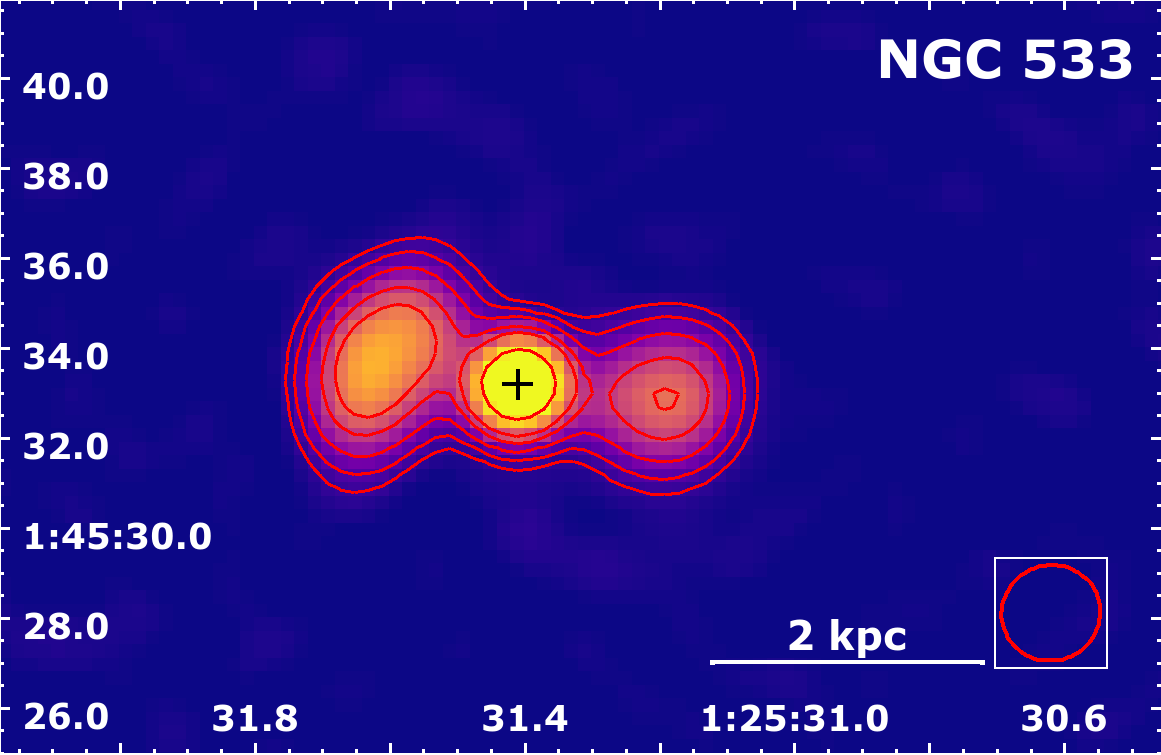
Most of the early-type galaxies in our sample are low power Fanaroff-Riley Class I (FR I, Capetti et al., 2017a) radio sources. Although two giant ellipticals, NGC 533 and NGC 1600, show morphological similarities to Fanaroff-Riley Class II (FR II, Capetti et al., 2017b) radio sources, they still have low power more typical for FR Is (see Section 6.7).
NGC 533
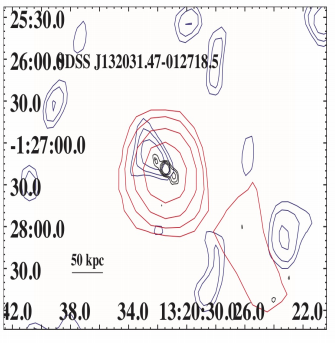
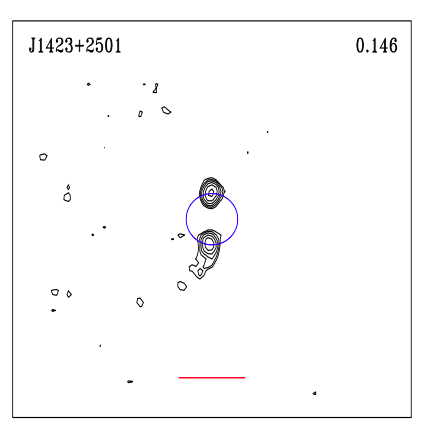
The radio morphology of NGC 533 (Figure 14; top) was observed within our 15A-305 project in the VLA A configuration and has a resolved central region and two inflated almost symmetric small-scale spherical radio jets/lobes with a possible hot spot in the western lobe. We suggest that this source resembles the radio morphology of FR II radio galaxies based on the visual comparison with sources in the FR II FIRST Catalog (FRIICAT) (Capetti et al., 2017b). Further analysis of the in-band spectral index map revealed a flattening of the spectral index at the position of the radio lobes especially in the region west of the radio core visible in Figure 14 (bottom left). Potentially, due to its small physical size (less than 30 kpc), it could fall into the category of Compact Double Radio galaxies (COMP2CAT) Jimenez-Gallardo et al. (2019). NGC 533 could resemble the compact radio source J132031.47-012718.5 (Figure 14; bottom right).
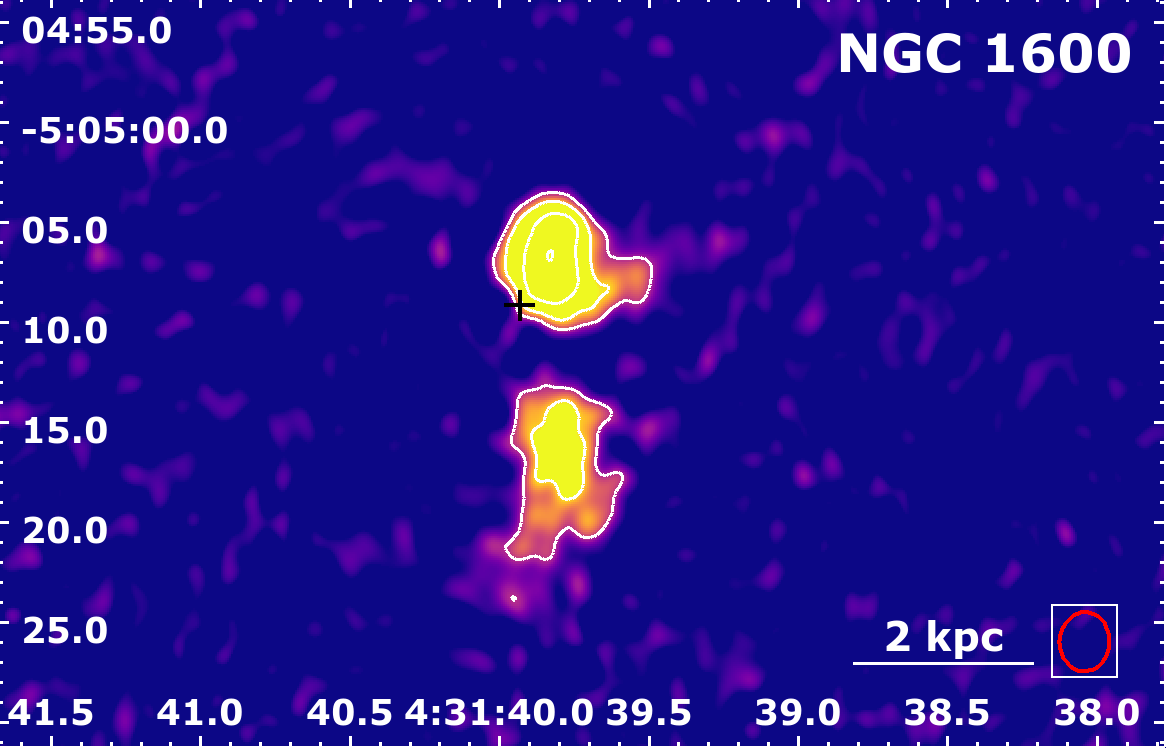
NGC 1600
The radio emission of the giant elliptical galaxy NGC 1600 was previously published by Birkinshaw & Davies (1985), where they used VLA C configuration data at 4.885 GHz. They defined the source as a double radio source (in other words FR II) and stated that the galaxy’s core is located close to the northern radio lobe-like feature. The higher resolution VLA A configuration data at 1.4 GHz shows more clearly the jets/lobes morphology and potential hotspots.
7 Summary and conclusions
Here, we summarize the results of our statistical study of a large sample of optically and X-ray brightest nearby early-type galaxies. Our main goal was to study the radio properties of the AGN residing inside these galaxies. The final results are:
-
•
A large, volume-, optical and X-ray luminosity-limited sample of 42 early-type galaxies observed with multiple configurations of the VLA reveals the presence of a radio source in almost all galaxies. Our radio source detection rate is as high as 41/42 (98%), with the remaining source detected in archival single dish observations (Dressel & Condon, 1978; Condon & Broderick, 1988), reported in the NVSS survey (Brown et al., 2011), and at low frequencies using LOFAR (Bîrzan et al., 2020). The radio emission has an extended morphology in at least 67 (28 out of 42) of sample galaxies. 34 sources out of 42 (81) display a decrease in the X-ray surface brightness due to the hot gas being displaced out by jets creating X-ray cavities in the hot atmosphere.
-
•
Significant correlations are found between the radio power and the luminosity of the central X-ray point source, and between the radio flux density and the largest linear size of the emission. On the other hand, no correlation was found between the radio power and the luminosity of the X-ray atmospheres, the mass of the supermassive black hole, the cooling time or the entropy of the hot gas, or the luminosity of the H[N II] line emission.
-
•
The central spectral indices show a large variety, with approximately 1/3 of the sources having relatively flat spectra, indicating the presence of fresh relativistic particles injected by the AGN, which could mean that the AGN has been switched on recently. The majority of our sources have steep spectra, indicating that the relativistic plasma has undergone significant aging in the nuclear regions of the host galaxies since the last major cycle of AGN activity.
-
•
On the one hand, the analysis of FUV fluxes suggests that the observed radio emission at 1.5 GHz for 5 of 14 low-power early-type galaxies with point-like radio morphologies could be dominated by star formation. On the other hand, we also observe ghost cavities in 3 of those 5 galaxies, suggesting the interaction of radio lobes inflated by the AGN with the hot X-ray atmospheres and thus, the presence of radio-mechanical AGN feedback.
-
•
Importantly, for four (potentially five) sources, we found an offset between the radio emission and the optical centre of the galaxy, which could be due to a merger.
Acknowledgements
RG, NW, and TP are supported by the GACR grant 21-13491X.
This work is supported by the “Departments of Excellence 2018 - 2022” Grant awarded by the Italian Ministry of Education, University and Research (MIUR) (L. 232/2016).
This research has used resources provided by the Ministry of Education, Universities and Research for the grant MASF_FFABR_17_01.
This investigation is supported by the National Aeronautics and Space Administration (NASA) grants GO9-20083X and GO0-21110X.
R.G. thanks the Smithsonian Astrophysical Observatory for support and hospitality.
R.G. would like to thank the NRAO help-desk staff for their assistance, discussions, and help with the VLA data reduction and analysis. Special thanks go to Dr. Amy E. Kimball.
The National Radio Astronomy Observatory is a facility of the National Science Foundation operated under cooperative agreement by Associated Universities, Inc. The scientific results reported in this article are based on observations made by the Chandra X-ray Observatory and published previously in the cited articles.
Based on observations obtained at the Southern Astrophysical Research (SOAR) telescope, which is a joint project of the Ministério da Ciência, Tecnologia, Inovações e Comunicações (MCTIC) do Brasil, the U.S. National Optical Astronomy Observatory (NOAO), the University of North Carolina at Chapel Hill (UNC), and Michigan State University (MSU).
This research has made use of resources provided by the Compagnia di San Paolo for the grant awarded on the BLENV project (S1618_L1_MASF_01) and by the Ministry of Education, Universities and Research for the grant MASF_FFABR_17_01.
This investigation is supported by the National Aeronautics and Space Administration (NASA) grants GO4-15096X, AR6-17012X and GO617081X.
This work is supported by the “Departments of Excellence 2018 - 2022” Grant awarded by the Italian Ministry of Education, University and Research (MIUR) (L. 232/2016).
F.Massaro acknowledges fi-cial contribution from the agreement ASI-INAF n.2017-14-H.0. A.C.F. acknowledges support from ERC Advanced Grant 340442. K.R. acknowledges financial support from the ERC Starting Grant “MAGCOW”, no. 714196 and M. S. acknowledge the support from the NSF grant 1714764.
This research has made use of the SIMBAD database and VizieR catalog, operated at CDS, Strasbourg, France.
KG wishes to thank the Hungarian National Research, Development and Innovation Office (OTKA K134213) for support.
.
References
- Abell et al. (1989) Abell, G. O., Corwin, Harold G., J., & Olowin, R. P. 1989, ApJS, 70, 1, doi: 10.1086/191333
- Alamo-Martínez et al. (2012) Alamo-Martínez, K. A., West, M. J., Blakeslee, J. P., et al. 2012, A&A, 546, A15, doi: 10.1051/0004-6361/201219285
- Allen et al. (2006) Allen, S. W., Dunn, R. J. H., Fabian, A. C., Taylor, G. B., & Reynolds, C. S. 2006, MNRAS, 372, 21, doi: 10.1111/j.1365-2966.2006.10778.x
- Andernach et al. (1992) Andernach, H., Feretti, L., Giovannini, G., et al. 1992, A&AS, 93, 331
- Arp (1967) Arp, H. C. 1967, Astrophys. Lett., 1, 1
- Ascasibar & Markevitch (2006) Ascasibar, Y., & Markevitch, M. 2006, ApJ, 650, 102, doi: 10.1086/506508
- Babyk et al. (2019) Babyk, I. V., McNamara, B. R., Tamhane, P. D., et al. 2019, ApJ, 887, 149, doi: 10.3847/1538-4357/ab54ce
- Baldi et al. (2009) Baldi, A., Forman, W., Jones, C., et al. 2009, ApJ, 707, 1034, doi: 10.1088/0004-637X/707/2/1034
- Baldi et al. (2015) Baldi, R. D., Capetti, A., & Giovannini, G. 2015, A&A, 576, A38, doi: 10.1051/0004-6361/201425426
- Balmaverde & Capetti (2006) Balmaverde, B., & Capetti, A. 2006, A&A, 447, 97, doi: 10.1051/0004-6361:20054031
- Barnes (1989) Barnes, J. E. 1989, in Bulletin of the American Astronomical Society, Vol. 21, 1170
- Barrows et al. (2016) Barrows, R. S., Comerford, J. M., Greene, J. E., & Pooley, D. 2016, ApJ, 829, 37, doi: 10.3847/0004-637X/829/1/37
- Batcheldor et al. (2010) Batcheldor, D., Robinson, A., Axon, D. J., Perlman, E. S., & Merritt, D. 2010, ApJ, 717, L6, doi: 10.1088/2041-8205/717/1/L6
- Bell (2003) Bell, E. F. 2003, ApJ, 586, 794, doi: 10.1086/367829
- Best et al. (2005) Best, P. N., Kauffmann, G., Heckman, T. M., et al. 2005, MNRAS, 362, 25, doi: 10.1111/j.1365-2966.2005.09192.x
- Beuing et al. (1999) Beuing, J., Dobereiner, S., Bohringer, H., & Bender, R. 1999, MNRAS, 302, 209, doi: 10.1046/j.1365-8711.1999.02108.x
- Bharadwaj et al. (2014) Bharadwaj, V., Reiprich, T. H., Schellenberger, G., et al. 2014, A&A, 572, A46, doi: 10.1051/0004-6361/201322684
- Bianchi et al. (2011) Bianchi, L., Herald, J., Efremova, B., et al. 2011, Ap&SS, 335, 161, doi: 10.1007/s10509-010-0581-x
- Bílek et al. (2016) Bílek, M., Cuillandre, J. C., Gwyn, S., et al. 2016, A&A, 588, A77, doi: 10.1051/0004-6361/201526608
- Biller et al. (2004) Biller, B. A., Jones, C., Forman, W. R., Kraft, R., & Ensslin, T. 2004, ApJ, 613, 238, doi: 10.1086/423020
- Binney & Tabor (1995) Binney, J., & Tabor, G. 1995, MNRAS, 276, 663, doi: 10.1093/mnras/276.2.663
- Birkinshaw & Davies (1985) Birkinshaw, M., & Davies, R. L. 1985, ApJ, 291, 32, doi: 10.1086/163038
- Bîrzan et al. (2012) Bîrzan, L., Rafferty, D. A., Nulsen, P. E. J., et al. 2012, MNRAS, 427, 3468, doi: 10.1111/j.1365-2966.2012.22083.x
- Bîrzan et al. (2020) Bîrzan, L., Rafferty, D. A., Brüggen, M., et al. 2020, MNRAS, 496, 2613, doi: 10.1093/mnras/staa1594
- Blakeslee et al. (2009) Blakeslee, J. P., Jordán, A., Mei, S., et al. 2009, ApJ, 694, 556, doi: 10.1088/0004-637X/694/1/556
- Blanton et al. (2004) Blanton, E. L., Sarazin, C. L., McNamara, B. R., & Clarke, T. E. 2004, ApJ, 612, 817, doi: 10.1086/422677
- Blecha et al. (2013) Blecha, L., Civano, F., Elvis, M., & Loeb, A. 2013, MNRAS, 428, 1341, doi: 10.1093/mnras/sts114
- Blecha et al. (2011) Blecha, L., Cox, T. J., Loeb, A., & Hernquist, L. 2011, MNRAS, 412, 2154, doi: 10.1111/j.1365-2966.2010.18042.x
- Blecha et al. (2016) Blecha, L., Sijacki, D., Kelley, L. Z., et al. 2016, MNRAS, 456, 961, doi: 10.1093/mnras/stv2646
- Boizelle et al. (2017) Boizelle, B. D., Barth, A. J., Darling, J., et al. 2017, ApJ, 845, 170, doi: 10.3847/1538-4357/aa8266
- Boizelle et al. (2021) Boizelle, B. D., Walsh, J. L., Barth, A. J., et al. 2021, ApJ, 908, 19, doi: 10.3847/1538-4357/abd24d
- Borne & Colina (1996) Borne, K., & Colina, L. 1996, in Roentgenstrahlung from the Universe, ed. H. U. Zimmermann, J. Trümper, & H. Yorke, 427–428
- Bower et al. (1997) Bower, G. A., Heckman, T. M., Wilson, A. S., & Richstone, D. O. 1997, ApJ, 483, L33, doi: 10.1086/310723
- Braine & Dupraz (1994) Braine, J., & Dupraz, C. 1994, A&A, 283, 407
- Bridle et al. (1979) Bridle, A. H., Davis, M. M., Fomalont, E. B., Willis, A. G., & Strom, R. G. 1979, ApJ, 228, L9, doi: 10.1086/182892
- Briggs (1995) Briggs, D. S. 1995, 27, 1444
- Brown et al. (2011) Brown, M. J. I., Jannuzi, B. T., Floyd, D. J. E., & Mould, J. R. 2011, ApJ, 731, L41, doi: 10.1088/2041-8205/731/2/L41
- Burke-Spolaor et al. (2017) Burke-Spolaor, S., Gültekin, K., Postman, M., et al. 2017, ApJ, 849, 59, doi: 10.3847/1538-4357/aa9064
- Burns (1990) Burns, J. O. 1990, AJ, 99, 14, doi: 10.1086/115307
- Campanelli et al. (2007) Campanelli, M., Lousto, C., Zlochower, Y., & Merritt, D. 2007, ApJ, 659, L5, doi: 10.1086/516712
- Caon et al. (2000) Caon, N., Macchetto, D., & Pastoriza, M. 2000, ApJS, 127, 39, doi: 10.1086/313315
- Capetti et al. (2002) Capetti, A., Celotti, A., Chiaberge, M., et al. 2002, A&A, 383, 104, doi: 10.1051/0004-6361:20011714
- Capetti et al. (2000) Capetti, A., de Ruiter, H. R., Fanti, R., et al. 2000, A&A, 362, 871. https://arxiv.org/abs/astro-ph/0009056
- Capetti et al. (2017a) Capetti, A., Massaro, F., & Baldi, R. D. 2017a, A&A, 598, A49, doi: 10.1051/0004-6361/201629287
- Capetti et al. (2017b) —. 2017b, A&A, 601, A81, doi: 10.1051/0004-6361/201630247
- Cash (1979) Cash, W. 1979, ApJ, 228, 939, doi: 10.1086/156922
- Cavaliere & Fusco-Femiano (1976) Cavaliere, A., & Fusco-Femiano, R. 1976, A&A, 500, 95
- Chen et al. (2012) Chen, R., Peng, B., Strom, R. G., & Wei, J. 2012, MNRAS, 420, 2715, doi: 10.1111/j.1365-2966.2011.20245.x
- Chiaberge et al. (2017) Chiaberge, M., Ely, J. C., Meyer, E. T., et al. 2017, A&A, 600, A57, doi: 10.1051/0004-6361/201629522
- Clarke et al. (2009) Clarke, T. E., Blanton, E. L., Sarazin, C. L., et al. 2009, ApJ, 697, 1481, doi: 10.1088/0004-637X/697/2/1481
- Colbert et al. (2001) Colbert, J. W., Mulchaey, J. S., & Zabludoff, A. I. 2001, AJ, 121, 808, doi: 10.1086/318758
- Combes et al. (2007) Combes, F., Young, L. M., & Bureau, M. 2007, MNRAS, 377, 1795, doi: 10.1111/j.1365-2966.2007.11759.x
- Condon (1992) Condon, J. J. 1992, ARA&A, 30, 575, doi: 10.1146/annurev.aa.30.090192.003043
- Condon & Broderick (1988) Condon, J. J., & Broderick, J. J. 1988, AJ, 96, 30, doi: 10.1086/114788
- Condon et al. (1998) Condon, J. J., Cotton, W. D., Greisen, E. W., et al. 1998, AJ, 115, 1693, doi: 10.1086/300337
- Condon et al. (2017) Condon, J. J., Darling, J., Kovalev, Y. Y., & Petrov, L. 2017, ApJ, 834, 184, doi: 10.3847/1538-4357/834/2/184
- Croston et al. (2003) Croston, J. H., Hardcastle, M. J., Birkinshaw, M., & Worrall, D. M. 2003, MNRAS, 346, 1041, doi: 10.1111/j.1365-2966.2003.07165.x
- Croston et al. (2008) Croston, J. H., Hardcastle, M. J., Birkinshaw, M., Worrall, D. M., & Laing, R. A. 2008, MNRAS, 386, 1709, doi: 10.1111/j.1365-2966.2008.13162.x
- David et al. (2017) David, L. P., Vrtilek, J., O’Sullivan, E., et al. 2017, ApJ, 842, 84, doi: 10.3847/1538-4357/aa756c
- David et al. (2011) David, L. P., O’Sullivan, E., Jones, C., et al. 2011, ApJ, 728, 162, doi: 10.1088/0004-637X/728/2/162
- David et al. (2014a) David, L. P., Lim, J., Forman, W., et al. 2014a, ApJ, 792, 94, doi: 10.1088/0004-637X/792/2/94
- David et al. (2014b) —. 2014b, ApJ, 792, 94, doi: 10.1088/0004-637X/792/2/94
- Davis et al. (1995) Davis, D. S., Mushotzky, R. F., Mulchaey, J. S., et al. 1995, ApJ, 444, 582, doi: 10.1086/175632
- Davis et al. (2016) Davis, T. A., Greene, J., Ma, C.-P., et al. 2016, MNRAS, 455, 214, doi: 10.1093/mnras/stv2313
- Devereux et al. (2010) Devereux, N., Eracleous, M., Hriljac, P., & Shearer, A. 2010, arXiv e-prints, arXiv:1008.2339. https://arxiv.org/abs/1008.2339
- Disney & Wall (1977) Disney, M. J., & Wall, J. V. 1977, MNRAS, 179, 235, doi: 10.1093/mnras/179.2.235
- Donato et al. (2004) Donato, D., Sambruna, R. M., & Gliozzi, M. 2004, ApJ, 617, 915, doi: 10.1086/425575
- Dong et al. (2010) Dong, R., Rasmussen, J., & Mulchaey, J. S. 2010, ApJ, 712, 883, doi: 10.1088/0004-637X/712/2/883
- Dressel & Condon (1978) Dressel, L. L., & Condon, J. J. 1978, ApJS, 36, 53, doi: 10.1086/190491
- Duah Asabere et al. (2014) Duah Asabere, B., Horellou, C., Winkler, H., Jarrett, T., & Leeuw, L. 2014, arXiv e-prints, arXiv:1409.2474. https://arxiv.org/abs/1409.2474
- Dunn et al. (2010) Dunn, R. J. H., Allen, S. W., Taylor, G. B., et al. 2010, MNRAS, 404, 180, doi: 10.1111/j.1365-2966.2010.16314.x
- Dunn & Fabian (2006) Dunn, R. J. H., & Fabian, A. C. 2006, MNRAS, 373, 959, doi: 10.1111/j.1365-2966.2006.11080.x
- Dunn et al. (2005) Dunn, R. J. H., Fabian, A. C., & Taylor, G. B. 2005, MNRAS, 364, 1343, doi: 10.1111/j.1365-2966.2005.09673.x
- Ehlert et al. (2013) Ehlert, S., Werner, N., Simionescu, A., et al. 2013, MNRAS, 430, 2401, doi: 10.1093/mnras/stt060
- Ekers & Kotanyi (1978) Ekers, R. D., & Kotanyi, C. G. 1978, A&A, 67, 47
- Ettori & Fabian (2000) Ettori, S., & Fabian, A. C. 2000, MNRAS, 317, L57, doi: 10.1046/j.1365-8711.2000.03899.x
- Fabbiano et al. (2002) Fabbiano, G., Kim, D. W., & Brickhouse, N. 2002, in American Astronomical Society Meeting Abstracts, Vol. 201, American Astronomical Society Meeting Abstracts, 14.04
- Fabian & Nulsen (1977) Fabian, A. C., & Nulsen, P. E. J. 1977, MNRAS, 180, 479, doi: 10.1093/mnras/180.3.479
- Fabian et al. (2003) Fabian, A. C., Sanders, J. S., Allen, S. W., et al. 2003, MNRAS, 344, L43, doi: 10.1046/j.1365-8711.2003.06902.x
- Fabian et al. (2016) Fabian, A. C., Walker, S. A., Russell, H. R., et al. 2016, MNRAS, 461, 922, doi: 10.1093/mnras/stw1350
- Fanaroff & Riley (1974) Fanaroff, B. L., & Riley, J. M. 1974, MNRAS, 167, 31P, doi: 10.1093/mnras/167.1.31P
- Feretti et al. (1999) Feretti, L., Perley, R., Giovannini, G., & Andernach, H. 1999, A&A, 341, 29. https://arxiv.org/abs/astro-ph/9810305
- Ferrarese et al. (1996) Ferrarese, L., Ford, H. C., & Jaffe, W. 1996, ApJ, 470, 444, doi: 10.1086/177876
- Ferrari et al. (1999) Ferrari, F., Pastoriza, M. G., Macchetto, F., & Caon, N. 1999, A&AS, 136, 269, doi: 10.1051/aas:1999465
- Filho et al. (2002) Filho, M. E., Barthel, P. D., & Ho, L. C. 2002, ApJS, 142, 223, doi: 10.1086/341786
- Filho et al. (2004) Filho, M. E., Fraternali, F., Markoff, S., et al. 2004, A&A, 418, 429, doi: 10.1051/0004-6361:20034486
- Finoguenov et al. (2001) Finoguenov, A., Arnaud, M., & David, L. P. 2001, ApJ, 555, 191, doi: 10.1086/321457
- Fomalont et al. (1989) Fomalont, E. B., Ebneter, K. A., van Breugel, W. J. M., & Ekers, R. D. 1989, ApJ, 346, L17, doi: 10.1086/185568
- Forbes et al. (2006) Forbes, D. A., Ponman, T., Pearce, F., et al. 2006, PASA, 23, 38, doi: 10.1071/AS06002
- Forman et al. (1979) Forman, W., Schwarz, J., Jones, C., Liller, W., & Fabian, A. C. 1979, ApJ, 234, L27, doi: 10.1086/183103
- Forman et al. (2005) Forman, W., Nulsen, P., Heinz, S., et al. 2005, ApJ, 635, 894, doi: 10.1086/429746
- Forman et al. (2007) Forman, W., Jones, C., Churazov, E., et al. 2007, ApJ, 665, 1057, doi: 10.1086/519480
- Franceschini et al. (1998) Franceschini, A., Vercellone, S., & Fabian, A. C. 1998, MNRAS, 297, 817, doi: 10.1046/j.1365-8711.1998.01534.x
- Freeman et al. (2001) Freeman, P., Doe, S., & Siemiginowska, A. 2001, in Society of Photo-Optical Instrumentation Engineers (SPIE) Conference Series, Vol. 4477, Astronomical Data Analysis, ed. J.-L. Starck & F. D. Murtagh, 76–87, doi: 10.1117/12.447161
- Frisbie et al. (2020) Frisbie, R. L. S., Donahue, M., Voit, G. M., et al. 2020, ApJ, 899, 159, doi: 10.3847/1538-4357/aba8a8
- Fruscione et al. (2006) Fruscione, A., McDowell, J. C., Allen, G. E., et al. 2006, in Society of Photo-Optical Instrumentation Engineers (SPIE) Conference Series, Vol. 6270, Society of Photo-Optical Instrumentation Engineers (SPIE) Conference Series, ed. D. R. Silva & R. E. Doxsey, 62701V, doi: 10.1117/12.671760
- Garcia (1993) Garcia, A. M. 1993, A&AS, 100, 47
- Gaspari et al. (2013) Gaspari, M., Ruszkowski, M., & Oh, S. P. 2013, MNRAS, 432, 3401, doi: 10.1093/mnras/stt692
- Gastaldello et al. (2007) Gastaldello, F., Buote, D. A., Humphrey, P. J., et al. 2007, ApJ, 669, 158, doi: 10.1086/521519
- Gastaldello et al. (2009) Gastaldello, F., Buote, D. A., Temi, P., et al. 2009, ApJ, 693, 43, doi: 10.1088/0004-637X/693/1/43
- Gastaldello et al. (2013) Gastaldello, F., Di Gesu, L., Ghizzardi, S., et al. 2013, ApJ, 770, 56, doi: 10.1088/0004-637X/770/1/56
- Giacintucci et al. (2011) Giacintucci, S., O’Sullivan, E., Vrtilek, J., et al. 2011, ApJ, 732, 95, doi: 10.1088/0004-637X/732/2/95
- Giacintucci et al. (2012) Giacintucci, S., O’Sullivan, E., Clarke, T. E., et al. 2012, ApJ, 755, 172, doi: 10.1088/0004-637X/755/2/172
- Gitti et al. (2010) Gitti, M., O’Sullivan, E., Giacintucci, S., et al. 2010, ApJ, 714, 758, doi: 10.1088/0004-637X/714/1/758
- Gizani & Leahy (1999) Gizani, N. A. B., & Leahy, J. P. 1999, New A Rev., 43, 639, doi: 10.1016/S1387-6473(99)00069-X
- Gliozzi et al. (2003) Gliozzi, M., Sambruna, R. M., & Brandt, W. N. 2003, A&A, 408, 949, doi: 10.1051/0004-6361:20031050
- González-Martín et al. (2009) González-Martín, O., Masegosa, J., Márquez, I., Guainazzi, M., & Jiménez-Bailón, E. 2009, A&A, 506, 1107, doi: 10.1051/0004-6361/200912288
- González-Martín et al. (2006) González-Martín, O., Masegosa, J., Márquez, I., Guerrero, M. A., & Dultzin-Hacyan, D. 2006, A&A, 460, 45, doi: 10.1051/0004-6361:20054756
- Goss et al. (1987) Goss, W. M., McAdam, W. B., Wellington, K. J., & Ekers, R. D. 1987, MNRAS, 226, 979, doi: 10.1093/mnras/226.4.979
- Goulding & Alexander (2009) Goulding, A. D., & Alexander, D. M. 2009, MNRAS, 398, 1165, doi: 10.1111/j.1365-2966.2009.15194.x
- Goulding et al. (2016) Goulding, A. D., Greene, J. E., Ma, C.-P., et al. 2016, ApJ, 826, 167, doi: 10.3847/0004-637X/826/2/167
- Goullaud et al. (2018) Goullaud, C. F., Jensen, J. B., Blakeslee, J. P., et al. 2018, ApJ, 856, 11, doi: 10.3847/1538-4357/aab1f3
- Governato et al. (1991) Governato, F., Bhatia, R., & Chincarini, G. 1991, ApJ, 371, L15, doi: 10.1086/185991
- Grillmair et al. (1999) Grillmair, C. J., Forbes, D. A., Brodie, J. P., & Elson, R. A. W. 1999, AJ, 117, 167, doi: 10.1086/300661
- Grossová et al. (2019) Grossová, R., Werner, N., Rajpurohit, K., et al. 2019, MNRAS, 488, 1917, doi: 10.1093/mnras/stz1728
- Gültekin et al. (2021) Gültekin, K., Burke-Spolaor, S., Lauer, T. R., et al. 2021, ApJ, 906, 48, doi: 10.3847/1538-4357/abc483
- Hardcastle et al. (1998) Hardcastle, M. J., Worrall, D. M., & Birkinshaw, M. 1998, MNRAS, 296, 1098, doi: 10.1046/j.1365-8711.1998.01535.x
- Hickson (1982) Hickson, P. 1982, ApJ, 255, 382, doi: 10.1086/159838
- Ho et al. (1997) Ho, L. C., Filippenko, A. V., & Sargent, W. L. W. 1997, ApJ, 487, 579, doi: 10.1086/304642
- Hogan (2014) Hogan, M. T. 2014, PhD thesis, Durham University
- Horellou et al. (2001) Horellou, C., Black, J. H., van Gorkom, J. H., et al. 2001, A&A, 376, 837, doi: 10.1051/0004-6361:20011039
- Huchtmeier et al. (1988) Huchtmeier, W. K., Bregman, J. N., Hogg, D. E., & Roberts, M. S. 1988, A&A, 198, L17
- Jaffe & McNamara (1994) Jaffe, W., & McNamara, B. R. 1994, ApJ, 434, 110, doi: 10.1086/174708
- Jetha et al. (2008) Jetha, N. N., Hardcastle, M. J., Babul, A., et al. 2008, MNRAS, 384, 1344, doi: 10.1111/j.1365-2966.2007.12829.x
- Jimenez-Gallardo et al. (2019) Jimenez-Gallardo, A., Massaro, F., Capetti, A., et al. 2019, A&A, 627, A108, doi: 10.1051/0004-6361/201935104
- Jones et al. (2002) Jones, C., Forman, W., Vikhlinin, A., et al. 2002, ApJ, 567, L115, doi: 10.1086/340114
- Joye & Mandel (2003) Joye, W. A., & Mandel, E. 2003, in Astronomical Society of the Pacific Conference Series, Vol. 295, Astronomical Data Analysis Software and Systems XII, ed. H. E. Payne, R. I. Jedrzejewski, & R. N. Hook, 489
- Kaiser & Binney (2003) Kaiser, C. R., & Binney, J. 2003, MNRAS, 338, 837, doi: 10.1046/j.1365-8711.2003.06131.x
- Kelly (2007) Kelly, B. C. 2007, ApJ, 665, 1489, doi: 10.1086/519947
- Kenney et al. (2008) Kenney, J. D. P., Tal, T., Crowl, H. H., Feldmeier, J., & Jacoby, G. H. 2008, ApJ, 687, L69, doi: 10.1086/593300
- Killeen & Bicknell (1988) Killeen, N. E. B., & Bicknell, G. V. 1988, ApJ, 324, 198, doi: 10.1086/165890
- Killeen et al. (1986a) Killeen, N. E. B., Bicknell, G. V., & Carter, D. 1986a, ApJ, 309, 45, doi: 10.1086/164576
- Killeen et al. (1986b) Killeen, N. E. B., Bicknell, G. V., & Ekers, R. D. 1986b, ApJ, 302, 306, doi: 10.1086/163992
- Kim & Fabbiano (1995) Kim, D.-W., & Fabbiano, G. 1995, ApJ, 441, 182, doi: 10.1086/175348
- Kim et al. (2018) Kim, D.-W., Anderson, C., Burke, D., et al. 2018, ApJ, 853, 129, doi: 10.3847/1538-4357/aaa43a
- Kim et al. (2019) —. 2019, ApJS, 241, 36, doi: 10.3847/1538-4365/ab0ca4
- Kim et al. (2020) Kim, D.-W., Traynor, L., Paggi, A., et al. 2020, MNRAS, 492, 2095, doi: 10.1093/mnras/stz3530
- Klein et al. (2003) Klein, U., Mack, K. H., Gregorini, L., & Vigotti, M. 2003, A&A, 406, 579, doi: 10.1051/0004-6361:20030825
- Klein et al. (1994) Klein, U., Mack, K. H., Strom, R., Wielebinski, R., & Achatz, U. 1994, A&A, 283, 729
- Kolokythas et al. (2015) Kolokythas, K., O’Sullivan, E., Giacintucci, S., et al. 2015, MNRAS, 450, 1732, doi: 10.1093/mnras/stv665
- Kolokythas et al. (2018) Kolokythas, K., O’Sullivan, E., Raychaudhury, S., et al. 2018, MNRAS, 481, 1550, doi: 10.1093/mnras/sty2030
- Kolokythas et al. (2020) Kolokythas, K., O’Sullivan, E., Giacintucci, S., et al. 2020, MNRAS, 496, 1471, doi: 10.1093/mnras/staa1506
- Komossa (2012) Komossa, S. 2012, Advances in Astronomy, 2012, 364973, doi: 10.1155/2012/364973
- Kormendy & Ho (2013) Kormendy, J., & Ho, L. C. 2013, ARA&A, 51, 511, doi: 10.1146/annurev-astro-082708-101811
- Kraft et al. (2004) Kraft, R. P., Forman, W. R., Churazov, E., et al. 2004, ApJ, 601, 221, doi: 10.1086/380427
- Kraft et al. (2011) Kraft, R. P., Forman, W. R., Jones, C., et al. 2011, ApJ, 727, 41, doi: 10.1088/0004-637X/727/1/41
- Kraft et al. (2017) Kraft, R. P., Roediger, E., Machacek, M., et al. 2017, ApJ, 848, 27, doi: 10.3847/1538-4357/aa8a6e
- Krajnović & Jaffe (2002) Krajnović, D., & Jaffe, W. 2002, A&A, 390, 423, doi: 10.1051/0004-6361:20020801
- Kulkarni et al. (2014) Kulkarni, S., Sahu, D. K., Chaware, L., Chakradhari, N. K., & Pandey, S. K. 2014, New A, 30, 51, doi: 10.1016/j.newast.2014.01.003
- Lacki & Thompson (2013) Lacki, B. C., & Thompson, T. A. 2013, ApJ, 762, 29, doi: 10.1088/0004-637X/762/1/29
- Laing & Bridle (1987) Laing, R. A., & Bridle, A. H. 1987, MNRAS, 228, 557, doi: 10.1093/mnras/228.3.557
- Laing et al. (2006) Laing, R. A., Canvin, J. R., Cotton, W. D., & Bridle, A. H. 2006, MNRAS, 368, 48, doi: 10.1111/j.1365-2966.2006.10099.x
- Lakhchaura et al. (2018) Lakhchaura, K., Werner, N., Sun, M., et al. 2018, MNRAS, 481, 4472, doi: 10.1093/mnras/sty2565
- Lal et al. (2013) Lal, D. V., Kraft, R. P., Randall, S. W., et al. 2013, ApJ, 764, 83, doi: 10.1088/0004-637X/764/1/83
- Lanz et al. (2010) Lanz, L., Jones, C., Forman, W. R., et al. 2010, ApJ, 721, 1702, doi: 10.1088/0004-637X/721/2/1702
- Lara et al. (2001) Lara, L., Cotton, W. D., Feretti, L., et al. 2001, A&A, 370, 409, doi: 10.1051/0004-6361:20010254
- Lauer et al. (2007) Lauer, T. R., Faber, S. M., Richstone, D., et al. 2007, ApJ, 662, 808, doi: 10.1086/518223
- Leahy (1993) Leahy, J. P. 1993, DRAGNs, ed. H.-J. Röser & K. Meisenheimer, Vol. 421, 1, doi: 10.1007/3-540-57164-7_74
- Lena et al. (2014) Lena, D., Robinson, A., Marconi, A., et al. 2014, ApJ, 795, 146, doi: 10.1088/0004-637X/795/2/146
- Leon et al. (2001) Leon, S., Lim, J., Combes, F., & van-Trung, D. 2001, in QSO Hosts and Their Environments, ed. I. Márquez, J. Masegosa, A. del Olmo, L. Lara, E. García, & J. Molina, 185. https://arxiv.org/abs/astro-ph/0107498
- Lindner et al. (2014) Lindner, R. R., Baker, A. J., Hughes, J. P., et al. 2014, ApJ, 786, 49, doi: 10.1088/0004-637X/786/1/49
- Liu et al. (2006) Liu, Y., Jiang, D. R., & Gu, M. F. 2006, ApJ, 637, 669, doi: 10.1086/498639
- Liuzzo et al. (2013) Liuzzo, E., Buttiglione, S., Giovannini, G., et al. 2013, A&A, 550, A76, doi: 10.1051/0004-6361/201220012
- Liuzzo et al. (2010) Liuzzo, E., Giovannini, G., Giroletti, M., & Taylor, G. B. 2010, A&A, 516, A1, doi: 10.1051/0004-6361/200913888
- López-Navas & Prieto (2018) López-Navas, E., & Prieto, M. A. 2018, MNRAS, 480, 4099, doi: 10.1093/mnras/sty2148
- Ly et al. (2004) Ly, C., Walker, R. C., & Wrobel, J. M. 2004, AJ, 127, 119, doi: 10.1086/379855
- Maccagni et al. (2021) Maccagni, F. M., Serra, P., Murgia, M., et al. 2021, IAU Symposium, 359, 141, doi: 10.1017/S1743921320004287
- Maccagni et al. (2020) Maccagni, F. M., Murgia, M., Serra, P., et al. 2020, A&A, 634, A9, doi: 10.1051/0004-6361/201936867
- Macchetto et al. (1996) Macchetto, F., Pastoriza, M., Caon, N., et al. 1996, A&AS, 120, 463
- Machacek et al. (2005) Machacek, M., Dosaj, A., Forman, W., et al. 2005, ApJ, 621, 663, doi: 10.1086/427548
- Machacek et al. (2006) Machacek, M., Nulsen, P. E. J., Jones, C., & Forman, W. R. 2006, ApJ, 648, 947, doi: 10.1086/505963
- Machacek et al. (2011) Machacek, M. E., Jerius, D., Kraft, R., et al. 2011, ApJ, 743, 15, doi: 10.1088/0004-637X/743/1/15
- Mack et al. (1997) Mack, K. H., Klein, U., O’Dea, C. P., & Willis, A. G. 1997, A&AS, 123, 423, doi: 10.1051/aas:1997166
- Makarov et al. (2014) Makarov, D., Prugniel, P., Terekhova, N., Courtois, H., & Vauglin, I. 2014, A&A, 570, A13, doi: 10.1051/0004-6361/201423496
- Marshall et al. (2002) Marshall, H. L., Miller, B. P., Davis, D. S., et al. 2002, ApJ, 564, 683, doi: 10.1086/324396
- Mathews et al. (2013) Mathews, W. G., Temi, P., Brighenti, F., & Amblard, A. 2013, ApJ, 768, 28, doi: 10.1088/0004-637X/768/1/28
- McMullin et al. (2007) McMullin, J. P., Waters, B., Schiebel, D., Young, W., & Golap, K. 2007, 376, 127
- McNamara & Nulsen (2007) McNamara, B. R., & Nulsen, P. E. J. 2007, ARA&A, 45, 117, doi: 10.1146/annurev.astro.45.051806.110625
- McNamara et al. (2005) McNamara, B. R., Nulsen, P. E. J., Wise, M. W., et al. 2005, Nature, 433, 45, doi: 10.1038/nature03202
- McNamara et al. (2016) McNamara, B. R., Russell, H. R., Nulsen, P. E. J., et al. 2016, ApJ, 830, 79, doi: 10.3847/0004-637X/830/2/79
- Mieske et al. (2005) Mieske, S., Hilker, M., & Infante, L. 2005, A&A, 438, 103, doi: 10.1051/0004-6361:20041583
- Miller et al. (2017) Miller, B., Ahumada, T., Puzia, T., et al. 2017, Galaxies, 5, 29, doi: 10.3390/galaxies5030029
- Missaglia et al. (2019) Missaglia, V., Massaro, F., Capetti, A., et al. 2019, A&A, 626, A8, doi: 10.1051/0004-6361/201935058
- Mittal et al. (2009) Mittal, R., Hudson, D. S., Reiprich, T. H., & Clarke, T. 2009, A&A, 501, 835, doi: 10.1051/0004-6361/200810836
- Mittal et al. (2011) Mittal, R., O’Dea, C. P., Ferland, G., et al. 2011, MNRAS, 418, 2386, doi: 10.1111/j.1365-2966.2011.19634.x
- Morganti et al. (2009) Morganti, R., Peck, A. B., Oosterloo, T. A., et al. 2009, A&A, 505, 559, doi: 10.1051/0004-6361/200912605
- Morita et al. (2006) Morita, U., Ishisaki, Y., Yamasaki, N. Y., et al. 2006, PASJ, 58, 719, doi: 10.1093/pasj/58.4.719
- Morokuma-Matsui et al. (2019) Morokuma-Matsui, K., Serra, P., Maccagni, F. M., et al. 2019, PASJ, 71, 85, doi: 10.1093/pasj/psz067
- Mulchaey & Zabludoff (1999) Mulchaey, J. S., & Zabludoff, A. I. 1999, ApJ, 514, 133, doi: 10.1086/306952
- Murgia et al. (2011) Murgia, M., Parma, P., Mack, K. H., et al. 2011, A&A, 526, A148, doi: 10.1051/0004-6361/201015302
- North et al. (2021) North, E. V., Davis, T. A., Bureau, M., et al. 2021, MNRAS, 503, 5179, doi: 10.1093/mnras/stab793
- Nulsen et al. (2009) Nulsen, P., Jones, C., Forman, W., et al. 2009, in American Institute of Physics Conference Series, Vol. 1201, The Monster’s Fiery Breath: Feedback in Galaxies, Groups, and Clusters, ed. S. Heinz & E. Wilcots, 198–201, doi: 10.1063/1.3293033
- Nulsen (1986) Nulsen, P. E. J. 1986, MNRAS, 221, 377
- Ocaña Flaquer et al. (2010) Ocaña Flaquer, B., Leon, S., Combes, F., & Lim, J. 2010, A&A, 518, A9, doi: 10.1051/0004-6361/200913392
- O’Dea (1998) O’Dea, C. P. 1998, PASP, 110, 493, doi: 10.1086/316162
- O’Donoghue et al. (1990) O’Donoghue, A. A., Owen, F. N., & Eilek, J. A. 1990, ApJS, 72, 75, doi: 10.1086/191410
- Olivares et al. (2019) Olivares, V., Salome, P., Combes, F., et al. 2019, A&A, 631, A22, doi: 10.1051/0004-6361/201935350
- O’Sullivan et al. (2015) O’Sullivan, E., Combes, F., Hamer, S., et al. 2015, A&A, 573, A111, doi: 10.1051/0004-6361/201424835
- O’Sullivan et al. (2001) O’Sullivan, E., Forbes, D. A., & Ponman, T. J. 2001, MNRAS, 328, 461, doi: 10.1046/j.1365-8711.2001.04890.x
- O’Sullivan et al. (2007) O’Sullivan, E., Sanderson, A. J. R., & Ponman, T. J. 2007, MNRAS, 380, 1409, doi: 10.1111/j.1365-2966.2007.12229.x
- O’Sullivan et al. (2003) O’Sullivan, E., Vrtilek, J. M., Read, A. M., David, L. P., & Ponman, T. J. 2003, MNRAS, 346, 525, doi: 10.1046/j.1365-2966.2003.07108.x
- O’Sullivan et al. (2011) O’Sullivan, E., Worrall, D. M., Birkinshaw, M., et al. 2011, MNRAS, 416, 2916, doi: 10.1111/j.1365-2966.2011.19239.x
- O’Sullivan et al. (2018) O’Sullivan, E., Combes, F., Salomé, P., et al. 2018, A&A, 618, A126, doi: 10.1051/0004-6361/201833580
- Owen et al. (2000) Owen, F. N., Eilek, J. A., & Kassim, N. E. 2000, ApJ, 543, 611, doi: 10.1086/317151
- Owen & Rudnick (1976) Owen, F. N., & Rudnick, L. 1976, ApJ, 205, L1, doi: 10.1086/182077
- Paggi (2014) Paggi, A. 2014, in X-ray View of Galaxy Ecosystems, 28. https://arxiv.org/abs/1404.5315
- Pahre et al. (2004) Pahre, M. A., Ashby, M. L. N., Fazio, G. G., & Willner, S. P. 2004, ApJS, 154, 229, doi: 10.1086/423320
- Panagoulia et al. (2014) Panagoulia, E. K., Fabian, A. C., Sanders, J. S., & Hlavacek-Larrondo, J. 2014, MNRAS, 444, 1236, doi: 10.1093/mnras/stu1499
- Paolillo et al. (2002) Paolillo, M., Fabbiano, G., Peres, G., & Kim, D. W. 2002, ApJ, 565, 883, doi: 10.1086/337919
- Paolillo et al. (2003) —. 2003, ApJ, 586, 850, doi: 10.1086/367718
- Parma et al. (1986) Parma, P., de Ruiter, H. R., Fanti, C., & Fanti, R. 1986, A&AS, 64, 135
- Pellegrini et al. (2003) Pellegrini, S., Venturi, T., Comastri, A., et al. 2003, ApJ, 585, 677, doi: 10.1086/346184
- Pence (1986) Pence, W. D. 1986, ApJ, 310, 597, doi: 10.1086/164712
- Perley et al. (2009) Perley, R., Napier, P., Jackson, J., et al. 2009, IEEE Proceedings, 97, 1448, doi: 10.1109/JPROC.2009.2015470
- Perley & Butler (2013) Perley, R. A., & Butler, B. J. 2013, ApJS, 204, 19, doi: 10.1088/0067-0049/204/2/19
- Perley et al. (2011) Perley, R. A., Chandler, C. J., Butler, B. J., & Wrobel, J. M. 2011, ApJ, 739, L1, doi: 10.1088/2041-8205/739/1/L1
- Perley et al. (1979) Perley, R. A., Willis, A. G., & Scott, J. S. 1979, Nature, 281, 437, doi: 10.1038/281437a0
- Planck Collaboration et al. (2016) Planck Collaboration, Ade, P. A. R., Aghanim, N., et al. 2016, A&A, 594, A13, doi: 10.1051/0004-6361/201525830
- Prandoni et al. (2010) Prandoni, I., Laing, R. A., de Ruiter, H. R., & Parma, P. 2010, A&A, 523, A38, doi: 10.1051/0004-6361/201015456
- Rajpurohit et al. (2018) Rajpurohit, K., Hoeft, M., van Weeren, R. J., et al. 2018, ApJ, 852, 65, doi: 10.3847/1538-4357/aa9f13
- Randall et al. (2008) Randall, S., Nulsen, P., Forman, W. R., et al. 2008, ApJ, 688, 208, doi: 10.1086/592324
- Randall et al. (2009) Randall, S. W., Jones, C., Kraft, R., Forman, W. R., & O’Sullivan, E. 2009, ApJ, 696, 1431, doi: 10.1088/0004-637X/696/2/1431
- Randall et al. (2011) Randall, S. W., Forman, W. R., Giacintucci, S., et al. 2011, ApJ, 726, 86, doi: 10.1088/0004-637X/726/2/86
- Randall et al. (2015) Randall, S. W., Nulsen, P. E. J., Jones, C., et al. 2015, ApJ, 805, 112, doi: 10.1088/0004-637X/805/2/112
- Rau & Cornwell (2011) Rau, U., & Cornwell, T. J. 2011, A&A, 532, A71, doi: 10.1051/0004-6361/201117104
- Reid et al. (1994) Reid, N., Boisson, C., & Sansom, A. E. 1994, MNRAS, 269, 713, doi: 10.1093/mnras/269.3.713
- Ruffa et al. (2019) Ruffa, I., Prandoni, I., Laing, R. A., et al. 2019, MNRAS, 484, 4239, doi: 10.1093/mnras/stz255
- Russell et al. (2019) Russell, H. R., McNamara, B. R., Fabian, A. C., et al. 2019, MNRAS, 490, 3025, doi: 10.1093/mnras/stz2719
- Sabater et al. (2019) Sabater, J., Best, P. N., Hardcastle, M. J., et al. 2019, A&A, 622, A17, doi: 10.1051/0004-6361/201833883
- Sage & Galletta (1993) Sage, L. J., & Galletta, G. 1993, ApJ, 419, 544, doi: 10.1086/173507
- Sage & Wrobel (1989) Sage, L. J., & Wrobel, J. M. 1989, ApJ, 344, 204, doi: 10.1086/167789
- Saglia et al. (2016) Saglia, R. P., Opitsch, M., Erwin, P., et al. 2016, ApJ, 818, 47, doi: 10.3847/0004-637X/818/1/47
- Sahu et al. (2016) Sahu, S. K., Pandey, S. K., Chaware, L., & Pand ge, M. B. 2016, in From Interstellar Clouds to Star-Forming Galaxies: Universal Processes?, ed. P. Jablonka, P. André, & F. van der Tak, Vol. 315, E70, doi: 10.1017/S1743921316008322
- Salim et al. (2007) Salim, S., Rich, R. M., Charlot, S., et al. 2007, ApJS, 173, 267, doi: 10.1086/519218
- Sanders et al. (2016) Sanders, J. S., Fabian, A. C., Taylor, G. B., et al. 2016, MNRAS, 457, 82, doi: 10.1093/mnras/stv2972
- Santos et al. (2007) Santos, W. A., Mendes de Oliveira, C., & Sodré, Laerte, J. 2007, AJ, 134, 1551, doi: 10.1086/521341
- Satyapal et al. (2005) Satyapal, S., Dudik, R. P., O’Halloran, B., & Gliozzi, M. 2005, ApJ, 633, 86, doi: 10.1086/449304
- Schellenberger et al. (2020a) Schellenberger, G., David, L. P., Vrtilek, J., et al. 2020a, arXiv e-prints, arXiv:2010.13804. https://arxiv.org/abs/2010.13804
- Schellenberger et al. (2017) Schellenberger, G., Vrtilek, J. M., David, L., et al. 2017, ApJ, 845, 84, doi: 10.3847/1538-4357/aa7f2e
- Schellenberger et al. (2020b) Schellenberger, G., David, L. P., Vrtilek, J., et al. 2020b, ApJ, 894, 72, doi: 10.3847/1538-4357/ab879c
- Schmitt et al. (2002) Schmitt, H. R., Pringle, J. E., Clarke, C. J., & Kinney, A. L. 2002, ApJ, 575, 150, doi: 10.1086/341211
- Schweizer (1980) Schweizer, F. 1980, ApJ, 237, 303, doi: 10.1086/157870
- Shabala & Godfrey (2013) Shabala, S. S., & Godfrey, L. E. H. 2013, ApJ, 769, 129, doi: 10.1088/0004-637X/769/2/129
- Shin et al. (2016) Shin, J., Woo, J.-H., & Mulchaey, J. S. 2016, ApJS, 227, 31, doi: 10.3847/1538-4365/227/2/31
- Shurkin et al. (2008) Shurkin, K., Dunn, R. J. H., Gentile, G., Taylor, G. B., & Allen, S. W. 2008, MNRAS, 383, 923, doi: 10.1111/j.1365-2966.2007.12651.x
- Simionescu et al. (2018) Simionescu, A., Tremblay, G., Werner, N., et al. 2018, MNRAS, 475, 3004, doi: 10.1093/mnras/sty047
- Singal (1993) Singal, A. K. 1993, MNRAS, 263, 139, doi: 10.1093/mnras/263.1.139
- Singh et al. (1995) Singh, K. P., Bhat, P. N., Prabhu, T. P., & Kembhavi, A. K. 1995, A&A, 302, 658
- Sivakoff et al. (2004) Sivakoff, G. R., Sarazin, C. L., & Carlin, J. L. 2004, ApJ, 617, 262, doi: 10.1086/425244
- Skipper & Browne (2018) Skipper, C. J., & Browne, I. W. A. 2018, MNRAS, 475, 5179, doi: 10.1093/mnras/sty114
- Smith et al. (2012) Smith, M. W. L., Gomez, H. L., Eales, S. A., et al. 2012, ApJ, 748, 123, doi: 10.1088/0004-637X/748/2/123
- Smith et al. (2008) Smith, R. M., Martínez, V. J., Fernández-Soto, A., Ballesteros, F. J., & Ortiz-Gil, A. 2008, ApJ, 679, 420, doi: 10.1086/587454
- Smith et al. (2004) Smith, R. M., Martínez, V. J., & Graham, M. J. 2004, ApJ, 617, 1017, doi: 10.1086/425890
- Spavone et al. (2006) Spavone, M., Iodice, E., Longo, G., Paolillo, M., & Sodani, S. 2006, A&A, 457, 493, doi: 10.1051/0004-6361:20065633
- Stanger & Warwick (1986) Stanger, V. J., & Warwick, R. S. 1986, MNRAS, 220, 363, doi: 10.1093/mnras/220.2.363
- Steinborn et al. (2016) Steinborn, L. K., Dolag, K., Comerford, J. M., et al. 2016, MNRAS, 458, 1013, doi: 10.1093/mnras/stw316
- Storn (1995) Storn, R. 1995, Technical report, International Computer Science Institute, 11. https://ci.nii.ac.jp/naid/20000924911/en/
- Su et al. (2017) Su, Y., Nulsen, P. E. J., Kraft, R. P., et al. 2017, ApJ, 851, 69, doi: 10.3847/1538-4357/aa989e
- Su et al. (2019) Su, Y., Kraft, R. P., Nulsen, P. E. J., et al. 2019, AJ, 158, 6, doi: 10.3847/1538-3881/ab1d51
- Subrahmanyan et al. (2003) Subrahmanyan, R., Beasley, A. J., Goss, W. M., Golap, K., & Hunstead, R. W. 2003, AJ, 125, 1095, doi: 10.1086/367797
- Sun (2009) Sun, M. 2009, ApJ, 704, 1586, doi: 10.1088/0004-637X/704/2/1586
- Tang et al. (2020) Tang, H., Scaife, A. M. M., Wong, O. I., et al. 2020, MNRAS, 499, 68, doi: 10.1093/mnras/staa2805
- Tang et al. (2009) Tang, Y., Gu, Q. S., Huang, J. S., & Wang, Y. P. 2009, MNRAS, 397, 1966, doi: 10.1111/j.1365-2966.2009.15038.x
- Taylor et al. (2002) Taylor, G. B., Fabian, A. C., & Allen, S. W. 2002, MNRAS, 334, 769, doi: 10.1046/j.1365-8711.2002.05555.x
- Taylor et al. (2006) Taylor, G. B., Sanders, J. S., Fabian, A. C., & Allen, S. W. 2006, MNRAS, 365, 705, doi: 10.1111/j.1365-2966.2005.09705.x
- Temi et al. (2018) Temi, P., Amblard, A., Gitti, M., et al. 2018, ApJ, 858, 17, doi: 10.3847/1538-4357/aab9b0
- Temi et al. (2007a) Temi, P., Brighenti, F., & Mathews, W. G. 2007a, ApJ, 660, 1215, doi: 10.1086/513690
- Temi et al. (2007b) —. 2007b, ApJ, 666, 222, doi: 10.1086/520123
- Temi et al. (2009) —. 2009, ApJ, 707, 890, doi: 10.1088/0004-637X/707/2/890
- Temi et al. (2003) Temi, P., Mathews, W. G., Brighenti, F., & Bregman, J. D. 2003, ApJ, 585, L121, doi: 10.1086/374326
- Tremblay et al. (2006) Tremblay, G. R., Quillen, A. C., Floyd, D. J. E., et al. 2006, ApJ, 643, 101, doi: 10.1086/502643
- Trinchieri & Goudfrooij (2002) Trinchieri, G., & Goudfrooij, P. 2002, A&A, 386, 472, doi: 10.1051/0004-6361:20020311
- Valluri & Anupama (1996) Valluri, M., & Anupama, G. C. 1996, AJ, 112, 1390, doi: 10.1086/118106
- Venkatesan et al. (1994) Venkatesan, T. C. A., Batuski, D. J., Hanisch, R. J., & Burns, J. O. 1994, ApJ, 436, 67, doi: 10.1086/174881
- Verdoes Kleijn et al. (1999) Verdoes Kleijn, G. A., Baum, S. A., de Zeeuw, P. T., & O’Dea, C. P. 1999, AJ, 118, 2592, doi: 10.1086/301135
- Verdoes Kleijn & de Zeeuw (2005) Verdoes Kleijn, G. A., & de Zeeuw, P. T. 2005, A&A, 435, 43, doi: 10.1051/0004-6361:20042271
- Voit et al. (2015) Voit, G. M., Donahue, M., O’Shea, B. W., et al. 2015, ApJ, 803, L21, doi: 10.1088/2041-8205/803/2/L21
- Vrtilek et al. (2002) Vrtilek, J. M., Grego, L., David, L. P., et al. 2002, in APS April Meeting Abstracts, APS Meeting Abstracts, B17.107
- Ward et al. (2021) Ward, C., Gezari, S., Frederick, S., et al. 2021, ApJ, 913, 102, doi: 10.3847/1538-4357/abf246
- Welch et al. (2010) Welch, G. A., Sage, L. J., & Young, L. M. 2010, ApJ, 725, 100, doi: 10.1088/0004-637X/725/1/100
- Werner et al. (2019) Werner, N., McNamara, B. R., Churazov, E., & Scannapieco, E. 2019, Space Sci. Rev., 215, 5, doi: 10.1007/s11214-018-0571-9
- Werner et al. (2014) Werner, N., Oonk, J. B. R., Sun, M., et al. 2014, MNRAS, 439, 2291, doi: 10.1093/mnras/stu006
- Wiklind et al. (1995) Wiklind, T., Combes, F., & Henkel, C. 1995, A&A, 297, 643
- Willis et al. (1981) Willis, A. G., Strom, R. G., Bridle, A. H., & Fomalont, E. B. 1981, A&A, 95, 250
- Wilson et al. (2013) Wilson, C. D., Cridland, A., Foyle, K., et al. 2013, ApJ, 776, L30, doi: 10.1088/2041-8205/776/2/L30
- Wolter et al. (2015) Wolter, A., Esposito, P., Mapelli, M., Pizzolato, F., & Ripamonti, E. 2015, MNRAS, 448, 781, doi: 10.1093/mnras/stv054
- Wood et al. (2017) Wood, R. A., Jones, C., Machacek, M. E., et al. 2017, ApJ, 847, 79, doi: 10.3847/1538-4357/aa8723
- Worrall et al. (2003) Worrall, D. M., Birkinshaw, M., & Hardcastle, M. J. 2003, MNRAS, 343, L73, doi: 10.1046/j.1365-8711.2003.06945.x
- Worrall et al. (2007) Worrall, D. M., Birkinshaw, M., Laing, R. A., Cotton, W. D., & Bridle, A. H. 2007, MNRAS, 380, 2, doi: 10.1111/j.1365-2966.2007.11998.x
- Worrall et al. (2010) Worrall, D. M., Birkinshaw, M., O’Sullivan, E., et al. 2010, MNRAS, 408, 701, doi: 10.1111/j.1365-2966.2010.17162.x
- Xilouris et al. (2004) Xilouris, E. M., Georgakakis, A. E., Misiriotis, A., & Charmandaris, V. 2004, MNRAS, 355, 57, doi: 10.1111/j.1365-2966.2004.08289.x
- Young et al. (2002) Young, A. J., Wilson, A. S., & Mundell, C. G. 2002, ApJ, 579, 560, doi: 10.1086/342918
- Young et al. (2011) Young, L. M., Bureau, M., Davis, T. A., et al. 2011, MNRAS, 414, 940, doi: 10.1111/j.1365-2966.2011.18561.x
- Zezas et al. (2005) Zezas, A., Birkinshaw, M., Worrall, D. M., Peters, A., & Fabbiano, G. 2005, ApJ, 627, 711, doi: 10.1086/430044
Appendix A Appendix: Individual sources
A detailed description of the radio emission morphologies of each source in our sample and additional relevant information on the multifrequency emission are given in the following sections. An asterisk (‘ * ’) after the name of the source indicates that it was observed as part of our VLA A-configuration project (ID: 15A-305, PI: Werner) from 2015.
A.1 3C 449
The low-power FR I radio source 3C 449 is the CDG of the 1.5 keV group/cluster Zwicky 2231.2+3732 at a luminosity distance of 76 Mpc. The radio emission extends out to almost 500 kpc (Perley et al., 1979; Andernach et al., 1992; Feretti et al., 1999) in the form of relativistic (up to 3.3 kpc) and well-collimated (up to 16.7 kpc) radio jets terminating in large diffuse radio lobes with a slight bend to the west (Figure B2.1a).
Associated X-ray emission from the hot gas and its interaction with the radio source has been studied by Hardcastle et al. (1998), Croston et al. (2003), and Lal et al. (2013). The X-ray cavities were observed coincident with the inner southern radio jet and the Chandra X-ray Observatory detected cold fronts, which likely originate from sloshing of the hot gas that could also contribute to the bending of the radio jets.
HST observations revealed a 600 pc dusty disk, the orientation of which is not perpendicular to the orientation of the radio jet axis (Feretti et al., 1999; Tremblay et al., 2006). The CO(1-0) transition line, as a tracer of molecular gas was detected by Ocaña Flaquer et al. (2010). The study of SOAR data revealed H[N II] line emission within the innermost 2 kpc from the core (Lakhchaura et al., 2018).
A.2 IC 1860
IC 1860 is CDG of the 1.3 keV group IC 1860 (Abell S301; Abell et al., 1989).
The observed radio emission in the VLA A configuration has a form of point-like191919Point-like morphology was found by Dunn et al. (2010) using observations at 1.4 GHz from 2007. radio source slightly elongated in the north-eastern and south-western direction (Figure B1.1a).
The XMM-Newton and Chandra data were analysed by Gastaldello et al. (2013) who found sharp surface brightness discontinuities (cold fronts) which they interpreted as evidence for sloshing, which could be a result of a minor merger with the spiral galaxy IC 1859 (this is also consistent with numerical simulations for relaxed clusters; Ascasibar & Markevitch, 2006). Moreover, their radio observations at lower frequencies with Giant Metre-wave Radio Telescope (GMRT) revealed a steep-spectrum diffuse radio emission enclosed by these cold fronts.
A.3 IC 4296*
IC 4296 is a giant elliptical galaxy and the CDG of Abell 3565.
The radio emission identified with the radio source PKS 1333-33, extends well beyond the host galaxy IC 4296. Our VLA A and D configuration data (Figure B2.1b) show a unresolved central radio source and extended radio emission in the form of two well-collimated (within the first 10 kpc from the core) radio jets expanding up to 150 kpc on both sides with many knots and wiggles and terminating in large radio lobes with a radius of 60-80 kpc. IC 4296 and its radio source (in VLA C configuration) was extensively studied by Kileen et. al (Killeen et al., 1986b, a; Killeen & Bicknell, 1988).
The X-ray emission from this giant elliptical galaxy was described by Pellegrini et al. (2003). Moreover, our analysis of the archival XMM-Newton data revealed an X-ray cavity associated with the north-western radio lobe (Grossová et al., 2019). The more in-depth X-ray spectral analysis of thermodynamical profiles show an unusually low central entropy and cooling time.
The presence of cooling gas in the form of warm H[N II] (at kpc scale) (Lakhchaura et al., 2018), molecular CO(2-1) emission (at 100 pc scale) (Boizelle et al., 2017; Ruffa et al., 2019) and a warped dust disk (at pc scale) (Schmitt et al., 2002) has been revealed in the central region.
More details of the potential unbalanced cooling in the nucleus and the relationship between the radio, X-ray and optical emission for IC 4296 is summarized in our paper (Grossová et al., 2019).
A.4 NGC 57*
NGC 57 is another giant elliptical galaxy from our proposal VLA A configuration data and identified as an isolated elliptical galaxy (Smith et al., 2004; O’Sullivan et al., 2007).
Our high resolution VLA A configuration total intensity image (Figure B1.1b) reveals, for the first time, a point-like radio morphology previously unseen in the TIFR GMRT sky survey (TGSS), the NRAO VLA sky survey (NVSS) or in the study by O’Sullivan et al. (2007). No dusty features (Goullaud et al., 2018) or warm gas (Lakhchaura et al., 2018) were found in this galaxy.
A.5 NGC 315
NGC 315 is well-known giant elliptical galaxy classified as a FR I radio source (Fanaroff & Riley, 1974), which resides in the central region of the NGC 315 (WBL 22) group.
The radio emission has been thoroughly studied at various radio frequencies by many research groups (Bridle et al., 1979; Willis et al., 1981; Klein et al., 1994; Mack et al., 1997; Laing et al., 2006; Worrall et al., 2007; Giacintucci et al., 2011, ; and references therein) and has the form of relatively symmetric radio jets with several wiggles and knots, which are inflating wiggles and knots, which extend almost 200 kpc. The SE jet is inflating a radio lobe, while the NW jet undergoes an apparent 180 degree bend and forms an extended plume (Figure B2.1c).
Chen et al. (2012) investigated the kinematic and spatial properties of the close galaxy members of NGC 315 and found a low density ambient X-ray gas environment, which could be the reason why the radio jet can expand to such a large distance from the core.
The X-ray analysis revealed a strong X-ray jet, which traces the radio synchrotron emission and extends up to about 10 kpc (Worrall et al., 2003, 2007; Donato et al., 2004, Figure B2.1c).
The optical emission is represented by a dusty disk perpendicular to the direction of the jets and a few dust patches (Capetti et al., 2000). Moreover, at the position of the HST dust patches, Morganti et al. (2009) found two HI absorption components. The cold molecular gas, traced by CO(1-0) line emission, was found with the IRAM telescope (Ocaña Flaquer et al., 2010). Moreover, Boizelle et al. (2021) detected a sub-kpc CO disk. The warmer nebulae, traced by H[N II] line, was observed by Ho et al. (1997), but not confirmed in the more recent study as presented in Lakhchaura et al. (2018) combing narrow-band imaging with long slit spectroscopic observations with SOAR.
A.6 NGC 410*
Another galaxy from our VLA A configuration project is a giant elliptical NGC 410 (Figure B1.1c), which is the CDG of the LGG 18 group (Kolokythas et al., 2018).
The radio emission with a point source-like morphology was previously observed with the VLA at various frequencies (Condon et al., 1998; Filho et al., 2002). The more recent study by Kolokythas et al. (2018) at lower frequencies (610 MHz) with the GMRT found a small extension of the radio emission to north-east with a total extent 10 kpc.
González-Martín et al. (2009) claimed no point source detection in the X-ray hard band (4.5-8.0 keV) with XMM-Newton (together with other evidence from the optical, UV and radio bands) and therefore classified NGC 410 as a galaxy without an AGN. The X-ray halo emission was detected in 0.5-7 keV band with Chandra (Lakhchaura et al., 2018).
A recent study with SOAR data, as summarized by Lakhchaura et al. (2018), revealed H[N II] line emission within the innermost 2 kpc from the core.
A.7 NGC 499
NGC 499 is the only one galaxy in our sample of 42 early-type sources without radio emission (Figure B1.1d) observed in the nucleus or in the extended diffuse region.
A faint radio source was observed within the 1.4 GHz NVSS survey (Condon et al., 1998) with a flux density of 0.7 mJy at (Brown et al., 2011), which is well above the sensitivity limit of our VLA observations (for more details see Section 5.1.1).
NGC 499 is a CDG of the NGC 499 group, which is a part of the Pisces cluster (Kim & Fabbiano, 1995). Paolillo et al. (2003) have shown that NGC 499 group is in the process of merging with the NGC 507 group (Section A.8).
The luminosity of the X-ray halo is relatively high ( erg/s; Dunn et al., 2010; Lakhchaura et al., 2018). Moreover, the Chandra image shows possible ghost cavities at about 10-15 kpc to the north and south of the nucleus, a sign of a previous AGN activity (Panagoulia et al., 2014; Kim et al., 2019).
Lakhchaura et al. (2018) present a detection of a centrally located warm nebular emission.
A.8 NGC 507*
NGC 507 is the CDG of the NGC 507 group, which belongs to the Pisces cluster. As mentioned in the previous section, the NGC 507 group is likely to be merging with the NGC 499 group (Section A.7).
The large-scale diffuse radio emission from a low-power FR I radio source B2 0120+33 (Parma et al., 1986) has a shape resembling a letter ‘’ formed by two radio lobes with diameters of 40 and 20 kpc (Dunn et al., 2010; Murgia et al., 2011). Interestingly, this emission has a very steep radio spectrum, possibly due to the ‘fossil’ radio material from previous AGN activity (Murgia et al., 2011).
The central part of the brighter western lobe was resolved also by our high resolution A configuration data (Figure B2.1d) and coincides with a Chandra X-ray cavity at 7 kpc to the south-west of the galaxy core (Dong et al., 2010).
On the other hand, the eastern radio lobe is bending to the south with its edge tracing a Chandra X-ray cold front (Fabbiano et al., 2002; Kraft et al., 2004), a result of sloshing. The disturbed morphology could be due to the ongoing merger with NGC 499 as studied and simulated by Ascasibar & Markevitch (2006). A different scenario is proposed by Kraft et al. (2004): the sharp-edged X-ray surface brightness profile could be entrained ICM material from the expanding eastern radio lobe.
XMM-Newton data also confirms the observed discontinuity (Fabbiano et al., 2002).
No warm (Lakhchaura et al., 2018) and cold gas was found inside of this giant elliptical galaxy.
A.9 NGC 533*
NGC 533 is the CDG of the NGC 533 group of galaxies.
The new high resolution A configuration data observed within our project 15A-305 revealed a central bow-tie-shaped radio emission with a total extent of 5 kpc (Figure B2.1e), which resembles the radio morphology of FR II radio sources (see Discussion 6.7).
NGC 533 is one of the two galaxies in our sample (besides NGC 708; Section A.10) which shows signatures of being a young radio galaxy (O’Dea, 1998): a compact morphology of the radio emission within the host galaxy without extended features, cavities in X-rays as a sign of small-scale interaction of the radio and X-ray plasma, a double morphology of the radio emission.
In comparison with the central X-ray emission, previously studied using Chandra X-ray images by Dunn et al. (2010) and Shin et al. (2016), we suggest that the radio lobes visible in the red contours in Figure B2.1e could correspond to the presence of the north-eastern and especially south-western X-ray cavity.
A.10 NGC 708
The giant elliptical galaxy, NGC 708 is a CDG of the cooling flow cluster Abell 262. Parma et al. (1986) and Blanton et al. (2004) defined this galaxy as a low-power FR I radio source.
VLA archival data in the A and C configuration (Figure B2.1f), also studied by Parma et al. (1986), Blanton et al. (2004), and Clarke et al. (2009), reveal a diffuse two-sided radio lobe-like emission with a total extent of 40 kpc from the central radio source B2 0149+35.
The radio emission from NGC 708, like NGC 533 (see Section A.9), resembles the emission of a young radio galaxy (O’Dea, 1998) due to its confinement within 10 kpc of the host galaxy without extended emission, interaction with the inner X-ray gas in form of cavities (Blanton et al., 2004; Clarke et al., 2009; Panagoulia et al., 2014), double radio morphology, and presence of the optical emission line [OIII] (Liuzzo et al., 2013).
The X-ray emission shows surface brightness dips, which could be signatures of cavities on both sides (especially on the eastern side of the core) consistent with the expanding diffuse radio emission (Blanton et al., 2004; Clarke et al., 2009). The X-ray analysis shows that the enthalpy of the radio lobes is not sufficient to balance radiative losses from the ICM, suggesting that NGC 708 may have shut down or be in a low-power phase of activity. This is also supported by the non-detection of radio emission on smaller scales with VLBI (Liuzzo et al., 2010).
A search for multiphase gas in NGC 708 was performed by Sahu et al. (2016). A molecular CO gas disk, with a total extent of 3 kpc, was discovered with ALMA by Braine & Dupraz (1994) and in more detail studied also by Russell et al. (2019), Olivares et al. (2019), and North et al. (2021).
The peak of the molecular gas emission coincides with the AGN core and is perpendicular to the projected orientation of the radio jets. The cool gas is also surrounded by dust lanes in the nuclear region (Sahu et al., 2016; Kulkarni et al., 2014).
The extended ( 13 kpc) warm nebula traced by H[N II] emission (Lakhchaura et al., 2018) is also consistent with the Chandra X-ray surface brightness peaks, which suggests that at least part of the hot X-ray gas is cooling at even larger distances from the core (Blanton et al., 2004).
A.11 NGC 741
NGC 741 is the CDG in the group holding the same name.
The radio structure, first studied by Venkatesan et al. (1994) and Birkinshaw & Davies (1985), was probably formed by the close passage of the second brightest galaxy in the group, the head-tail radio galaxy NGC 742 with the same redshift as NGC 741 (Schellenberger et al., 2017).
Our analysis, using a new high resolution A configuration total intensity image, confirms the radio emission in the form of a bridge connecting NGC 471 and NGC 742 and a prominent bent radio tail (to the southwest) in the C configuration total intensity image (Figure B2.1g).
A.12 NGC 777*
Compact radio emission is detected in our new VLA A configuration total intensity image with a resolution of 1.5 arcsec for NGC 777 (Figure B2.1h), the giant elliptical galaxy and the CDG of LGG 42 group. This compact morphology was also detected by Kolokythas et al. (2018) with GMRT.
Additionally, we also imaged the archival VLA C configuration data, where no radio emission was detected at the angular resolution of 3.2 arcsec, possibly due to the flux density being very close to the sensitivity limit of the VLA observations (see Section 5.1.1).
The X-ray emitting halo has an almost undisturbed morphology ( 40 kpc across) with a quite high luminosity of erg/s (when compared to the rest of the galaxies in the sample Lakhchaura et al., 2018). The X-ray surface brightness depressions were detected in the hot atmosphere of NGC 777 by Panagoulia et al. (2014).
Lakhchaura et al. (2018) reports a non-detection of any trace of warm ionized nebulae.
A.13 NGC 1132
NGC 1132 is a giant elliptical, which resides inside of the well-known fossil group NGC 1132.
Radio emission from the archival VLA C configuration data (Figure B1.1e) shows a point source morphology from the unresolved central source.
The outer contour level (; see Table 1) coincides with the possible shock front in the X-rays noticed by Kim et al. (2018) and could be connected to the merging history of NGC 1132 as suggested by Mulchaey & Zabludoff (1999) (and predicted by the simulations of Barnes, 1989; Governato et al., 1991). Moreover, Dong et al. (2010) found an X-ray cavity at a distance of 4 kpc south of the host galaxy’s center, which is consistent with the potential set of cavities detected in the southern regions by Plšek et al. (in prep).
No emission from warm gas emission was detected for this source (Lakhchaura et al., 2018).
A.14 NGC 1316
The giant elliptical galaxy, NGC 1316, hosts a well-known strong radio source Fornax A located at the outskirts of the Fornax cluster.
Radio emission in the higher resolution BA configuration image extends from the northwest to southeast in the form of an oblong letter ’S’ and represents the most recent of its AGN outbursts with the south-eastern extension also visible in the C configuration image (Figure B2.2a), (both previously published; Fomalont et al., 1989; Maccagni et al., 2020, 2021).
Several generations of X-ray cavities are visible in the XMM-Newton and Chandra images (Lanz et al., 2010).
A.15 NGC 1399*
The radio emission of NGC 1399, the CDG of the Fornax cluster, has a two-sided extended radio morphology in the form of two well-collimated radio jets terminating in two mildly diffuse radio lobes (Figure B2.2b). Similar morphological features were previously discussed in Shurkin et al. (2008) and Dunn et al. (2010).
A.16 NGC 1404*
The giant elliptical NGC 1404, also part of our new A configuration VLA observation, is another member of the Fornax cluster. Machacek et al. (2005) suggested that NGC 1404 is falling towards the center of the Fornax cluster, where NGC 1399 (Section A.15) resides.
Our new VLA A configuration data (Figure B1.1f) at high sensitivity with the RMS noise of the total intensity image reaching Jy per beam revealed a faint (flux density of Jy per beam) central radio source and thus supporting the previous findings of Dunn et al. (2010), where the detection was very close to the sensitivity limit. Moreover, the central radio source was also detected in VLBI observations, which can be found in the archive of Leonid Petrov202020http://astrogeo.org/cgi-bin/imdbgetsource.csh?source=J0338-3527) On the other hand, a more compact archival VLA CD configuration observation did not detect radio emission, maybe due to a lower flux density than the sensitivity limit (see Section 5.1.1).
A.17 NGC 1407*
Another object within our sample with a newly observed VLA A configuration data is NGC 1407. This giant elliptical galaxy is located inside in the dynamically relaxed NGC 1407 (Eridanus A) group, part of the Eridanus supergroup.
The radio emission from the new A configuration data does not show a very distinctive radio point source in the nucleus (Figure B2.2c). More prominent is the diffuse morphology with asymmetric radio jet-like structures, extending especially to the east as seen also in the archival VLA B and C configuration data (Giacintucci et al., 2012).
From the multiband and multifrequency study (Giacintucci et al., 2012) reoccurring activity of the AGN has been suggested, similar to that found for another fossil giant elliptical galaxy in our sample, NGC 5044 (Section A.37).
Only an upper limit on the flux density of CO(1-0) emission is found for NGC 1407 (Babyk et al., 2019).
A.18 NGC 1550*
NGC 1550 is the CDG of the group of galaxies having the same name.
The radio emission observed within our new high resolution A configuration observation revealed asymmetric small-scale jets with a physical extent of 4 kpc. At the lowest contour level created at , we find a small hotspot-like feature at the distance of 6 kpc. This feature seems not to be the extension of the jet and is located within the diffuse lobe-like emission visible in the compact archival C configuration total intensity image (Figure B2.2d), previously published by Dunn et al. (2010).
The lower frequency GMRT study supports the presence of the diffuse lobe-like morphology (Kolokythas et al., 2018). They also found that the inward-bended eastern jet seems to be aligned with the potential hotspot feature seen in the VLA A configuration contours (Figure B2.2d).
Kolokythas et al. (2020), in their recent radio and X-ray study found a sign of sloshing of the ambient IGM around NGC 1550, previously known as relaxed. They present arc-shaped cold fronts together with a potential X-ray cavity (supported by the findings of Panagoulia et al., 2014) coincident with the position of the radio lobe.
Neither molecular gas nor cold dusty features have not yet been observed and Lakhchaura et al. (2018) presents non-detection of warm ionized nebulae for this giant elliptical galaxy.
A.19 NGC 1600
NGC 1600 is a relatively isolated CDG of the NGC 1600 group of galaxies (Smith et al., 2008).
The radio emission was previously published by Birkinshaw & Davies (1985) at 4.85 GHz with VLA in C configuration and shows a potential double radio source without a clearly defined radio core. The higher resolution A configuration data at 1.4 GHz (Figure B2.2e) shows in more detail the radio jets/lobes features and potential hotspots, which could resemble the morphology of FR II radio source (see Discussion 6.7).
The X-ray emission from Chandra X-ray image shows a diffuse structure, which seems to show two surface brightness depressions at the positions of the two radio lobe structures, previously studied by Sivakoff et al. (2004).
A.20 NGC 2300*
The radio emission from our new VLA A configuration data for NGC 2300, the central dominant galaxy of the NGC 2300 group, shows a point-like morphology (Figure B1.1g). The archival VLA D configuration data reveals radio point source emission, as well (Figure B1.1g) .
NGC2300 is known to undergo tidal interactions with a late-type active star-forming galaxy NGC 2276 (Wolter et al., 2015). Plšek et al. in prep. detected potential ‘ghost’ X-ray cavities in NGC 2300.
A.21 NGC 3091*
NGC 3091 is a part of our VLA high resolution project from 2015 and is the CDG of a poor Hickson Compact Group, HCG 42 (Hickson, 1982) (Colbert et al., 2001).
The radio morphology, seen in the highest resolution 2 arcsec VLA A configuration data (Figure B1.1h), is represented by a faint point source-like radio emission in the center of the galaxy. The AB configuration data with 14 arcsec resolution at the same frequency (1.4 GHz) reveals no detection, maybe because of a lower flux density limit of our VLA observation (see Section 5.1.1).
Even though radio emission has a point-like morphology, Plšek et al. (in prep.) detected potential ‘ghost’ cavities in the X-ray hot atmosphere.
A.22 NGC 3923*
The biggest early-type galaxy, NGC 3923, located in the optical group (LGG 255) with only galaxy-scale X-ray halo has an oval-shaped radio morphology in our new VLA A configuration data (Figure B1.2a), while the archival C and CD configuration data show no radio emission. This source was observed in the 5 GHz survey done by Disney & Wall (1977).
Chandra data have shown potential X-ray surface brightness decrements in the form of ‘ghost’ cavities without corresponding radio emission from radio jets and lobes in this giant elliptical galaxy (Plšek et al. in prep.).
NGC 3923 is a famous shelled212121NGC 3923 has between 22 and 42 shells, the largest number of shells observed in the elliptical galaxy. giant elliptical with dusty filamentary features and H emission in the central region (Bílek et al., 2016; Miller et al., 2017). On the other hand, Lakhchaura et al. (2018) reported non-detection of warm gas in the core.
A.23 NGC 4073*
The giant elliptical NGC 4073 is dominant member of the poor cluster MKW 4 and shows a point source-like radio morphology in our new high resolution VLA A configuration observation (Figure B1.2b). A weak detection of the central radio source has been reported by Hogan (2014) with VLA in the C-band (4–8 GHz).
A.24 NGC 4125
NGC 4125 is a luminous giant elliptical galaxy residing in the NGC 4125 group (alternatively called LGG 266).
The radio emission (Figure B1.2c), detected in the archival D configuration data, has a diffuse morphology with an extension to the northeast, corresponding to a point-like radio source visible in the archival 1.4 GHz Westerbork Synthesis Radio Telescope (WSRT) observations. More prominent structure has a form of inflated radio lobes, which are offset by 4 kpc (46 arcsec) in projection with respect to the radio, optical, and X-ray core of NGC 4125. This offset was also noticed in the NVSS data at 1.4 GHz by M. Rupen et al. in their online notes222222 https://www.cv.nrao.edu/ jhibbard/HIinEs/HIinE.html about VLA H I data of early-type galaxies and by Krajnović & Jaffe (2002) in the VLA C configuration observations at 8.3 GHz. In both studies, only the central regions of the offset radio lobes were detected. The radio core corresponding to the X-ray and optical center of NGC 4125 was missing and is only clearly visible in the WSRT images. Moreover, due to the missing optical counterpart of the extended radio-lobe like emission, Krajnović & Jaffe (2002) defined NGC 4125 as a background source (see Discussion 6.6.2 for a possible explanation of this unusual emission).
González-Martín et al. (2006) studied NGC 4125 as a part of the X-ray study of LINER galaxies and identified a centrally located hard X-ray point source-like emission, which is a sign of ongoing AGN activity. The extended cold emission from the large amount of dust (Kulkarni et al., 2014), [C II] and [N II] has been observed, but no CO232323Wiklind et al. (1995) claimed detection of CO(1-0) line, which was not confirmed by Welch et al. (2010)., H I (Welch et al., 2010; Wilson et al., 2013) or H[N II] emission (Lakhchaura et al., 2018). This could be explained by a merger-triggered star formation outburst providing heated gas and dust to the surrounding medium of the galaxy.
A.25 NGC 4261
NGC 4261 is the optical counterpart to the radio source 3C 270 (Birkinshaw & Davies, 1985), which is a very well known FR I radio source inside the Virgo cluster (W cloud; Garcia, 1993) with well-defined radio jets and large radio lobes piercing through the atmosphere of the host galaxy and extending beyond from the core (Figure B2.2f).
A detailed study, combining data from the GMRT and VLA as well as comparing the radio emission with the X-ray emission of the hot gas, was published by Kolokythas et al. (2015) and O’Sullivan et al. (2011).
From the X-ray point of view, NGC 4261 has an extended X-ray halo (Davis et al., 1995) with features showing the interaction with radio source in the form of X-ray cavities (Croston et al., 2008; O’Sullivan et al., 2011). On small scales, X-ray jets are present corresponding to the innermost collimated radio jets (Gliozzi et al., 2003; Zezas et al., 2005; Worrall et al., 2010).
On the parsec scale, Jaffe & McNamara (1994) and Ferrarese et al. (1996) found a warped dusty disk with the rotational axis perpendicular to the direction of the radio jets streaming out of the nuclear region and extending up to 100 pc from the core. The presence of atomic and molecular gas from H I and CO (2–1) was detected too. Moreover, a sub-kpc CO disk was recently detected by Boizelle et al. (2021).
A.26 NGC 4374
Messier 84 or NGC 4374 is a giant elliptical galaxy in the Virgo A group, which is a part of the Virgo cluster together with NGC 4406 (Section A.27), NGC 4486 (Section A.29), and NGC 4552 (Section A.30).
The radio emission in the archival B configuration data (Figure B2.2g) shows well-defined and in the central regions well-collimated jets terminating in diffuse plum-like lobes (first published by Laing & Bridle, 1987) with the northern lobe brighter than the southern and bent to the east. VLA D configuration data reveal pear-like diffuse emission extending beyond the B configuration data. Moreover, the VLBA data analysed by Ly et al. (2004) revealed a jet-like extension in the direction consistent with the northern radio jet from the VLA.
A.27 NGC 4406*
NGC 4406, know as M 86, is located in the Virgo cluster and flying in the direction towards us. Our new VLA A configuration data at 1.5 GHz (Figure B1.2d) reveal a faint, point-like radio emission in the center of this giant elliptical. Similarly, Dunn et al. (2010) found point-like radio emission in the nuclear region at higher frequencies at around 4.9 GHz in the C configuration data. On the other hand, complementary archival data in VLA D configuration at 1.4 GHz have not detected any radio emission from the core, possibly due to the high noise level of the observation (for more details see Table 1).
NGC 4406 is the second X-ray brightest giant elliptical in Virgo cluster (after M 87) and its negative radial velocity suggests a supersonic movement through the ICM. This could create the observed X-ray features (plume and tail) by ram pressure stripping (Forman et al., 1979; Randall et al., 2008; Ehlert et al., 2013; Kim et al., 2019).
A.28 NGC 4472*
NGC 4472, or M 49, is an early-type elliptical and CDG of the M 49 group falling from the south into the Virgo cluster and it is possibly in the second turn around the cluster center (Su et al., 2019).
NGC 4472 was observed in our 2015 project in VLA A configuration (Figure B2.2h). Additionally, we also reduced archival VLA C configuration data (Condon & Broderick, 1988).
The high angular resolution of the A configuration total intensity image (Figure B2.2h contours) showed the radio emission from the innermost central region in the form of an elongated amorphous feature with the extended tail to the west and a small sign of radio emission to the north-east.
On the other hand, using the more compact C configuration array, the extended radio emission with a total extent of 10 kpc is seen (Ekers & Kotanyi, 1978). The central regions in the C configuration image are consistent with the radio features in the A configuration. Additional extended lobe-like structures are observed to the east and west of the nucleus.
The eastern lobe is consistent with a decrement in the X-ray surface brightness, one of the X-ray cavities observed in this source (for more details see, e.g. Biller et al., 2004; Kraft et al., 2011; Panagoulia et al., 2014; Su et al., 2019). Warm gas is missing in the central or extended regions of this giant elliptical galaxy (Lakhchaura et al., 2018).
A.29 NGC 4486
NGC 4486 or Messier 87, is the central dominant galaxy of the Virgo cluster. Here, we summarize the results obtained from the archival A, B, and C configuration data (Figure B2.3a).
The bright radio core, 3C 274, was detected along with its innermost radio jet, which is coincident with the X-ray emission of the jet (Marshall et al., 2002). On the opposite side of the core, an elongated lobe-like emission is visible and coincides with an X-ray cavity (Young et al., 2002; Forman et al., 2005, 2007). The archival C configuration VLA map, which is more sensitive to extended structures, presents a western tail extending up to 10 kpc from the nucleus. However, we note that at 300 MHz the entire structure of NGC 4486 is far more extended (up to 80 kpc, e.g.: Owen et al., 2000).
A.30 NGC 4552
The radio emission from the giant elliptical NGC 4552 or M 89, which resides inside of the subgroup A of the Virgo cluster, is presented in Figure B2.3b.
The red contours are showing the innermost radio point-like emission from the archival high resolution VLA A configuration. More recent (Project ID: 16A-275) previously unpublished C configuration data revealed a more diffuse butterfly-like emission extending on both sides to about 0.8 kpc.
The relativistic plasma from the jet-like emission is clearly interacting with the hot X-ray emitting gas and forming on both sides X-ray cavities. Machacek et al. (2006) and Allen et al. (2006) analysed the Chandra X-ray data and found two bright rings surrounding the two cavities to the north and south, which are perpendicular to the radio structures seen in the VLA images. Moreover, Machacek et al. (2006) also found signatures of ram pressure stripping of hot gas as the galaxy moves through the ICM of the Virgo cluster (see also: Kraft et al., 2017).
A.31 NGC 4636
NGC 4636 is a central early-type galaxy within a poor group in the far outskirts of the Virgo Cluster. VLA A configuration images, as presented in Figure B2.3c, have been previously published and discussed by Dunn et al. (2010). The additional archival C configuration VLA data from 2017 revealed a more diffuse, but still quite compact and weak radio-jet-like emission with a total extent of 3.5 kpc. Although the majority of detected radio emission in VLA is consistent with the radio emission at lower frequencies (235 and 610 MHz) with GMRT observed by Giacintucci et al. (2011), they also found a more extended north-eastern radio lobe, which is coincident with the observed X-ray (NE) cavity(Stanger & Warwick, 1986; Jones et al., 2002; Allen et al., 2006; Baldi et al., 2009; Panagoulia et al., 2014). The SW radio lobes are filled only partially with relativistic plasma.
A.32 NGC 4649
The giant elliptical galaxy NGC 4649, or M 60, is the third most luminous galaxy in the Virgo Cluster. Archival VLA data obtained in the A configuration reveal point-like emission from a weak central radio source in NGC 4649.
Using D-configuration data, Shurkin et al. (2008) and Dunn et al. (2010) found radio lobes filling the innermost X-ray cavities.
A.33 NGC 4696
Figure B2.3e reveals a radio emission in NGC 4696, the CDG of Abell 3526 (Centaurus Cluster) from archival VLA observations obtained in the A and BC configurations.
A thorough study of the radio properties was performed by Taylor et al. (2002) and our total intensity image of VLA A configuration data is consistent with their results, where the radio emission shows a bright nuclear source, radio jets and lobes with the western lobe bending towards east.
The interaction with the hot X-ray atmosphere is clearly present, as the radio plasma pushed out the hot gas and created cavities (Taylor et al., 2006; Panagoulia et al., 2014; Sanders et al., 2016). Interestingly, González-Martín et al. (2006) found only a diffuse morphology without a clear point-like emission in the hard X-ray bands as a sign of a central star-bursting activity. They also noted that the X-rays could be just obscured by the dust and gas. The ongoing AGN activity is supported by our VLA A configuration data together with the VLBA observation of a small-scale one-sided jet detected by Taylor et al. (2006).
A.34 NGC 4778
NGC 4778 or NGC 4761 is the only one lenticular (S0) galaxy in our sample and the CDG of a bright compact group, HCG 62 (Hickson, 1982). It is in the process of merging with its companion NGC 4776 (or NGC 4759 Spavone et al., 2006). A small point source-like central radio emission is observed in both archival VLA A (Vrtilek et al., 2002) and D configuration total intensity images (Figure B1.2e).
Moreover, looking at the lower radio frequencies with GMRT, Gitti et al. (2010) found the expected radio lobes, coincident with the observed X-ray cavities (Morita et al., 2006; Panagoulia et al., 2014) and Giacintucci et al. (2011) detected a possible second outer set of radio lobes.
The H emission in NGC 4778 was detected and studied by Valluri & Anupama (1996).
A.35 NGC 4782
The radio source known as 3C 278 is hosted by the giant elliptical galaxy NGC 4782 in the center of the group LGG 316.
Radio emission, shown in the archival high resolution A configuration image (Figure B2.3f) is rather peculiar as already noted by Borne & Colina (1996) and Machacek et al. (2006). The radio jets emanating from the core are, at first invisible due to the high relativistic velocities. After 2 kpc the eastern side of the jet is tilted to the north, whereas the western side continues in a straight line up to 15 kpc, where it bents to the north as well. When using a more compact B configuration, a more diffuse radio emission is observed, which not only traces the peculiar bend of the jets, but also fills the space between and around the jet structure.
The X-ray images reveal an interaction with the neighbor NGC 4783, which could be responsible for the observed bend of the jet. Moreover, X-ray cavities have been observed at the position of both radio lobes (Borne & Colina, 1996; Machacek et al., 2006).
A nuclear (within 2 kpc from the core) warm ionized nebula was detected with SOAR (Lakhchaura et al., 2018), otherwise no cool gas or dust was found in this giant elliptical galaxy.
A.36 NGC 4936*
The radio emission from the giant elliptical galaxy NGC 4936 in our new VLA A configuration total intensity image (Figure B1.2f), shows a point-like radio emission from the nucleus.
Macchetto et al. (1996) studied the warm ionized gas and found H[N II] emission concentrated in a small disk similar to NGC 4872 (Section A.35). The neutral gas, in the form of a double peaked H I line profile, was observed for this giant elliptical by Reid et al. (1994) (and references therein), together with strong emission from N II, S II and O I in the core of NGC 4936.
A.37 NGC 5044
NGC 5044 is the central dominant galaxy of the X-ray bright group NGC 5044, which is well known for its large cold gas reservoir.
Archival radio observations in the A, BnA and D configurations of the VLA presented in Figure B2.3g reveal emission from the central radio source with small-scale jets pointing to north-east and south-west (partly visible in the images analysed by Dunn et al., 2010). The previously unobserved indications for diffuse jet-like emission extending to about 6 kpc from the core in the east-west direction are seen in VLA B configuration contours. More diffuse oval-shaped radio emission extending up to 20 kpc is seen in the D configuration.
NGC 5044 has undergone (at least) three AGN outbursts. Gastaldello et al. (2009), David et al. (2011), Giacintucci et al. (2011), David et al. (2017), and Schellenberger et al. (2020b) presented GMRT and Chandra data, which revealed that the radio emission is consistent with the presence of the innermost southern X-ray cavity. They also found a second pair of more extended (up to 10 kpc) ghost X-ray cavities, which suggest another episode of an AGN outburst in NGC 5044. The last, the third, and most recent activity, is traced in the most recent study (Schellenberger et al., 2020a), where they also show the presence of small-scale radio jets seen in VLBI data.
Sloshing features are also observed at further distances from the center caused by the accretion of a less massive group (Gastaldello et al., 2009).
The filamentary morphology of the H[N II] ionized nebulae extends up to 6 kpc (Ferrari et al., 1999), whereas the corresponding dust emission extends to only 1.3 kpc (Temi et al., 2007a, b), similar to NGC 4472 (Section A.28).
Studies done by David et al. (2014a); Temi et al. (2018), and Schellenberger et al. (2020b) showed that CO emitting molecular gas clouds within 10 kpc from the core coincide well with the presence of the strong emission from the warm ionized gas (H filaments), the hot X-ray emitting gas, the innermost X-ray cavities (Schellenberger et al., 2020a) and the cold dust features in the central regions of NGC 5044 as well as [C II] line emission (Werner et al., 2014). Moreover, two CO absorption features were also detected within 5 pc from the core (Schellenberger et al., 2020a).
A.38 NGC 5129*
NGC 5129 is a radio-quiet giant elliptical and the dominant galaxy of a small group.
Our new A configuration data (Figure B2.3h) revealed a bright radio core with small-scale radio jets extending to about 2 kpc to the north-west and south-east from the core. We categorized this source as a compact radio source with radio jets. We find that the radio emission is offset by 1.2 arcsec from the X-ray and optical core of the galaxy. The point-like radio emission in NGC 5129 was previously observed by the NVSS survey (Condon et al., 1998).
The hot X-ray gas in the Chandra images has a disturbed morphology, which is not aligned with the direction of the radio jets. The X-ray gas properties were previously studied by Bharadwaj et al. (2014).
Warm ionized gas extending up to 2 kpc from the core was detected (Lakhchaura et al., 2018).
A.39 NGC 5419*
NGC 5419 is the CDG of the poor cluster A753, which hosts the radio source PKS B1400-33.
Our new A configuration VLA observations revealed extended radio emission in the core of the galaxy. Archival VLA CD configuration data (Figure B2.4a) (Goss et al., 1987) show a more extended emission, which forms an L-shaped radio tail to the south extending to about 35 kpc and a second prominent diffuse 120 kpc-in-diameter steep spectrum radio relic. This is a unusual feature for a poor cluster (previously observed by Subrahmanyan et al., 2003).
From the multifrequency data analysis, Subrahmanyan et al. (2003) suggests that this diffuse extended emission could be the remnant plasma of a radio lobe (although no parent optical source has been identified) injected into the poor cluster.
X-ray images showed that the hot gas coincides with the central radio emission of NGC 5419 (Balmaverde & Capetti, 2006).
A.40 NGC 5813
NGC 5813 resides in the NGC 5846 group, where NGC 5846 (Section A.41) is the brightest central galaxy.
Archival data in VLA A, B, and C configuration at 1.4 GHz (Randall et al., 2011) revealed signatures of AGN activity in radio images, when compared with the Chandra X-ray images (Randall et al., 2015, Figure B2.4b). The position of the central radio core is consistent with the X-ray brightness peak and the radio lobe-like emission corresponds well with the innermost X-ray cavities, especially the northern part of the inner region (Randall et al., 2011; Panagoulia et al., 2014). Additionally, the compact C configuration data reveal more diffuse emission with small ripples to the north-east and south-west, but without a clear interaction with a second pair of more extended X-ray cavities (Randall et al., 2015). The radio emission filling the second generation of cavities is found at lower frequencies with LOFAR (Bîrzan et al., 2020) and GMRT (Giacintucci et al., 2011).
The ionized gas shows a filamentary morphology and is coincident with dust emission (Ferrari et al., 1999). The ionised gas appears to be located in the wake of the rising AGN inflated bubbles (Randall et al., 2011). The cooling lines of [C II], [N II], and O I and warm nebulae were observed too (Werner et al., 2014; Lakhchaura et al., 2018).
A.41 NGC 5846
NGC 5846 is a giant elliptical galaxy and a CDG of the massive group holding the same name.
The innermost central region hosts a radio core surrounded by a more diffuse radio emission (Figure B2.4c), which also appears to fill the innermost X-ray cavities (Trinchieri & Goudfrooij, 2002; Dunn et al., 2010; Machacek et al., 2011; Panagoulia et al., 2014). The extended and diffuse emission, with a total extent of 12 kpc, is traced by the contours of the archival CnD configuration image. The results of the presented VLA data were previously published in Machacek et al. (2011).
The X-ray image analysis revealed multiple signatures of sloshing in NGC 5846 (Machacek et al., 2011), although, without a distinctive X-ray core in the central regions (Trinchieri & Goudfrooij, 2002; Satyapal et al., 2005; González-Martín et al., 2006).
The ionized and molecular plasma coincides with the disturbed nuclear X-ray emission, [C II] line emission and cold, dusty features in the central regions of NGC 5846. (Macchetto et al., 1996; Caon et al., 2000; Trinchieri & Goudfrooij, 2002; Werner et al., 2014; Temi et al., 2007b, 2009; Mathews et al., 2013; Lakhchaura et al., 2018).
A.42 NGC 7619*
The giant elliptical galaxy, NGC 7619, is the CDG of the Pegasus I group.
Our new VLA data in the A configuration have revealed a central radio source with a small extension to the east of the core (Figure B1.2g), consistent with previously observed point-like morphology in the archival VLA C configuration data. This findings are consistent with the emission in NVSS (Condon et al., 1998) and with GMRT observations at lower frequencies (at 610 MHz) by Giacintucci et al. (2011).
The X-ray image analysis revealed a ram-pressure-stripped tail (to the south-west of the nuclear region) as a result of NGC 7619 falling towards the center of the Pegasus cluster and interacting with the companion NGC 7626 with radio jets/lobes morphology (Randall et al., 2009) located 415 arcseconds (102 kpc) from NGC 7619.
The study of ionized gas performed by Macchetto et al. (1996) showed a circumnuclear emission with an additional extended tail from the north-east to south-west. Although, the subsequent long slit spectroscopy and narrow band imaging observations with SOAR did not confirm the previous findings of H[N II] emission (Lakhchaura et al., 2018). CO line emission was detected by Temi et al. (2007a) for this giant elliptical galaxy.
Appendix B Appendix: X-ray and radio images
B.1 X-rays and point-like radio emission
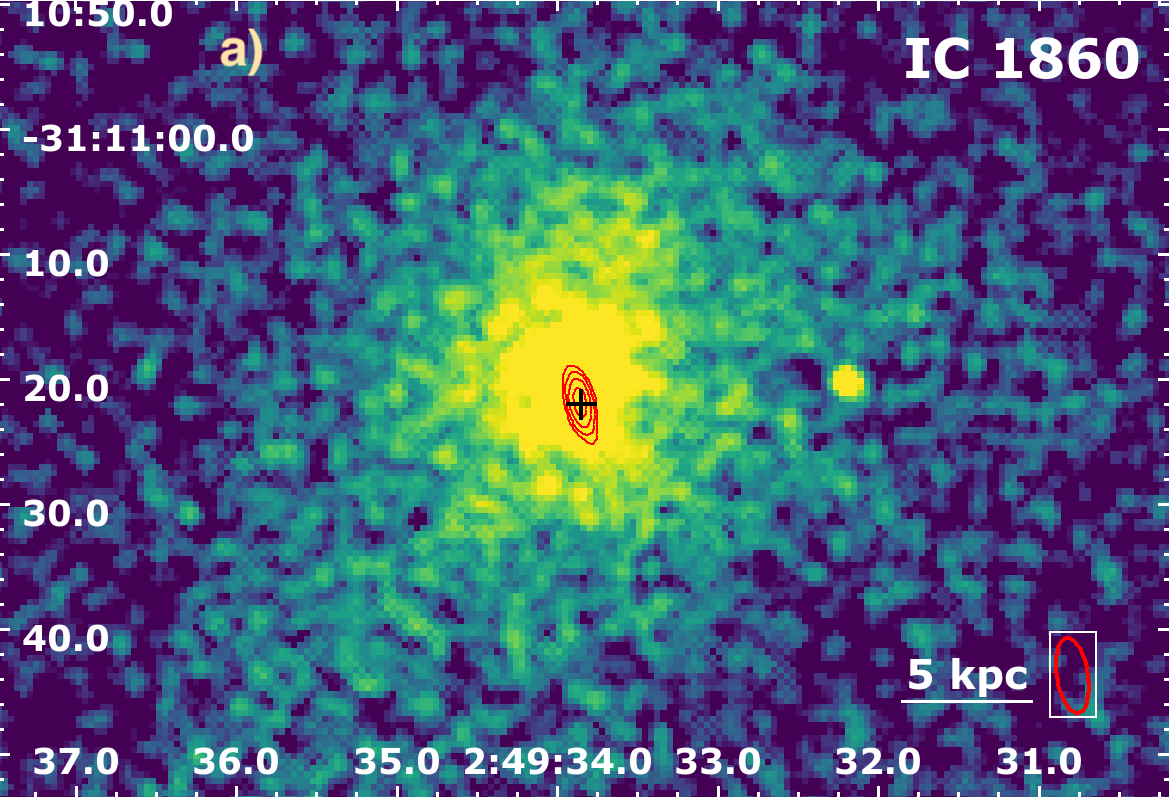
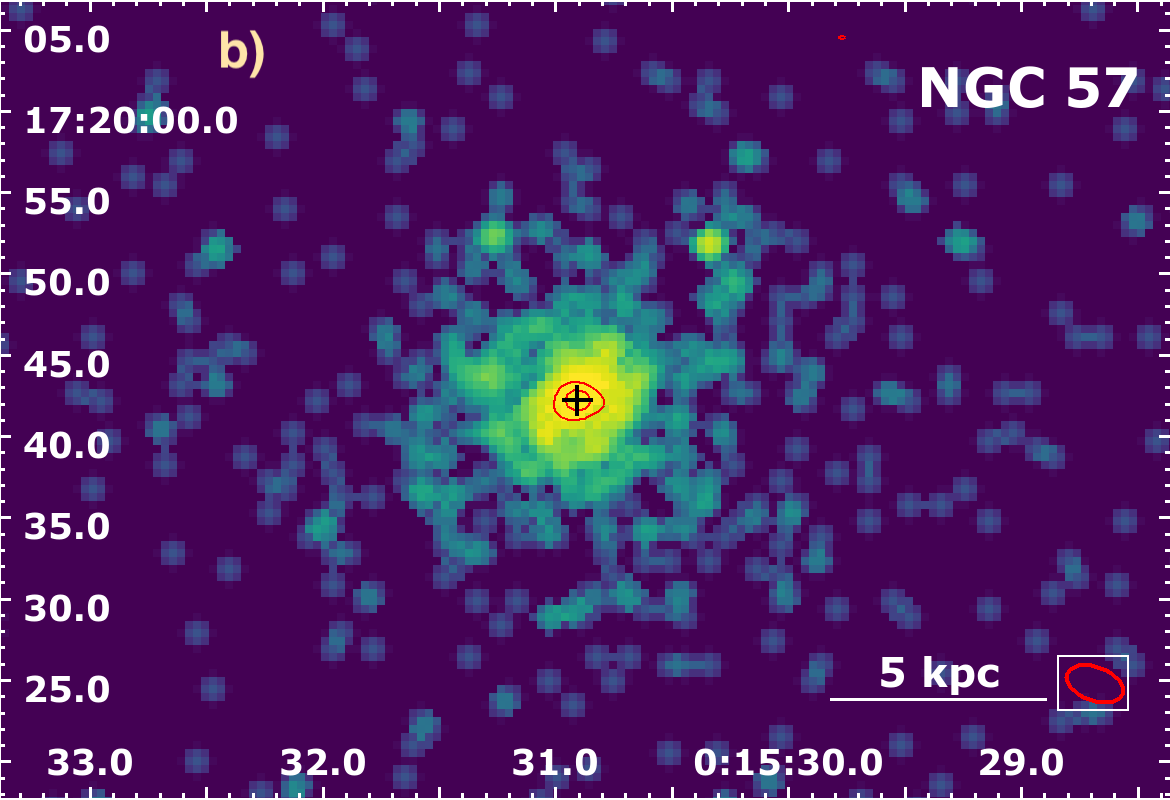
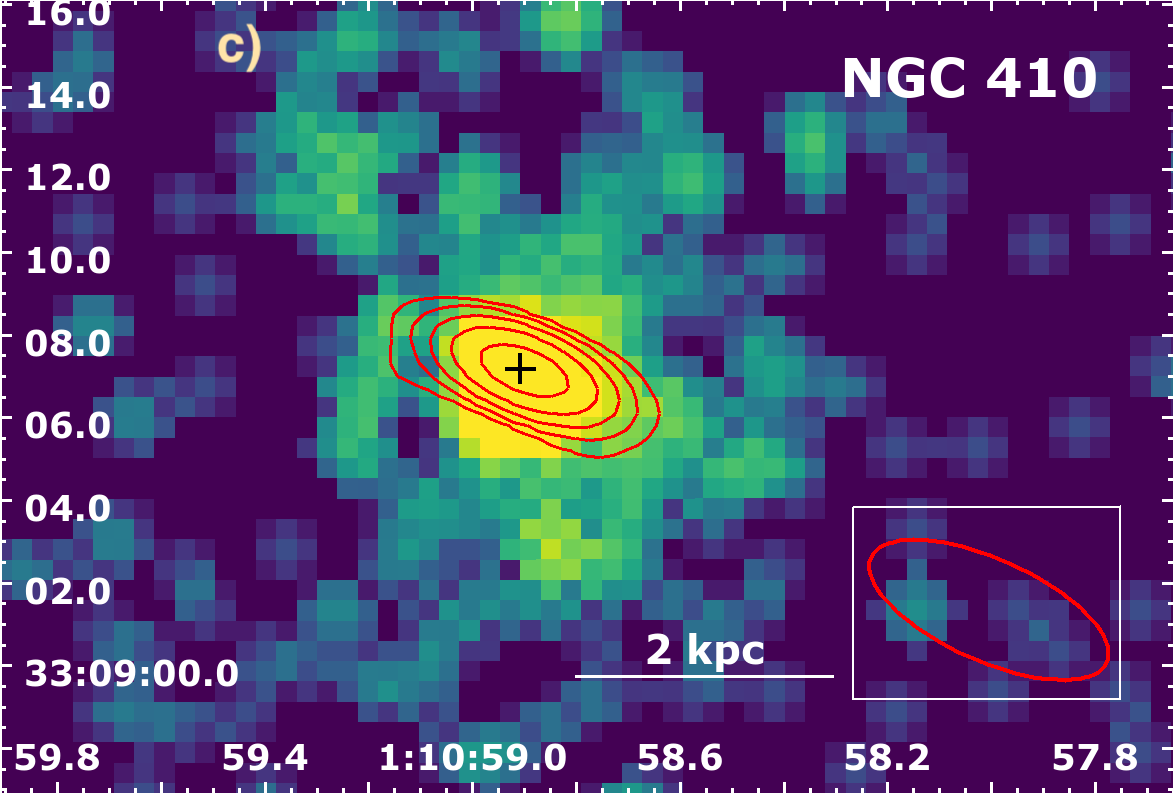
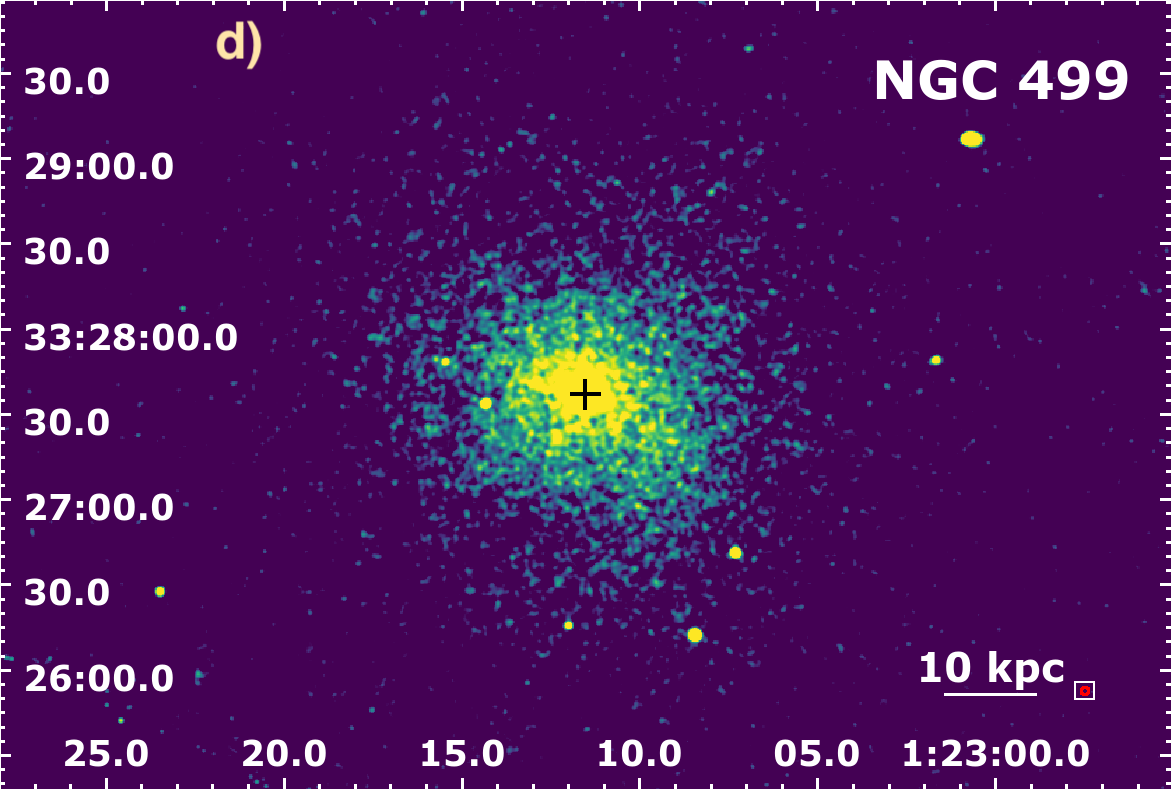
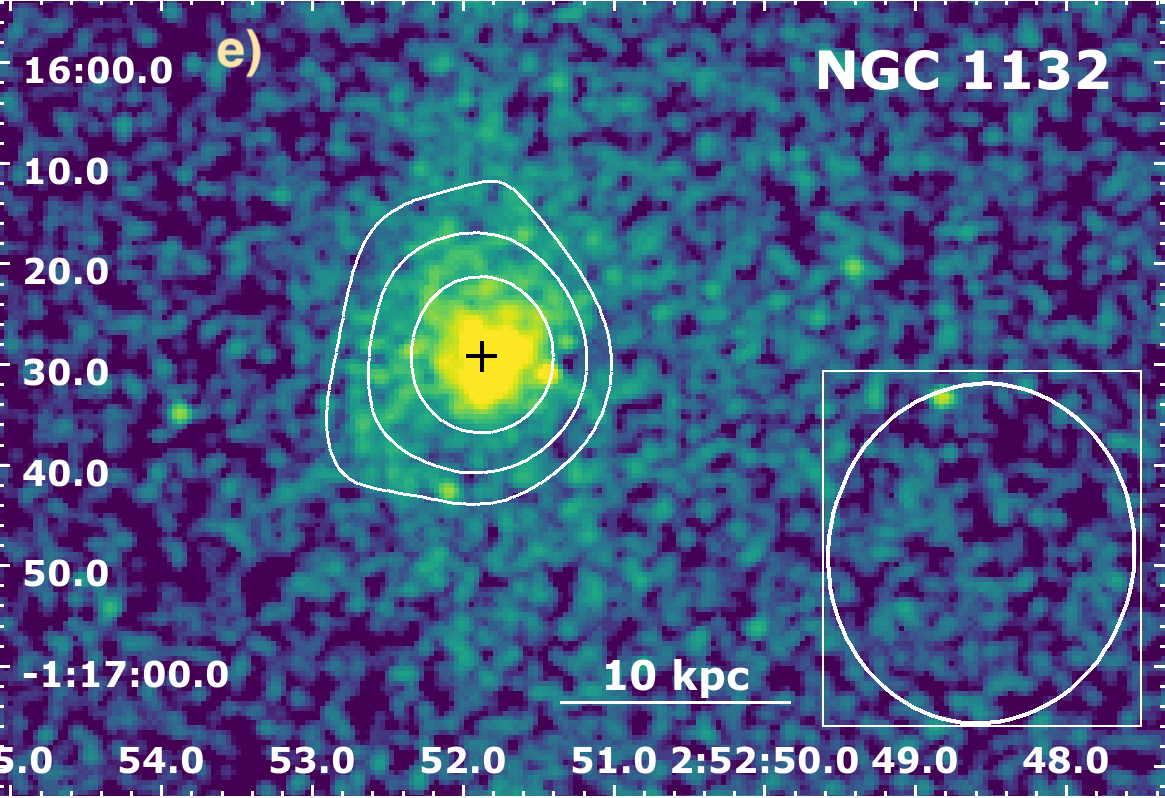
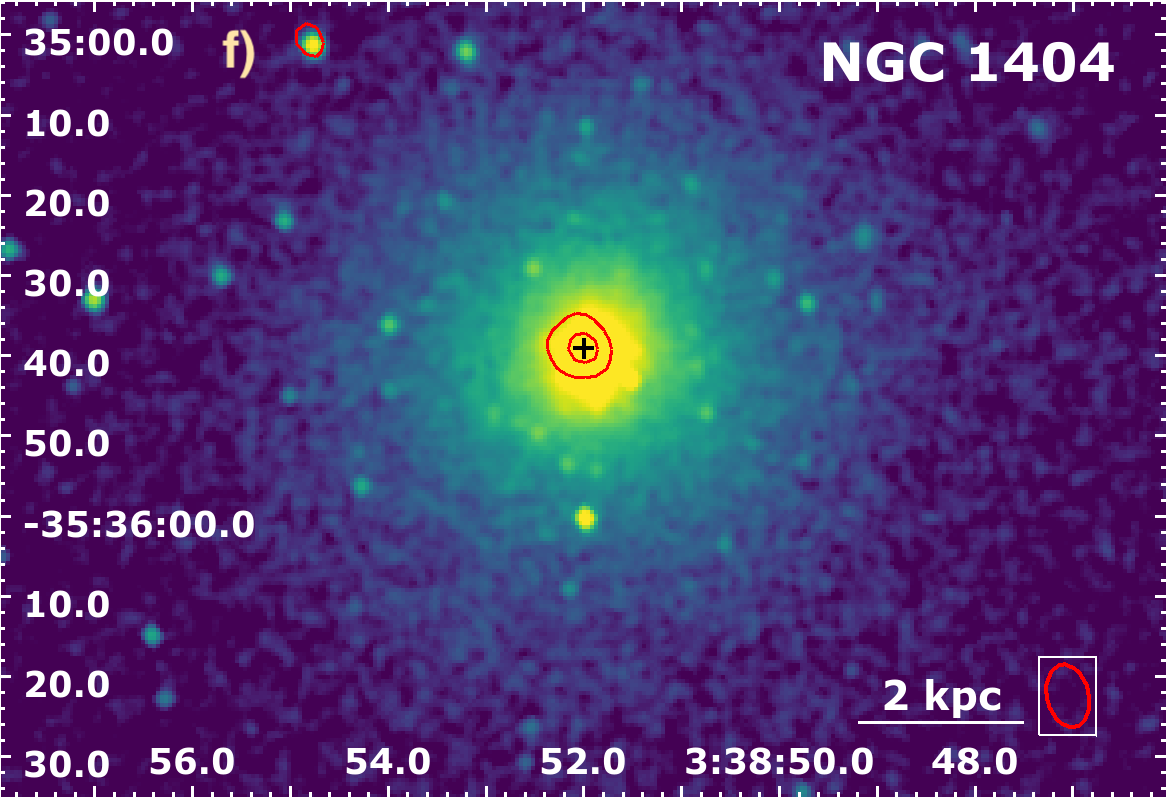
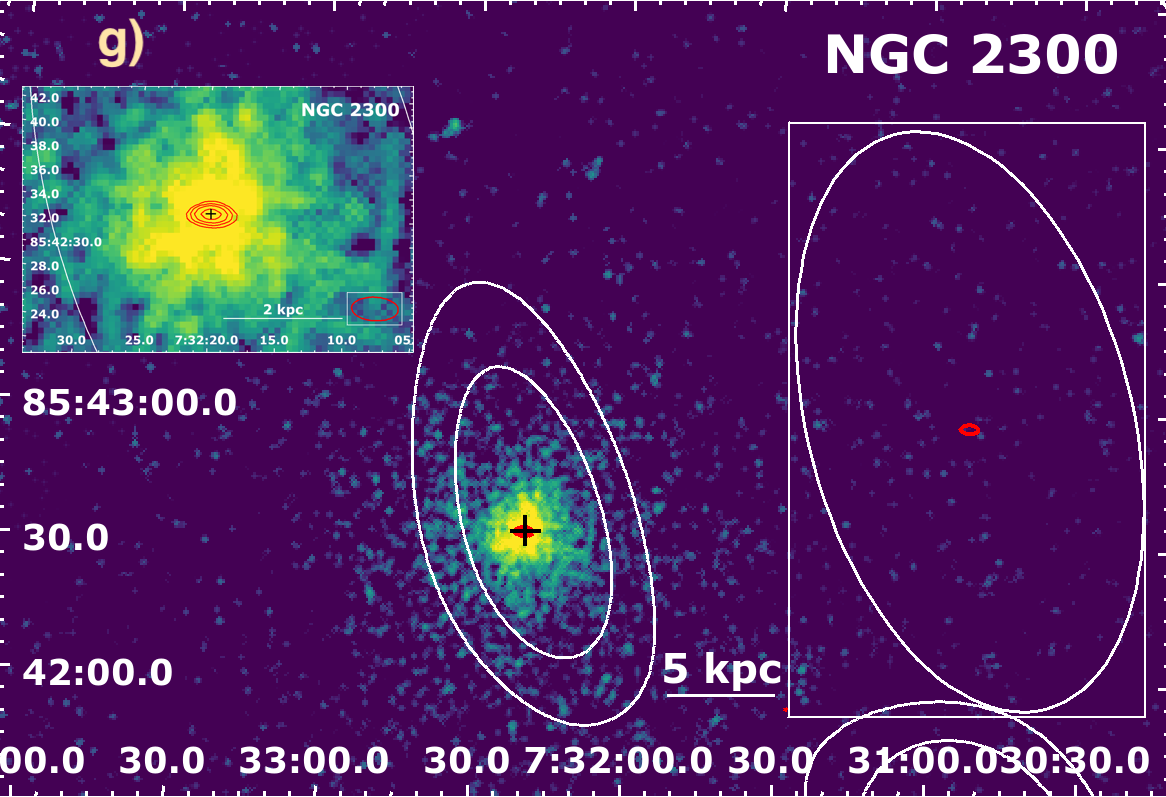
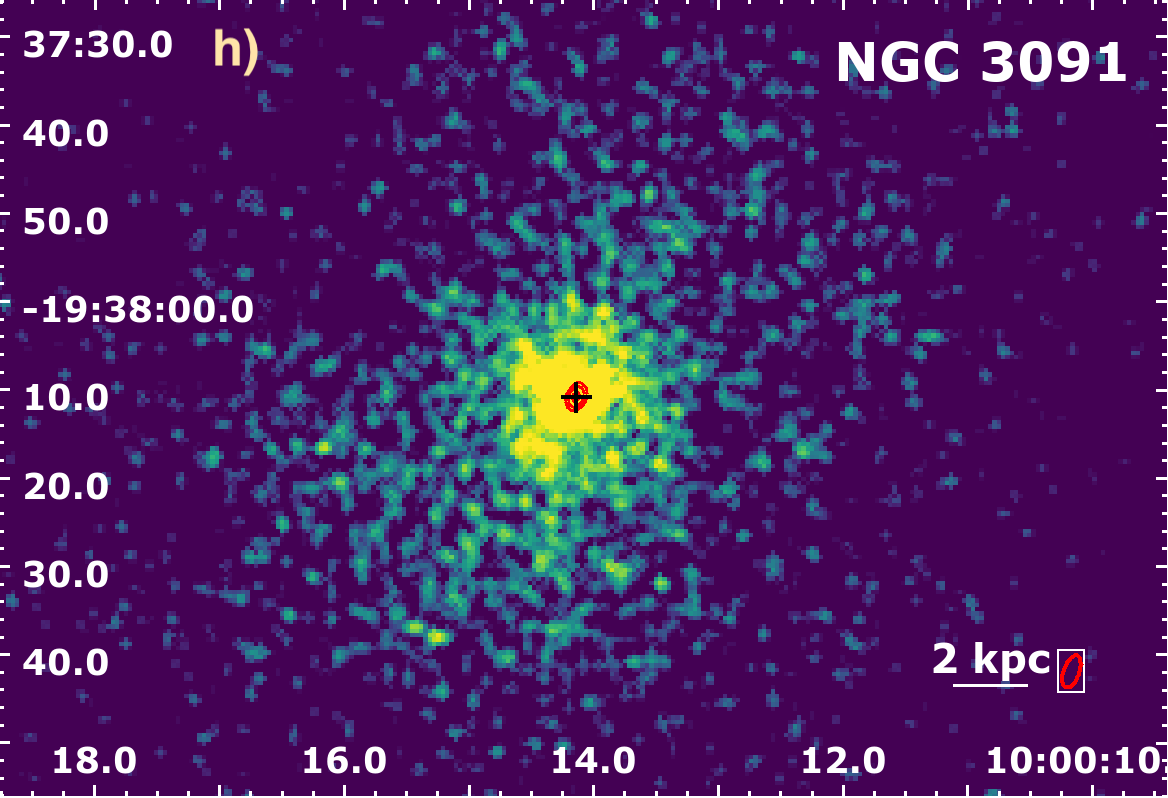
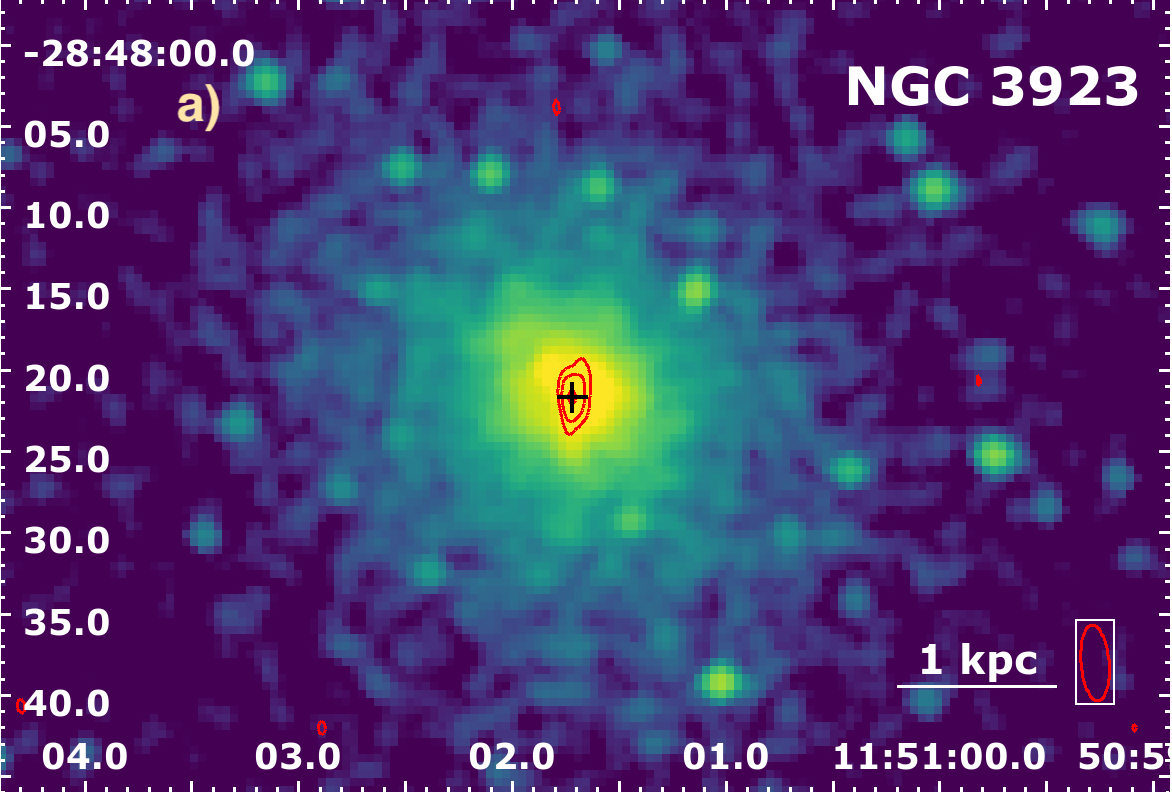
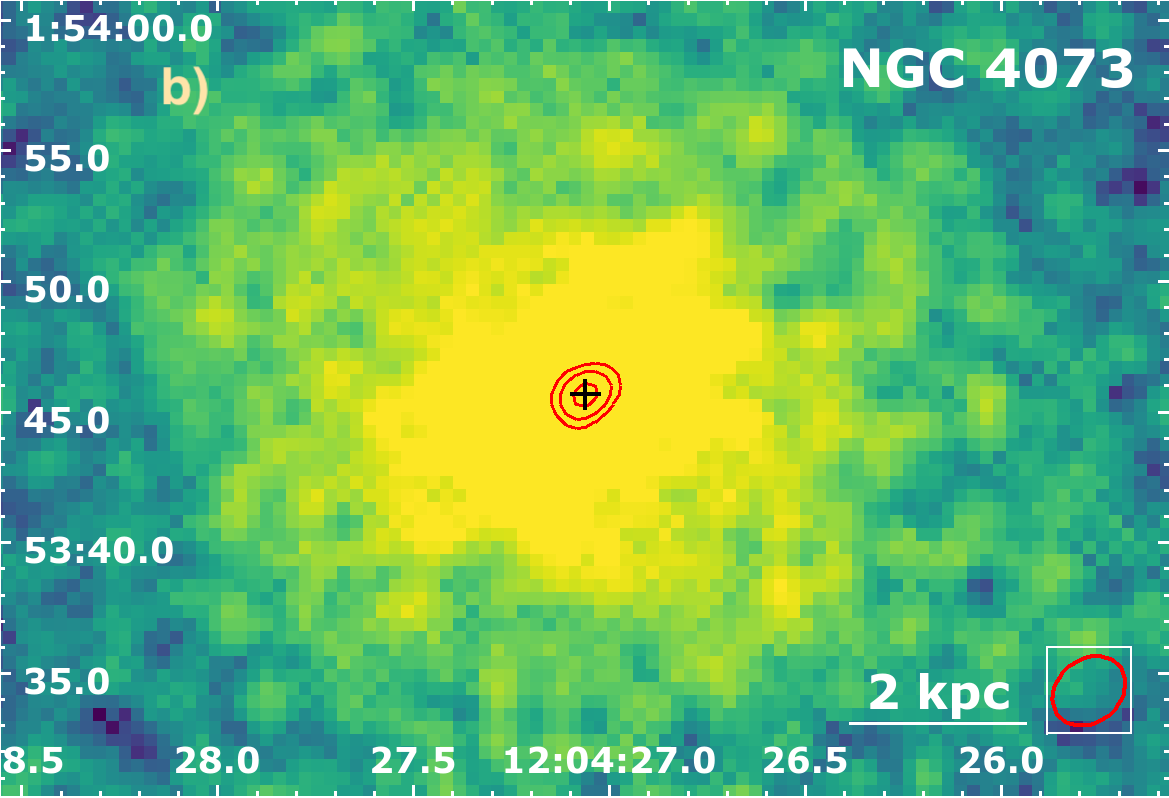
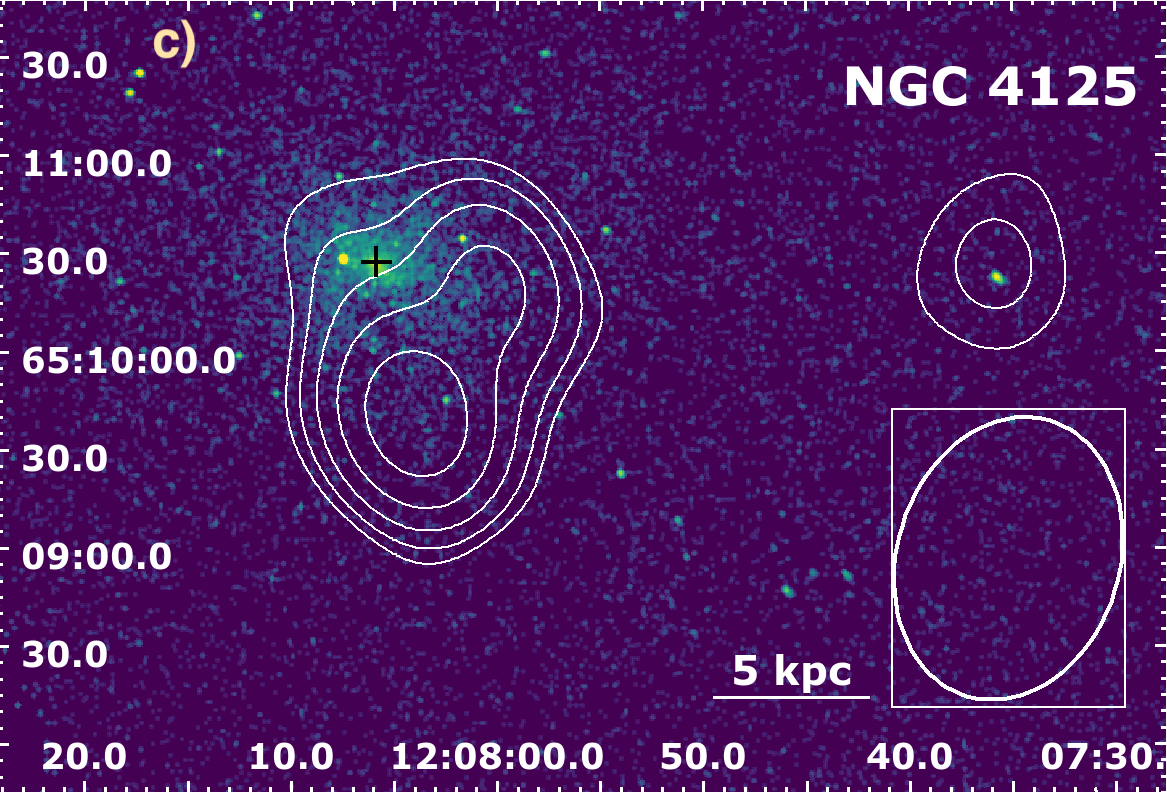
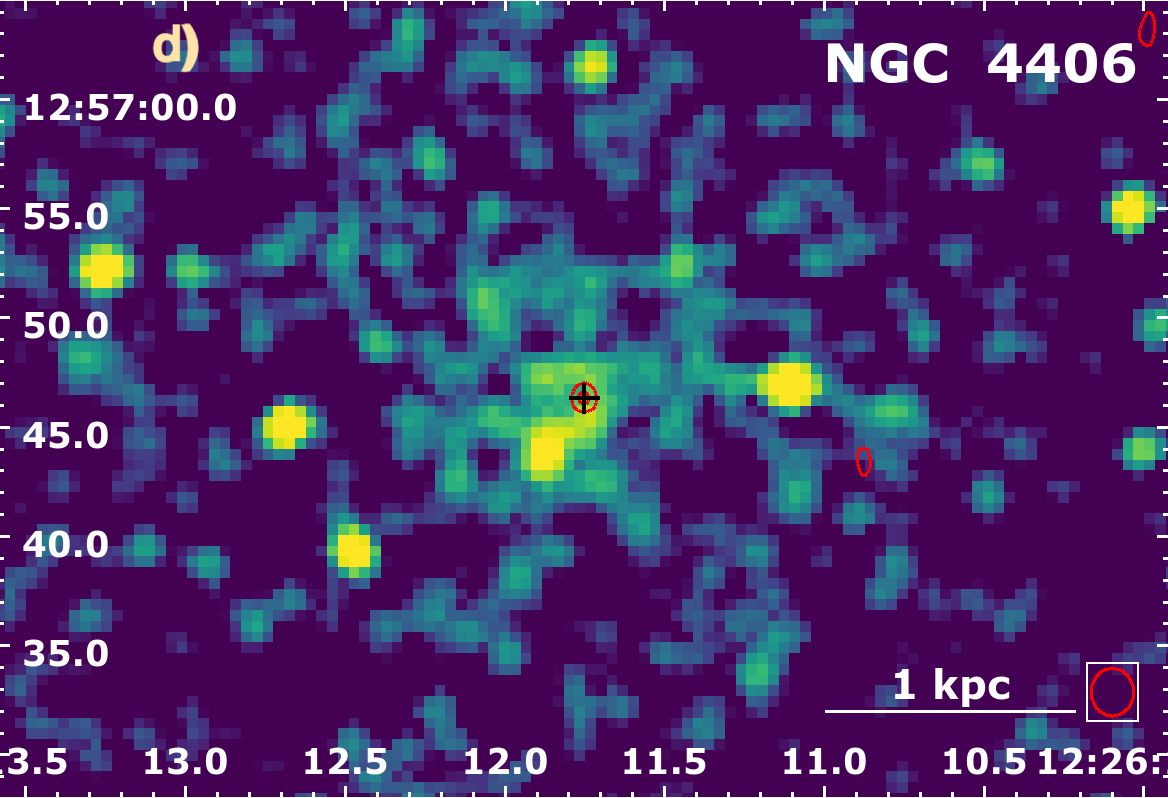
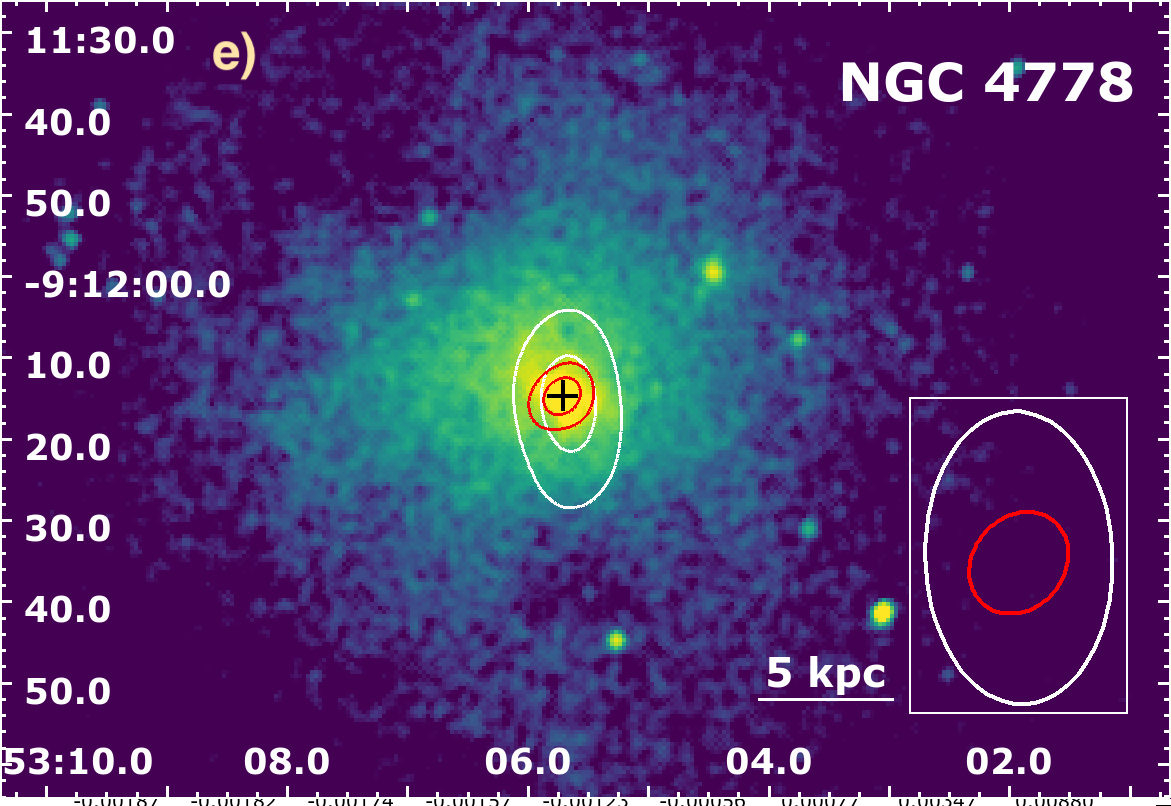
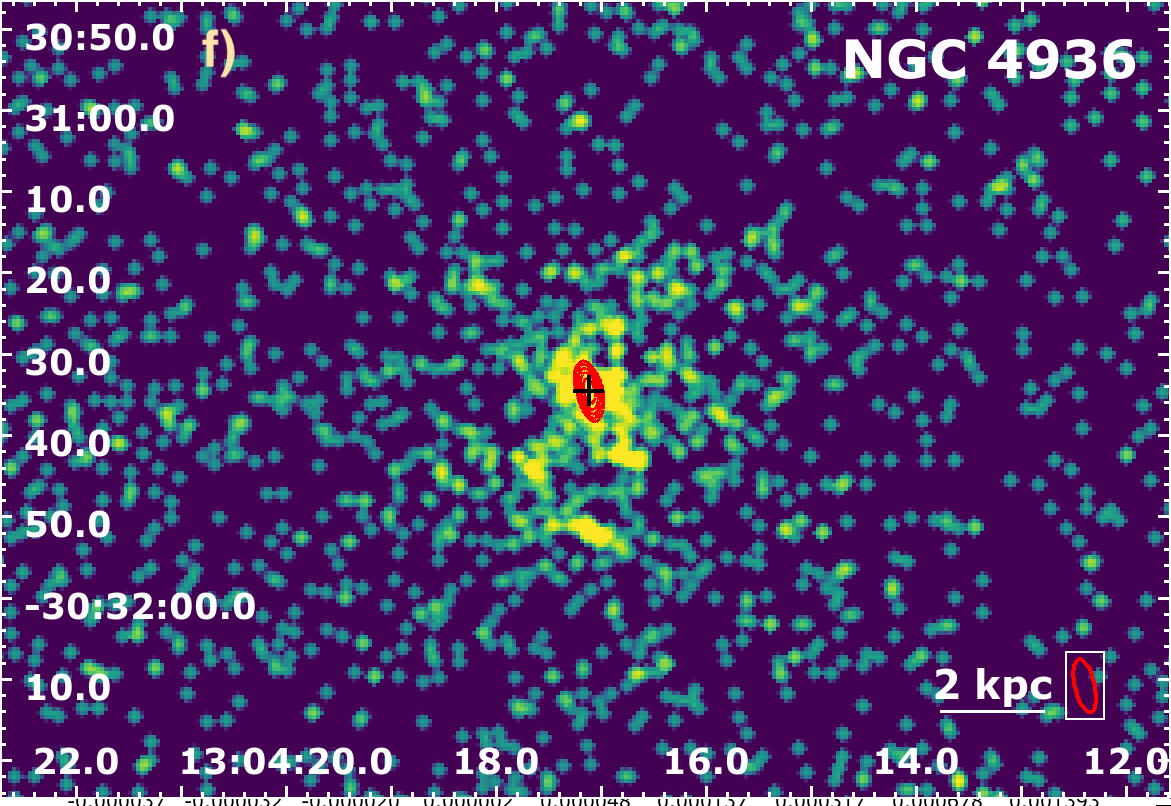
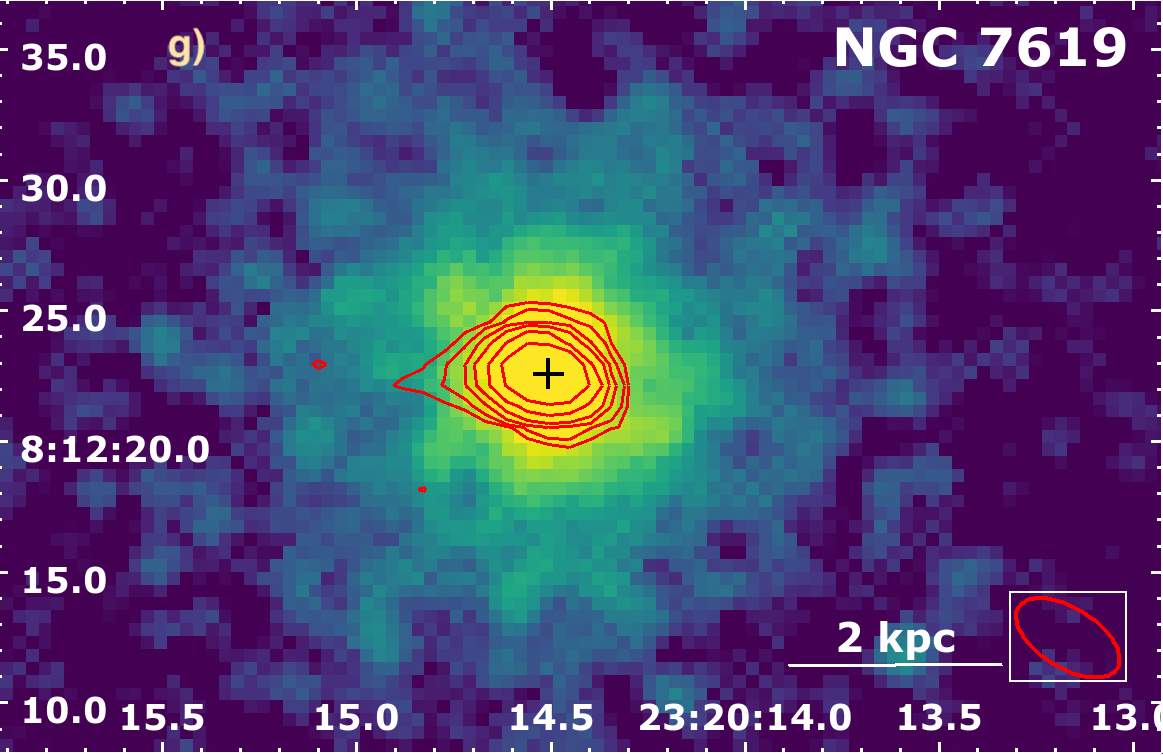
B.2 X-rays and extended radio sources
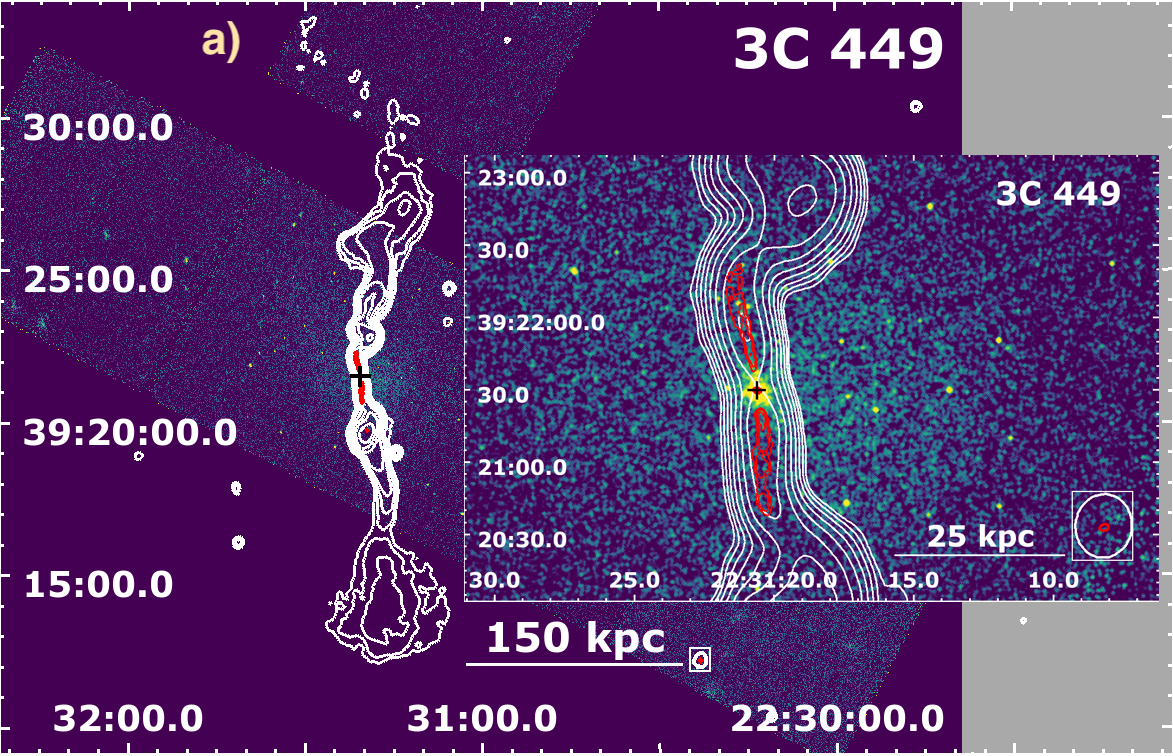
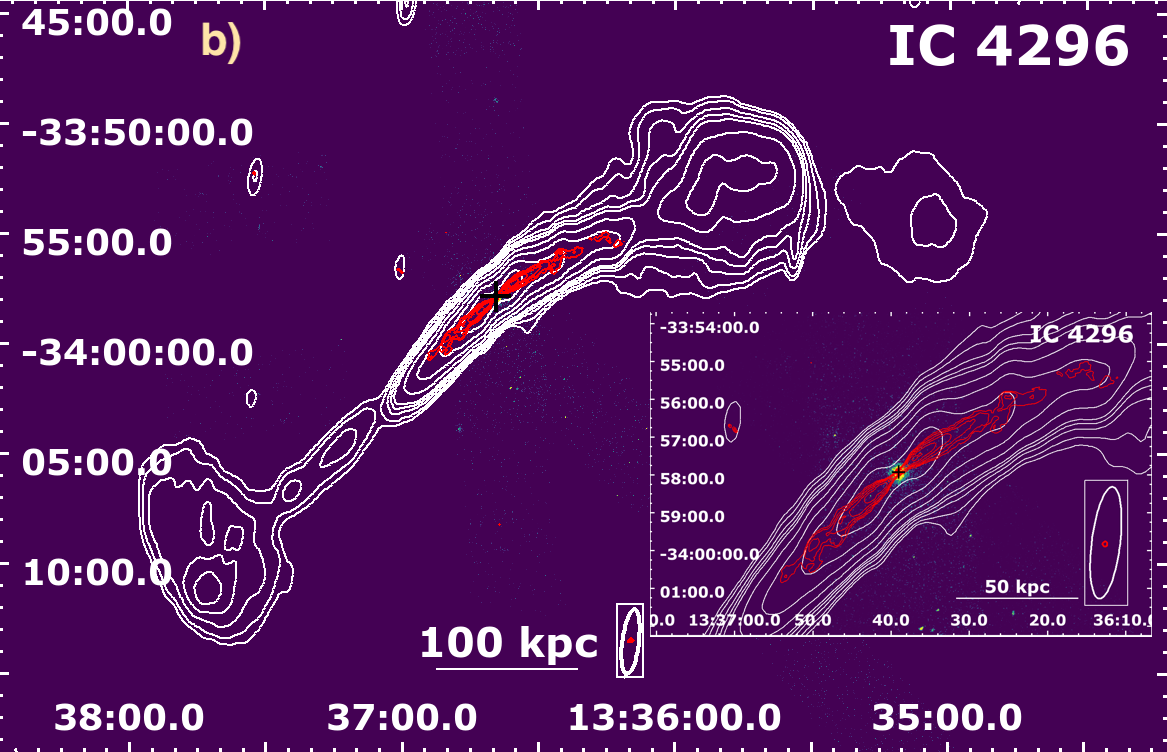
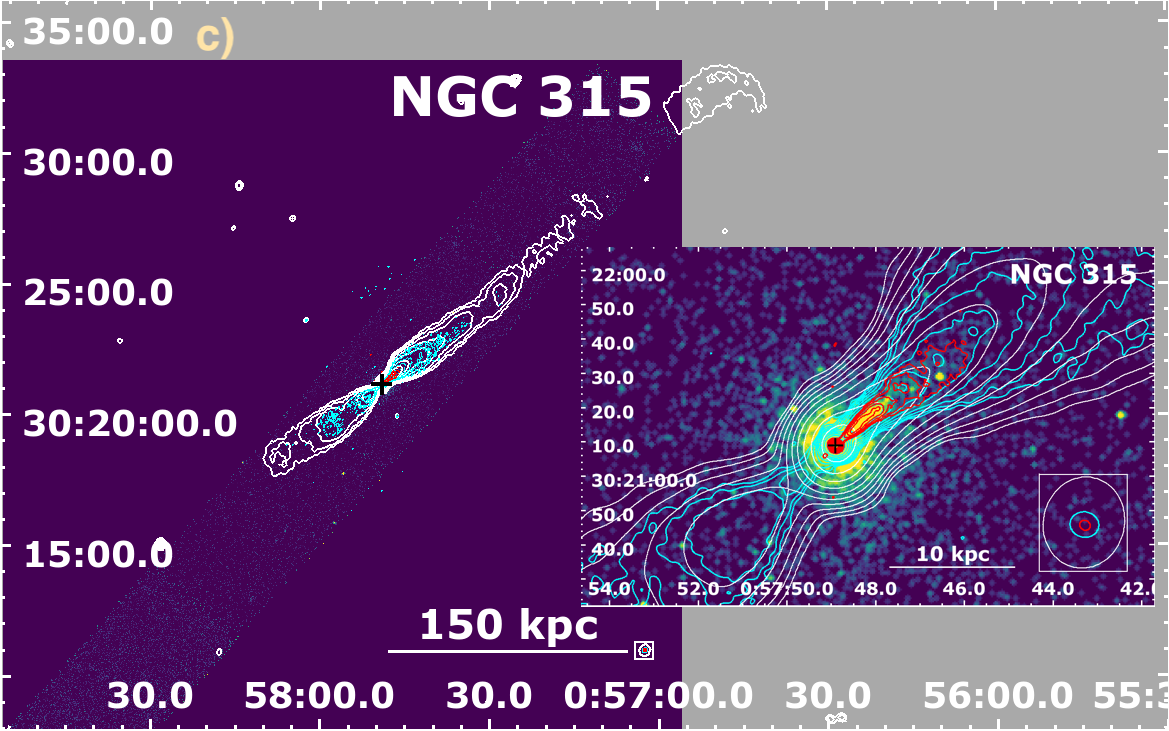
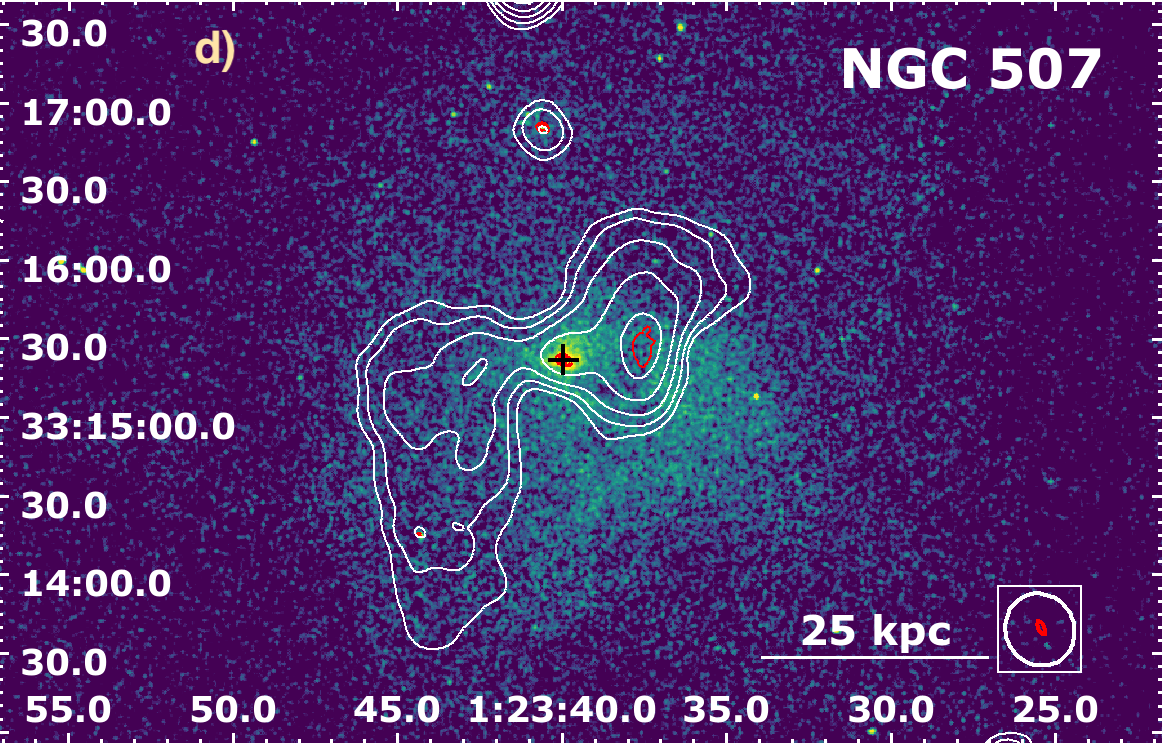
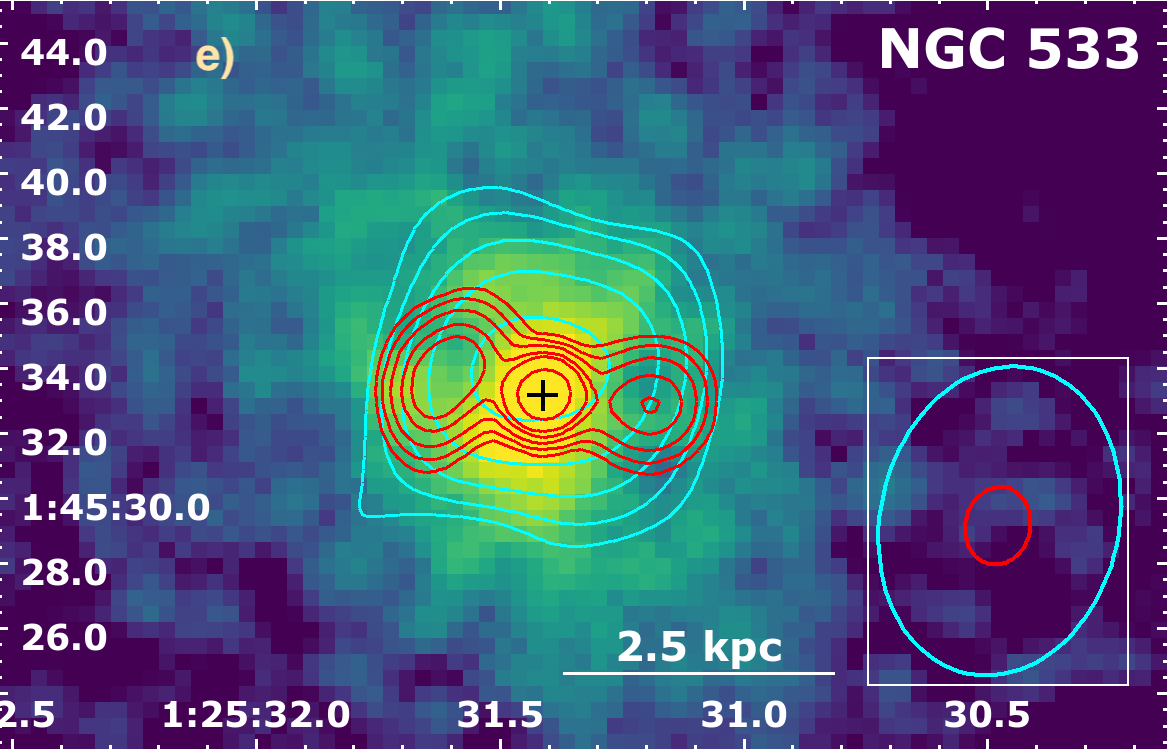
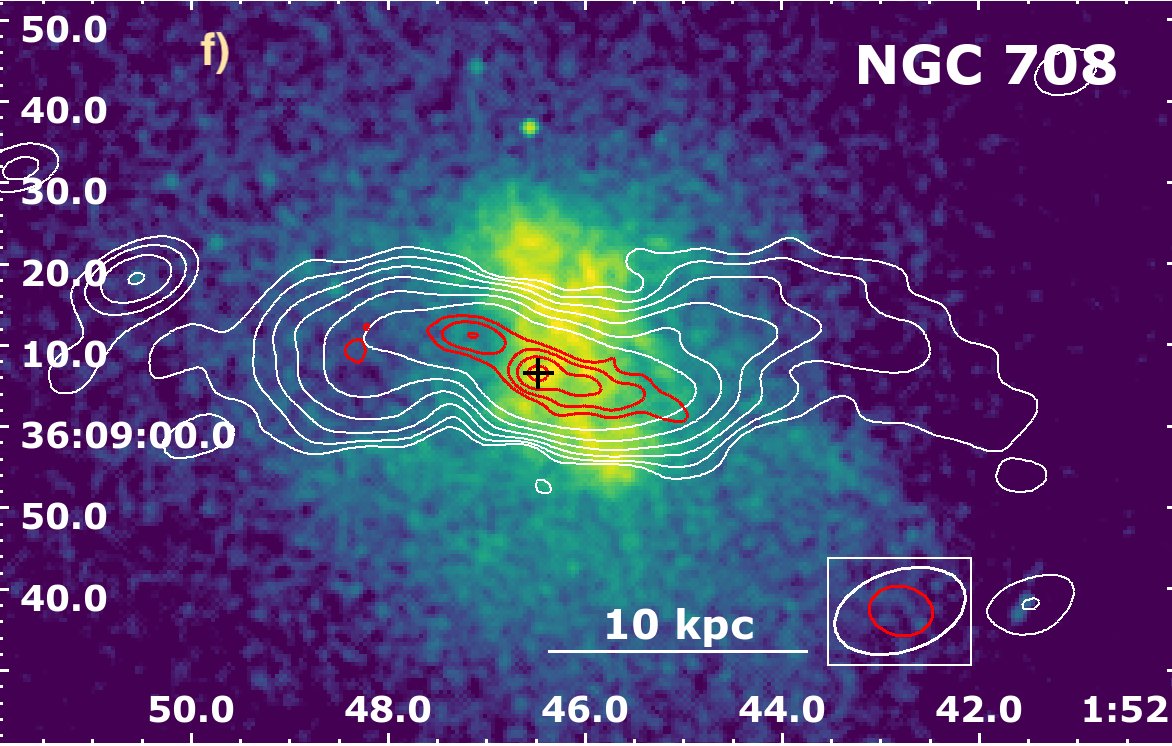
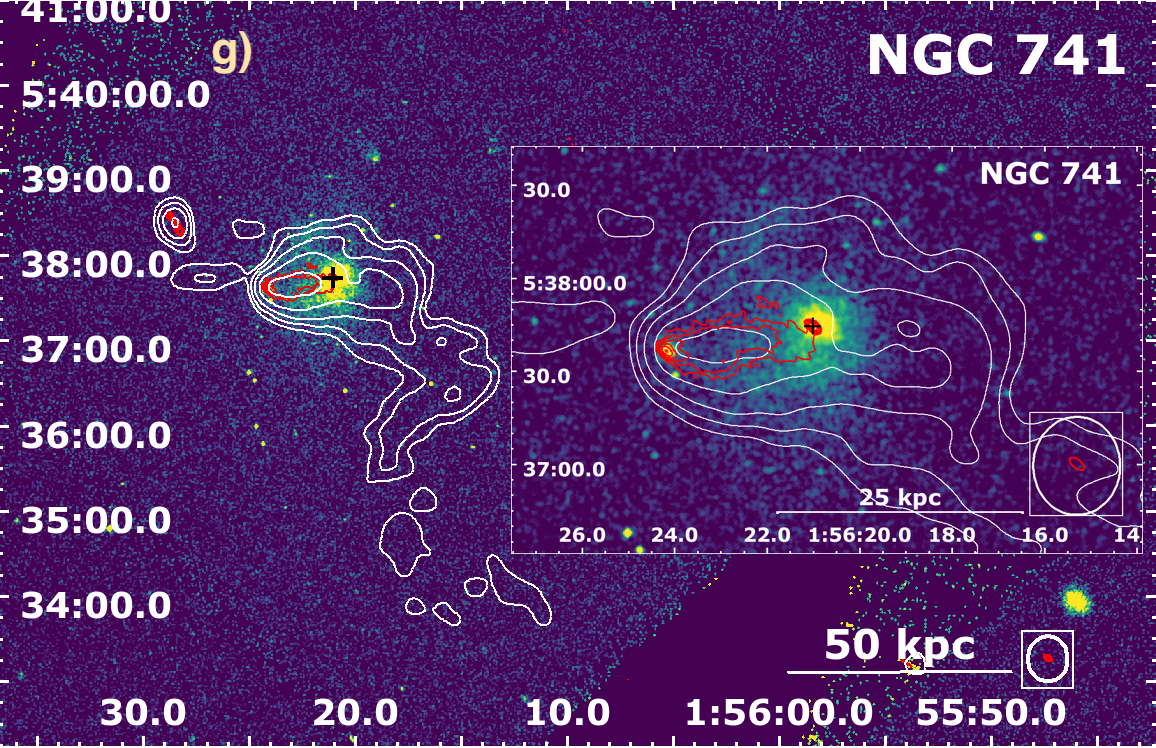
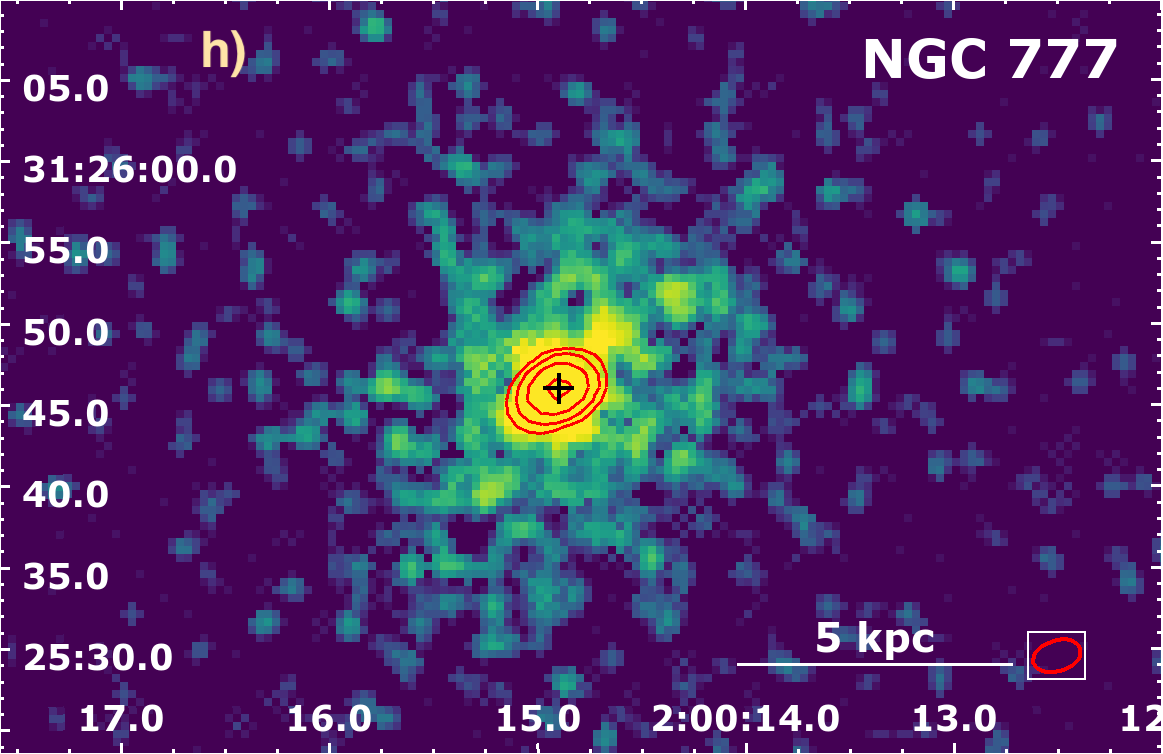

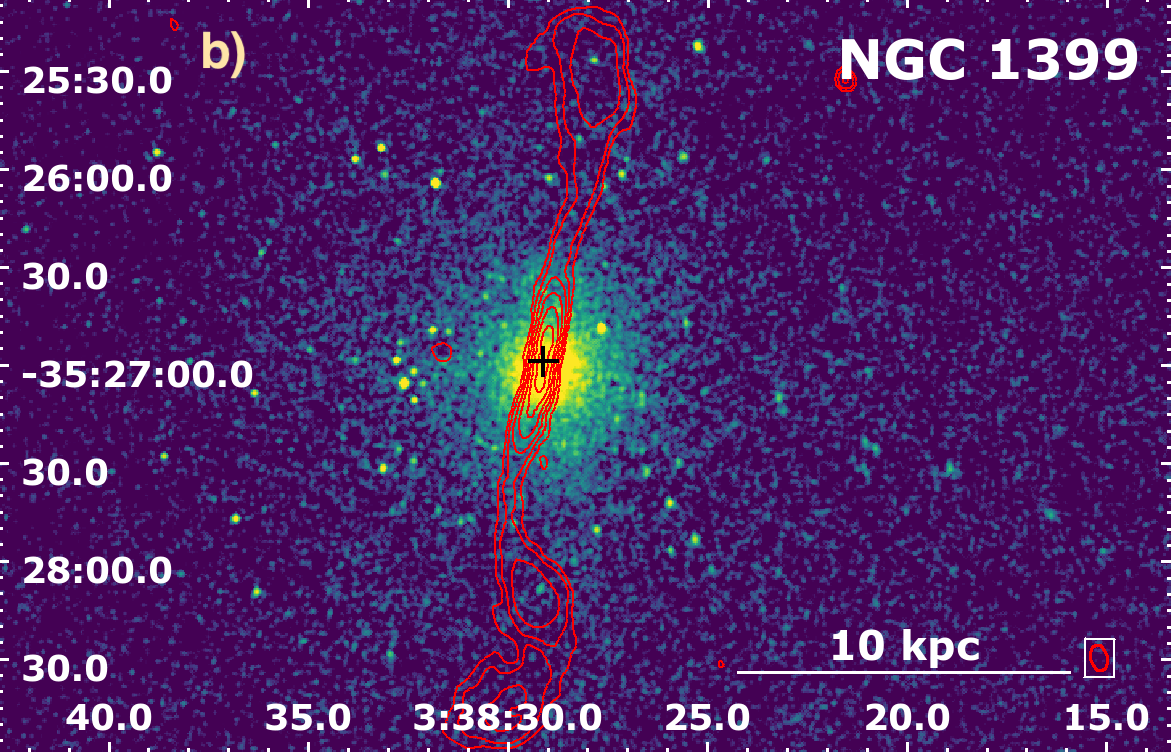
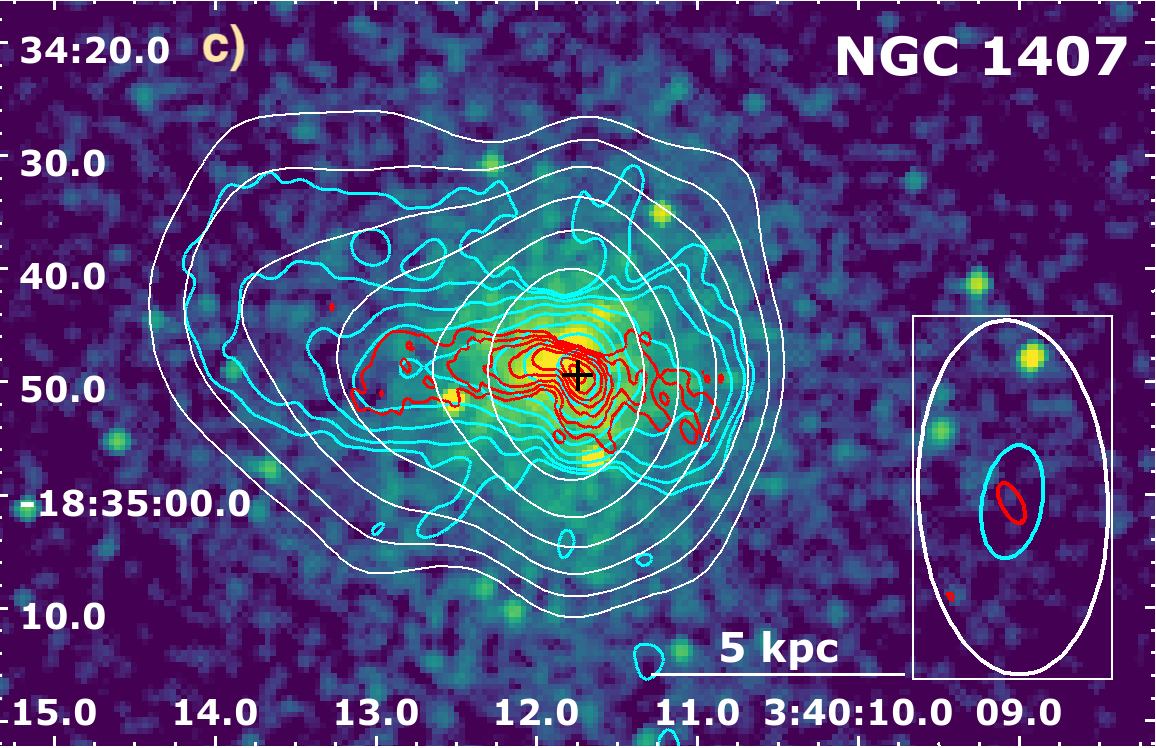
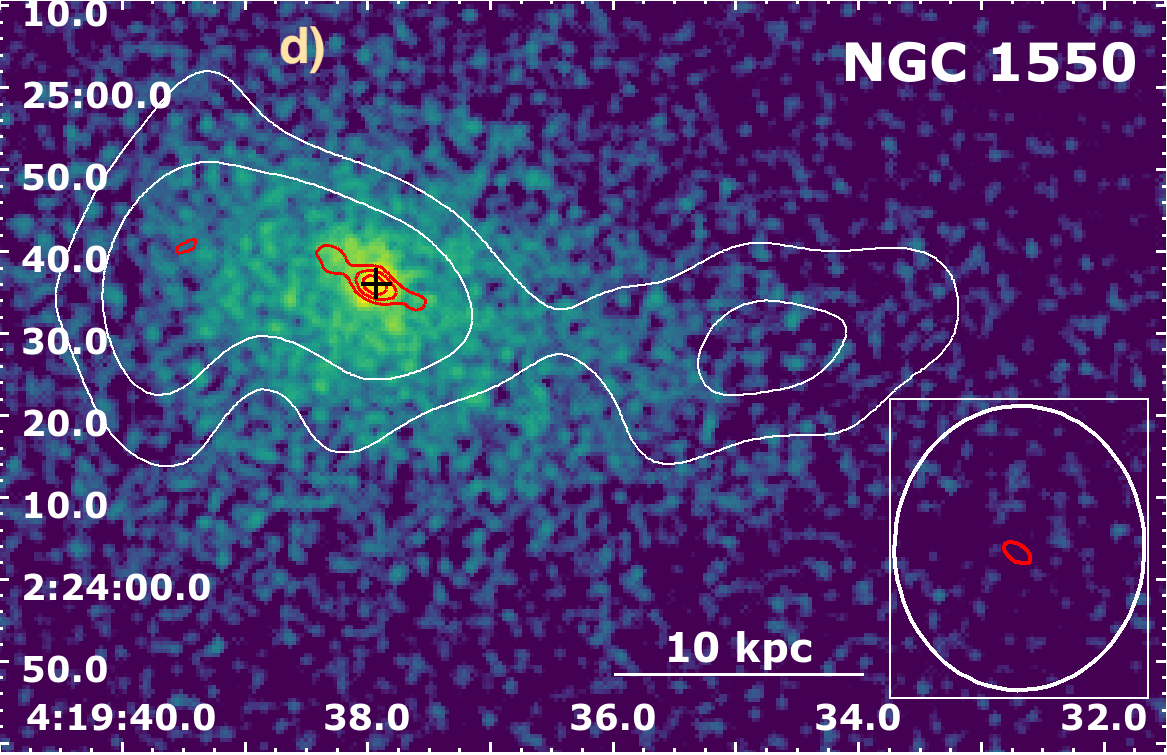
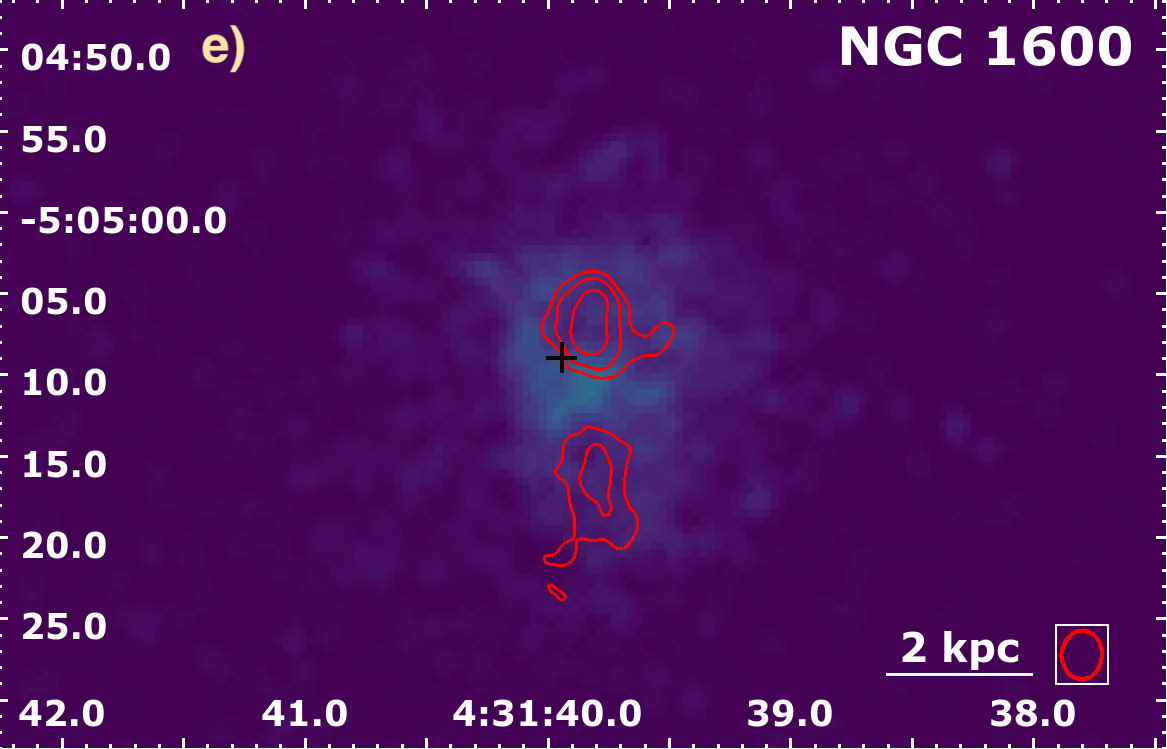
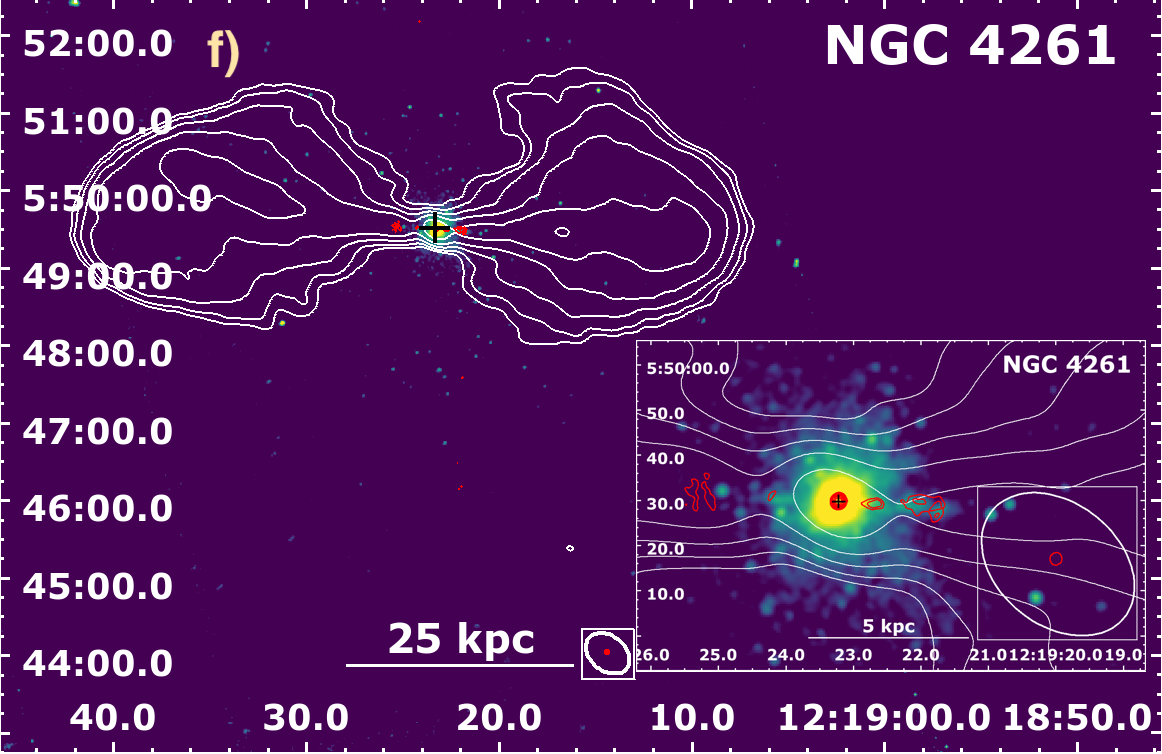
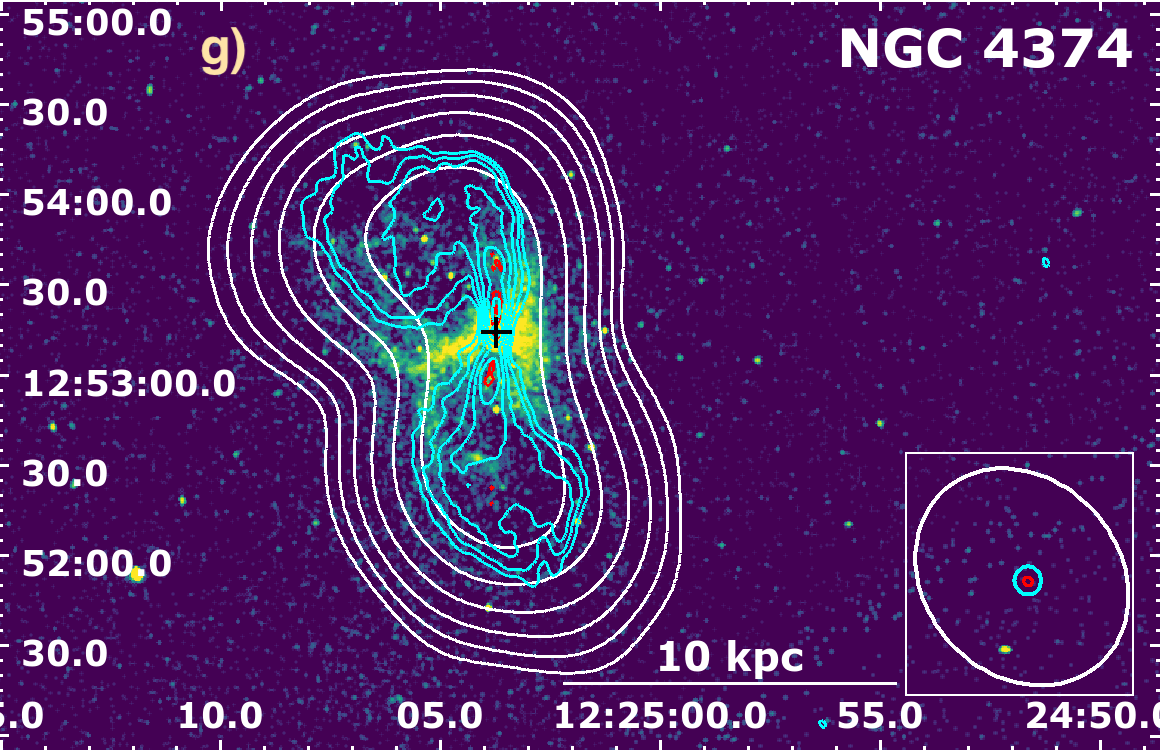
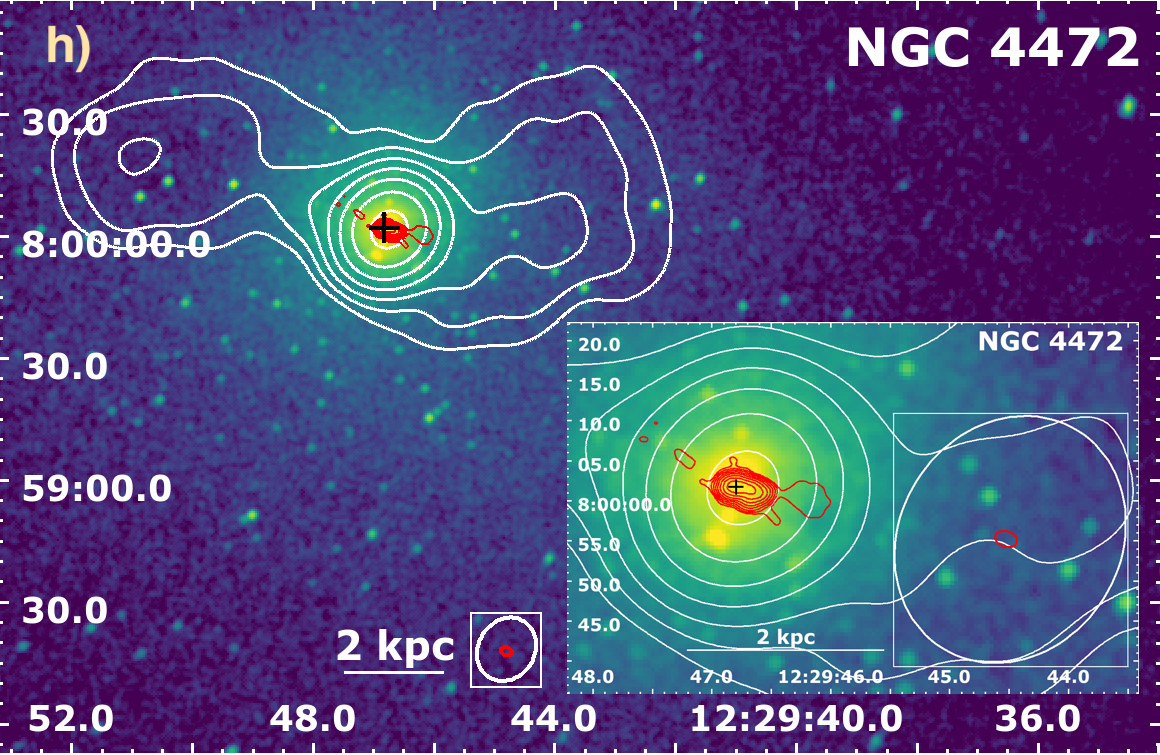
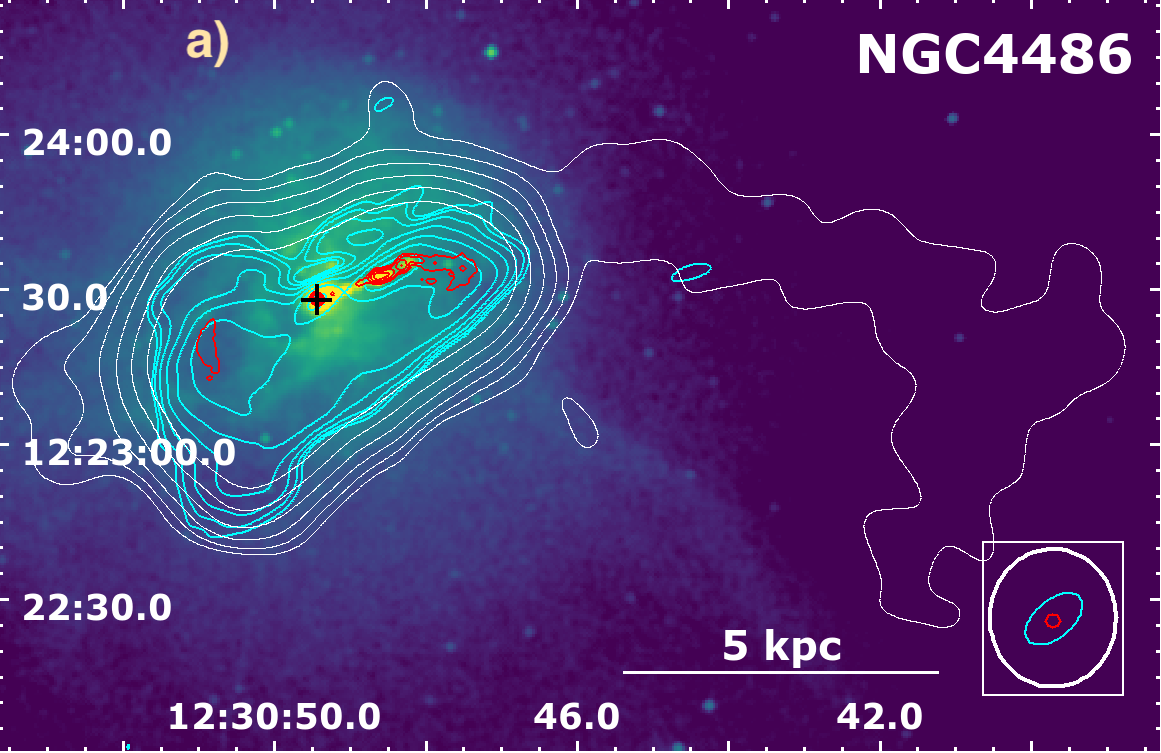
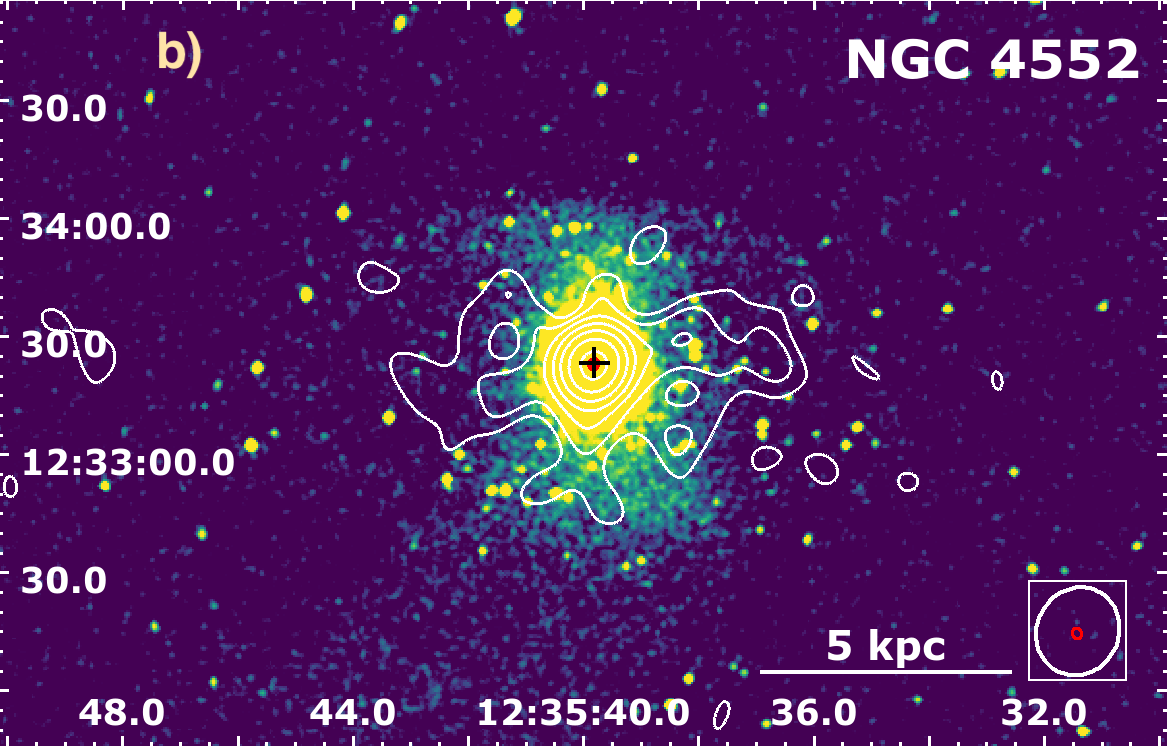
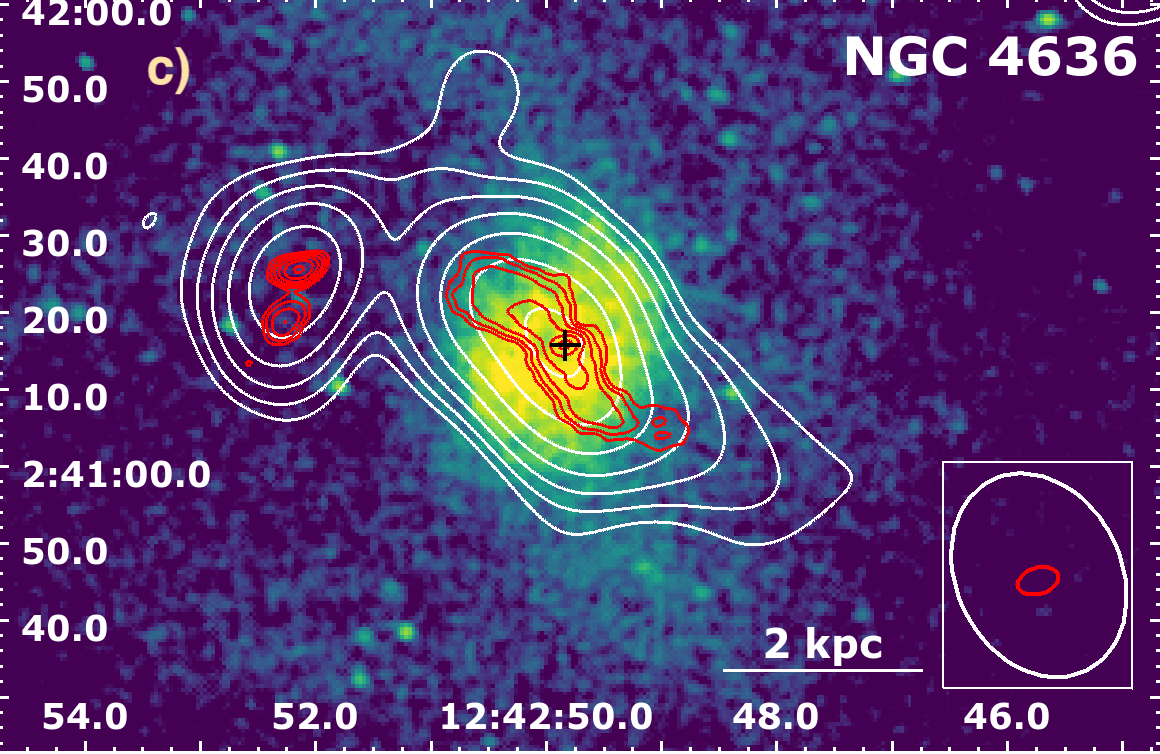
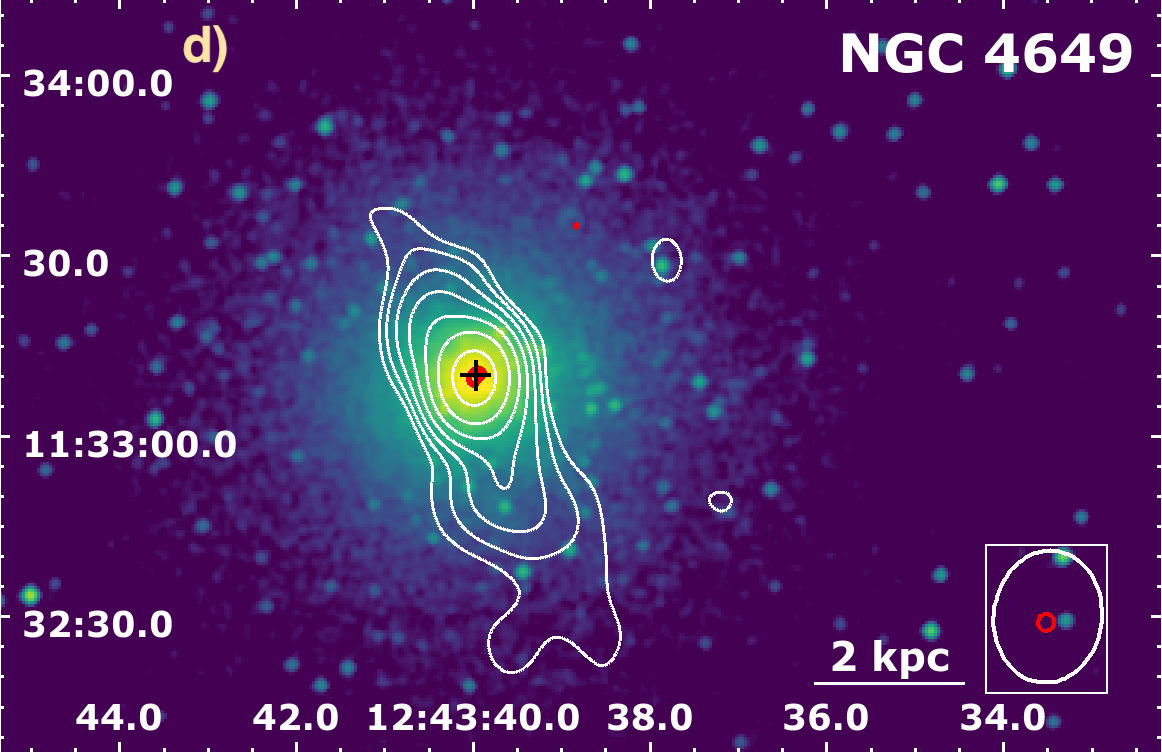
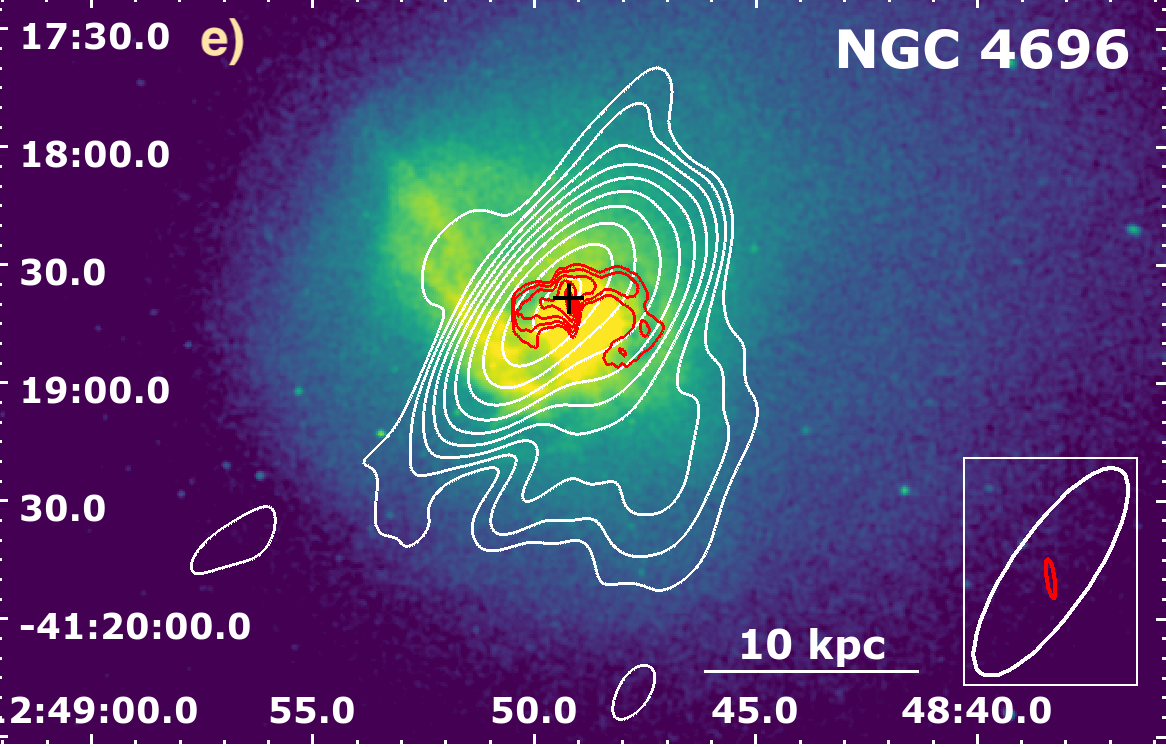
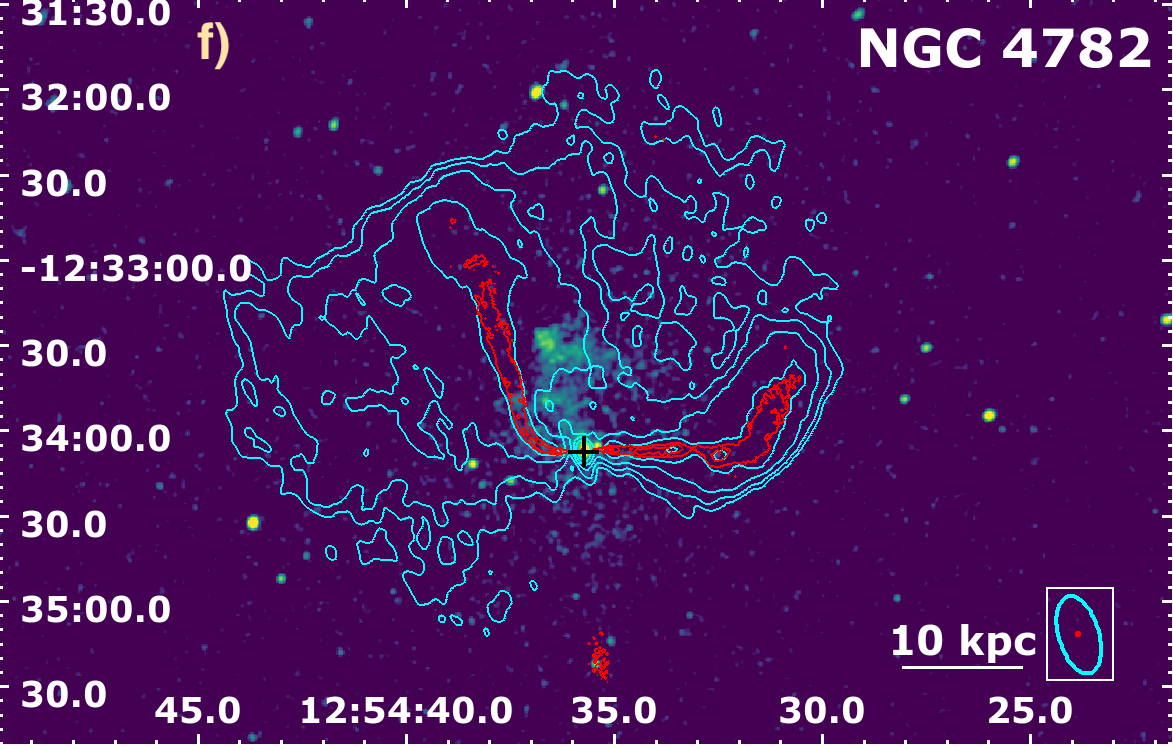
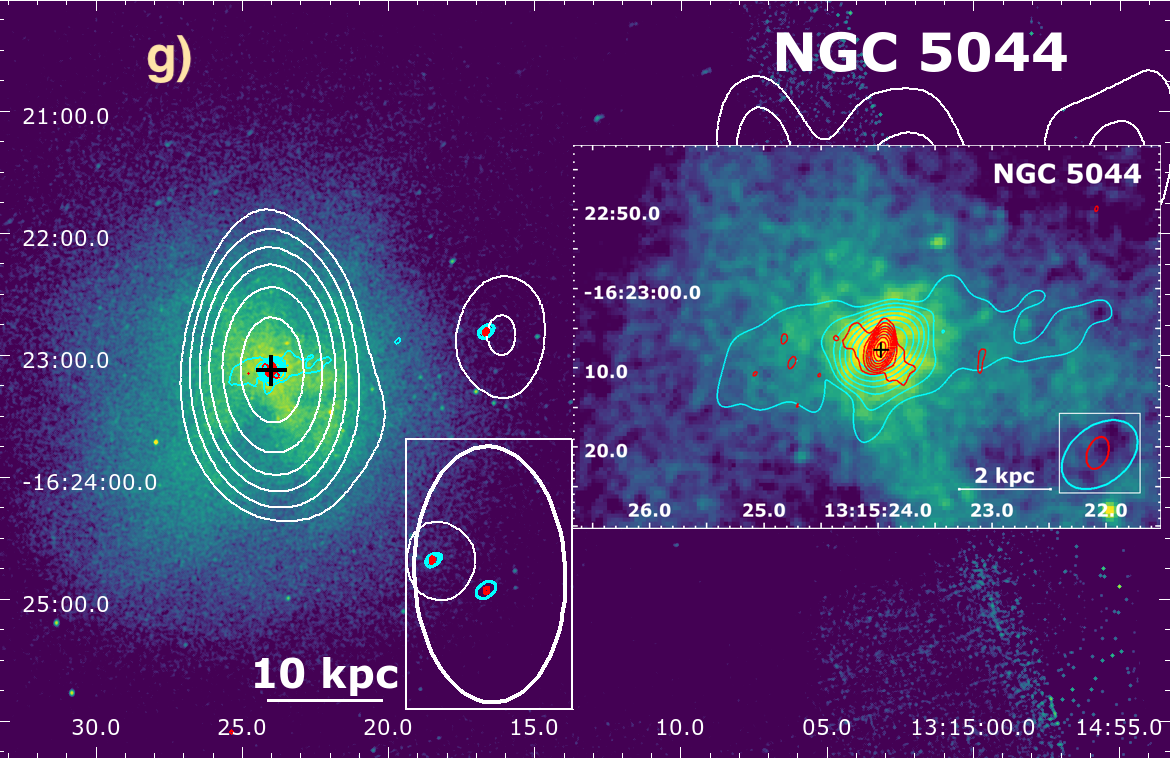
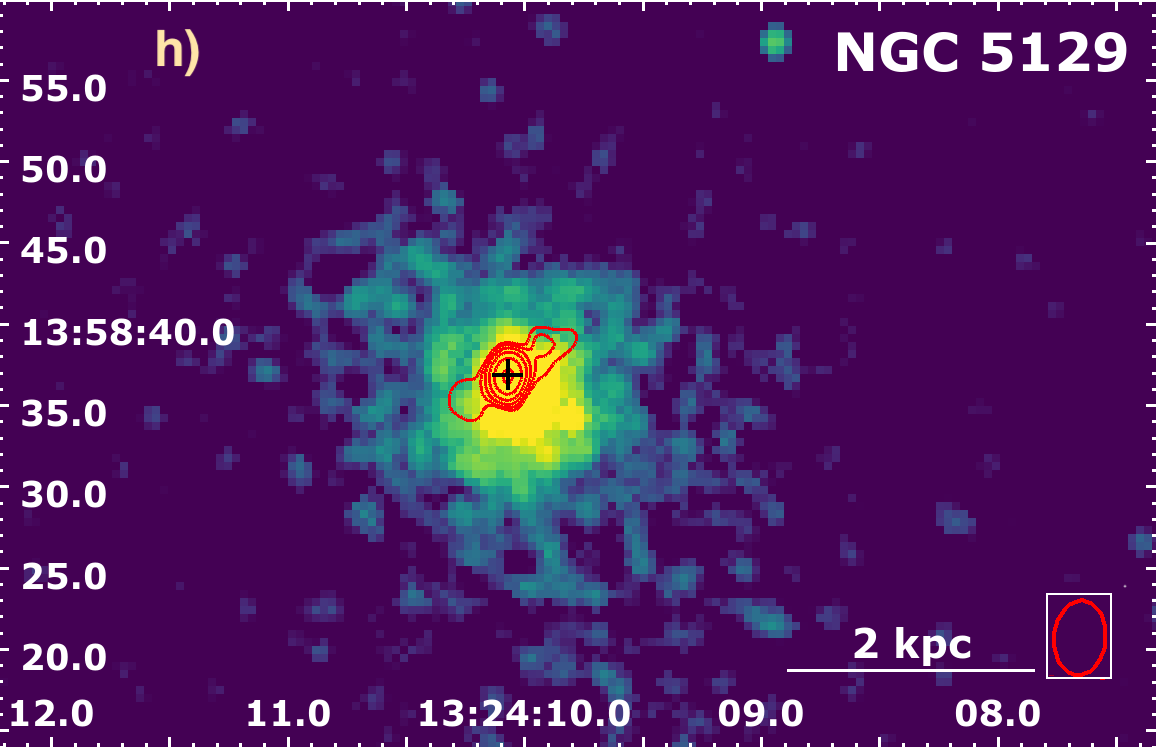
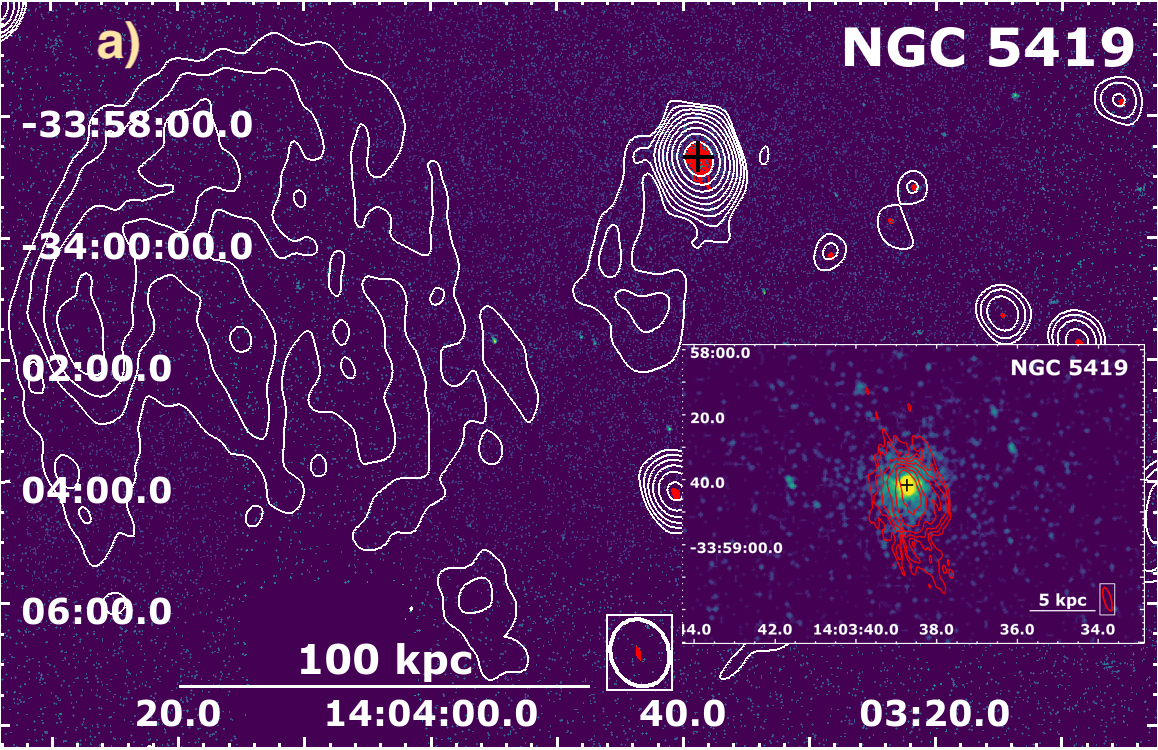
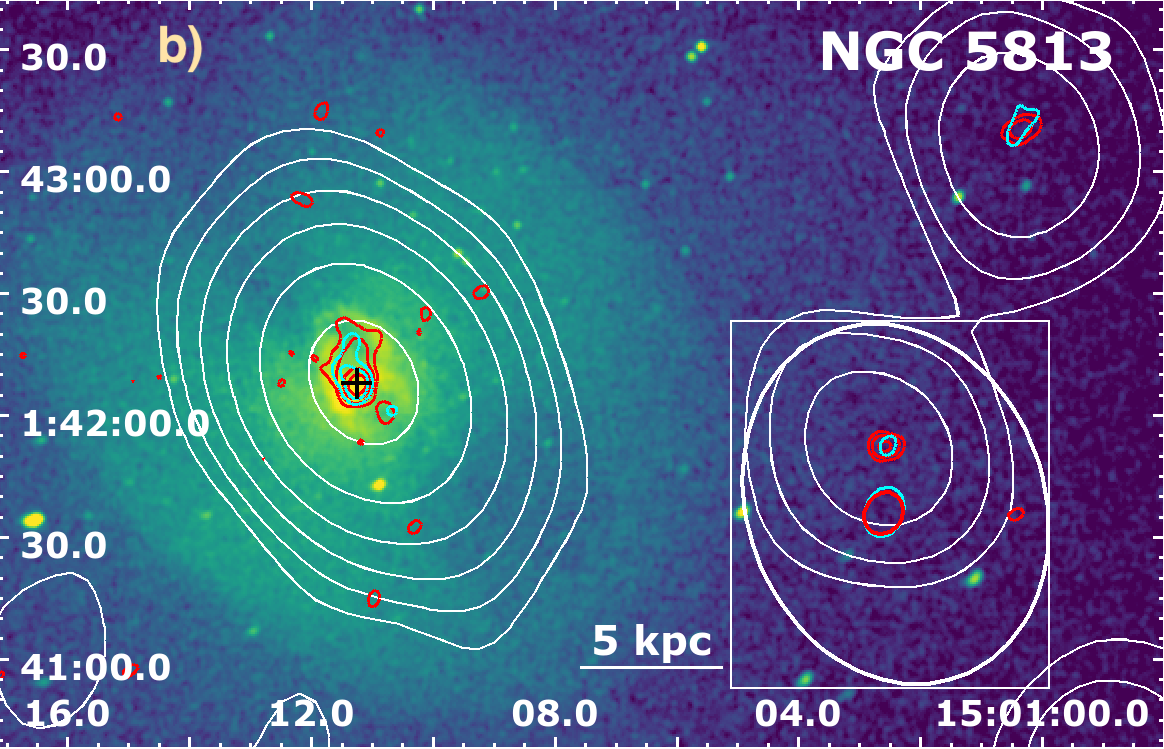
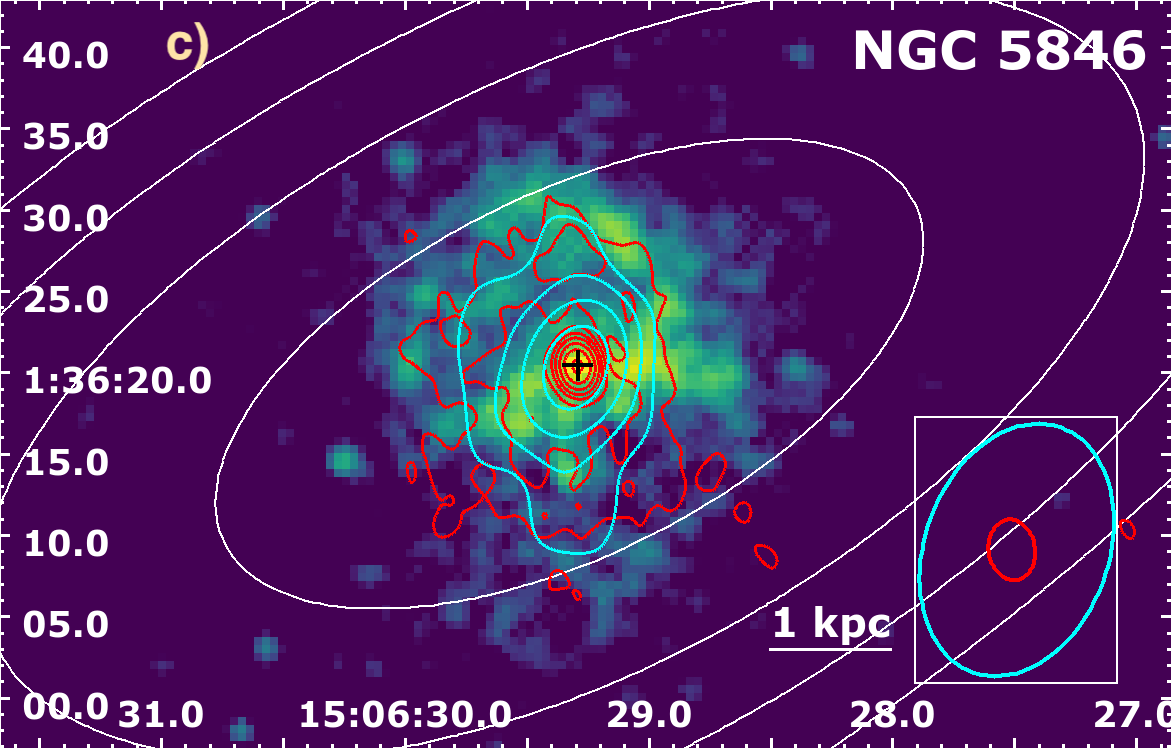
Appendix C Appendix: Table
C.1 Radio observations details
| Source | Config | Project | Date | Flux |
|---|---|---|---|---|
| Name | VLA | Code | (year-month-day) | Calibrator |
| 3C 449 | A | AB920 | 1999-Jul-18 | 3C 84 |
| 3C 449 | C | AM0740 | 2002-Dec-21 | 3C 84 |
| IC 1860 | A | AG0748 | 2009-Jun-19 | 3C 84 |
| IC 4296* | A | 15A-305 | 2015-Jul-11 | 3C 286 |
| IC 4296 | D | 18A-317 | 2018-Oct-26 | 3C 286 |
| NGC 57* | A | 15A-305 | 2015-Jul-03 | 3C 48 |
| NGC 315 | A | AM670/AB920 | 1999-Jul-18/2000-Dec-04 | 3C 286 |
| NGC 315 | B | AL538 | 2001-Mar-10 | 3C 286 |
| NGC 315 | C | AL538 | 2001-Jul-17 | 3C 48 |
| NGC 410* | A | 15A-305 | 2015-Jun-28 | 3C 48 |
| NGC 499 | A | AG748 | 2007-Jun-09/14 | 3C 84 |
| NGC 507* | A | 15A-305 | 2015-Jun-19 | 3C 48 |
| NGC 507 | C | AC0785 | 2005-Aug-17 | 3C 84 |
| NGC 533* | A | 15A-305 | 2015-Jun-27 | 3C 48 |
| NGC 533 | B | AC0849 | 2006-Sep-02/04/10 | 3C 84 |
| NGC 708 | AB | AC470 | 1987-Nov-06 | 3C 84 |
| NGC 708 | C | 13A-131 | 2013-Aug-18 | 3C 286 |
| NGC 741 | A | AB920 | 1999-Jul-18 | 3C 84 |
| NGC 741 | C | 13A-387 | 2013-Jul-26 | 3C 48 |
| NGC 777* | A | 15A-305 | 2015-Jun-21 | 3C 48 |
| NGC 777 | C | AC0488 | 1997-Sep-18 | 3C 286 |
| NGC 1132 | C | AC0488 | 1997-Sep-18 | 3C 286 |
| NGC 1316 | BA | AH787 | 2002-May-31/Jun-01 | 3C 84 |
| NGC 1316 | CD | AW0110 | 1985-Nov-03 | 3C 48 |
| NGC 1399* | A | 15A-305 | 2015-Jun-20 | 3C 138 |
| NGC 1404* | A | 15A-305 | 2015-Jun-20 | 3C 138 |
| NGC 1404 | CD | AT0285/6 | 2003-Jan-31/Feb-01 | 3C 84 |
| NGC 1407* | A | 15A-305 | 2015-Jun-28 | 3C 138 |
| NGC 1407 | B | 12A-139 | 2012-Jun-10 | 3C 147 |
| NGC 1407 | C | 12A-139 | 2012-Apr-22 | 3C 147 |
| NGC 1550* | A | 15A-305 | 2015-Jun-24 | 3C 138 |
| NGC 1550 | C | AC0488 | 1997-Sep-18 | 3C 286 |
| NGC 1600 | A | AB0289 | 1984-Dec-15 | 3C 48 |
| NGC 2300* | A | 15A-305 | 2015-Jun-18 | 3C 147 |
| NGC 2300 | D | AS0552 | 1995-Mar-27 | 3C 48 |
| NGC 3091* | A | 15A-305 | 2015-Jun-19 | 3C 286 |
| NGC 3091 | AB | AM0344 | 1991-Dec-15 | 3C 286 |
| NGC 3923* | A | 15A-305 | 2015-Jul-01 | 3C 286 |
| NGC 3923 | C | AW0110 | 1984-Jun-10 | 3C 286 |
| NGC 4073* | A | 15A-305 | 2015-Jun-24 | 3C 286 |
| NGC 4125 | D | 14B-396 | 2015-Oct-17 | 3C 286 |
| NGC 4261 | A | AL0693 | 2007-Jun-08/09 | 3C 286 |
| NGC 4261 | C | AL0693 | 2008-May-24/25 | 3C 286 |
| NGC 4374* | A | BH210 | 2015-Jul-17 | 3C 286 |
| NGC 4374 | B | BW0003 | 1994-Aug-04 | 3C 286 |
| NGC 4374 | C | 14A-468 | 2014-Dec-24 | 3C 286 |
| NGC 4406* | A | 15A-305 | 2015-Jul-02 | 3C 286 |
| NGC 4406 | D | AS623 | 1997-Nov-29 | 3C 286 |
| NGC 4472* | A | 15A-305 | 2015-Jun-27 | 3C 286 |
| NGC 4472 | C | AB0412 | 1986-Nov-26 | 3C 286 |
| NGC 4486 | A | AB0920 | 1999-Jul-18 | 3C 286 |
| NGC 4486 | B | 16A-245 | 2016-Sep-17 | 3C 286 |
| NGC 4486 | C | AO0149 | 2000-May-15 | 3C 286 |
| NGC 4552 | A | AC301 | 1991-Aug-24 | 3C 286 |
| NGC 4552 | C | 16A-275 | 2016-Apr-04 | 3C 286 |
| NGC 4636 | A | AF389 | 2002-Mar-12 | 3C 286 |
| NGC 4636 | C | 17A-073 | 2017-May-25 | 3C 286 |
| NGC 4649 | A | AC301 | 1991-Aug-24 | 3C 48 |
| NGC 4649 | D | 17A-073 | 2017-Jun-01 | 3C 286 |
| NGC 4696 | A | AT211 | 1998-Apr-23 | 3C 286 |
| NGC 4696 | BC | AB623 | 1992-Feb-06 | 3C 286 |
| NGC 4778 | AB | AL0227 | 1990-Jul-09 | 3C 286 |
| NGC 4778 | C | AB1150 | 2005-Jul-30/31 | 3C 286 |
| NGC 4782 | A | AC0104 | 1984-Dec-26 | 3C 286 |
| NGC 4782 | BA | AL0227 | 1990-Jul-09 | 3C 286 |
| NGC 4936* | A | 15A-305 | 2015-Jun-20 | 3C 295 |
| NGC 5044 | A | AD294 | 1992-Nov-27 | 3C 286 |
| NGC 5044 | BA | 15A-243 | 2015-May-25 | 3C 286 |
| NGC 5044 | D | 11B-093 | 2011-Dec-03 | 3C 286 |
| NGC 5129* | A | 15A-305 | 2015-Jun-30 | 3C 286 |
| NGC 5419* | A | 15A-305 | 2015-Jun-18 | 3C 295 |
| NGC 5419 | B | AE31 | 1984-Feb-26 | 3C 286 |
| NGC 5419 | CD | AE31 | 1984-Jul-07/8 | 3C 286 |
| NGC 5813 | A | AF188 | 1990-Apr-19 | 3C 48 |
| NGC 5813 | B | AW202 | 1988-Jan-30 | 3C 286 |
| NGC 5813 | C | AC0488 | 1997-Sep-17 | 3C 286 |
| NGC 5846 | A | AF389 | 2002-Mar-12 | 3C 286 |
| NGC 5846 | B | AW0202 | 1988-Jan-30 | 3C 286 |
| NGC 5846 | CD | AM0197 | 1987-Feb-24 | 3C 48 |
| NGC 7619* | A | 15A-305 | 2015-Jul-05 | 3C 48 |
| NGC 7619 | C | AC0488 | 1997-Sep-17 | 3C 286 |
Note. — (1) sources marked with * sign are our new VLA A observations within project 15A-305)
C.2 Multifrequency information
| Source | Radio | X-rays | Dust/extend | Atomic gas | Molecular gas |
|---|---|---|---|---|---|
| Name | VLA/GMRT/LOFAR | Chandra/XMM-Newton | HST/Spitzer | SOAR | ALMA/IRAM |
| 3C 449 | FR IFan74 | inCavHar98;Cro03, CFsLal13 | dustyDiskFer99;Tre06 | unkHaLak18 | CO(1-0)Leo01 |
| IC 1860 | PSDun10 | CFsGas07;Gas13 | - | nucHaLak18 | - |
| IC 4296 | FR I/FR IIGro19 | outCavGro19 | dustyDiskSchm02;Boi17 | extHaLak18 | CO(2-1)Boi17;Ruf19 |
| NGC 57 | PSGro | compact | noDustGou18 | noHaLak18 | - |
| NGC 315 | FR ICap02 | X-jetWor03;Don04 | dustyDiskVer99;Cap00;Boi21 | unkHaLak18 | CO(1-0)Fla10/(2-1)Boi21 |
| NGC 410 | PSCon98 | compactLak18 | noDustTan9 | nucHaLak18 | uppCO(1-0)/(2-1) |
| NGC 499 | NSDun10/PSBir20 | gCav(inPls/outPan24b,Kim19) | - | nucHaLak18 | - |
| NGC 507 | FR ICap02,Par86 | inCavDon10;Pls; CFFab02;Kra04 | noDustTem07 | noHaLak18 | - |
| NGC 533 | FR II?/young?Gro | inCavDun10 | dustTem07 | extHaLak18 | - |
| NGC 708 | FR IPar86,Bla04/young?Gro | inCavBla04;Pan14b | centDustSah16 | extHaLak18 | CO(1-0)Fla10/(2-1)Oli19,Nor21 |
| NGC 741 | radioTailSche17,Ven94 | inSche17/outCavJet08 | noDustVer05 | noHaLak18 | noCOWik95 |
| NGC 777 | compactBha14;Kol18 | pos-CavPan14b | lowDustPah04 | noHaLak18 | uppCO(1-0/2-1) |
| NGC 1132 | PSKim18 | gCavDon10;Pls | dustLanesAla12 | noHaLak18 | noCODav16 |
| NGC 1316 | FR IFom89;Mac20a | in/out(g)-CavLan10 | dustSchw80;Gri99;Dua14 | extHaLak18 | CO(1-0)Sag93/CO(2-1)Hor01 |
| NGC 1399 | FR IDun10;Shu08 | inCavPan14b | dustTem07/noDustDok95,Pra10 | noHaLak18 | CO(2-1)Pra10 |
| NGC 1404 | PSDun10;Gro | CFsMach05;Su17 | dustTem07 | noHaLak18 | - |
| NGC 1407 | disturbedGia12 | disturbedFor06 | dustKul14;Tem07 | noHaLak18 | uppCO(1-0)Bab19 |
| NGC 1550 | disturbedDun10;Kol18 | CavPan14b CFsKol20 | - | noHaLak18 | uppCO(1-0)/(2-1) |
| NGC 1600 | FR II?Bir85;Gro | inCavSiv04 | dustFerr99 | noHaLak18 | - |
| NGC 2300 | PSGro | pot-gCavPls | noDustXil04 | noHaLak18 | - |
| NGC 3091 | PSGro | pot-gCavPls | noDustCol01 | noHaLak18 | - |
| NGC 3923 | PSDis77;Gro | pot-gCavPls | filDustPen86,Bil16 | noHaLak18 | - |
| NGC 4073 | PSHog14;Gro | pot-gCavPls | - | noHaLak18 | - |
| NGC 4125 | PSKra02;Gro | pot-gCavPls | dustVer05;Tem07;Kul14 | noHaLak18 | noCO(1-0)Wel10/CO(2-1)Wel10 |
| NGC 4261 | FR I | XjetGli03;Wor10; outCav | dustyDisk | nucHaLak18 | uppCO(1-0)/CO(2-1)/(3-2)Boi21 |
| NGC 4374 | FR ILai87 | outCavFin01,Dev10 | dustLanesVer99;Boi17 | nucHaLak18 | CO(1-0)/(2-1)Fla10,Boi17 |
| NGC 4406 | PSDun10;Gro | X-ray tail/plumeFor79,Kim19 | dustSmi12 | extHaKen08;Lak18 | noCOWik95;You11 |
| NGC 4472 | FR ICon88;Gro | inCavBil04;Su19 | dustTem07 | noHaLak18 | CO(1-0)/(2-1)Huch88,Huch99 |
| NGC 4486 | FR IFan74 | in/outCavYou02;For05;For07; XjetMar02 | dustyDisk | extHaLak18 | CO(1-0)Fla10/(2-1)Sim18;Oli19 |
| NGC 4552 | FR IFil04;Gro | outCavMach06;All06 , CFMach06;Kra17 | dustTem07;Kul14 | noHaLak18 | uppCO(1-0)/(2-1)Com07 |
| NGC 4636 | FR IDun10;Gia11 | inCavSta86;Bal09 | dustTem07 | nucHaLak18 | uppCO(1-0)/CO(2-1) |
| NGC 4649 | FR I?Shu08;Dun10 | CavShu08;Dun10 | dustKul14;Tem07 | noHaLak18 | CO(1-0)Sag89;You11 |
| NGC 4696 | FR ITay02 | inCavTay06;San16 | filDustTem07;Fab16 | extHaLak18 | CO(1-0)Bab19,Oli19/(2-1)Fab16 |
| NGC 4778 | PSVrt02;Gro | gCavMor06,Pan14b | - | nucHaLak18 | - |
| NGC 4782 | FR IBor96;Mach06 | in/outCavBor96;Mach06 | - | nucHaLak18 | - |
| NGC 4936 | PSBha14;Gro | disturbedBha14;Lak18 | extHaLak18 | - | |
| NGC 5044 | jetsDun10;Sche20a | in/outCavGas09;Sche20a; CFsGas09 | dustTem07 | extHaLak18 | CO(2-1)Lau14;Dav14;Tem18 |
| NGC 5129 | jetsCon98;Bha14;Gro | disturbedBha14 | - | nucHaLak18 | - |
| NGC 5419 | relic-likeGos87;Sub03 | centralBal06 | - | noHaLak18 | - |
| NGC 5813 | jetsRan11;Ran15 | in/outCavRan11 | dustTem07 | extHaLak18 | uppCO(1-0)/(2-1) |
| NGC 5846 | disturbedDun10;Bir20 | in/outCavTri02;All06, CFMach11 | dustTem07 | nucHaLak18 | CO(1-0)/(2-1) |
| NGC 7619 | PSCon98;Gia11 | RPS tailsRan09 | dustTem07 | noHaLak18 | - |
Note. — (2) the Fanaroff-Riley (Fanaroff & Riley, 1974) (FR) radio morphology classification: ‘FR I’ = edge-darkened, ‘FR II’ = edge-brightened; ‘FR II?’: potential FR II radio source; ‘PS’: point-source radio morphology ( twice the beam size; unresolved source); NS: no radio source; young: young radio source; References column (2): Bir85: Birkinshaw & Davies (1985); Bir20: Bîrzan et al. (2020); Bha14: Bharadwaj et al. (2014); Bla04: Blanton et al. (2004); Bor96: Borne & Colina (1996); Cap02: Capetti et al. (2002); Con88L Condon & Broderick (1988); Con98: Condon et al. (1998); Dun10: Dunn et al. (2010); Dis77: Disney & Wall (1977); Fan74: Fanaroff & Riley (1974); Fil04: Filho et al. (2004); Fom89: Fomalont et al. (1989); Gia12: Giacintucci et al. (2012); Gia11: Giacintucci et al. (2011); Gos87: Goss et al. (1987); Gro: (submitted); Hog14: Hogan (2014); Kim18: Kim et al. (2018); Kol15: Kolokythas et al. (2015); Kol18: Kolokythas et al. (2018); Kra02: Krajnović & Jaffe (2002); Lai87: Laing & Bridle (1987); Mac20a: Maccagni et al. (2020); Mach06: Machacek et al. (2006); O’sul11: O’Sullivan et al. (2011); Par86: Parma et al. (1986); Ran11: Randall et al. (2011); Ran15: Randall et al. (2015); Sche17: Schellenberger et al. (2017); Sche20a: Schellenberger et al. (2020b); Shu08: Shurkin et al. (2008); Sub03: Subrahmanyan et al. (2003); Tay02: Taylor et al. (2002); Ven94: Venkatesan et al. (1994); Vrt02:Vrtilek et al. (2002); (3)‘inCav’: inner cavities, corresponding to innermost jets/lobes and located within innermost 5 kpc; ‘outCav’: outer cavities, corresponding to outer jets/cavities; ‘gCav’: ghost cavities, no radio counterpart; ‘pot-()Cav’: potential cavities; ‘CF’: cold fronts as a sign of sloshing;‘compact’: smooth compact morphology of the hot X-ray atmosphere within the host galaxy (up to 10 kpc from the center); ‘RPS tail’: ram pressure stripped tail; References column (3): All06: Allen et al. (2006); Bal09: Baldi et al. (2009); Bal06: Balmaverde & Capetti (2006); Bha14: Bharadwaj et al. (2014); Bil04; Biller et al. (2004); Bla04: Blanton et al. (2004); Bor96: Borne & Colina (1996); Cro03: Croston et al. (2003); Cro08: Croston et al. (2008); Dev10: Devereux et al. (2010); Don10: Dong et al. (2010); Dun10: Dunn et al. (2010); Fab02: Fabbiano et al. (2002); Fin01: Finoguenov et al. (2001); For79: Forman et al. (1979); For05: Forman et al. (2005); For07: Forman et al. (2007); For06: Forbes et al. (2006); Gas07: Gastaldello et al. (2007); Gas09: Gastaldello et al. (2009); Gas13: Gastaldello et al. (2013); Gli03: Gliozzi et al. (2003); Gro19: Grossová et al. (2019); Har98: Hardcastle et al. (1998); Jet08: Jetha et al. (2008); Kol20: Kolokythas et al. (2020); Kra04: Kraft et al. (2004); Kra17: Kraft et al. (2017); Kim19: Kim et al. (2019); Lal13: Lal et al. (2013); Lak18: Lakhchaura et al. (2018); Lan10: Lanz et al. (2010); Mach05: Machacek et al. (2005); Mach06: Machacek et al. (2006); Mar02: Marshall et al. (2002); Mor06: Morita et al. (2006); Pan14b: Panagoulia et al. (2014); Pls: Plšek et al. (in prep.); Ran09: Randall et al. (2009); Ran11: Randall et al. (2011); San16: Sanders et al. (2016); Sche17: Schellenberger et al. (2017); Sche20: Schellenberger et al. (2020b); Shu08: Shurkin et al. (2008); Siv04: Sivakoff et al. (2004); Sta86: Stanger & Warwick (1986); Su17:Su et al. (2017); Su19: Su et al. (2019); Tay06: Taylor et al. (2006); Tri02: Trinchieri & Goudfrooij (2002); Wor10: Worrall et al. (2010); You02: Young et al. (2002) (4) ‘dustyDisk’: morphology of dust in form of disk; ‘noDust’: no dust observed; ‘centDust’: centrally located dust; dustLanes: dust in form of lanes; ‘filDust’: filamentary dust References column (4):; Ala12: Alamo-Martínez et al. (2012); Bil16: Bílek et al. (2016); Boi17: Boizelle et al. (2017); Cap00: Capetti et al. (2000); Dua14: Duah Asabere et al. (2014); Kim19: Kim et al. (2019); Col01: Colbert et al. (2001); Kul14: Kulkarni et al. (2014); Fab16: Fabian et al. (2016); Fer99: Feretti et al. (1999); Ferr99: Ferrari et al. (1999); Gou18: Goullaud et al. (2018); Gri99: Grillmair et al. (1999); O’sul18:O’Sullivan et al. (2018); Pah04: Pahre et al. (2004); Pen86: Pence (1986); Schm02: Schmitt et al. (2002); Smi12: Smith et al. (2012); Schw80: Schweizer (1980); Tan9: Tang et al. (2009); Tem07: Temi et al. (2007a); Tre06: Tremblay et al. (2006); Sah16: Sahu et al. (2016); Ver99: Verdoes Kleijn et al. (1999); Ver05: Verdoes Kleijn & de Zeeuw (2005); Xil04: Xilouris et al. (2004) (5) ‘noHa’: no detection of H[N II] emission in the narrow-band imaging and confirming long slit spectroscopic observation, ‘unkHa’: the detection could not be confirmed, ’extHa’: H[N II] is extending to 2 kpc, ’nucHa’: nuclear H[N II] line emission, the extent is smaller than 2 kpc; Reference column (25): Ken08: Kenney et al. (2008); Lak18: Lakhchaura et al. (2018); (6) ‘noCO’: not dectected CO line emission; uppCO(..): upper limit on the CO line emission References column (6): Bab19: Babyk et al. (2019); Boi17: Boizelle et al. (2017); Boi21: Boizelle et al. (2021); Com07: Combes et al. (2007); Dav14: David et al. (2014a); Dav16: Davis et al. (2016); Fab16: Fabian et al. (2016); Fla10:Ocaña Flaquer et al. (2010); Hor01: Horellou et al. (2001); Huch88: Huchtmeier et al. (1988); Lau14: David et al. (2014b); Leo01: Leon et al. (2001); Nor21: North et al. (2021); O’sul15: O’Sullivan et al. (2015); O’sul18: O’Sullivan et al. (2018); Oli19: Olivares et al. (2019); Pra10: Prandoni et al. (2010); Ruf19: Ruffa et al. (2019); Sag89: Sage & Wrobel (1989); Sag93: Sage & Galletta (1993); Sim18: Simionescu et al. (2018); Tem18: Temi et al. (2018); You11: Young et al. (2011); Wik95: Wiklind et al. (1995); Wel10: Welch et al. (2010); (all) ‘-’: not investigated yet
Appendix D Appendix: Additional sources
Additionally, we provide a list of giant elliptical galaxies that are omitted from our main sample. The reason for each omission is given in Table D1 and varies from missing radio VLA data in the frequency range of 1–2 GHz or insufficient/missing archival Chandra data due to strong dominance by the central X-ray point source, thus obscures the extended emission from the hot X-ray atmosphere. Moreover, Table D1 also contains the VLA observational details together with information about the properties of the observed radio emission from the VLA in the frequency range between 1–2 GHz. This information might be used as a foundation for future proposals.
| Source | Config. | VLA Project Code | VLA Obs. Date | e | RMS | Exclusion Reason |
|---|---|---|---|---|---|---|
| Name | VLA | /Survey | (year-month-day) | [mJy] | [mJy] | |
| IC2006 | CD | NVSS | 1993-09-20 | - | 0.47 | no archival VLA at 1–2 GHz |
| insufficient Chandra (4.55 ks) | ||||||
| IC310* | A | 15A-305 | 2015-Jun-23 | 0.03 | dominant X-ray point source | |
| IC310 | C | AB0412 | 1986-Dec-05 | 1.8 | dominant X-ray point source | |
| NGC 1521 | CD | NVSS | 1993-09-20 | -# | 0.47 | no archival VLA at 1–2 GHz |
| NGC 2329* | A | 15A-305 | 2015-Jun-20 | 0.014 | insufficient Chandra (2.86 ks) | |
| NGC 2329 | C | AB0476 | 1988-Apr-14 | 0.6 | insufficient Chandra (2.86 ks) | |
| NGC 2340* | A | 15A-305 | 2015-Jun-19 | 0.002 | insufficient Chandra (1.92 ks) | |
| NGC 4203* | A | 15A-305 | 2015-Jul-03 | 0.027 | dominant X-ray point source | |
| NGC 4203 | D | AB0506 | 1988-Jul-13 | - | 2.8 | dominant X-ray point source |
| NGC 5090 | A | AG0454 | 1995-Jul-23 | 4.5 | no Chandra | |
| NGC 5090 | BC | AS0225 | 1985-Jul-07/08 | 0.67 | no Chandra | |
| NGC 5328 | CD | NVSS | 1993-09-20 | - | 0.47 | no archival VLA at 1–2 GHz |
| insufficient Chandra (2.6 ks) |