Search for H Emitters at : A Constraint on the H-based Star Formation Rate Density
Abstract
We search for H emitters at in four gravitationally lensed fields observed in the Hubble Frontier Fields program. We use the Lyman break method to select galaxies at the target redshift, and make the photometry in Spitzer/IRAC 5.8 m band to detect the H emission from the candidate galaxies. We find no significant detection of counterparts in the IRAC 5.8 m band, and this gives a constraint on the H luminosity function (LF) at . We compare the constraint with previous studies on rest-frame UV and FIR observation using the correlation between the H luminosity and the star formation rate. Additionally, we convert the constraint on the H LF into an upper limit for the star formation rate density (SFRD) at this epoch assuming the shape of the LF. We examine two types of parameterization of the LF, and obtain an upper limit for the SFRD of at . With this constraint on the SFRD, we give an independent probe into the total star formation activity including the dust-obscured and unobscured star formation at the Epoch of Reionization.
1 Introduction
One of the ultimate goals of extragalactic astronomy is the accurate quantification of the cosmic star formation history. Clarifying how many stars formed across the cosmic time reveals the mass assembly of galaxies, which is crucial to understand the galaxy formation and evolution. So far, a rough consensus has been reached that the cosmic star formation was most intensive at -3, 2-3 billion years after the Big Bang, and got weakened to the present universe (e.g., madau_cosmic_2014).
However, the evolution of star formation rate density (SFRD) earlier than the peak at -3 is still under controversy. In this redshift range, investigation with rest UV observations has been conducted most actively. Since UV light can be easily attenuated by dust, the correction for the loss of light due to this attenuation is essential to properly evaluate the total star formation rate (SFR). Based on the dust-corrected rest UV observation, the total SFRD beyond is thought to be decrease as the redshift increases (e.g., bouwens_alma_2020). SFRD measurements through FIR observations in this redshift range have also been available recently. FIR can probe the dust-obscured star formation (SF) activity, thus comparing the results based on rest UV and FIR observations enables us to see whether the correction for the dust extinction is appropriate. In rowan-robinson_star_2016, the dust-obscured SF activity at is estimated to be dominant over the dust-unobscured SF, and the total SFRD is suggested to be as large as that at . Recent ALMA observations also suggest that the contribution of dust-obscured SF is significant particularly in UV-bright region even at (schouws_significant_2021). On the other hand, in koprowski_evolving_2017, the dust-obscured SF activity at is estimated to be small and its contribution is negligible, which is consistent with the estimation based on the dust-corrected rest UV observation. Therefore, independent investigation is desired to measure the SFRD at more robustly.
As an independent tracer of the SF activity, the H emission line is one of the most ideal indicators. There is a tight correlation between the H luminosity and the SFR among star-forming galaxies (see e.g., a review by e.g., kennicutt_star_1998) and the dust extinction has much less effect on the H emission than on the rest UV light. Therefore, H emission is expected to give an independent inspection on the SFRD.
At , H emission is redshifted and observed at m, so it is difficult to observe it with ground-based telescopes, and observation with a space telescope is needed. With the current facilities, Spitzer/IRAC is the most suitable for the observation of this wavelength range, and H emission is strong enough to boost IRAC broadband photometry and thus can be detected with IRAC (e.g., yabe_stellar_2009; stark_keck_2013). To recognize H emission with broadband photometry, not only photometry at the broadband where the line falls but that at the wavelength longward of itself free from any other emission lines is also crucial. Without an observation longward wavelength, the flux boosting by emission lines can also be interpreted as the presence of the dust reddening and/or old stellar continuum.
IRAC has four broadband filters (3.6, 4.5, 5.8 and 8.0 m band), and the H emission from galaxies falls into each filter, respectively. However, for galaxies, an observation at the wavelength longward of H emission cannot be conducted with IRAC, and it would be difficult to measure the H flux as mentioned above. Thus, H emission from , 5.8 and 7.8 can be probed with IRAC. Very recently, in asada_star_2021, SFRD at has been estimated based on SED fitting by taking into account the effect of H emission, but H-based SFRD at and 7.8 are not probed yet. In particular, the H emission from a galaxy at has never been reported due to its faintness.
To investigate distant and/or less luminous galaxies, gravitational lensing effect is a powerful tool. Massive matter overdensities such as galaxy clusters can deflect the light ray from sources behind, which works just as lens does and brighten the apparent magnitude. The Hubble Frontier Fields (HFF; P.I.: Lotz) program conducted the deepest observations towards six massive clusters with Hubble Space Telescope (HST): Abell2744, MACSJ0416, MACSJ0717, MACSJ1149, AbellS1063, and Abell370 (lotz_frontier_2017), and these cluster regions are also observed with Spitzer. A number of studies about high- galaxies have been published using the HFF data, and it has been shown that strong gravitational lensing is effective to investigate the properties of galaxies down to intrinsically faint region (e.g. atek_are_2015; bhatawdekar_evolution_2019; kikuchihara_early_2020).
In this paper, we aim at investigating the SFRD using H emission line at , which is the highest redshift that can be probed with IRAC. The H emission is probed by 5.8 band with this redshift. To investigate intrinsically faint galaxies, we utilize gravitational lensing effect. This paper is structured as follows. In Section 2, we describe the data and make the photometry to make a sample of galaxies. Using the photometric catalogs, we search for H emitters at , and present the resulting constraint on the H luminosity function (LF) and the SFRD in Section 3. Discussions are given in Section LABEL:Sec:Discussion. Section LABEL:sec:summary gives the summary of this paper. Throughout this paper, all magnitudes are quoted in the AB system (oke_secondary_1983), and we use the Salpeter initial mass function. We also assume the cosmological parameters of km s-1 Mpc-1, and .
2 Data
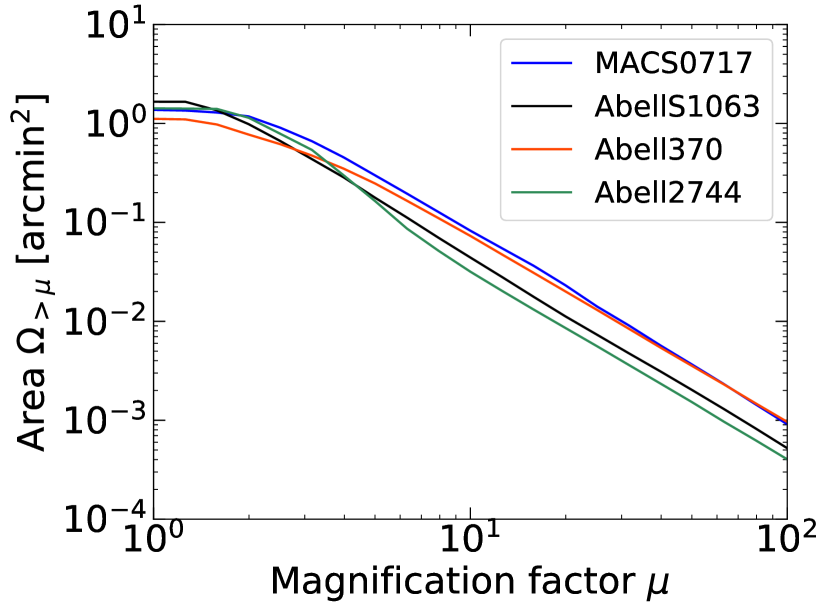
Among the six clusters of HFF, images at 5.8 and 8.0 m band are available for four clusters (Abell2744, MACS0717, AbellS1063, and Abell370), thus we focus on these cluster regions. The mosaic and weight images of HST observation are created by Space Telescope Science Institute (STScI) and available on the web111https://archive.stsci.edu/prepds/frontier/,222https://doi.org/10.17909/T9KK5N. They consist of three ACS bands and four WFC3 bands: F435W (), F606W (), F814W (), F105W (), F125W (), F140W (), and F160W (). The mosaic and weight images of Spitzer/IRAC observation are also available333https://irsa.ipac.caltech.edu/data/SPITZER/Frontier/overview.html. As for the mass distribution model, we use the latest model created by The Clusters As TelescopeS (CATS) team (richard_mass_2014) (i.e., Version 4 model for Abell370 and Version 4.1 model for the other three clusters).
2.1 Photometric Catalog
We use the Lyman break method to make a sample of galaxies at , where the H emission line falls into 5.8 m band. This target range of redshift can be covered by - and -dropout. Thus, we first construct photometric catalogs to obtain these Lyman Break Galaxy (LBG) candidates.
To measure the HST color accurately, we homogenize the point-spread function (PSF) of HST images. Using iraf, we measure the sizes of PSF in HST images at , , , , and band, and convolve them with a Gaussian kernel to match the PSF sizes to the largest one. In addition, we also make a stacked image of . We then run SExtractor (version 2.19.5; bertin_sextractor_1996) in dual-image mode to make the photometry in each band. The and images are used as the detection image, and two photometric catalogs are constructed for each cluster field (we refer to them as -selection catalog and -selection catalog, respectively). We use aperture magnitudes with a diameter of for the PSF homogenized images, and for the non-convolved images (i.e., , , and images). The limiting magnitudes are also measured with this diameter, which are shown in Table 1.
| Band | aaLimiting magnitudes are measured for the PSF homogenized images. | aaLimiting magnitudes are measured for the PSF homogenized images. | aaLimiting magnitudes are measured for the PSF homogenized images. | aaLimiting magnitudes are measured for the PSF homogenized images. | aaLimiting magnitudes are measured for the PSF homogenized images. | [3.6] | [4.5] | [5.8] | [8.0] | |||
|---|---|---|---|---|---|---|---|---|---|---|---|---|
| diameter | ||||||||||||
| Abell370 | 29.61 | 29.72 | 30.28 | 28.85 | 28.91 | 28.65 | 28.75 | 28.93 | 25.05 | 24.89 | 23.13 | 24.05 |
| Abell2744 | 29.79 | 29.78 | 30.33 | 28.79 | 29.05 | 28.83 | 28.83 | 28.87 | 25.12 | 25.07 | 22.49 | 22.16 |
| MACS0717 | 29.40 | 29.76 | 30.16 | 28.72 | 28.71 | 28.50 | 28.53 | 28.36 | 24.31 | 24.47 | 20.97 | 20.93 |
| AbellS1063 | 29.47 | 29.59 | 30.36 | 28.88 | 29.10 | 28.86 | 29.03 | 28.67 | 25.10 | 24.89 | 22.14 | 22.29 |
2.2 Sample Selection and IRAC photometry
Using the photometric catalogs, we make a sample of candidate galaxies whose H emission fall into the IRAC 5.8 m band.
For -dropout, we use -selection catalog, and adopt the selection criteria which are used by ishigaki_full-data_2018 (I18, hereafter):
{gather}
i_814 - Y_105 ¿ 0.8,
Y_105 - J_125 ¡ 0.8,
i_814 - Y_105 ¿ 2(Y_105 - J_125) + 0.6.
We require the signal-to-noise ratio (SNR) in both and band to be larger than .
In addition, we exclude any object whose SNRs in both the and band or in stacked image are larger than .
The detection threshold in band is set to be .
For -dropout, we use -selection catalog, and adopt the selection criteria which are used by I18 again:
{gather}
Y_105 - J_125 ¿ 0.5,
J_125 - JH_140 ¡ 0.5,
Y_105 - J_125 ¿ 1.6(J_125 - JH_140) + 0.4.
We require the SNR in both and band to be larger than .
In addition, we exclude any object whose SNR in , , or band image is larger than .
The detection threshold in band is set to be .
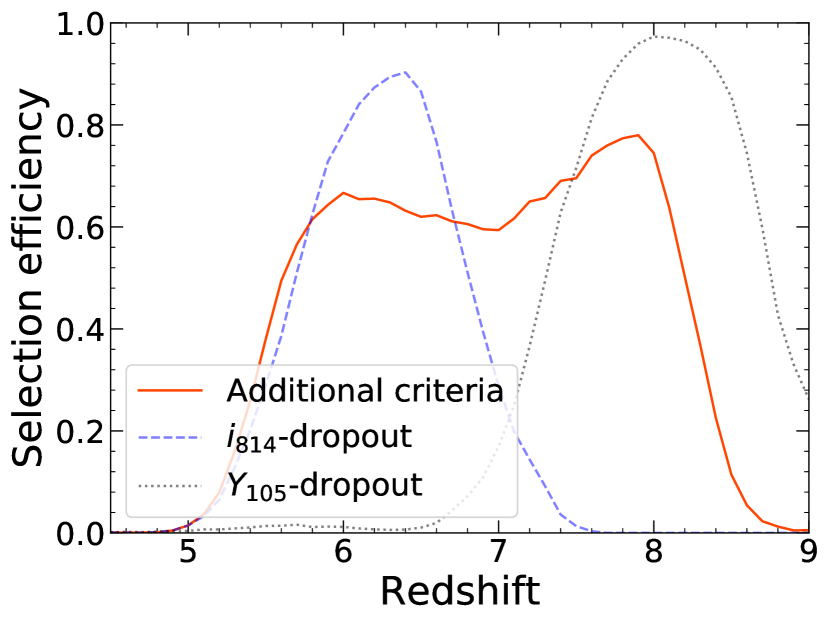
Selection efficiency against redshift is shown in Figure 1 both for -dropout and -dropout selection (detail explanation for Figure 1 is given in Section LABEL:subsec:Additional_cri).
As seen in Figure 1, these selections are insensitive for galaxies at .
To make our LBG sample complemented with galaxies at , we set another criteria as follows:
{gather}
i_814-J_125 ¿ 1.0,
i_814 - J_125 ¿ 10(J_125 - JH_140) - 0.2.
The criterion of equation (1) is applied only to galaxies that are detected in band.
We require the SNR in both and band to be larger than .
In addition, we exclude any object whose SNRs in both the and band or in stacked image are larger than .
The detection threshold in band is set to be .
The selection efficiency of the additional criteria is also shown in Figure 1.
A total of 229 galaxies are selected as our sample by the three color-color criteria. Among the -dropout or -dropout galaxies reported in the four cluster region by I18, 33 galaxies are not included in our sample of galaxies, mainly because a stacked deep image was used as the detection image in I18 while not in this study. Therefore, we add the 33 galaxies detected in I18 to our sample of galaxies. A visual inspection is conducted to remove spurious sources for each galaxies, and about half of them are removed. Most of the spurious sources are misidentifications of the tails of bright stars or the bad pixels at the edge of the image. We also exclude galaxies whose redshift is spectroscopically confirmed not to be in the range of our target redshift (hu_redshift_2002; richard_mass_2014; vanzella_characterizing_2014; karman_muse_2015; lagattuta_lens_2017; mahler_strong-lensing_2018). As a result, a total of 123 galaxies are selected as our sample.
For each galaxy in the sample, we make the photometry in the Spitzer/IRAC bands. To prioritize detection, we use aperture photometry with the optimum radius () which makes the SNR best for point sources. The center of aperture photometry is fixed to the position in the HST image that is used for detection. The systematic difference of astrometry between HST and Spitzer image is typically less than . The limiting magnitudes for each IRAC image with this aperture photometry are made, which are also shown in Table 1.
3 Results
3.1 Constraint on H LF
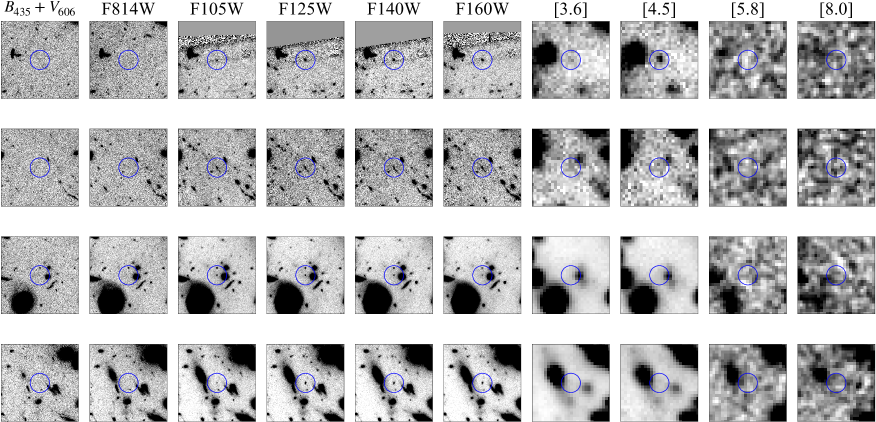
We find no significant detection in IRAC 5.8 m band at each position of the sample galaxies. Four examples are shown in Figure 2. Nevertheless, the H LF at can be constrained with the fact that no H emitter at is found by this survey. To derive the constraint, in this section, we first derive the limiting luminosity of the H emission, and put a constraint on the H LF considering the gravitational lensing effect.
Using the flux density that corresponds to the detection limit of 5.8 m band () and the bandwidth of 5.8 m band (), the limiting flux of 5.8 m band can be written as . This limiting flux is attributed to the continuum () and the H emission (), thus the following equation holds:
| (1) |
Considering that the maximum rest-frame equivalent width (EW) of H is (e.g., inoue_rest-frame_2011), we obtain
| (2) |
Since the contribution of the continuum to the limiting flux can be calculated as , the ratio of contributions must obey the following inequality:
| (3) |
Therefore, the limiting flux of H emission can be evaluated as follows:
{align}
F^lim_line &= FlimlineFlimline+Flimcont F^lim_all \notag
= 11+(Flimcont/Flimline) F^lim_all \notag
¡ 11+(Wλ/35000)F^lim_all = 57F^lim_all
Here, we use the value of the bandwidth of 5.8 m band 444This value is taken from Table 2.2 in the IRAC Instrument Handbook..
In the following, we use the maximum value for to define the (apparent) limiting luminosity of the H emission line in this observation as
| (4) |
where is the luminosity distance to .
No H emission is detected with the observation whose limiting line luminosity of the H emission is , thus the H LF can be constrained. The constraint on the LF at an intrinsic H luminosity () is
| (5) |
Here, is the effective volume where we search for galaxies with an H luminosity of . Using the comoving volume per unit solid angle from to (), this effective volume can be calculated as
| (6) | |||
| (7) |
Ω_μ≥xμxμ_limαL^int_Hαz=7.82σμΩ_μ≥xαL^lim_line¡L^int_HαL_HααL^int_Hα¡L^lim_lineμ_limL_HαL_HαL_Hα LHα=(1.3×1041ergs-1)(SFRM⊙yr-1).Theequationsof(LABEL:Eqn:UVtoSFR)and(3.1)aregivenbymadau_star_1998andkennicutt_star_1998,respectively.TheseconversionfactorscanchangewithanassumptionofdifferentIMF(e.g.,Chabrier03IMF(chabrier_galactic_2003))orlowerstellarmetallicity.However,bothconversionfactorschangessimilarly.Forexample,whenChabrier03IMFisassumedinsteadofSalpeterIMF,bothconversionfactorgetlargerby∼0.2Z=0.1Z_⊙∼0.1z∼6555The SFRF based on FIR observations is not currently probed at .z∼6z∼7.8666The difference of the age of the Universe at and is Myr.z∼6z∼6SFR∼10^4 M_⊙ yr^-1L_Hα∼10^45 erg s^-1z∼6z∼7.8z∼6z∼8βA_1600βM_UVz∼8z∼8
3.2 Constraint on the SFRD
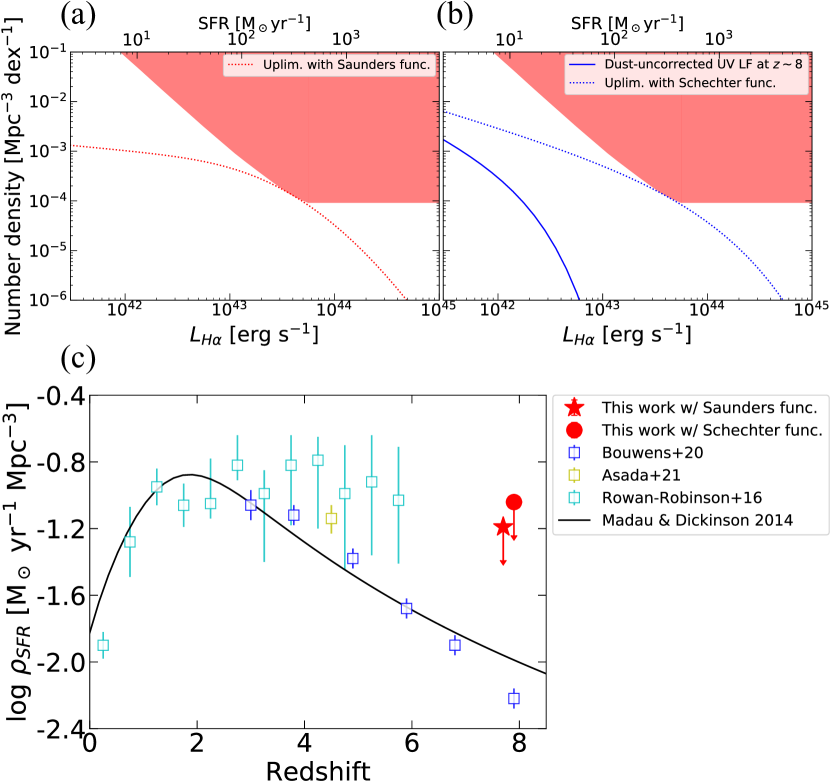
With the non-detection of H emitters at , we can put a constraint on the total SFRD at this epoch. To calculate the upper limit for the SFRD from the forbidden region for the H LF, it is necessary to assume the shape of the LF. In this work, two types of parameterization of the LF are assumed; saunders_60-micron_1990 functional form and Schechter function, which are often used in the context of FIR and rest UV observations, respectively.
3.2.1 Saunders function
To parameterize FIR LFs, a functional form that behave as power-law at low luminosity region and behave as Gaussian at high luminosity region is one of the common ways (saunders_60-micron_1990);
| (8) |
In rowan-robinson_star_2016, this functional form is used to fit to the FIR LF, and the parameters of , , and are found to be constant at . Thus, we fix , , and to those by rowan-robinson_star_2016, and examine the upper limit for using the forbidden region to obtain the upper limit for the SFRD with this functional form. Consequently, we obtain the upper limit for to be (Figure 5(a)) and that for the SFRD to be . The lower bound of the integration to calculate the SFRD is set to be which corresponds to or . The result is shown in Figure 5(c).
3.2.2 Schechter function
To parameterize (dust-uncorrected) rest UV LFs, Schechter function is commonly used;
| (9) |
To derive the upper limit for the SFRD at with this functional form, we use a (dust-uncorrected) rest UV LF at parameterized with this function, and examine the upper limit for the amount of dust extinction using the forbidden region by converting the dust-corrected UV LF to H LF through the SFR.
The amount of dust extinction depends on the rest UV luminosity. Observations and simulations reported that brighter galaxies tend to suffer from heavier dust extinction (e.g. smit_star_2012; yung_semi-analytic_2019; asada_star_2021). Thus, we assume that the correction factor can be written as {align} L_int = ηL, η= aL^b. where and is the dust-uncorrected and dust-corrected rest UV luminosity777Even if we use the Meurer relation and - relation to estimate the amount of dust extinction, the luminosity dependence of the correction factor can be expressed as equation (3.2.2).. For simplicity, we also assume that the correction factor to be unity at the faint-end region, i.e., there is no dust extinction in the faintest galaxies, which leads to the following relation;
| (10) |
With these fomulations, the dust-corrected rest UV LF can be written as
| (11) |
where , , and are defined using the Schechter parameters of , , and for the dust-uncorrected UV LF as follows; {gather} α_int = α-b1+b, ϕ_int^⋆= ϕ⋆1+b, L