11institutetext: Kavli Institute for Astrophysics and Space Research, Massachusetts Institute of Technology, Cambridge, MA 02139, USA 22institutetext: LLR (Laboratoire Leprince-Ringuet), CNRS, Ãcole Polytechnique, Institut Polytechnique de Paris, Palaiseau, France 33institutetext: School of Physics and Astronomy, Cardiff University, Queenâs Buildings, The Parade, Cardiff, CF24 3AA, UK 44institutetext: AIM, CEA, CNRS, Université Paris-Saclay, Université Paris Diderot, Sorbonne Paris Cité, 91191 Gif-sur-Yvette, France 55institutetext: Univ. Grenoble Alpes, CNRS, Grenoble INP, LPSC-IN2P3, 53, avenue des Martyrs, 38000 Grenoble, France 66institutetext: Institut d’Astrophysique Spatiale (IAS), CNRS, Université Paris Sud, Orsay, France 77institutetext: Institut Néel, CNRS, Université Grenoble Alpes, France 88institutetext: Institut de RadioAstronomie Millimétrique (IRAM), Grenoble, France 99institutetext: Aix Marseille Univ, CNRS, CNES, LAM (Laboratoire d’Astrophysique de Marseille), Marseille, France 1010institutetext: Department of Physics and Astronomy, University of Missouri, 5110 Rockhill Road, Kansas City, MO 64110, USA 1111institutetext: Dipartimento di Fisica, Sapienza Università di Roma, Piazzale Aldo Moro 5, I-00185 Roma, Italy 1212institutetext: Univ. Grenoble Alpes, CNRS, IPAG, 38000 Grenoble, France 1313institutetext: Jet Propulsion Laboratory, California Institute of Technology, Pasadena, CA 91109, USA 1414institutetext: Centro de Astrobiología (CSIC-INTA), Torrejón de Ardoz, 28850 Madrid, Spain 1515institutetext: Department of Astronomy, University of Florida, 211 Bryant Space Center, Gainesville, FL 32611, USA 1616institutetext: Instituto de Radioastronomía Milimétrica (IRAM), Granada, Spain 1717institutetext: LERMA, Observatoire de Paris, PSL Research University, CNRS, Sorbonne Université, UPMC, 75014 Paris, France 1818institutetext: School of Earth and Space Exploration and Department of Physics, Arizona State University, Tempe, AZ 85287, USA 1919institutetext: Laboratoire de Physique de lâÉcole Normale Supérieure, ENS, PSL Research University, CNRS, Sorbonne Université, Université de Paris, 75005 Paris, France 2020institutetext: Department of Physics and Astronomy, University of Pennsylvania, 209 South 33rd Street, Philadelphia, PA, 19104, USA 2121institutetext: Institut d’Astrophysique de Paris, Sorbonne Université, CNRS (UMR 7095), 75014 Paris, France 2222institutetext: Caltech, Pasadena, CA 91125, USA 2323institutetext: Department of Physics, University of California, One Shields Avenue, Davis, CA 95616, USA

Mapping the intracluster medium temperature in the era of NIKA2 and MUSTANG-2

\firstnameF. \lastnameRuppin\fnsep Mapping the intracluster medium temperature in the era of NIKA2 and MUSTANG-2Mapping the intracluster medium temperature in the era of NIKA2 and MUSTANG-2 f.ruppin@ip2i.in2p3.fr    \firstnameR. \lastnameAdam Mapping the intracluster medium temperature in the era of NIKA2 and MUSTANG-2Mapping the intracluster medium temperature in the era of NIKA2 and MUSTANG-2    \firstnameP. \lastnameAde Mapping the intracluster medium temperature in the era of NIKA2 and MUSTANG-2Mapping the intracluster medium temperature in the era of NIKA2 and MUSTANG-2    \firstnameH. \lastnameAjeddig Mapping the intracluster medium temperature in the era of NIKA2 and MUSTANG-2Mapping the intracluster medium temperature in the era of NIKA2 and MUSTANG-2    \firstnameP. \lastnameAndré Mapping the intracluster medium temperature in the era of NIKA2 and MUSTANG-2Mapping the intracluster medium temperature in the era of NIKA2 and MUSTANG-2    \firstnameE. \lastnameArtis Mapping the intracluster medium temperature in the era of NIKA2 and MUSTANG-2Mapping the intracluster medium temperature in the era of NIKA2 and MUSTANG-2    \firstnameH. \lastnameAussel Mapping the intracluster medium temperature in the era of NIKA2 and MUSTANG-2Mapping the intracluster medium temperature in the era of NIKA2 and MUSTANG-2    \firstnameA. \lastnameBeelen Mapping the intracluster medium temperature in the era of NIKA2 and MUSTANG-2Mapping the intracluster medium temperature in the era of NIKA2 and MUSTANG-2    \firstnameA. \lastnameBenoît Mapping the intracluster medium temperature in the era of NIKA2 and MUSTANG-2Mapping the intracluster medium temperature in the era of NIKA2 and MUSTANG-2    \firstnameS. \lastnameBerta Mapping the intracluster medium temperature in the era of NIKA2 and MUSTANG-2Mapping the intracluster medium temperature in the era of NIKA2 and MUSTANG-2    \firstnameL. \lastnameBing Mapping the intracluster medium temperature in the era of NIKA2 and MUSTANG-2Mapping the intracluster medium temperature in the era of NIKA2 and MUSTANG-2    \firstnameO. \lastnameBourrion Mapping the intracluster medium temperature in the era of NIKA2 and MUSTANG-2Mapping the intracluster medium temperature in the era of NIKA2 and MUSTANG-2    \firstnameM. \lastnameBrodwin Mapping the intracluster medium temperature in the era of NIKA2 and MUSTANG-2Mapping the intracluster medium temperature in the era of NIKA2 and MUSTANG-2    \firstnameM. \lastnameCalvo Mapping the intracluster medium temperature in the era of NIKA2 and MUSTANG-2Mapping the intracluster medium temperature in the era of NIKA2 and MUSTANG-2    \firstnameA. \lastnameCatalano Mapping the intracluster medium temperature in the era of NIKA2 and MUSTANG-2Mapping the intracluster medium temperature in the era of NIKA2 and MUSTANG-2    \firstnameB. \lastnameDecker Mapping the intracluster medium temperature in the era of NIKA2 and MUSTANG-2Mapping the intracluster medium temperature in the era of NIKA2 and MUSTANG-2    \firstnameM. \lastnameDe Petris Mapping the intracluster medium temperature in the era of NIKA2 and MUSTANG-2Mapping the intracluster medium temperature in the era of NIKA2 and MUSTANG-2    \firstnameF.-X. \lastnameDésert Mapping the intracluster medium temperature in the era of NIKA2 and MUSTANG-2Mapping the intracluster medium temperature in the era of NIKA2 and MUSTANG-2    \firstnameS. \lastnameDoyle Mapping the intracluster medium temperature in the era of NIKA2 and MUSTANG-2Mapping the intracluster medium temperature in the era of NIKA2 and MUSTANG-2    \firstnameE. F. C. \lastnameDriessen Mapping the intracluster medium temperature in the era of NIKA2 and MUSTANG-2Mapping the intracluster medium temperature in the era of NIKA2 and MUSTANG-2    \firstnameP. R. M. \lastnameEisenhardt Mapping the intracluster medium temperature in the era of NIKA2 and MUSTANG-2Mapping the intracluster medium temperature in the era of NIKA2 and MUSTANG-2    \firstnameA. \lastnameGomez Mapping the intracluster medium temperature in the era of NIKA2 and MUSTANG-2Mapping the intracluster medium temperature in the era of NIKA2 and MUSTANG-2    \firstnameA. H. \lastnameGonzalez Mapping the intracluster medium temperature in the era of NIKA2 and MUSTANG-2Mapping the intracluster medium temperature in the era of NIKA2 and MUSTANG-2    \firstnameJ. \lastnameGoupy Mapping the intracluster medium temperature in the era of NIKA2 and MUSTANG-2Mapping the intracluster medium temperature in the era of NIKA2 and MUSTANG-2    \firstnameF. \lastnameKéruzoré Mapping the intracluster medium temperature in the era of NIKA2 and MUSTANG-2Mapping the intracluster medium temperature in the era of NIKA2 and MUSTANG-2    \firstnameC. \lastnameKramer Mapping the intracluster medium temperature in the era of NIKA2 and MUSTANG-2Mapping the intracluster medium temperature in the era of NIKA2 and MUSTANG-2    \firstnameB. \lastnameLadjelate Mapping the intracluster medium temperature in the era of NIKA2 and MUSTANG-2Mapping the intracluster medium temperature in the era of NIKA2 and MUSTANG-2    \firstnameG. \lastnameLagache Mapping the intracluster medium temperature in the era of NIKA2 and MUSTANG-2Mapping the intracluster medium temperature in the era of NIKA2 and MUSTANG-2    \firstnameS. \lastnameLeclercq Mapping the intracluster medium temperature in the era of NIKA2 and MUSTANG-2Mapping the intracluster medium temperature in the era of NIKA2 and MUSTANG-2    \firstnameJ.-F. \lastnameLestrade Mapping the intracluster medium temperature in the era of NIKA2 and MUSTANG-2Mapping the intracluster medium temperature in the era of NIKA2 and MUSTANG-2    \firstnameJ.-F. \lastnameMacías-Pérez Mapping the intracluster medium temperature in the era of NIKA2 and MUSTANG-2Mapping the intracluster medium temperature in the era of NIKA2 and MUSTANG-2    \firstnameA. \lastnameMaury Mapping the intracluster medium temperature in the era of NIKA2 and MUSTANG-2Mapping the intracluster medium temperature in the era of NIKA2 and MUSTANG-2    \firstnameP. \lastnameMauskopf Mapping the intracluster medium temperature in the era of NIKA2 and MUSTANG-2Mapping the intracluster medium temperature in the era of NIKA2 and MUSTANG-2Mapping the intracluster medium temperature in the era of NIKA2 and MUSTANG-2Mapping the intracluster medium temperature in the era of NIKA2 and MUSTANG-2    \firstnameF. \lastnameMayet Mapping the intracluster medium temperature in the era of NIKA2 and MUSTANG-2Mapping the intracluster medium temperature in the era of NIKA2 and MUSTANG-2    \firstnameM. \lastnameMcDonald Mapping the intracluster medium temperature in the era of NIKA2 and MUSTANG-2Mapping the intracluster medium temperature in the era of NIKA2 and MUSTANG-2    \firstnameA. \lastnameMonfardini Mapping the intracluster medium temperature in the era of NIKA2 and MUSTANG-2Mapping the intracluster medium temperature in the era of NIKA2 and MUSTANG-2    \firstnameE. \lastnameMoravec Mapping the intracluster medium temperature in the era of NIKA2 and MUSTANG-2Mapping the intracluster medium temperature in the era of NIKA2 and MUSTANG-2    \firstnameM. \lastnameMuñoz-Echeverría Mapping the intracluster medium temperature in the era of NIKA2 and MUSTANG-2Mapping the intracluster medium temperature in the era of NIKA2 and MUSTANG-2    \firstnameL. \lastnamePerotto Mapping the intracluster medium temperature in the era of NIKA2 and MUSTANG-2Mapping the intracluster medium temperature in the era of NIKA2 and MUSTANG-2    \firstnameG. \lastnamePisano Mapping the intracluster medium temperature in the era of NIKA2 and MUSTANG-2Mapping the intracluster medium temperature in the era of NIKA2 and MUSTANG-2    \firstnameN. \lastnamePonthieu Mapping the intracluster medium temperature in the era of NIKA2 and MUSTANG-2Mapping the intracluster medium temperature in the era of NIKA2 and MUSTANG-2    \firstnameV. \lastnameRevéret Mapping the intracluster medium temperature in the era of NIKA2 and MUSTANG-2Mapping the intracluster medium temperature in the era of NIKA2 and MUSTANG-2    \firstnameA. J. \lastnameRigby Mapping the intracluster medium temperature in the era of NIKA2 and MUSTANG-2Mapping the intracluster medium temperature in the era of NIKA2 and MUSTANG-2    \firstnameA. \lastnameRitacco Mapping the intracluster medium temperature in the era of NIKA2 and MUSTANG-2Mapping the intracluster medium temperature in the era of NIKA2 and MUSTANG-2Mapping the intracluster medium temperature in the era of NIKA2 and MUSTANG-2Mapping the intracluster medium temperature in the era of NIKA2 and MUSTANG-2    \firstnameC. \lastnameRomero Mapping the intracluster medium temperature in the era of NIKA2 and MUSTANG-2Mapping the intracluster medium temperature in the era of NIKA2 and MUSTANG-2    \firstnameH. \lastnameRoussel Mapping the intracluster medium temperature in the era of NIKA2 and MUSTANG-2Mapping the intracluster medium temperature in the era of NIKA2 and MUSTANG-2    \firstnameK. \lastnameSchuster Mapping the intracluster medium temperature in the era of NIKA2 and MUSTANG-2Mapping the intracluster medium temperature in the era of NIKA2 and MUSTANG-2    \firstnameS. \lastnameShu Mapping the intracluster medium temperature in the era of NIKA2 and MUSTANG-2Mapping the intracluster medium temperature in the era of NIKA2 and MUSTANG-2    \firstnameA. \lastnameSievers Mapping the intracluster medium temperature in the era of NIKA2 and MUSTANG-2Mapping the intracluster medium temperature in the era of NIKA2 and MUSTANG-2    \firstnameS. A. \lastnameStanford Mapping the intracluster medium temperature in the era of NIKA2 and MUSTANG-2Mapping the intracluster medium temperature in the era of NIKA2 and MUSTANG-2    \firstnameD. \lastnameStern Mapping the intracluster medium temperature in the era of NIKA2 and MUSTANG-2Mapping the intracluster medium temperature in the era of NIKA2 and MUSTANG-2    \firstnameC. \lastnameTucker Mapping the intracluster medium temperature in the era of NIKA2 and MUSTANG-2Mapping the intracluster medium temperature in the era of NIKA2 and MUSTANG-2    \firstnameR. \lastnameZylka Mapping the intracluster medium temperature in the era of NIKA2 and MUSTANG-2Mapping the intracluster medium temperature in the era of NIKA2 and MUSTANG-2
Abstract

We present preliminary results from an on-going program that aims at mapping the intracluster medium (ICM) temperature of high redshift galaxy clusters from the MaDCoWS sample using a joint analysis of shallow X-ray data obtained by Chandra and high angular resolution Sunyaev-Zel’dovich (SZ) observations realized with the NIKA2 and MUSTANG-2 cameras. We also present preliminary results from an on-going Open Time program within the NIKA2 collaboration that aims at mapping the ICM temperature of a galaxy cluster at z=0.45𝑧0.45z=0.45 from the resolved detection of the relativistic corrections to the SZ spectrum. These studies demonstrate how high angular resolution SZ observations will play a major role in the coming decade to push the investigation of ICM dynamics and non-gravitational processes to high redshift before the next generation X-ray observatories come into play.

1 Introduction

Mapping the temperature of the hot plasma within galaxy clusters from the spectroscopic information embedded in X-ray data has enabled tremendous advances in the understanding of merger dynamics, sloshing, and AGN feedback at low redshift (e.g. Russell et al., 2012; Rossetti et al., 2013; Rafferty et al., 2012). However, producing such temperature maps is currently unfeasible for most clusters at z>0.5𝑧0.5z>0.5 because of the limited effective area of current X-ray observatories. Unfortunately, the next generation of X-ray observatories such as Athena and Lynx will not be operational until the 2030s. In the meantime it is essential to push the investigation of ICM dynamics and thermodynamic properties to higher redshift in order to understand how galaxy clusters formed and evolved. Fortunately, during the last decade, we have witnessed the arrival of instruments capable of mapping the SZ effect at high angular resolution on scales of few arcmin (e.g. Monfardini et al., 2010; Adam et al., 2018; Dicker et al., 2014). The amplitude of the SZ signal being redshift independent and proportional to the ICM pressure content, the joint analysis of SZ and X-ray data offers a powerful way of mapping the ICM temperature distribution at high redshift (e.g. Adam et al., 2017; Ruppin et al., 2020). Another challenging method that enables mapping the ICM temperature at high redshift consist in detecting the relativistic corrections to the SZ effect (rSZ). This method has the advantage of being independent of X-ray observations. It could therefore allow us to unveil potential calibration biases affecting the temperature measurements realized with current X-ray observatories. In this paper, we present preliminary results from two on-going programs using respectively joint analyses of X-ray and SZ data and the detection of the rSZ effect in order to map the ICM temperature of high redshift clusters.

2 Mapping the ICM temperature with joint X-ray / SZ analyses

Refer to caption
Figure 1: Left: Spectroscopic temperature map derived from Chandra for a cluster at z=0.55𝑧0.55z=0.55. Right: Temperature map obtained from the joint analysis of Chandra X-ray and NIKA2 SZ observations for a cluster at z=1.2𝑧1.2z=1.2. The relative uncertainties on temperature are similar in both panels. Figures extracted from (Adam et al., 2017; Ruppin et al., 2020).

Simulations have shown that the most active period in cluster formation history is expected at redshifts 1<z<21𝑧21<z<2 (e.g. Poole et al., 2007). Studying merger dynamics and non-gravitational processes such as AGN feedback through temperature mapping thus requires high angular resolution X-ray and SZ observations at z>1𝑧1z>1.
The Massive and Distant Clusters of WISE Survey (MaDCoWS) is an Infra-Red (IR) survey that has enabled detecting hundreds of massive clusters at z>1𝑧1z>1 (Gonzalez et al., 2019) observable from the northern hemisphere, where the NIKA2 and MUSTANG-2 SZ cameras are operational. We have selected 10 clusters from the MaDCoWS catalog in order to realize high angular resolution follow-up observations in X-ray and SZ with Chandra, NIKA2, and MUSTANG-2. This sample, dubbed MOO-X/SZ, covers a redshift range from z=0.9𝑧0.9z=0.9 to z=1.75𝑧1.75z=1.75. The joint analysis of the SZ and X-ray data obtained for each MOO-X/SZ cluster will allow us to investigate ICM physics with a level of details and precision that is not achievable with current X-ray observatories on their own at such high redshifts.
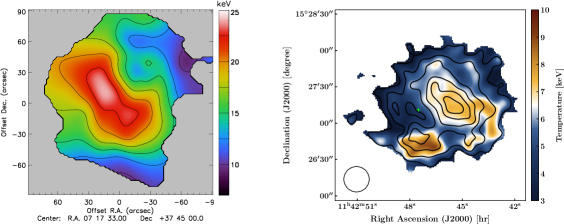
We have already completed the analysis of the most massive cluster in this sample, i.e. MOO J1142++1527 at z=1.2𝑧1.2z=1.2 (Ruppin et al., 2020). As shown in Fig. 1, the quality of the temperature map of this high-z𝑧z cluster that we realized from the joint analysis of Chandra and NIKA2 data with a combined exposure of only 23.2 hours (right) is similar to the one achieved from the analysis of the X-ray spectroscopic data obtained with a 42.5 hour Chandra exposure of the z=0.55𝑧0.55z=0.55 cluster MACS J0717.5++3745 (left) (Adam et al., 2017). Obtaining a similar map using only X-ray information from Chandra at such high redshift would have required an exposure at least 30 times greater. This highlights the strong complementarity between X-ray and high angular resolution SZ observations to go beyond the characterization of individual systems at z>1𝑧1z>1 and start investigating the ICM properties in samples of high redshift clusters.
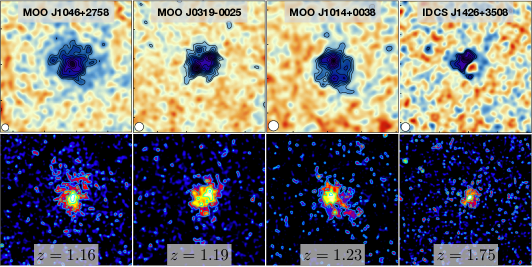
Building upon the success of this first study, a NIKA2 Open Time (OT) program aiming at mapping the SZ signal of 5 MOO-X/SZ clusters already observed by Chandra as well as a Large Program (LP) dedicated to the Chandra observation of 4 MOO-X/SZ clusters already observed by MUSTANG-2 have been accepted. The NIKA2 OT observations were completed in March 2021 and the Chandra LP observations are still on-going. In Fig. 2, we present preliminary maps of 4 MOO-X/SZ clusters obtained in SZ (top) and X-ray (bottom). The first SZ map on the left has been obtained with MUSTANG-2 at 90 GHz and the three other maps present NIKA2 data at 150 GHz (Perotto et al., 2020). The SZ signal is detected at >7σabsent7𝜎>7\sigma in all maps. We observe similar cluster morphologies in SZ and X-ray and we identify ICM disturbances in each cluster. For example, MOO J0319-0025 at z=1.19𝑧1.19z=1.19 displays a clear bi-modal morphology while MOO J1014++0038 at z=1.23𝑧1.23z=1.23 presents ICM substructures in the south-west region. These preliminary results tend to confirm our expectation that ICM disturbances due to merging events are more frequently observed at z>1𝑧1z>1 than in low redshift cluster samples such as REXCESS (BÃhringer et al., 2007) or CCCP (Hoekstra et al., 2012). Based on the tools that we developed for the analysis of MOO J1142++1527, we are currently analyzing jointly our X-ray and SZ data sets in order to provide a detailed characterization of the ICM properties in a sample of z>0.9𝑧0.9z>0.9 clusters for the first time. In particular, we are producing ICM temperature and entropy maps that we cross correlate with the galaxy distribution of each cluster in order to understand their merger dynamics. We also aim at exploring the connection between the ICM thermodynamic properties of all MOO-X/SZ clusters and the potential radio emission of the brightest cluster galaxy in order to better understand AGN feedback at high redshift. The analysis of the spectroscopic information embedded within our Chandra data using prior information on the ICM temperature obtained from the joint X-ray / SZ analysis will allow us to constrain the metallicity content of these cluster in order to understand metal enrichment at high redshift. Finally, the hydrostatic masses obtained from the estimated density and pressure profiles of these clusters will be compared to the richness-derived masses obtained with Spitzer in order to unveil potential systematic effects on the mass-richness scaling relation derived at high redshift. The full characterization of the MOO-X/SZ sample will thus provide valuable information that will pave the way to an in-depth understanding of cluster formation at z>1𝑧1z>1 and to precise cluster cosmological constraints from the forthcoming optical/IR surveys such as Euclid (Euclid Collaboration et al., 2019) and Rubin-LSST (Wu et al., 2021).

3 Mapping the ICM temperature from the detection of the rSZ effect

Refer to caption
Figure 2: Preliminary SZ (top) and X-ray (bottom) maps obtained with the MUSTANG-2 (far left) and NIKA2 camera at 90 GHz and 150 GHz and the ACIS-I instrument on-board Chandra for four clusters in the MOO-X/SZ sample. Contours in the MUSTANG-2 and NIKA2 maps start at 3σ3𝜎3\sigma with 1σ1𝜎1\sigma steps. Photon count iso-contours are shown in the X-ray maps for visual purposes. We indicate the name and redshift of each cluster in the upper and lower panels, respectively. All maps have a side length of about 4similar-toabsent4{\sim}4 arcmin.

Assuming that the contributions to the SZ effect from sub-dominant electron populations such as ultra-relativistic electrons accelerated in AGN jets or electrons arising from the annihilation of dark matter are negligible, the total relative variation of the CMB specific intensity at frequency ν𝜈\nu induced from the SZ effect is given by:

ΔIνI0=ytSZf(ν,Te)+ykSZg(ν,Te,vz),Δsubscript𝐼𝜈subscript𝐼0subscript𝑦𝑡𝑆𝑍𝑓𝜈subscript𝑇𝑒subscript𝑦𝑘𝑆𝑍𝑔𝜈subscript𝑇𝑒subscript𝑣𝑧\frac{\Delta I_{\nu}}{I_{0}}=y_{tSZ}\,f(\nu,T_{e})+y_{kSZ}\,g(\nu,T_{e},v_{z}), (1)

where the amplitudes of the thermal and kinetic SZ signals are given by:

ytSZ=kBTemec2τandykSZ=vzcτwithτ=σTne𝑑l.formulae-sequencesubscript𝑦𝑡𝑆𝑍subscript𝑘𝐵subscript𝑇𝑒subscript𝑚𝑒superscript𝑐2𝜏andformulae-sequencesubscript𝑦𝑘𝑆𝑍subscript𝑣𝑧𝑐𝜏with𝜏subscript𝜎𝑇subscript𝑛𝑒differential-d𝑙y_{tSZ}=\frac{k_{B}T_{e}}{m_{e}c^{2}}\tau\leavevmode\nobreak\ \leavevmode\nobreak\ \leavevmode\nobreak\ \mathrm{and}\leavevmode\nobreak\ \leavevmode\nobreak\ \leavevmode\nobreak\ y_{kSZ}=-\frac{v_{z}}{c}\tau\leavevmode\nobreak\ \leavevmode\nobreak\ \leavevmode\nobreak\ \mathrm{with}\leavevmode\nobreak\ \leavevmode\nobreak\ \leavevmode\nobreak\ \tau=\sigma_{T}\int n_{e}\,dl. (2)

The SZ signal thus depends on three quantities: the density of ICM electrons nesubscript𝑛𝑒n_{e} along the line of sight l𝑙l, the ICM temperature Tesubscript𝑇𝑒T_{e}, and the bulk velocity of the ICM electrons along the line of sight vzsubscript𝑣𝑧v_{z}. The relativistic corrections inducing variations of the shape of the tSZ and kSZ spectra f(ν,Te)𝑓𝜈subscript𝑇𝑒f(\nu,T_{e}) and g(ν,Te,vz)𝑔𝜈subscript𝑇𝑒subscript𝑣𝑧g(\nu,T_{e},v_{z}) are often referred to as the rSZ effect and depend directly on the value of the ICM temperature. Sampling the total SZ spectrum with at least three independent data points on a large enough frequency range thus enables estimating the ICM temperature independently from any X-ray observation. The detection of the rSZ effect has already been made using millimeter spectroscopy with Z-Spec (Zemcov et al., 2012) and by stacking analyses (e.g. Erler et al., 2018). These studies enable measuring the mean ICM temperature of galaxy clusters but they were unable to provide resolved detection of the rSZ effect which is a prerequisite to the production of ICM temperature maps.

Refer to caption
Figure 3: Top: Preliminary SZ maps obtained with MUSTANG-2 and NIKA2 at 90, 150, and 260 GHz, respectively. Signal-to-noise contours start at 3σ3𝜎3\sigma with 1σ1𝜎1\sigma increments. We highlight the region considered for the SZ surface brightness measurements shown in the bottom panel with red rectangles. Bottom: Preliminary measurements of the SZ surface brightness in the shock region of the cluster at the three frequencies available with NIKA2 and MUSTANG-2 (purple points) along with the expected tSZ spectra for ICM temperatures of 1 and 20 keV.

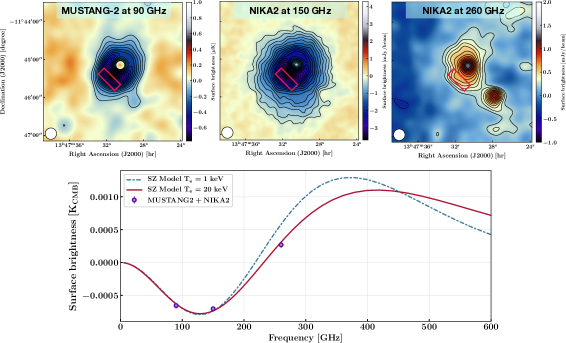
To this end, we proposed to use both MUSTANG-2 and NIKA2 in order to map the SZ signal of the most SZ luminous cluster in the sky, RX J1347-1145 at z=0.45𝑧0.45z=0.45, at an angular resolution <18absent18<18 arcsec and on scales of few arcmin at 90, 150, and 260 GHz. The MUSTANG-2 observations were realized at the Green Bank Telescope during the instrument commissioning phase for 2 hours. The NIKA2 observations have been conducted in the context of an Open Time program for a total of 24 hours. The top panels of Fig. 3 show the MUSTANG-2 map (left) obtained with the MIDAS software (Romero et al., 2020) and the NIKA2 maps (middle and right) realized from a preliminary analysis based on the procedure described in (Ruppin et al., 2020). All three maps have been smoothed at an effective resolution of 20 arcsec. The extended SZ signal is detected at >3σabsent3𝜎>3\sigma on a sky area of about 2×1.5arcmin221.5superscriptarcmin22\times 1.5\leavevmode\nobreak\ \mathrm{arcmin}^{2}. We detect a strong positive signal in the cluster core at 260 GHz due to a radio AGN. This signal compensates the negative SZ signal at 90 GHz and 150 GHz. We also detect a sub-millimeter galaxy to the south-west of the cluster, which also alters its morphology at 150 GHz. As a preliminary test, we measured the average SZ surface brightness in a region (red rectangle in Fig. 3) where a shock has been detected in previous analyses (Allen et al., 2002) and far enough from the detected point sources to minimize their contamination. The measurements are shown as purple points in the lower panel of Fig. 3. We use the SZpack software (Chluba et al., 2012) in order to compute the expected SZ spectrum for ICM temperatures of 1 keV (dashed blue line) and 20 keV (red line), assuming a null bulk velocity along the line of sight111Note that having three SZ constraints will also enable fitting the kinetic SZ component in the total SZ signal.. While changing the value of the Compton parameter ytSZsubscript𝑦𝑡𝑆𝑍y_{tSZ} allows us to fit the data at 90 GHz and 150 GHz in both cases, we are able to exclude an ICM temperature of 1 keV at more than 5σ5𝜎5\sigma in the shock region based on the measurement realized at 260 GHz. A careful characterization of the point source, cosmic infrared background, and kSZ contamination using Herschel and spectroscopic data will allow us to produce the first ICM temperature map of a galaxy cluster based on the resolved detection of the rSZ effect.

4 Conclusions

We have completed the observations of two independent SZ programs aiming at mapping the ICM temperature of high redshift galaxy clusters. The joint analysis of our SZ data and Chandra observations will allow us to characterize the ICM properties of a sample of MaDCoWS clusters at z>1𝑧1z>1 with a level of details that cannot be achieved with current X-ray observatories on their own. Furthermore, the resolved detection of the rSZ effect with MUSTANG-2 and NIKA2 will enable providing the first ICM temperature map of a merging cluster without considering any X-ray information.

Acknowledgements

We would like to thank the IRAM staff for their support during the campaigns. The NIKA2 dilution cryostat has been designed and built at the Institut Néel. In particular, we acknowledge the crucial contribution of the Cryogenics Group, and in particular Gregory Garde, Henri Rodenas, Jean Paul Leggeri, Philippe Camus. This work has been partially funded by the Foundation Nanoscience Grenoble and the LabEx FOCUS ANR-11-LABX-0013. This work is supported by the French National Research Agency under the contracts "MKIDS", "NIKA" and ANR-15-CE31-0017 and in the framework of the "Investissements dâavenirâ program (ANR-15-IDEX-02). This work has benefited from the support of the European Research Council Advanced Grant ORISTARS under the European Union’s Seventh Framework Programme (Grant Agreement no. 291294). F.R. acknowledges financial supports provided by NASA through SAO Award Number SV2-82023 issued by the Chandra X-Ray Observatory Center, which is operated by the Smithsonian Astrophysical Observatory for and on behalf of NASA under contract NAS8-03060.

References

  • Russell et al. (2012) H. R. Russell et al., MNRAS 423, 236â255 (2012)
  • Rossetti et al. (2013) M. Rossetti et al., Astron. Astrophys. 556, A44 (2013)
  • Rafferty et al. (2012) D. A. Rafferty et al., MNRAS 428, 58â70 (2012)
  • Monfardini et al. (2010) A. Monfardini et al., Astron. Astrophys. 521, A29 (2010)
  • Adam et al. (2018) R. Adam et al., Astron. Astrophys. 609, A115 (2018)
  • Dicker et al. (2014) S. R. Dicker et al., J. Low Temp. Phys. 176, 808â814 (2014)
  • Adam et al. (2017) R. Adam et al., Astron. Astrophys. 606, A64 (2017)
  • Ruppin et al. (2020) F. Ruppin et al., ApJ 893, 74 (2020)
  • Poole et al. (2007) G. B. Poole et al. MNRAS 380, 437-454 (2007)
  • Gonzalez et al. (2019) A. H. Gonzalez et al., ApJS 240, 33 (2019)
  • Perotto et al. (2020) L. Perotto et al., Astron. Astrophys. 637, A71 (2020)
  • BÃhringer et al. (2007) H. BÃhringer et al., Astron. Astrophys. 469, 363-377 (2007)
  • Hoekstra et al. (2012) H. Hoekstra et al., MNRAS 427, 1298â1311 (2012)
  • Euclid Collaboration et al. (2019) Euclid Collaboration et al., Astron. Astrophys. 627, A23 (2019)
  • Wu et al. (2021) H.-Y. Wu et al., ApJ 910, 28 (2021)
  • Zemcov et al. (2012) M. Zemcov et al., ApJ 749, 114 (2012)
  • Erler et al. (2018) J. Erler et al., MNRAS 476, 3360-3381 (2018)
  • Romero et al. (2020) C. Romero et al., ApJ 891, 90 (2020)
  • Allen et al. (2002) S. W. Allen et al., MNRAS 335, 256 (2002)
  • Chluba et al. (2012) J. Chluba et al., MNRAS 426, 510â530 (2012)