Strain hardening by sediment transport
Abstract
The critical fluid-shear stress for the onset of sediment transport, , varies with the history of applied shear. This effect has been attributed to compaction, but the role of shear jamming is unexplored. We examine the response of a granular bed to fluid-shear stress cycles of varying magnitude and direction, and determine isotropic and anisotropic contributions. Creep and bed-load transport result in direction-dependent strain hardening for . Dilation-induced weakening, and memory loss, occurs for larger stresses that fluidize the bed. Our findings provide a granular explanation for the formation and breakup of hard packed river-bed ’armor’.
The entrainment of granular materials by fluid shear acts to shape diverse landscapes on Earth and other planets [1]. While decades of research mostly examined the influence of fluid-flow structures and turbulence, a recent focus on granular rheology and structure has spurred progress in determining the roles of collisions and viscous dissipation in sediment transport dynamics and rates [2, 3, 4, 5, 6, 7, 8]. A central challenge that emerges is understanding the nature of the threshold of motion itself. In liquid-driven flows such as rivers, ‘bed-load’ transport is often envisioned as a thin layer of surface grains moving over a static or ‘jammed’ sediment bed [9, 10]. In this context, the onset of bed-load transport is typically defined by the dimensionless critical Shields stress, , which is a threshold value of the Shields number, , where , , , and are the fluid-shear stress, particle density, fluid density, gravity and grain size. Clark et al. [11] offered a new interpretation of as the stress at which moving grains can no longer find a stable (static) configuration; this opens the possibility of relating the susceptibility of fluid entrainment to granular confinement. On the other hand, Houssais et al. [4] observed that grains beneath the threshold for bed-load motion were not static, but rather exhibited a slow and erratic creeping motion with caged dynamics. In their laminar flow experiments, coincided with a transition from creep to a dense-granular flow on the surface.
Temporal variation in the entrainment threshold is commonly observed in natural rivers; changes as a function of the history of fluid stress [12, 13, 14], causing hysteresis in observed sediment transport rates through a flood [15, 16, 14]. Experiments indicate that these transient dynamics arise due to the formation and breakup of river-bed ‘armor’ [17, 18]. Armoring has been proposed to arise from vertical grain-size segregation in polydisperse river beds [19, 20, 21], and by formation of a hard-packed ‘pavement’ surface [22, 10, 23, 24, 17]. In this study we consider the latter, in which the increased resistance of river-bed sediments to fluid entrainment may be considered a form of strain hardening. Charru et al. [10] observed a steady decline in bed-load transport rate — over several days — under constant , which they attributed to an increase in effective by compaction of the near-bed region. Even subcritical () flows cause armoring due to granular creep [17, 25], which can only be broken up by flows far exceeding critical ( ). Using an experimental setup similar to ours, Allen and Kudrolli [25] focused on the transient response of a sediment bed to sub-critical fluid shear. They observed that that creep rates diminished over time, while the granular packing fraction of the sediment bed increased toward the volume fraction associated with the glass transition, . Moreover, they showed that the value needed to initiate bed load systematically increased with .
The findings above are consistent with the general picture that the rigidity of granular materials is primarily controlled by packing fraction or, more specifically, the distance from the jamming/glass transition characterized by [26, 27, 28, 1]. It is now known, however, that strain hardening may also occur without any change in volume. This “shear jamming” arises from the development of a granular fabric that is oriented to resist an applied, directional boundary shear [29, 30, 31, 32]. Like compaction, the resulting strain hardening produces a history-dependent memory in the mechanical stability of the granular pack [33]. But unlike compaction, this memory is stored in anisotropic structures that are fragile when subject to changes in shear direction [31]. Shear jamming and compaction may operate in tandem; it is well known that shearing or shaking in multiple directions allows more compaction than one direction alone (see, e.g., [34]) — presumably because the suppression/destruction of anisotropic structures allows the bed to access a higher configuration
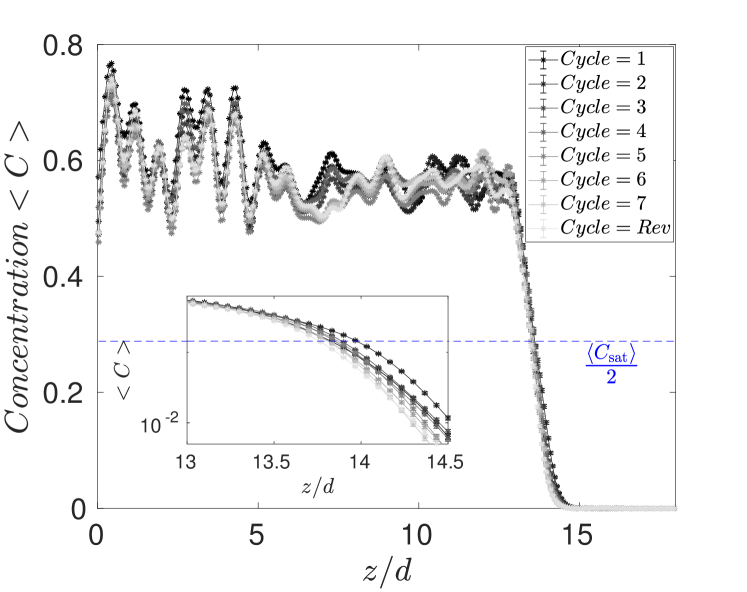
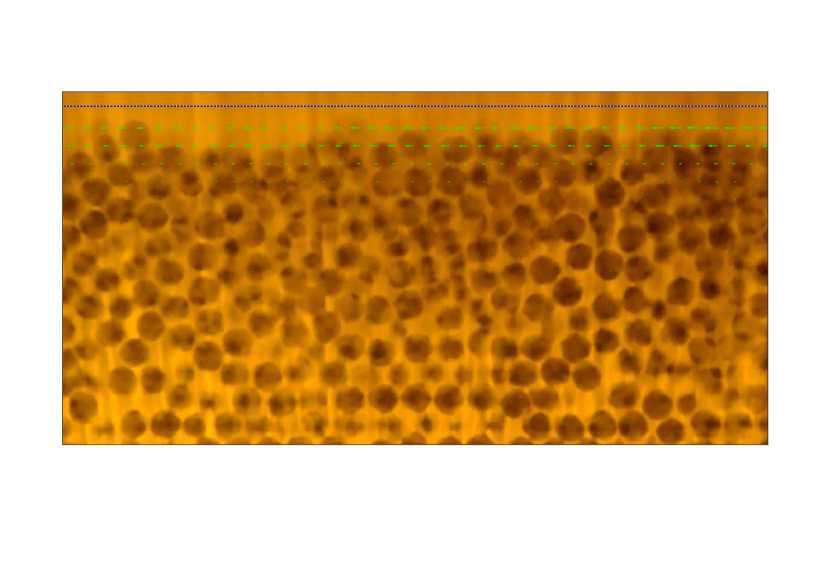
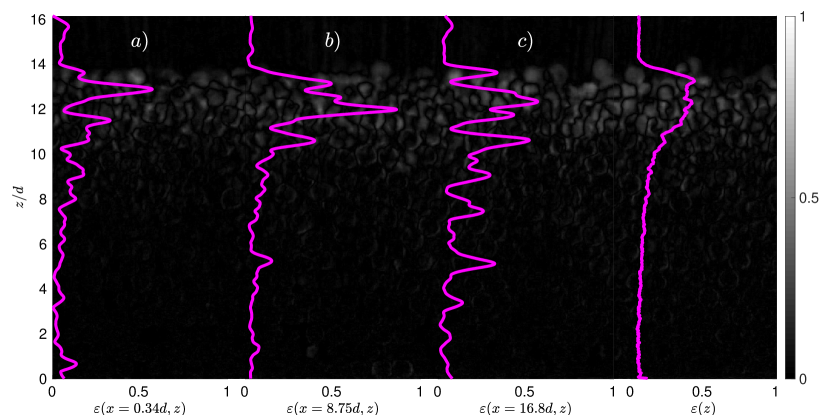
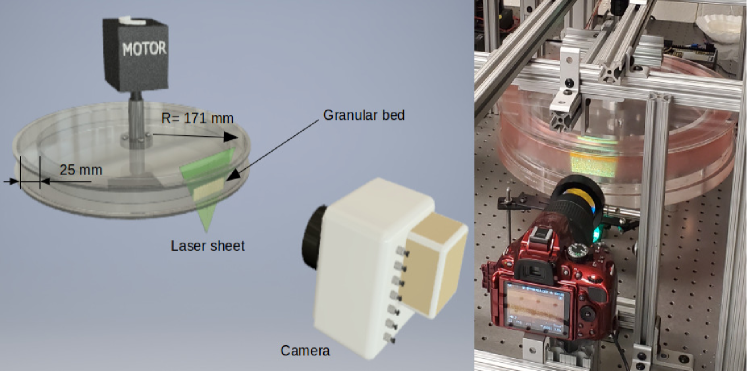
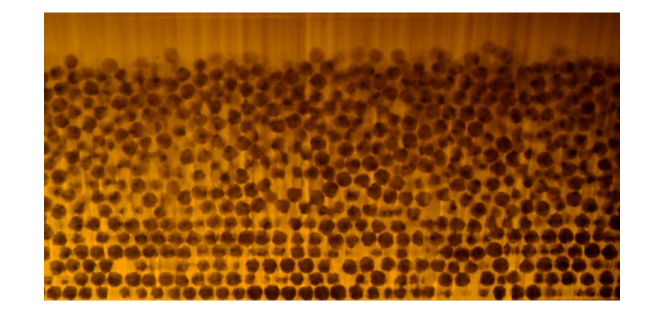
We expect that fluid-sheared granular beds experience both isotropic (compaction) and anisotropic (shear jamming) strain hardening, due to the free-surface condition and directionality of applied shear. Sediment transport studies have not, however, considered anisotropic contributions. Moreover, the contributions of creep (sub-critical) vs. bed-load (super-critical) transport to strain hardening have not been isolated, and the conditions that lead to armor breakup and erasure of memory have not been characterized. In this Letter we address these issues with laminar sediment transport experiments, in which a sedimented bed of grains was subject to fluid shear-stress cycles of 10-min duration, with varying magnitude and direction. The device and materials are completely described in previous work [4]. Briefly: A bed (20-22 mm thick) of monodisperse acrylic beads (diameter, mm; density, kg/m3) was submerged in a refractive-index matched oil (kinematic viscosity, Pa s; density, kg/m3) inside an annular flume (Fig. 12(a)). A rotating lid was used to achieve fluid shear rates of 2.9 s-1 14.5 s-1, which corresponds to Shields numbers of 0.1 0.5 where = . Channel and grain scale Reynolds numbers, = and = respectively, were within 0.7 3.5 and 0.077 0.384, where is the lid velocity at the channel centerline and is the gap distance between the lid and bed surface. The preparation protocol involved almost complete suspension of the granular bed by pre-shearing for 5 min at = 6, followed by 5 minutes of quiescence to allow settling. From our previous work we choose a reference critical Shields stress of [2]. Images captured at 60 Hz in the illuminated mid-channel cross section (Fig. 12(b)) allowed determination of vertical profiles of granular velocity, strain rate and concentration, averaged over each 600-s stress cycle and horizontally in the direction. Average velocity () was determined from standard Particle Image Velocimetry (PIV) techniques, and average concentration () was estimated from image filtering and thresholding [35]. Strain was determined in the following manner: from one image to the next, a mobility matrix was measured as the intensity difference at each pixel and its dimensionless equivalent, averaged in time and the direction, (see Fig. 12, and the Supplemental Material [35]); an effective strain was estimated at each elevation as .
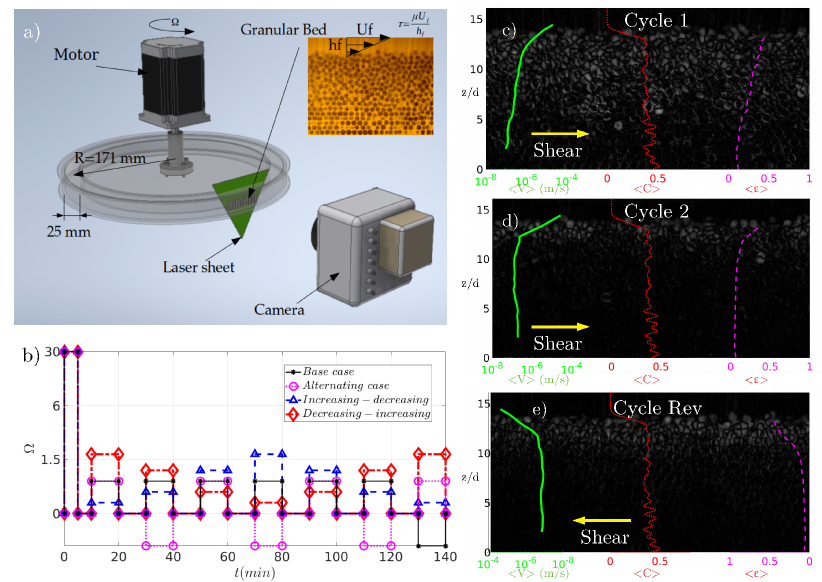
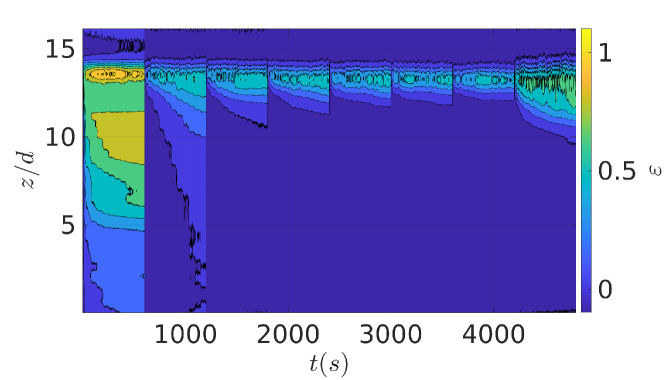
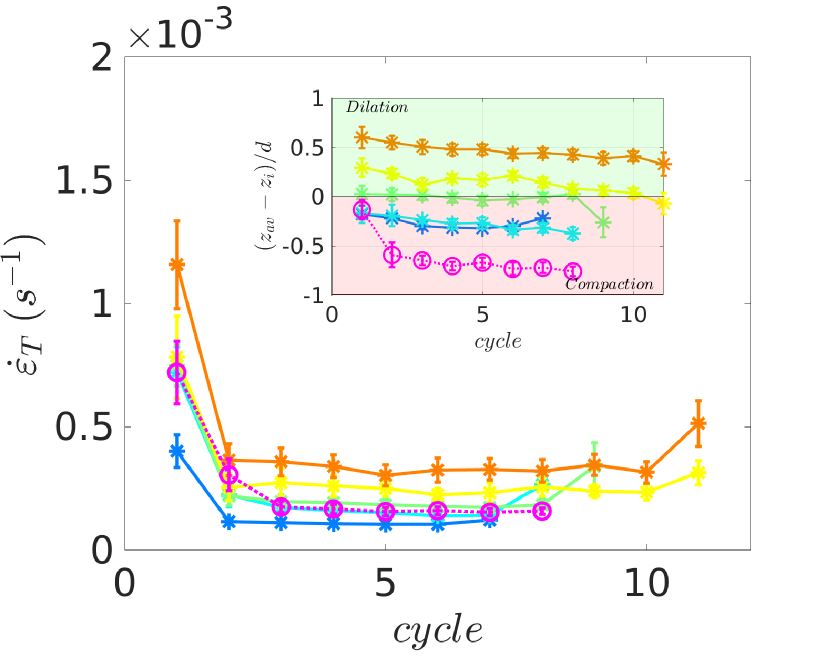
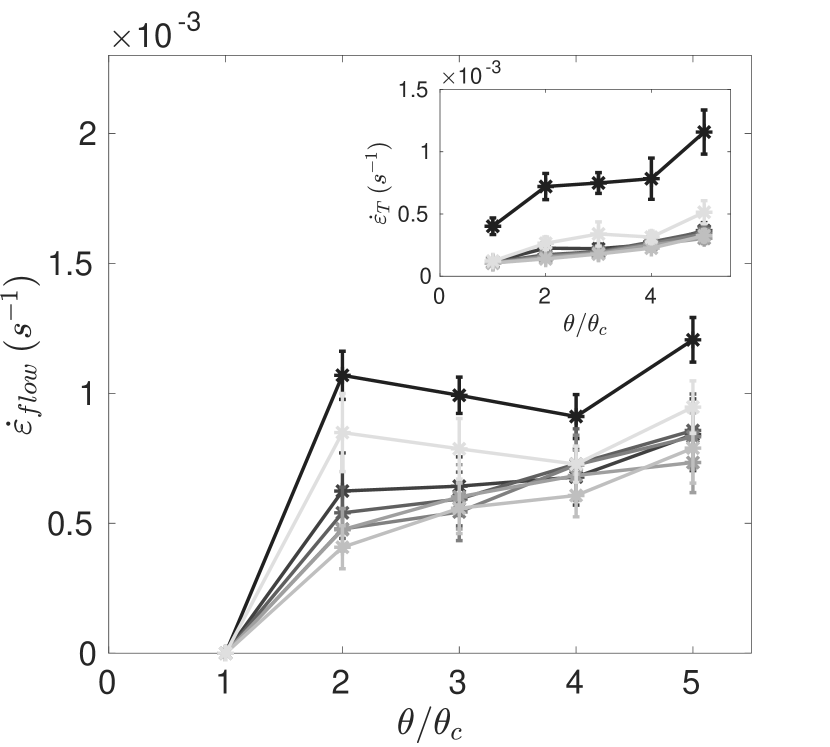
We first describe the phenomenology associated with unidirectional cyclic shear, followed by a direction reversal, in a typical run that we call the “base case” (Fig. 12). At time s a constant fluid shear stress of (i.e., ) was applied in a clockwise direction. An unjamming front, initiated at the surface, propagated downward at progressively slower speed through time (Figs. 12(c) and 2(a)). At min the shear was turned off, and the time-integrated parameters were computed for the first cycle. Depth () profiles of average particle velocity and concentration followed the bi-partite patterns reported previously [4, 2]; decreased rapidly with depth while increased to a constant value in the bed-load layer, and below this layer diminished more slowly (Fig. 12). The granular bed compacted by roughly 2 % over the first stress cycle, as determined from a decrease in the bed-surface elevation (defined as the location at which [4]). Repeated identical stress cycles showed progressive compaction and strain hardening of the granular bed — as evidenced by reduced mobility of particles at all depths (Figs. 2 and 3) — though the effect of each subsequent cycle was diminished. Interestingly, the boundary between the upper bed-load layer and the lower creeping layer became sharper as the bed hardened, as indicated by the developing kink in the velocity profile. Using this kink to delineate the two regimes (cf. [2, 35]), we can quantify changes in mobility in the creeping and bed-load layers separately (Fig. 3). Strain rates for creep diminished more rapidly and significantly than bed load. Reversing the shear direction after seven cycles resulted in a (roughly) doubling of the strain rates for creep and bed load (Fig. 3). Notably, this increased mobility was accompanied by a jump in compaction (Fig. 3). This behavior is consistent with observations of shear jamming and fragile states in granular systems [31]. In particular, while bed compaction and particle mobility appeared to saturate under a uni-directional stress, their abrupt increase on reversal indicates that the bed was conditioned to one direction but fragile to other directions. These results suggest that direction-dependent (anisotropic) strain hardening was smaller than, but of similar order to, (isotropic) compaction (Fig. 3); and that memory of the former was erased by changing the shear direction.
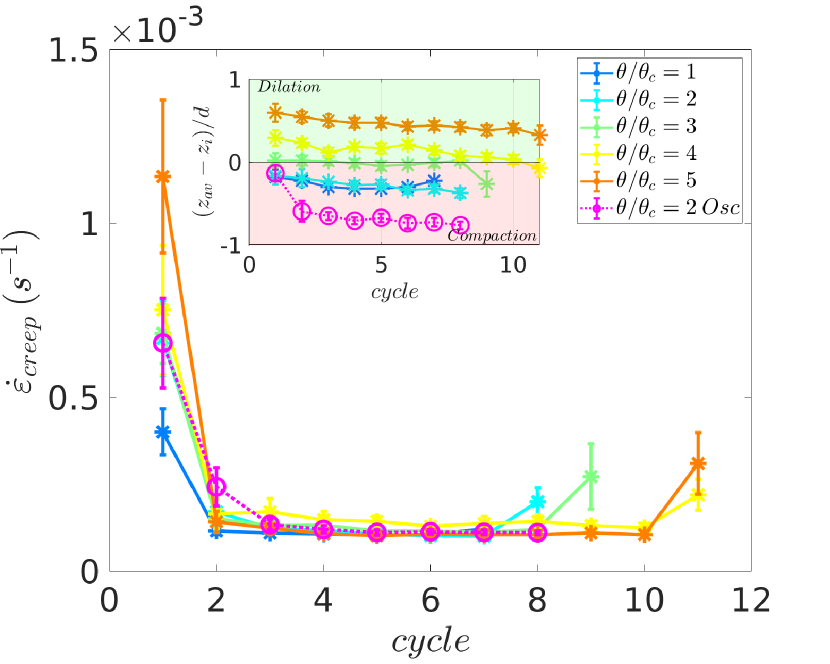
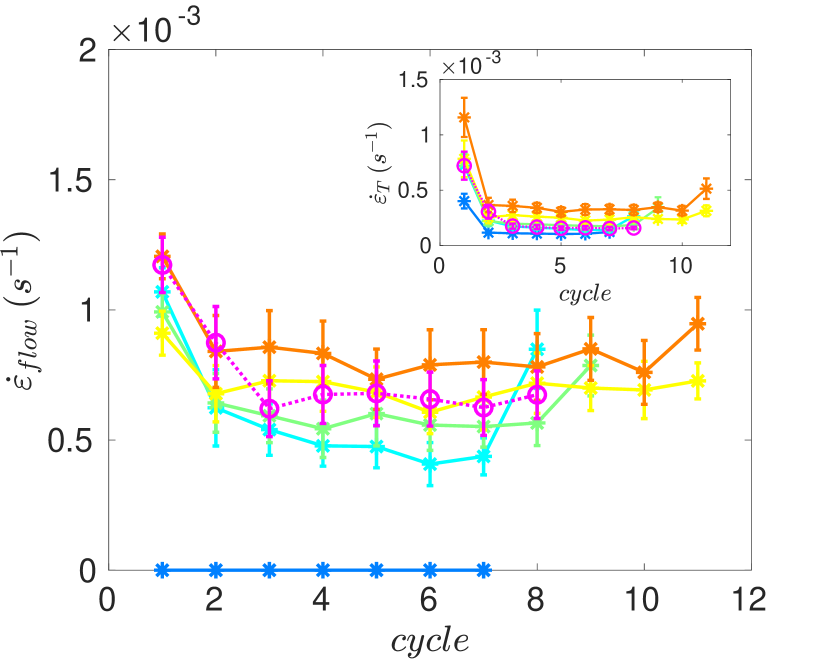
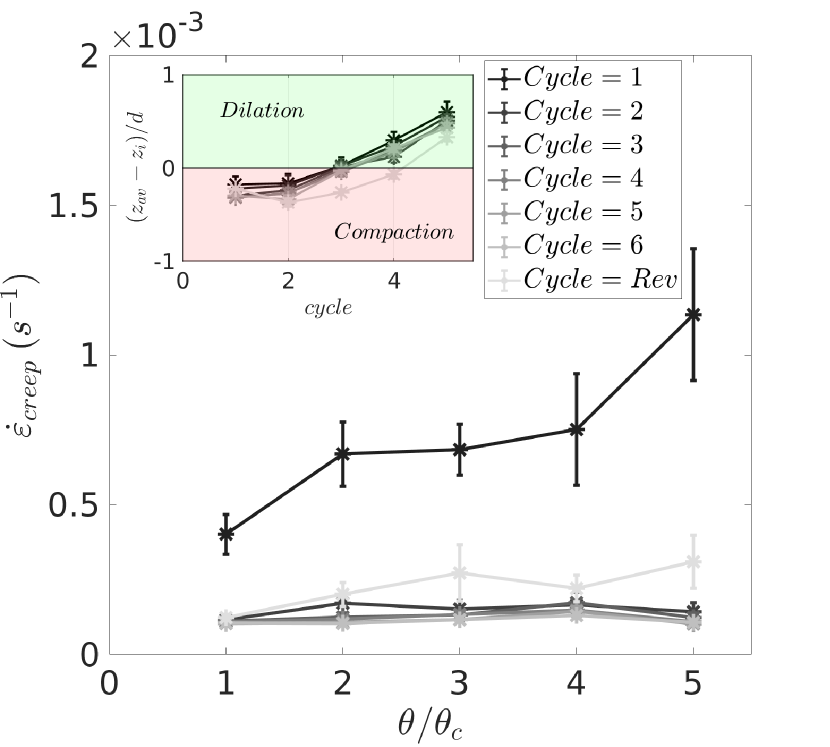
Repeating the base case experiment at higher values shows qualitatively similar behavior, but quantitative differences. As increases, the magnitude of strain hardening increases for creep but decreases for bed load (Fig. 3). We attribute this to volume change and memory in the bed. Creep is generally associated with compaction, and the finding that increasing results in enhanced creep rates and faster strain hardening is in agreement with Allen and Kudrolli [25]. Intense bed-load transport, however, is associated dilation and yielding, which erase memory [33]. The response to shear direction reversal supports this interpretation; mobility is greatly enhanced for the creep regime for all , but the jump in mobility for bed load diminishes as increases.
(a)

(b)
(c)
(d)
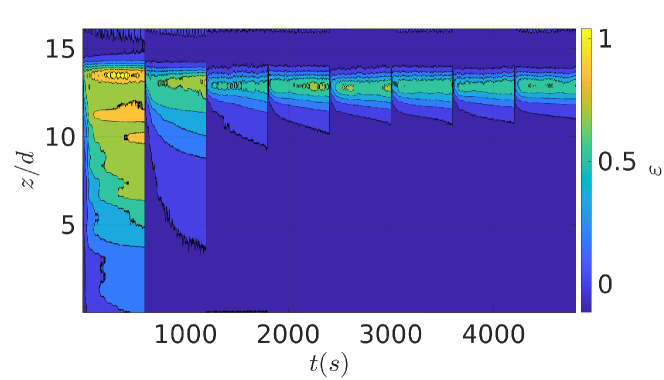
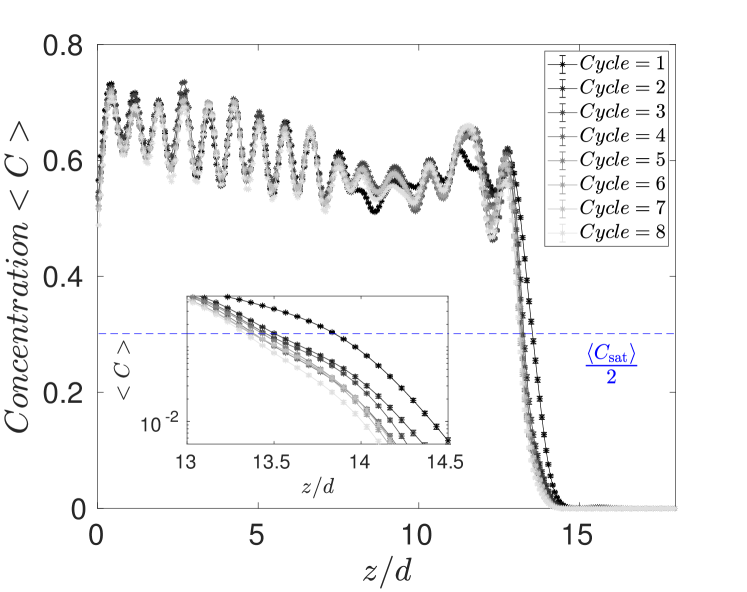
To further probe anisotropic effects, we compare a second “alternating case” experiment with in which the only change from the base case is that shear direction was reversed for each cycle (Fig. 12). An important first observation is that bed compaction under alternating shear direction is much larger than all uni-directional experiments (Fig. 3), consistent with previous work [34]. If volume fraction were the only control on particle mobility, we would expect strain rates for the alternating case to be much lower than all uni-directional experiments. Particle mobility, however, remained elevated compared to the base case (Fig. 3). We deduce that the alternating shear limited the development of a persistent granular fabric. Although shear reversal allowed the bed to find a more dense configuration, this did not make the bed stiffer compared to the uni-directional case. On the other hand, particle mobility in the alternating case was significantly lower than when shear was reversed at the end of the base case (Fig. 3). We infer that the bed developed some kind of resisting fabric under bi-directional flow, similar to memory formation observed in oscillatory shear experiments [33]; but that this fabric was not as strong as structures trained under uni-directional shear.
(a)
(b)
(c)
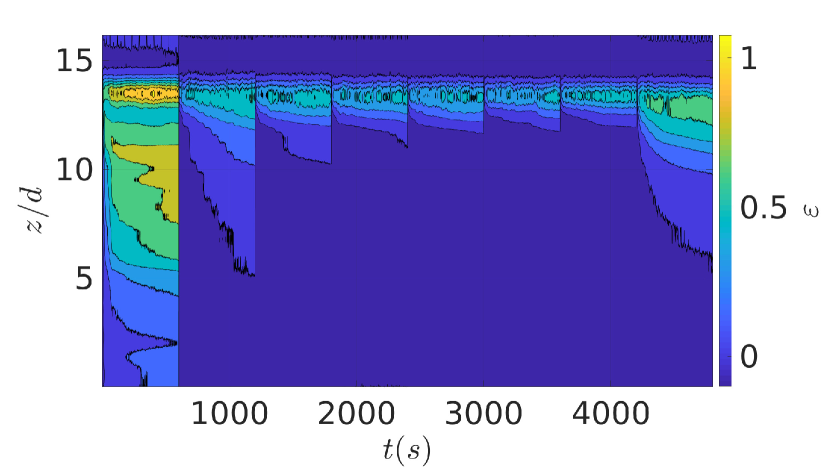
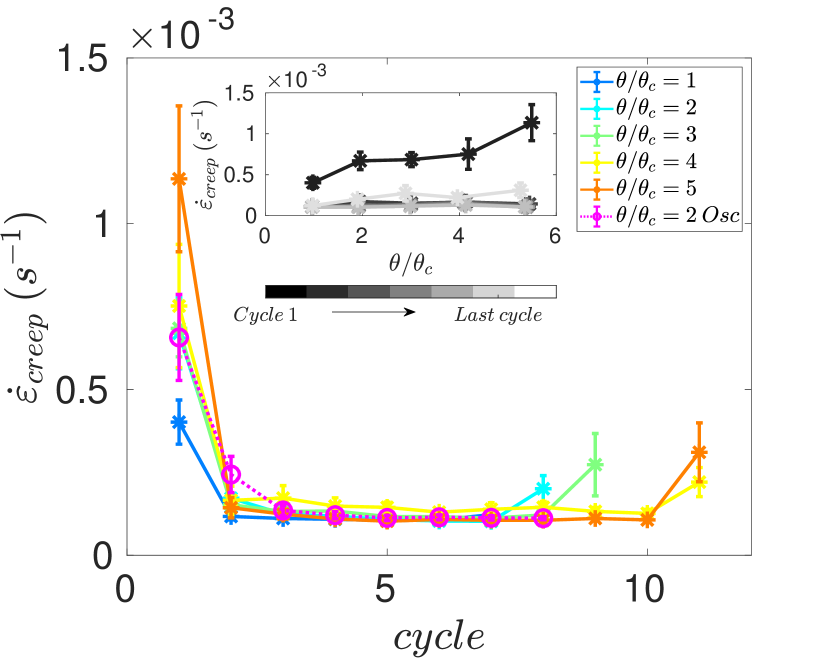
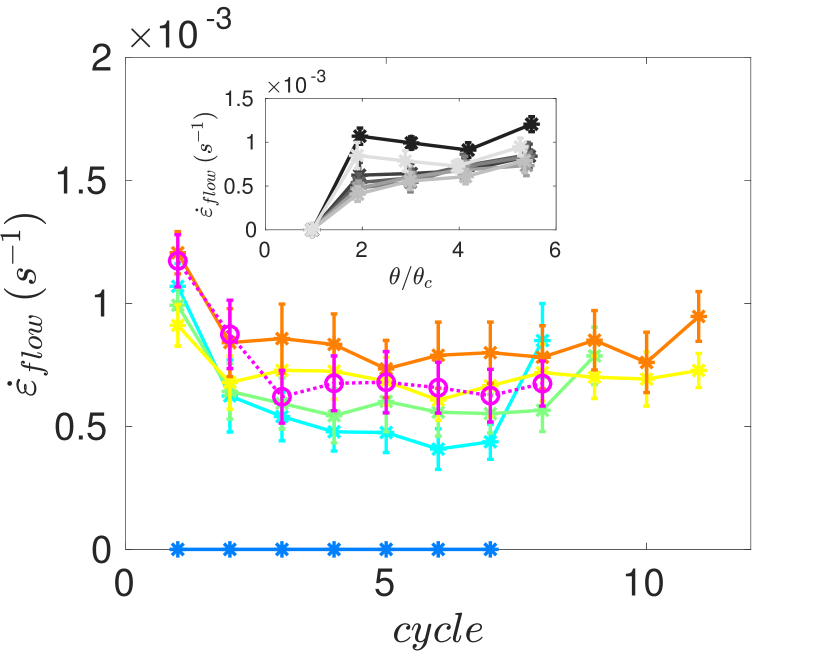
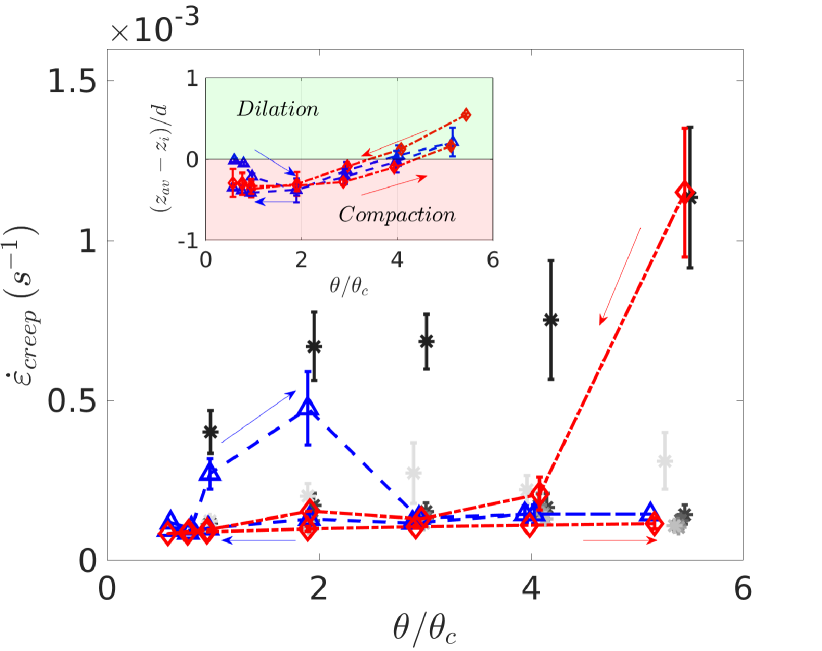
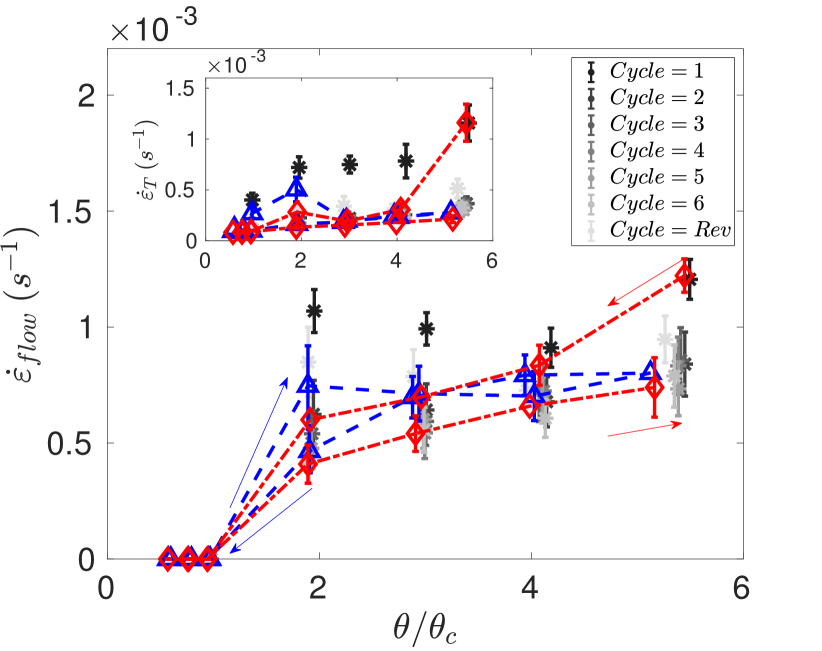
The above results reveal isotropic and anisotropic contributions to strain hardening, and that the latter may be erased by reversing flow. For uni-directional flows such as rivers, where shear reversal does not occur, these findings would lead us to expect only armored river beds. Clearly this is not the case; sufficiently large floods are known to break up armor and enhance sediment mobility [36]. It has been suggested that shear-induced dilation breaks up granular structures and weakens the bed [10, 25], but this idea needs more systematic study. We performed two experiments to examine the effects of changing shear-stress magnitude under constant direction. Both experiments began with the same preparation protocol as above (i.e., an initially loose bed), and imposed stress sweeps with 13 cycles of 10 min each over a range (0.6-5) (Fig. 12). In the first sweep () stress was increased then decreased, and in the second sweep () stress was decreased and then increased. For both experiments we observed net compaction of the bed for , and net dilation for larger stresses (Fig. 4). We also confirmed that particle mobility decreased with compaction, and increased with dilation (Fig. 4). We conclude, to first order, that dilation results from vigorous bed-load transport and acts to break up armoring, and compaction occurs under creep and weak bed load and forms armor.
The two stress sweeps, however, reveal a second-order history dependence. For , the first stress cycle at 0.6 initiated transient bed-load transport at the surface, that quickly died away. Small but measurable compaction occurred for sub-critical stress cycles as a consequence of creep, in agreement with [25]. Persistent bed-load transport began at the surface for , and compaction increased with increasing stress up to 2. Beyond this value, relative dilation occurred with increasing stress as the bed-load layer grew to consume more of the pack (Fig. 4(a)). On the downward stress sweep, significant hysteresis was observed for because the strain-hardened and compacted bed could not return to its pre-sheared condition. These patterns were reversed for the sweep (Fig. 4(b)). Starting from the highest stress the bed was more dilated relative to , presumably because creep-induced compaction had not occurred. Relative compaction and declining mobility commenced with decreasing stress. Strong hysteresis was observed on the return (upward) stress sweep for , where the strain-hardened and compacted bed suppressed dilation relative to the initial condition. These tests indicate that some memory of shear, in terms of strain hardening, exists even when applied stresses are . This memory is retained at depths that remain beneath the bed-load layer, and thus do not experience dilation; this implies that exceptionally large stresses capable of fluidizing the entire bed would be needed to erase all history of shear.
(a)
(b)
Compaction has long been known to cause stiffening of granular beds, due to increasing volume fraction that drives the system toward the jammed state [37]. The more recent recognition that materials may be driven towards jamming by shear, without any change in volume, has revealed the importance of anistropic grain fabric [31, 29, 32]. Both of these factors are relevant in sediment transport, and our experiments found that they contribute comparably to strain hardening of the bed. Our findings add to recent experimental evidence [25, 38] that creep is a primary driver of strain hardening and aging in granular beds. Creep may occur far below the entrainment threshold, and far beneath the bed-load layer. Interestingly, the separation between bed load and creep for an initially loose bed was not well defined (Fig. 12); the interface sharpened through time as a consequence of strain hardening. The emergence of a (more) mobile surface layer is reminiscent of granular heaps subject to tapping [38], and also of the “active layer” description of mobile bed materials in natural rivers [39]. Due to the self-organization of river channels to a near-threshold state, fluid stresses rarely exceed [40, 41]. We thus expect that most flows strain harden the bed, while only exceptional floods break up surface armoring. This is in qualitative agreement with river observations that document changes in the threshold of motion as a function of flood history [36, 12, 13]. Further progress in comparing experiments to nature should take into account: the importance of collisions in water [42, 8, 5], which are damped in our viscous system; and also the shape and size dispersion of natural grains, which we expect to influence the rate but not the style of creep and bed load [43, 21, 44].
F.D.C is grateful to FAPESP (Grants 2016/18189-0 and 2018/23838-3), E.M.F. to FAPESP (Grant 2018/14981-7), and P.A. and D.J.J. to ARO (Grant 579494) and NSF MRSEC (Grant 010401), for the financial support provided. We also thank B. Ferdowsi and C. Ortiz for initial help in running and analyzing experiments.
References
- Jerolmack and Daniels [2019] D. J. Jerolmack and K. E. Daniels, Viewing earth’s surface as a soft-matter landscape, Nature Reviews Physics , 1 (2019).
- Houssais et al. [2016] M. Houssais, C. P. Ortiz, D. J. Durian, and D. J. Jerolmack, Rheology of sediment transported by a laminar flow, Physical Review E 94, 062609 (2016).
- Clark et al. [2015] A. H. Clark, M. D. Shattuck, N. T. Ouellette, and C. S. O’Hern, Onset and cessation of motion in hydrodynamically sheared granular beds, Physical Review E 92, 042202 (2015).
- Houssais et al. [2015] M. Houssais, C. P. Ortiz, D. J. Durian, and D. J. Jerolmack, Onset of sediment transport is a continuous transition driven by fluid shear and granular creep, Nat. Commun. 6 (2015).
- Maurin et al. [2016] R. Maurin, J. Chauchat, and P. Frey, Dense granular flow rheology in turbulent bedload transport, Journal of Fluid Mechanics 804, 490 (2016).
- Pähtz and Durán [2018] T. Pähtz and O. Durán, Universal friction law at granular solid-gas transition explains scaling of sediment transport load with excess fluid shear stress, Physical Review Fluids 3, 104302 (2018).
- Allen and Kudrolli [2017] B. Allen and A. Kudrolli, Depth resolved granular transport driven by shearing fluid flow, Physical Review Fluids 2, 024304 (2017).
- Pähtz et al. [2020] T. Pähtz, A. H. Clark, M. Valyrakis, and O. Durán, The physics of sediment transport initiation, cessation, and entrainment across aeolian and fluvial environments, Rev. Geophys. 58, e2019RG000679 (2020).
- Raudkivi [1976] A. J. Raudkivi, Loose boundary hydraulics, 1st ed. (Pergamon Press, 1976).
- Charru et al. [2004] F. Charru, H. Mouilleron-Arnould, and O. Eiff, Erosion and deposition of particles on a bed sheared by a viscous flow, J. Fluid Mech. 519, 55 (2004).
- Clark et al. [2017] A. H. Clark, M. D. Shattuck, N. T. Ouellette, and C. S. O’Hern, Role of grain dynamics in determining the onset of sediment transport, Physical Review Fluids 2, 034305 (2017).
- Turowski et al. [2011] J. M. Turowski, A. Badoux, and D. Rickenmann, Start and end of bedload transport in gravel-bed streams, Geophysical Research Letters 38 (2011).
- Masteller et al. [2019] C. C. Masteller, N. J. Finnegan, J. M. Turowski, E. M. Yager, and D. Rickenmann, History-dependent threshold for motion revealed by continuous bedload transport measurements in a steep mountain stream., Geophys. Res. Lett. 46, 2583 (2019).
- Pretzlav et al. [2020] K. L. Pretzlav, J. P. Johnson, and D. N. Bradley, Smartrock transport in a mountain stream: bedload hysteresis and changing thresholds of motion, Water Resources Research , e2020WR028150 (2020).
- Mao et al. [2014] L. Mao, A. Dell’Agnese, C. Huincache, D. Penna, M. Engel, G. Niedrist, and F. Comiti, Bedload hysteresis in a glacier-fed mountain river, Earth Surface Processes and Landforms 39, 964 (2014).
- Roth et al. [2017] D. L. Roth, N. J. Finnegan, E. E. Brodsky, D. Rickenmann, J. M. Turowski, A. Badoux, and F. Gimbert, Bed load transport and boundary roughness changes as competing causes of hysteresis in the relationship between river discharge and seismic amplitude recorded near a steep mountain stream, Journal of Geophysical Research: Earth Surface 122, 1182 (2017).
- Masteller and Finnegan [2017] C. C. Masteller and N. J. Finnegan, Interplay between grain protrusion and sediment entrainment in an experimental flume, J. Geophys. Res. Earth Surf. 122, 274 (2017).
- [18] M. A. Hassan, M. Saletti, J. P. Johnson, C. Ferrer-Boix, J. G. Venditti, and M. Church, Experimental insights into the threshold of motion in alluvial channels: sediment supply and streambed state, Journal of Geophysical Research: Earth Surface , e2020JF005736.
- Dietrich et al. [1989] W. E. Dietrich, J. W. Kirchner, H. Ikeda, and F. Iseya, Sediment supply and the development of the coarse surface layer in gravel-bedded rivers, Nature 340, 215 (1989).
- Blom et al. [2006] A. Blom, G. Parker, J. S. Ribberink, and H. J. De Vriend, Vertical sorting and the morphodynamics of bed-form-dominated rivers: An equilibrium sorting model, Journal of Geophysical Research: Earth Surface 111 (2006).
- Ferdowsi et al. [2017] B. Ferdowsi, C. P. Ortiz, M. Houssais, and D. J. Jerolmack, River-bed armouring as a granular segregation phenomenon, Nature communications 8, 1 (2017).
- Parker et al. [1982] G. Parker, S. Dhamotharan, and H. Stefan, Model experiments on mobile, paved gravel bed streams, Water Resources Research 18, 1395 (1982).
- Yager et al. [2018] E. M. Yager, M. W. Schmeeckle, and A. Badoux, Resistance is not futile: Grain resistance controls on observed critical shields stress variations, Journal of Geophysical Research: Earth Surface 123, 3308 (2018).
- Prancevic and Lamb [2015] J. P. Prancevic and M. P. Lamb, Particle friction angles in steep mountain channels, Journal of Geophysical Research: Earth Surface 120, 242 (2015).
- Allen and Kudrolli [2018] B. Allen and A. Kudrolli, Granular bed consolidation, creep, and armoring under subcritical fluid flow, Phys. Rev. Fluids 3, 074305 (2018).
- Liu et al. [2016] D. Liu, X. Liu, X. Fu, and W. G., Quantification of the bed load effects on turbulent open-channel flows, J. Geophys. Res. Earth Surf. 121, 767 (2016).
- Keys et al. [2007] A. S. Keys, A. R. Abate, S. C. Glotzer, and D. J. Durian, Measurement of growing dynamical length scales and prediction of the jamming transition in a granular material, Nature physics 3, 260 (2007).
- Boyer et al. [2011] F. Boyer, É. Guazzelli, and O. Pouliquen, Unifying suspension and granular rheology, Physical review letters 107, 188301 (2011).
- Cates et al. [1998] M. E. Cates, J. P. Wittmer, J.-P. Bouchaud, and P. Claudin, Jamming, force chains, and fragile matter, Phys. Rev. Lett. 81, 1841 (1998).
- Majmudar and Behringer [2005] T. S. Majmudar and R. P. Behringer, Contact force measurements and stress-induced anisotropy in granular materials, Nature 435, 1079 (2005).
- Bi et al. [2011] D. Bi, J. Zhang, B. Chakraborty, and R. P. Behringer, Jamming by shear, Nature 480, 355 (2011).
- Behringer and Chakraborty [2018] R. P. Behringer and B. Chakraborty, The physics of jamming for granular materials: a review, Reports on Progress in Physics 82, 012601 (2018).
- Keim et al. [2019] N. C. Keim, J. D. Paulsen, Z. Zeravcic, S. Sastry, and S. R. Nagel, Memory formation in matter, Rev. Mod. Phys. 91, 035002 (2019).
- Yang et al. [2021] M. Yang, M. Taiebat, P. Mutabaruka, and F. Radjaï, Evolution of granular media under constant-volume multidirectional cyclic shearing, Acta Geotechnica , 1 (2021).
- [35] See Supplemental Material at [URL to be inserted by publisher] for a description of the experimental device, of the procedure for obtaining the strains, additional graphics for the remaining experimental data, and movies showing the motion of grains within the granular bed. .
- Vericat et al. [2006] D. Vericat, R. J. Batalla, and C. Garcia, Breakup and reestablishment of the armour layer in a large gravel-bed river below dams: The lower ebro, Geomorphology 76, 122 (2006).
- Richard et al. [2005] P. Richard, M. Nicodemi, R. Delannay, P. Ribiere, and D. Bideau, Slow relaxation and compaction of granular systems, Nature materials 4, 121 (2005).
- Deshpande et al. [2021] N. Deshpande, D. Furbish, P. Arratia, and D. Jerolmack, The perpetual fragility of creeping hillslopes, Nat. Commun. 12 (2021).
- Church and Haschenburger [2017] M. Church and J. Haschenburger, What is the “active layer”?, Water Resources Research 53, 5 (2017).
- Phillips and Jerolmack [2016] C. B. Phillips and D. J. Jerolmack, Self-organization of river channels as a critical filter on climate signals, Science 352, 694 (2016).
- Phillips and Jerolmack [2019] C. Phillips and D. Jerolmack, Bankfull transport capacity and the threshold of motion in coarse-grained rivers, Water Resources Research (2019).
- Pähtz and Durán [2017] T. Pähtz and O. Durán, Fluid forces or impacts: What governs the entrainment of soil particles in sediment transport mediated by a newtonian fluid?, Phys. Rev. Fluids 2, 074303 (2017).
- Komatsu et al. [2001] T. S. Komatsu, S. Inagaki, N. Nakagawa, and S. Nasuno, Creep motion in a granular pile exhibiting steady surface flow, Physical review letters 86, 1757 (2001).
- Gomez [1994] B. Gomez, Effects of particle shape and mobility on stable armor development, Water Resources Research 30, 2229 (1994).
SUPPLEMENTAL MATERIAL: Strain hardening by sediment transport
I Abstract
This file contains supplementary information of two general types: additional detail on experimental techniques and analytical methods; and supplementary data figures that support the conclusions reported in the main text. We describe and illustrate how experimental quantities such as particle velocity, concentration, and strain were derived from raw images — the principle data product of our study. We then present results of strain hardening and hysteresis for a variety of experiments, showing how our findings are qualitatively similar to those described in the main text under a range of conditions. Finally, this file includes a table showing all experimental conditions explored in the study.
II Determining particle velocity and volume fraction
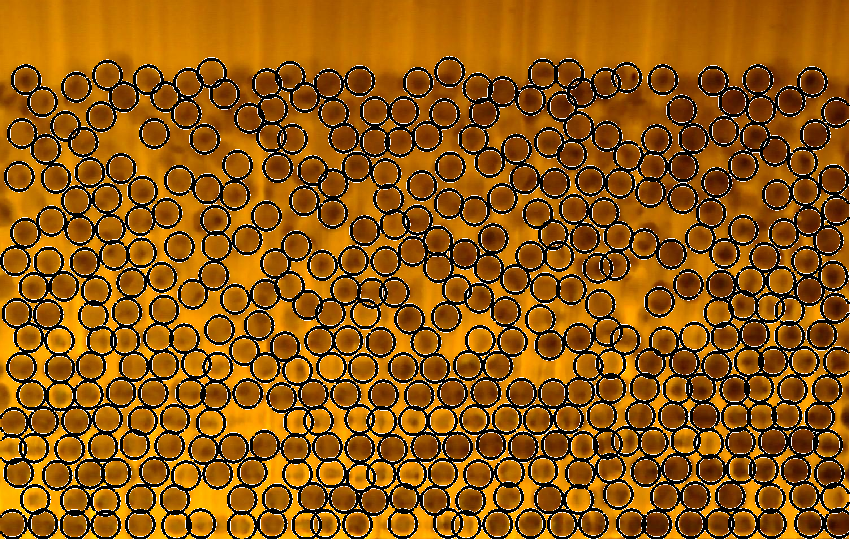
We examined a region of the sediment bed that is 1920 px in the horizontal (x) direction and 960 px in the vertical () direction, corresponding to 48.5 mm 24.23 mm. Images were obtained at the channel centerline (Fig. 5 (a)) at a rate of 60 Hz. We first computed spatially-resolved (two-dimensional, 2D) “instantaneous” velocity measurements from successive image pairs by performing Particle Image Velocimetry (PIV) using PIV-LAB [1,2], with an interrogation area of 64 px 64 px and an overlap of 50. This corresponds to 602 interrogation areas, and a spatial resolution of 0.8 mm 0.8 mm. Figure 5 shows an example of the obtained velocities for the region of interest. Average profiles of velocity with depth, determined for each stress cycle, were then computed by averaging all instantaneous velocity measurements and then time-averaging all values over the 10-min duration of a stress cycle (Fig. 5).
To estimate the particle volume fraction in 2D, we first detected all particles in each image using the method presented by Houssais et al. [3]. Profiles of 2D volume (area) fraction for each depth were then computed from the area occupied by the detected particles in each strip, averaged in time over the duration of each stress cycle.
III Determining strain and strain rate
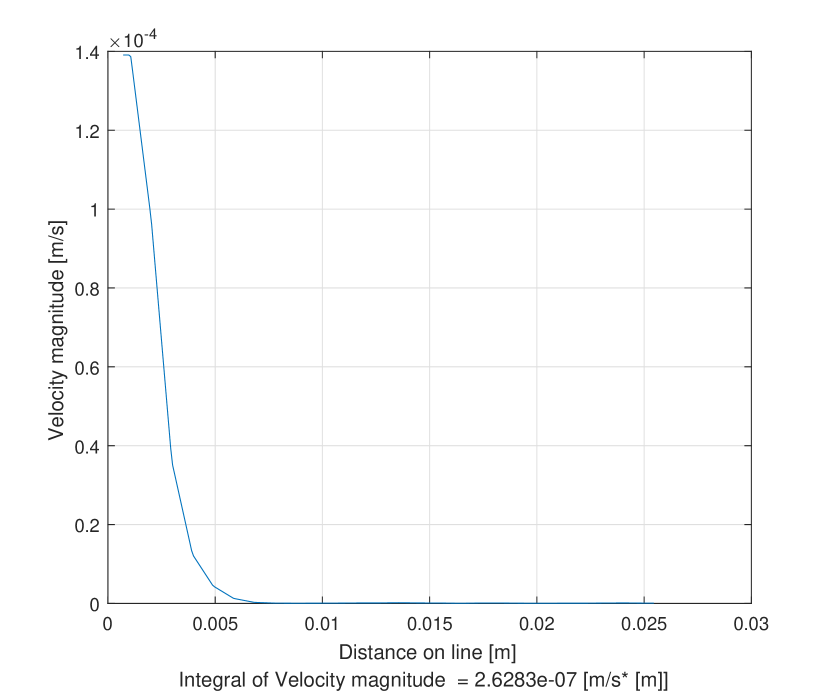
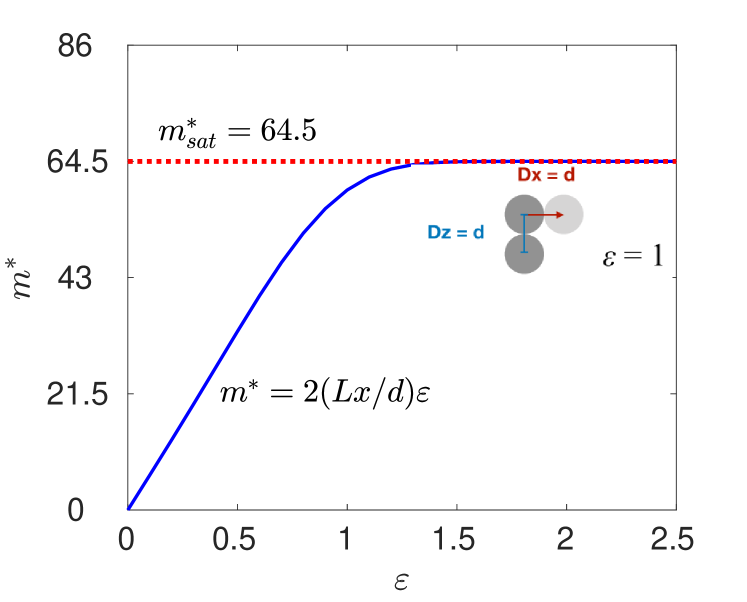
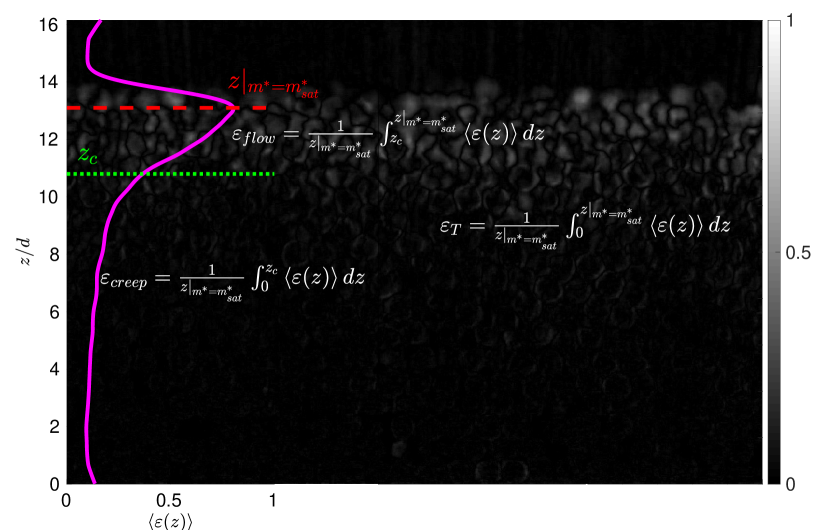
Strain was determined for each pixel in the area of interest of a fixed duration of the stress cycle, . We examined the change in pixel intensity inside image strips of width and height , a quantity we call mobility []. If one particle of diameter moves laterally in that strip over a distance – which corresponds to the case where the strain – then []. In the case of particles in a dense configuration that move along a strip of lateral size , it should be the case that . We now define the dimensionless parameter , where is the resolution [m/pxl] in the image. For the case of one particle exhibiting , . For the case of particles in the dense configuration described above, . This case is the largest deformation that can be monitored by measuring pxl change; when , some particle displacement is not captured. We therefore determine a saturation value of the mobility measurement as ; for our images, (Fig. 7).
Using the time-averaged concentration profile , we define the local and time-averaged measurement of strain, over a duration , and for , as:
| (1) |
where [] comes from the absolute difference between two images. To obtain the profiles at each time step, we compared the first image of each cycle with the next ones until , i.e., .
The average strain value in the creep regime is given by the expression:
| (2) |
where is the depth associated with the kink in the mean velocity profile, that separates the creep and dense-flow regimes [3]. The average strain value in the flowing regime is given by:
| (3) |
where is the depth of the bed where reaches . Finally, the total average strain follows the expression:
| (4) |
References
[1] W. Thielicke and E. Stamhuis, Pivlab–towards user-friendly, affordable and accurate digital particle image velocimetry in matlab, Journal of open research software 2 (2014).
[2] W. Thielicke, The flapping flight of birds, Diss. University of Groningen (2014).
[3] M. Houssais, C. P. Ortiz, D. J. Durian, and D. J. Jerolmack, Onset of sediment transport is a continuous transition driven by fluid shear and granular creep, Nat. Commun. 6 (2015).
IV Supplementary Figures
 |
| (a) |
 |
| (b) |
 |
| (a) |
 |
| (b) |
 |
| (a) |
 |
| (b) |
| Test | number of cycles | preparation | cycles | last cycle | ||
|---|---|---|---|---|---|---|
| Same direction | Same direction | Reversed direction | ||||
| Same direction | Same direction | Reversed direction | ||||
| Same direction | Same direction | Reversed direction | ||||
| Same direction | Same direction | Reversed direction | ||||
| Same direction | Same direction | Reversed direction | ||||
| Same direction | Same direction | Same direction | ||||
| Reversed direction | Same direction | Reverse | ||||
| Same direction | Alternating direction | Reverse | ||||
| Same direction | Same direction | Same direction | ||||
| Same direction | Same direction | Same direction |