Exposure of occupations to technologies of the fourth industrial revolution
Abstract
The fourth industrial revolution (4IR) is likely to have a substantial impact on the economy. Companies need to build up capabilities to implement new technologies, and automation may make some occupations obsolete. However, where, when, and how the change will happen remain to be determined. Robust empirical indicators of technological progress linked to occupations can help to illuminate this change. With this aim, we provide such an indicator based on patent data. Using natural language processing, we calculate patent exposure scores for more than 900 occupations, which represent the technological progress related to them. To provide a lens on the impact of the 4IR, we differentiate between traditional and 4IR patent exposure. Our method differs from previous approaches in that it both accounts for the diversity of task-level patent exposures within an occupation and reflects work activities more accurately. We find that exposure to 4IR patents differs from traditional patent exposure. Manual tasks, and accordingly occupations such as construction and production, are exposed mainly to traditional (non-4IR) patents but have low exposure to 4IR patents. The analysis suggests that 4IR technologies may have a negative impact on job growth; this impact appears 10 to 20 years after patent filing. Researchers could validate our findings through further analyses with micro data, and our dataset can serve as a source for more complex labor market analyses. Further, we compared the 4IR exposure to other automation and AI exposure scores. Whereas many measures refer to theoretical automation potential, our patent-based indicator reflects actual technology diffusion. We show that a combination of 4IR exposure with other automation measures may provide additional insights. For example, near-term automation might be driven by non-4IR technologies. Our work not only allows analyses of the impact of 4IR technologies as a whole, but also provides exposure scores for more than 300 technology fields, such as AI and smart office technologies. Finally, the work provides a general mapping of patents to tasks and occupations, which enables future researchers to construct individual exposure measures.
keywords:
technology exposure , fourth industrial revolution , occupational tasks , patent occupation mapping , natural language processing1 Introduction
Technological progress continuously impacts the economic environment. The current wave of technological progress is driven by digitalization and the adoption of artificial intelligence (AI), and is often referred to as the fourth industrial revolution. AI might enable machines to become increasingly able to perform tasks that previously only humans could perform. Whereas previously machines were mainly able to perform clearly defined, repetitive, routine tasks [Acemoglu & Autor, 2011], future automation might cover much more diverse tasks, for example, some requiring emotional intelligence [Brynjolfsson & Mitchell, 2017]. These new automation patterns create fears of machines making workers obsolete and creating unemployment. However, technological change has various effects on the labor market, and previous waves of automation did not result in long-lasting technology-induced rising unemployment [Mokyr et al., 2015, Autor, 2015, Bessen, 2019].
Acemoglu & Restrepo [2019] observe that automation not only decreases labor demand but also has a productivity effect, which increases labor demand. Further, they describe the reinstatement effect, where automation leads to newly-created tasks carried out by humans. The relative size of these effects and their interaction determine the overall effect of automation on the labor market. Therefore, automation causes changes in the task content of occupations due to lower demand for some tasks, higher demand for remaining tasks, and the creation of new tasks.
To evaluate these effects and prepare for future shifts in the labor market, researchers, e.g., Frey & Osborne [2017] and Brynjolfsson & Mitchell [2017], construct measures of automation potential of occupations. These measures can provide valuable insights for future research in terms of overall automation potential. Our approach does not aspire to predict the share of automated jobs, but aims to reflect actual technology maturity (diffusion), which is not covered by the aforementioned indicators Arntz et al. [2020]. For example, scores by Brynjolfsson & Mitchell [2017] are based on expert assessments of “what can machine learning do?” We use patent data as an indicator for technological progress; patents actually document what existing technology can currently do. The McKinsey Global Institute follows a similar objective and focuses on what actual automation might look like until 2030, acknowledging that there is a much higher automation potential in the long term [Manyika et al., 2017]. They provide estimates of automation potentials per occupation, which they expect to be implemented until 2030.
Linking patent data to occupation activities offers a direct indicator of the exposure of occupations to technology. There exist patent occupation mappings at an industry [Silverman, 2002] and occupation level [Kogan et al., 2020, Webb, 2019] which have been used for economic analyses [Mann & Püttmann, 2017, Acemoglu et al., 2020]. Webb [2019] found, for example, that exposure to previous automation technologies had a negative impact on employment at an occupation level, and Mann & Püttmann [2017] identified an overall positive impact of automation patents on employment.
We build on the approach of Kogan et al. [2020] and refine for improved accuracy and to account for task-level differences. Each occupation relates to several tasks, and technology exposure may vary among different tasks within an occupation [Brynjolfsson & Mitchell, 2017]. The task level, as the “unit of work that produces output,” is a highly insightful level of detail for evaluating the impact of technologies on jobs [Acemoglu & Autor, 2011]. Our approach has two main benefits. On the one hand, it allows accounting for a specific technology exposure for each task, which is ignored when looking at occupations as a whole. On the other hand, our task-level approach increases the accuracy of the mapping, as it identifies patents specific to each activity, rather than patents which have many words in common with the overall occupation description. For example, our approach might avoid associating a robot engineer mainly with robot patents in general (e.g., improved efficiency of assembly robots), but rather with patents which describe innovations that help to “plan robot path”, “debug robot programs”, and “maintain robots.” Further, we introduce a measure of technology exposure; we therefore differentiate between technologies of the fourth industrial revolution (4IR patents) and other patents (non-4IR patents) for creating technology exposure scores. These scores indicate patent exposure at the task and occupation level. Our analysis includes patent data since 1970 and thus allows us to review developments over time, e.g., when 4IR technologies have been developed and how long it takes them to impact the labor market.
Various researchers identify the lack of high-quality data on technological progress of key 4IR technologies as a key barrier to better understanding the impact of those technologies on the workforce [Frank et al., 2019b, Mitchell & Brynjolfsson, 2017]. With this article, we address this issue by providing a mapping of patents to occupational tasks and introducing a 4IR technology exposure score per occupation.
2 Patents as an indicator for technological change
Several studies build on patent data as an indicator of technological progress or innovative activity. Silverman [2002], for example, create a concordance table of technologies used and produced per industry to analyze the impact of technological resources on corporate diversification. The work builds on manually-annotated patent data from the Canadian patent office. Mann & Püttmann [2017], for example, build on this dataset, to evaluate the effects of automation technologies per sector of use. The dataset is generally interesting but builds on data from 1990–1993 and only provides a patent category-to-industry mapping. Therefore, it is not suitable for a fine-grained mapping of patents to occupations, particularly for newer technologies.
Additionally, Dechezleprêtre et al. [2020] use patent data to evaluate the relation of wages and automation innovations. They focus on advanced manufacturing patents, as defined by Aschhoff et al. [2010] combined with their own patent search terms. They link those patents to industry sectors according to a concordance table provided by Lybbert & Zolas [2014]. This patent-industry mapping is based on industry-specific terms. The mapping does not account for activities conducted by workers within industries; for example, industry descriptions contain terms related to the output, e.g., “manufacture cars,” and not the task, such as “cut sheet metal.”
Webb [2019] proposed an approach to link patent data more directly to occupations. He extracts verb-noun pairs from patent titles and task descriptions, and uses those as a basis for mapping. For example, if a doctor’s task is “diagnose a patient’s condition,” the verb-noun pair is “diagnose condition.” The analysis thus aims to identify patents describing similar actions as task descriptions. Similar tasks can be described with different words, e.g., “diagnose condition” may be very similar to “diagnose disease.” Webb overcomes this challenge by using word hierarchies to identify more general words for the matching (higher-level terms per word). The previous examples would both become “diagnose state.”
Kogan et al. [2020] also uses natural language processing for calculating similarity scores of patents and occupation descriptions. Instead of relying on word hierarchy information, they use text embeddings. They represent words through vectors, which are trained on large amounts of text data. Words that are more similar are represented as vectors that are more similar. For example, “king” minus “man” plus “woman” leads to a vector similar to “queen.” Word vectors allow the calculation of similarity scores of words, and a more fine-grained differentiation is possible. Further, the approach does not rely only on verb-noun pairs (such as Webb 2019), but on the full-text data. This enables the approach to account better for context descriptions. For example, it differentiates between “diagnose patients condition” and “diagnose machine condition.”
We aim to build on this general idea of mapping patent data to occupations through text embedding, while implementing the mapping at a task level. This has two key advantages. First, Kogan et al. [2020] use task descriptions for an occupation and combine them into one text. They compare this block of text with patent texts to identify the most relevant patents. However, technology exposure may vary for different tasks within an occupation [Brynjolfsson & Mitchell, 2017]. Therefore, the task level, as the “unit of work that produces output,” is a highly insightful level of detail for evaluating the impact of technologies on jobs [Acemoglu & Autor, 2011]. For example, a robot technician does “attach wires between controllers,” and “develop robotic path motions.” The tasks are very different and probably have exposure to different technologies. Second, the occupation-level approach has a chance of identifying general context patents, ignoring the broad range of patents related to the different activities of an occupation. For example, a barber performs tasks such as “clean and sterilize scissors,” “recommend and sell lotions,” and “shampoo hair.” Stringing together all task descriptions of a barber will lead to a text with many words such as shampoo, hair, and lotion. Therefore, it is likely that there is a high similarity score to patents describing hair care products. Looking at task statements independently accounts better for words describing the actual activity and identifies patents related to the activity itself, e.g., sell lotions. Further, if there are many tasks related to general activities, such as working with hair, and few tasks related to secondary activities, such as bookkeeping, the occupation level search is likely to ignore the secondary activities.
3 Mapping patents to occupations
To map occupations to patents, we compare task descriptions with patent abstracts. Therefore, we use natural language processing methods. Figure 1 provides an overview of the approach.
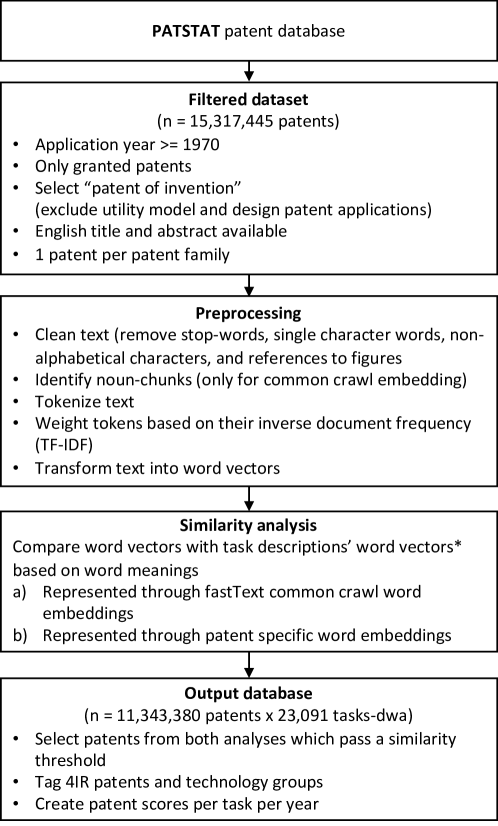
* We conducted a similar preprocessing for task descriptions.
3.1 Data
We compare patent texts with descriptions of activities conducted in an occupation. We build on occupation descriptions from O*NET, which describes each occupation as 20 to 40 tasks (more than 20k tasks). This approach helps to identify the most relevant patents per occupation and occupational task. All task descriptions contain information about the activity conducted. Also, some task descriptions contain information about the tools and technologies used. We focus on activities only, and thus remove references to tools used. For example, for the task “Monitor geothermal operations, using programmable logic controllers,” we would remove “using programmable logic controllers.” This ensures that the search includes all patents related to monitoring geothermal operations, independently of the technology they use.
Our analysis builds on the PATSTAT patent dataset. We include all patents since 1970 with an English abstract in our analysis. Identical patents registered in multiple patent offices share a common patent family ID. We only select one patent per family to avoid double counting. For each patent family, we choose patents in the following order: preferably we use USPTO patents and those of other English-speaking countries’ patent offices, followed by WIPO and EPO patents. For the task similarity scores we rely on patent abstracts. Abstracts are highly suitable for this task and comprise the densest information on inventions Benzineb & Guyot. Our dataset includes 15,317,445 patents filed between 1970 and 2020. Figure 11 shows that the number of patents increased until 2013, then sharply decreased, particularly after 2017. The recent decline is due to the time lag between the filing date and publication in the PATSTAT database. Further, the total number of patents decreased in 1976, 1991-1992, and in 2004. Due to the substantial decline in patents after 2015, our analysis offers its most valuable insights from 1970 to 2015.
3.2 Patent task similarity scores
We identify the most relevant patents per task by comparing the texts of task descriptions and patent abstracts. Our algorithm builds on word embeddings, where multidimensional word vectors represent words. Vector representation identifies text similarity, even if there are no words in common. A similar approach has been used by Kogan et al. [2020], who map patent texts to occupation descriptions. The approach yields the best results when the queries comprise at least a few sentences. For very short queries (such as task statements), there is a risk that single words bias the results. For example, the task “Develop engineering specifications or cost estimates for automotive design concepts” describes the activity (cost estimates) and the context (automotive design). There is a risk that results may include patents only related to the context, if there is a high word overlap, e.g., a patent describing “cost-efficient automotive design.” We try to avoid a bias towards the context, and combine task statements that describe similar activities for our queries. Therefore, we build the O*Net dataset, which clusters task statements into 2067 “detailed work activities” (DWAs), such as “estimate operational costs.” The DWA “estimate operational costs” includes tasks: the tasks mentioned above, for example, as well as the task “analyze, estimate, or report production costs.” On the one hand, combining both statements increases the weight of the activity (cost estimation), as this is common in all task statements. On the other hand, combining these statements reduces the weight of the context (automotive design), as many tasks describe a slightly different context. The different context words are valuable for narrowing the broader scope of the activity. In this case, the context relates to (cost estimation in) a production-related setting and, e.g., is not related to software development or services. For our queries, we combine all tasks related to one DWA. We create a unique query for each task by over-sampling its task statement and thus giving higher weights to the actual task description.
In order to work with the text data, we conduct some preprocessing steps. We remove expressions in brackets from patent abstracts, such as numeric references or abbreviations, which do not add relevant information for comparison with task descriptions. Further, we remove non-alphanumeric characters and single-character expressions. Also, we remove stop words, which are frequent words, such as “is” or “and”, and which do not add much information to the text. Using only the most relevant words per text is commonly performed to increase accuracy when working with text. Finally, we transform all characters to lower case.
We transform text data for analysis in three steps. First, we count word frequencies per document and weigh the frequency with the word frequencies across all texts. This method is called text frequency-inverse document frequency (TF-IDF). TF-IDF assigns higher weights to infrequent words, emphasizing those words that are most specific for a document. Second, we create a word similarity matrix using word embeddings. Word embeddings are created based on large corpora, where algorithms assign vectors based on word relations to neighboring words. Those word vectors represent the meaning of words and allow for comparisons and calculation of text, without relying on the presence of similar words. In our example, word vectors enable the identification of a similarity, e.g., for “steer a car” and “drive the vehicle,” even though there are no common words. Third, we calculate similarity scores for each patent task combination using TF-IDF scores and the word similarity matrix. This leads to a task-patent similarity matrix of 23,091 task-DWA combinations and 15,317,445 patents, with similarity scores ranging from 0 to 1, with 1 representing similar documents. We reduce the matrix size for faster processing by setting irrelevant scores below a certain threshold (see below) to zero.
We conduct this approach with two different word embedding algorithms to account for patent-specific terms and general language, and identify a high number of relevant documents. On the one hand, we use fastText word embedding, which has been trained on 600 billion tokens (words) from the common crawl corpus111https://commoncrawl.org/ [Mikolov et al., 2018]. The embedding provides 300-dimensional vectors for around 2 million words, n-grams (combinations of words), and sub-words (parts of words, which can be used to construct vectors for unknown words). The common crawl corpus comprises texts from various sources available on the web, and therefore the embeddings represent various aspects of language. However, the structure and words used in patent data are more technical than standard language. This leads to noise in our results when we compare task descriptions and patents. We only consider patents related to a task if the similarity score is above a certain threshold. The mean similarity score is 0.020, and many highly relevant patents are in the long tail of higher relevance scores. Manual review shows that above a threshold of 0.197, or 9 standard deviations above the mean, there is a high density of relevant patents. With this approach, we identify hundreds of relevant patents per task.
We repeat the approach with another word embedding, which has been trained on five million patents (over 38 billion tokens) [Risch & Krestel, 2019]. This embedding accounts for patent-specific language. It therefore helps to identify patents which use unusual words and would not have been identified though the common language approach. In turn, it has a higher noise caused by the language used in task descriptions, which is not necessarily similar to patent language. Similarly to the other embedding, the threshold value of nine standard deviations above the mean (0.170) proves to be a practical cutoff value to exclude most of the irrelevant patents.
On the one hand, combining both approaches allows us to sustain a high cutoff value and thus reduce noise through irrelevant patents. On the other hand, both searches complement each other and increase the overall number of patents mapped to tasks. We find that both approaches show identical overall results patterns. For example, both embeddings lead to a similar distribution of patents per task category (see B for detailed evaluation results). These identical patterns indicate that the approach is robust enough to ensure that the choice of word embedding did not systematically bias the results. Simultaneously, relying on both word embeddings significantly contributed to covering a broad range of patents and enabled the mapping of 75% of patents in our sample to at least one task.
We also conducted our analysis with cutoff values of ten and twelve standard deviations. Those additional analyses showed a similar evolution of number of patents per year and similar distribution patterns of total patent exposure across occupations. This suggests that the nine standard deviation cutoff value is sufficient, and higher cutoff values do not change the mapping significantly. Each standard deviation of higher cutoff value reduced the total coverage of patents associated with tasks by around 10 percent; we therefore choose to conduct our analysis with the nine standard deviation cutoff value.
3.3 Patents of the fourth industrial revolution
The current wave of digitization is often described as the fourth industrial revolution (4IR). Kagermann et al. [2013] describe the 4IR as merging physical and virtual environments into cyber-physical systems. Since then, a large amount of research has evolved in this area. Several definitions exist and the literature frequently describes the Internet of Things as the core of the 4IR, as it enables smart technologies to transform traditional enterprises [Meindl et al., 2021]. Similarly, Ménière et al. [2020] describe the 4IR as the “full integration of information and communication technologies (ICT) in the context of manufacturing and application areas such as personal, home, vehicle, enterprise and infrastructure […] towards a fully data-driven economy.” Ménière et al. build on this definition and leverage the expertise from the European Patent Office (EPO) to identify patents related to the 4IR across 350 4IR technology fields.
Ménière et al. describe technology fields along two dimensions. First, they describe application domains, such as “healthcare” and “industrial.” Their second dimension describes technologies, such as “software”, “connectivity”, and “core AI”222They identify three core technology fields, IT hardware, software, and connectivity, as well as eight enabling technology fields, including data management, user interfaces, core AI, geo-positioning, power supply, data security, safety, three-dimensional support systems. Application domains include consumer goods, home, vehicles, services, industrial, infrastructure, healthcare, and agriculture. For each of the fields, they identify multiple ranges of patent classification classes, describing these technologies. Each patent is assigned to at least one classification. We consider a patent to be a 4IR patent if any of its classifications falls within one of the 4IR classifications defined by Ménière et al. [2020].
3.4 Aggregation of results
In the following sections, various analyses refer to the aggregated number of patents, e.g., average patents per task related to an occupation. When an aggregating task counts to activity or occupation counts, we use log values. This allows us to minimize the impact of outliers, i.e., tasks with a very high number of associated patents, and reflects whether there are generally many tasks with high or low patent counts. For aggregation by occupation cluster, we first aggregate at an occupation level and next on a cluster level to avoid bias through the number of tasks per occupation. When aggregating task data, we weight the task scores with the task importance score for an occupation, as provided by O*Net, ranging from above 0 to 1. This leads to less important tasks having less impact on an occupation’s exposure score. A similar approach has been followed by Brynjolfsson & Mitchell [2017] when calculating SML scores for occupation.
Acemoglu & Autor [2011] provide a classification of six task types (e.g., routine manual, cognitive analytical), based on work activity and work context variables, as described by O*Net. We apply their categorization in order to assign task types to each tasks. To do so, we link those variables to task descriptions as follows. The work activity descriptions, e.g., “4.A.2.a.4 Analyzing data/information” map directly to detailed work activities and thus to task descriptions. The work context variables, e.g., “4.C.3.b.7 Importance of repeating the same tasks” map to both skills and abilities, both of which map to work activities. Therefore, we map work context variables via the intermediate variables skills and abilities to the task descriptions. We calculate z-scores per measure and aggregate those for each task category. For the analysis, we associate all tasks with a positive z-score to a category, which may lead to some tasks being associated with more than one category.
4 Patent task mapping results
The previous section identifies a mapping that shows the most relevant patents for each occupational task. Overall, our analysis associates 11,343,380 patents to tasks, thus 74% of all patents in our dataset are associated with tasks. Not all technology clusters are equally present in our results. On the one hand, chemistry or biotechnology patents only map to few occupations, which is not surprising, as those inventions mostly do not describe activities, but rather formulas or materials. On the other hand, computer technology and IT methods for management patents are highly relevant for many tasks.
To evaluate the quality of the patent-task mapping, we manually investigate the relevance of patents with a high similarity score. Table 1 shows some example tasks and patents.
| Similarity | Patent title |
|---|---|
| Operate diagnostic or therapeutic medical instruments or equipment: Assemble and use equipment, such as catheters, tracheotomy tubes, or oxygen suppliers. | |
| 0.42 | Fast trachea incising device |
| 0.40 | Device and method for electrocardiography on freely moving animals |
| 0.38 | Method and apparatus for weaning ventilator-dependent patients |
| 0.38 | Method and apparatus for weaning ventilator-dependent patients |
| 0.37 | Devices, systems and methods for using and monitoring tubes in body passageways |
| Prepare scientific or technical reports or presentations: Write up or orally communicate research findings to the scientific community, producers, and the public. | |
| 0.52 | Research product automatic register service method and system |
| 0.48 | System and method for medical image interpretation |
| 0.47 | Research collection and retention system |
| 0.46 | Method and apparatus for the design and analysis of market research studies |
| 0.45 | A System for Joint Research on the Internet |
| Evaluate quality of materials or products: Perform visual inspections of finished products. | |
| 0.40 | Mobile unit for express-control of oil products characteristics |
| 0.40 | Automatic monitoring method for coated products and fabrication process |
| 0.38 | Method and apparatus for inspecting manufactured products for defects in response to in-situ monitoring |
| 0.37 | Automatic quality inspection method, device and system |
| 0.37 | Optical fiber sensing system consistency test method |
Note: Multicolumn lines include detailed work activities (bold) and task descriptions. Our approach maps patents not only based on the actual task description, but includes information from detailed work activities. Two different word embedding methods have been used; the table includes the average similarity score of both embeddings.
The example results indicate a good match of task descriptions and patent results. Our analysis is conducted at a task level and also contains information on other tasks within the same detailed work activity (DWA). Therefore, the results may include patents not directly related to the task but capturing the activity described by the DWA.
C provides additional information on the presence of patents per technology field and task type. In the following section, we review patent task mapping quality, task exposure scores, and evolution over time.
4.1 Patents over time
Figure 2 shows the mean number of patents associated per task, per year. The mean number of patents per task increased over time, mostly in line with the overall number of patents in our sample. An exception is the period between 2000 and 2004, where the number of patents per task remained nearly constant, whereas the total number of patents in our raw data decreased only in 2004 and otherwise increased. Another plateau is in the years before 2008, with a substantial increase after that, whereas the curve of the total number of patents in our raw data is more smooth. Finally, the overall number of patents declined in recent years. This is because not all of these patent applications have yet been published in the PATSTAT dataset (see Figure 11 for total patents in our dataset).
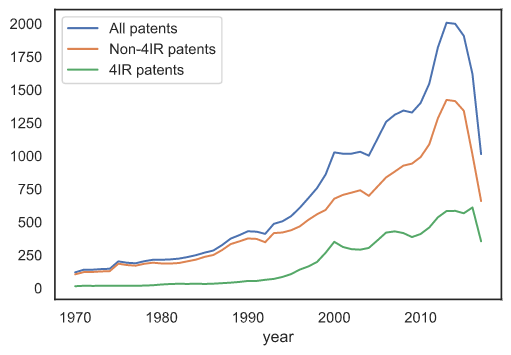
Ménière et al. [2020] identify technologies of the fourth industrial revolution, which include, e.g., virtual reality, machine learning algorithms, and 3D modeling software. Some of those patents already existed decades ago, e.g., machine learning is a technology introduced decades ago, but which reached market maturity only recently. We compare overall patent exposure to 4IR patents with general exposure. Our findings show that exposure to Industry 4.0 patents grew more than overall exposure to patents. Our findings indicate that 4IR patents drove the strong growth in patents between 1990 and 2000. The share of Industry 4.0 patents of all patents in the results is 29%, ranging from 12% in 1976 to 38% in 2016. A drop in Industry 4.0 patents after the year 2000 also explains the plateau of overall patents per task, whereas the number of non-Industry 4.0 patents continued its constant growth. Interestingly, other research articles also observe this change in patenting behavior. Kelly et al. [2020], for example, identify “breakthrough patents”, which relate to novel technologies and differ in text content from previous patents. They observe a strong rise of breakthrough patents between 1980 and 2000, with a steep drop afterwards.
4.2 Patents per task
Most of the 11 million patents in our results map to multiple tasks. On the one hand, task descriptions share similar content, and DWA-level information forms part of the search queries, which leads to a patent being likely to be mapped to multiple patents within a DWA. On the other hand, a patent may describe an invention which is relevant for different tasks. Figure 3(a) shows the frequency of patents in our results. The x-axis indicates how many tasks a patent is associated with (out of more than 23,000 tasks). Most patents relate to around 30 to 60 unique task/DWA combinations.

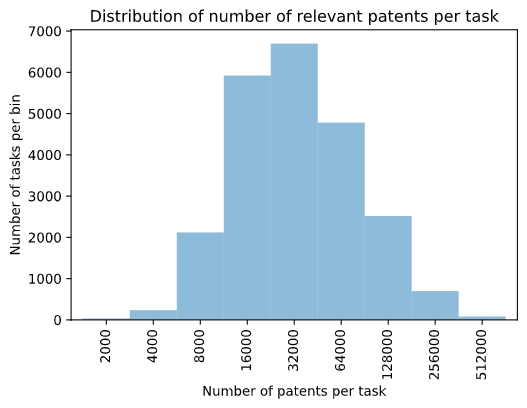
Next, we look into the differences of relevant patents per task. Figure 3(b) shows that the number of patents per tasks ranges from around 2,000 to more than 500,000 patents. The distribution of the number of patents per tasks is log-normal, with most tasks associated to 32,000 patents. To account for the logarithmic distribution of patents per task, we use the logarithm of the number of patents for further analysis, where we aggregate numbers of patent per task, to avoid bias through tasks with high numbers of patents. Tasks with the lowest number of relevant patents are related to the activities “prepare operational budgets for green energy or other green operations,” “collaborate with others to determine technical details of productions,” and “manage budgets for personal services operations.” Tasks with the highest number of relevant patents are related to the activities “thread wire or cable through ducts or conduits,” “record research or operational data,” and “prepare data for analysis.”
4.3 Evaluation per task type
To better understand the patent exposure of tasks over time, we categorize tasks into six different task types (e.g., routine, physical, cognitive), based on the classification provided by Acemoglu & Autor [2011]. Our analysis provides a patent count per task and year. For each task, we evaluate the number of patents over time. We aggregate the log number of patents per task type to see the overall evolution of patents per task type. 4 shows the evolution of patents over time.
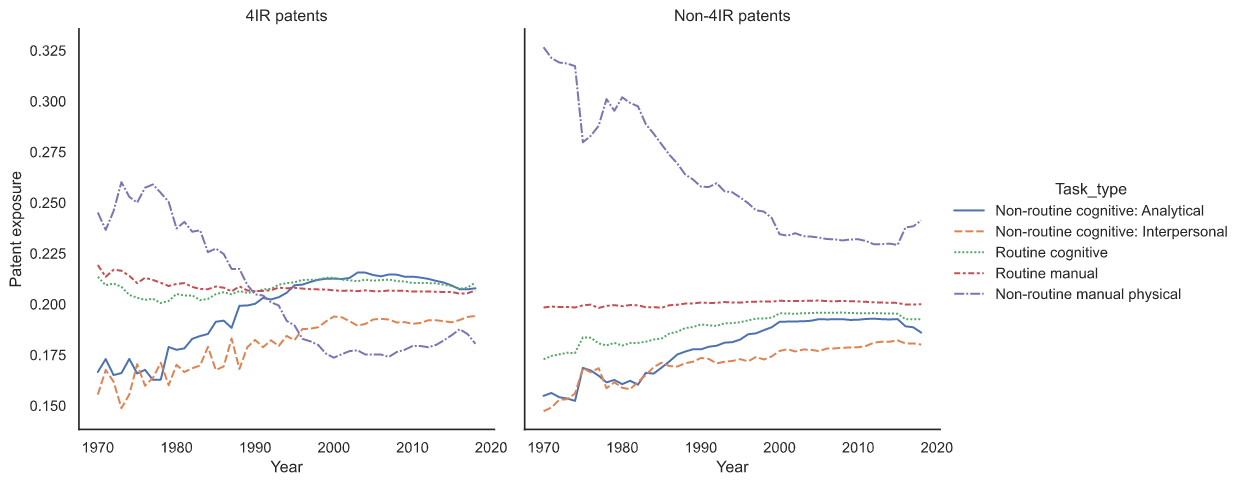
Section 4.1 showed that there is a strong growth in the overall number of patents (for all task types); this section shows each task type’s share of total patent exposure per year. Non-routine manual tasks have the highest number of related patents, but with the rise of 4IR technologies their share of total patents decreased. They have the lowest exposure to 4IR patents. In contrast, analytical tasks experienced a strong growth in patent exposure, driven by a high share of 4IR patents. This is in line with the exposure to breakthrough technologies, as defined by Kogan et al. [2020]. In addition, exposure scores to breakthrough patents increase for routine cognitive tasks and decrease for routine manual tasks, which does not occur for 4IR patents. Aside from the general difference in methodology, Kogan et al. uses an additional dimension, “non-routine manual interpersonal tasks,” which is not considered in our analysis and thus might impact exposure to other task types. Kogan et al. conducted an analysis of patent exposure for subsets of patents, based on technology type, such as electronics patents. Future researchers can build on our patent task mapping and create similar exposure scores for a more detailed comparison of exposure scores. The results also show changes around the year 2000, when both 4IR and non-4IR patent shares stabilized compared with previous years. Similarly, Kogan et al. [2020] observed strong changes in exposure shares before 2000 and a stabilization in the years after.
5 Patent exposure score
The fourth industrial revolution represents technologies which have been adopted in the current wave of technological change. These patents include, e.g., AI, machine vision, and autonomous robots. These technologies may change the way we work, even in areas that have previously been less impacted by automation technologies [Brynjolfsson & Mitchell, 2017].
Previous research introduced indicators on the automation potential for different occupations [Frey & Osborne, 2017, Brynjolfsson & Mitchell, 2017]. These indicators help to better understand which occupations and industries might be particularly impacted by the 4IR. A number of inventions play together in this progress, and diffusion might differ across occupations. However, current measures do not address the gap of technical feasibility and diffusion [Arntz et al., 2020]. We address this gap by introducing a patent-based measure of exposure to 4IR technologies. Two criteria for the granting of patents includes novelty and usefulness; therefore, building on patent data should reflect technological progress Strumsky & Lobo [2015].
In the following section we describe the patent exposure scores and provide some examples. Section 6 shows their potential use for labor market analyses, and Section 7 compares patent exposure scores with other automation and AI indicators. The exposure score data can be explored via Tableau Public333https://public.tableau.com/app/profile/benjamin.meindl/viz/4IR_tech/Landing.
5.1 Description of exposure scores
We construct the 4IR exposure scores by calculating the mean of log 4IR patents per task. The 4IR exposure is higher if a task is mapped to many 4IR patents. Occupation scores are derived from the scores associated with its tasks, weighted by task importance. Therefore, occupations with many tasks, and with a high number of related 4IR patents (see Section 3.3), have a high 4IR exposure score. Activities such as interacting with computers and recording information have a high 4IR exposure score. Staffing organizational units and negotiating with others have the lowest 4IR exposure score. H.1 provides more details on task exposure scores. Occupation-level 4IR exposure scores range from a value of below three to above six. The lowest 4IR exposure scores are for occupations such as Meat, Poultry & Fish cutters/trimmers and Floor Sanders & Finishers. High 4IR exposure scores are for occupations such as Credit Authorizers, Data Entry Keyers, Computer Network Support Specialists, and Statistical Assistants. Table 2 provides an overview of 4IR exposure scores per SOC Career Clusters444https://careertech.org/sites/default/files/Perkins_IV_Crosswalk_Table_5_SOC-ONET-Nontrad-Cluster-Pathway.xls from Career Technical Education (CTE) and H.2 lists exposure scores per occupation.
| SOC Career Clusters | Mean 4IR exposure |
|---|---|
| Information Technology | 5.42 |
| Finance | 5.32 |
| Marketing | 5.17 |
| Business Management & Administration | 4.87 |
| Government & Public Adminstration | 4.68 |
| Science, Technology, Engineering & Mathematics | 4.63 |
| Transportation, Distribution & Logistics | 4.58 |
| Health Science | 4.53 |
| Arts, Audio/Video Technology & Communications | 4.51 |
| Human Services | 4.50 |
| Education & Training | 4.49 |
| Hospitality & Tourism | 4.40 |
| Law, Public Safety, Corrections & Security | 4.28 |
| Agriculture, Food & Natural Resources | 4.17 |
| Manufacturing | 4.15 |
| Architecture & Construction | 3.82 |
Note: A full table of exposure scores per occupation is provided in H.2.
On average, low-skilled occupations have a lower 4IR exposure score than medium- to high-skilled occupations, whereas exposure to overall patents is higher for lower-skilled occupations (F provides more information on skill levels and exposure scores). The 4IR exposure scores grew fastest during the 1990s, and growth was particularly strong for medium- and high-skilled occupations. In recent years (between 2007 and 2013), 4IR exposure grew faster for occupations with currently lower scores (thus, some occupations caught up on 4IR exposure). This trend is true, particularly for low-education occupations (less than 20% of workers with college degrees). Nearly all occupations within the 50% of occupations with the highest exposure to non-4IR patents are low-education occupations. Within 4IR exposure scores, there is less differentiation between low and high-skilled occupations, even though most of the lower quintile occupations are low-educated. This supports the findings of Brynjolfsson & Mitchell [2017], that the impact of machine learning differs from previous waves of automation, impacting many tasks previously considered not automatable.
5.2 Patent exposure sub-scores and non-4IR exposure
Based on our patent occupation mapping it is possible to calculate patent exposure scores for various technology groups, as long as there is a definition available for which scores are related to which technology. Those exposure scores could include, for example, AI, or robot patents, as used by Webb [2019]. For this article, we calculated sub-scores of the 4IR exposure scores. Our definition of 4IR technologies describes 367 distinct technologies (see Section 3.3 for an overview and Ménière et al., 2020 for detailed information on those technologies), and we provide technology exposure scores for each of the technologies. These technologies include categories such as healthcare, software, and user interfaces. Each of these categories comprises one or more technologies. A full dataset of 4IR exposure scores and sub-scores is available and D provides some examples of occupation exposure to 4IR exposure sub-scores.
In addition we calculate exposure to (traditional) non-4IR patents. The analysis showed that 4IR exposure and non-4IR exposure are inversely related, and thus, that future technology impact likely differs from the past. Construction, manufacturing, transportation, agriculture, and hospitality occupations are mainly exposed to traditional technologies. Occupations in marketing, finance, administration, education, and law, for example, have a relatively strong exposure to 4IR technologies. E provides an overview of 4IR and non-4IR exposure per SOC Career Clusters.
6 Impact of technologies on the labor market and patent exposure
This section describes how the 4IR exposure scores can contribute to the debate on the impact of 4IR technologies on the labor market. There is an increasing capacity of machines to perform tasks that previously only humans could do, and several studies predict a high risk of labor automation, such as Frey & Osborne [2017] who claim that 47% of US workers are employed in occupations being “at risk of automation” (see section 7.3). This creates fears of machines making workers obsolete and increasing unemployment [Mokyr et al., 2015, Autor, 2015].
In order to explain the impact of technologies on jobs, a leading hypothesis has been that new technologies are biased in favor of skilled workers (Skill-Biased Technological Change, SBTC). When the SBTC hypothesis became unable to explain all major changes in the labor market, Acemoglu & Autor [2011] and Autor & Dorn [2013] developed a more refined explanation, the Routine Replacing Technological Change (RRTC) hypothesis. RRTC builds on the idea that computers are particularly efficient at performing clearly defined “routine tasks”, and this leads to a decline in demand for human labor to perform these tasks. As the share of routine tasks is highest among middle-paid occupations, computerization was accompanied by a hollowing-out of the wage structure, with declining shares of middle-paid jobs, known as employment polarization [Goos et al., 2014, Autor et al., 2006, Oesch & Menés, 2011].
However, the RRTC theory does not explain fully the impact of new technologies on jobs, as automation potentials do not necessarily translate into employment losses, due to various macroeconomic adjustment processes. Using regional-level information for the US, Autor & Dorn [2013], for example, find no net negative employment effects of computerization. Also, Gregory et al. [2016] find that computerization in Europe did not reduce employment but increased it. They show that significant replacement effects exist, which are overcompensated by productivity effects. So, the net employment effect is positive, despite large capital-labor substitution. Acemoglu & Restrepo [2018] show in their seminal theory that the effects of new technologies crucially depend on the type of technological progress. They differentiate between different types of technological progress: (1) automation, i.e., machines learn to perform tasks which previously only humans could do, (2) deepening, i.e., machines become better at tasks already automated, and (3) reinstatement, i.e., humans take over new tasks. In addition, the diffusion of new technologies creates demand for workers who produce or maintain those technologies (capital accumulation effect). The relative size of these effects and their interaction determine the overall effect of automation on the labor market.
Patent-based exposure scores can provide a valuable indicator for technological change, and have been used in recent labor market analyses. Mann & Püttmann [2017] use patent exposure per industry and identify a positive overall impact of automation patents on employment. Webb [2019] found a negative impact at an occupation level. Kogan et al. [2020] showed that recent breakthrough technologies are more related to cognitive tasks than previous waves of technological change. Acemoglu et al. [2020] find that establishments with occupations exposed to AI patents posted more AI vacancies but fewer non-AI vacancies.
In the following section we show basic correlations and compare our patent exposure scores with other patent-based indicators to help researchers better understand the potential use of the 4IR exposure score.
6.1 Patent exposure per wage percentile and education
We analyze patent exposure per education level and per wage percentile to compare patent indicators with theory on SBTC and RRTC. Our analysis shows that exposure to (traditional) non-4IR patents follows expected patterns, whereas 4IR patents show different patterns.
For the analysis of the exposure per education level we rely on two indicators. First, we show the exposure per education level of workers in occupations. Therefore we rely on O*Net data on the education level for workers per occupation. Second, we use O*Net information on Job Zones, an indicator comprising the education and experience required to work in an occupation. Our analysis shows that the exposure to non-4IR patents is highest for low-education skilled occupations (see F) and is in line with the theory of SBTC. In contrast, 4IR patent exposure is highest for medium-to-high-skilled occupations.
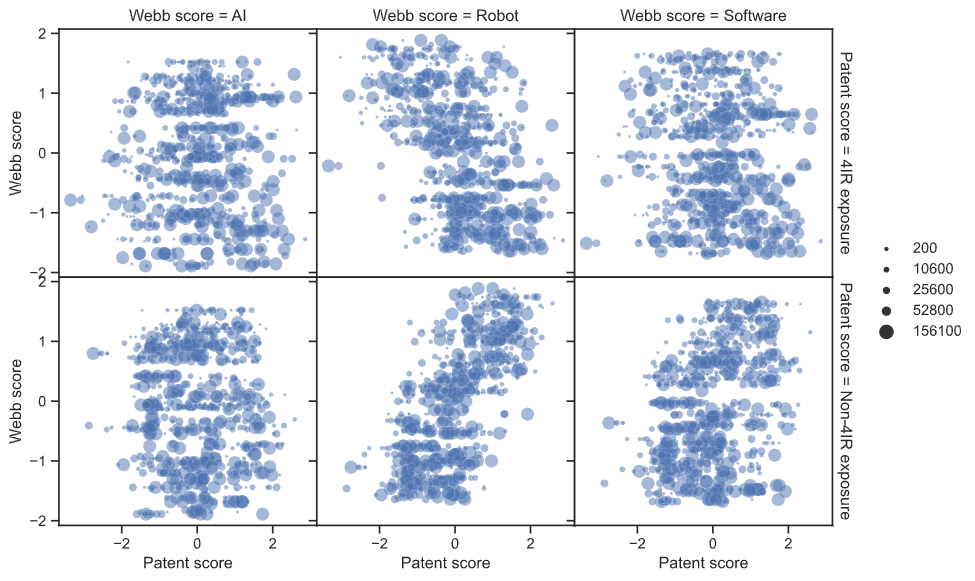
Next, we analyze patent exposure score per wage percentile. Therefore, we build on BLS occupation and employment statistics data555https://www.bls.gov/oes/ to extract occupation shares of workforce and wage data. Figure 5 shows exposure to non-4IR patents and to 4IR patents per wage percentile. Non-4IR exposure is highest for middle-wage occupations. This supports the ideas of RRTC, where (traditional, non-4IR) technologies mainly address routine-heavy medium-wage occupations. Interestingly, this observation is not confirmed at a task level. Section 4.3 shows, that routine cognitive tasks have higher non-4IR exposure than non-routine cognitive tasks, but non-routine manual physical tasks have higher exposure scores than routine manual tasks. On the one hand, this may indicate that RRTC theory is particularly appropriate for cognitive tasks, where computers have mainly been programmed to conduct routine tasks. On the other hand, this could indicate that routine intensive occupations are more likely being automated by technologies, whereas non-routine occupations are more likely to benefit from technologies, e.g., through augmentation. The 4IR patent exposure follows a different pattern and correlates with mean income.
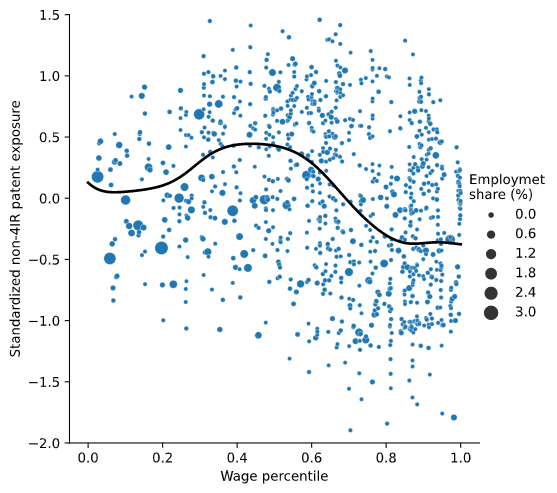

Overall this analysis shows different patterns of technology exposure for 4IR patents than for non-4IR patents. This suggests that the impact of 4IR technologies may differ from previous industrial revolutions, and thus confirms the findings of Brynjolfsson & Mitchell [2017], who found that future waves of automation might affect different occupations which have been considered non-automatable in the past. The exposure to wage varied for different 4IR exposure sub-scores. 4IR-manufacturing patents showed a curve similar to non-4IR patents, with highest exposure for medium-wage occupations and lower exposure for low- and high-wage occupations. 4IR-software patents showed a curve similar to the 4IR exposure curve, and 4IR-AI patents had an even stronger skew towards high-wage occupations (see G.2 for an overview of 4IR exposure sub-scores exposure per wage percentile). This shows that 4IR sub-scores can be valuable for detailed assessments of the impact of technologies on occupations.
6.2 Patent exposure and job growth
In this section we calculate patent exposure scores based on 2012 task descriptions and 2012 patent data. We evaluate the relation of these exposure scores to job growth between 2012 and 2018. The analysis described in this section should provide an initial idea of potential impact patterns of 4IR patents on jobs, in order to compare 4IR exposure scores with other patent exposure scores. For more reliable insights, an analysis with micro data needs to be conducted.
The analysis builds on BLS occupation and employment statistics data from 2012 and 2018 at an occupation level. We controlled for occupation industry shares in 2012, average education level per occupation, and mean annual wage. Section 9 showed a convex relationship of 4IR exposure and MGI estimated automation potential. Therefore, we included the quadratic value of 4IR exposure scores as an independent variable.
Time is required for an invention to have an impact on the labor market. Webb [2019] argue that it can even take decades for new technologies to impact the labor market, and Kogan et al. [2020] find the largest impacts of patents on the labor market five to 20 years after patent filing. Our analysis supports these findings. We conduct an analysis with exposure scores from different years and find that coefficients were lower for more recent patent data (see G for regression results for different exposure scores). Patent exposure from 1992, which is 20 years before the start date of the labor market data we use, showed the highest coefficients for job growth in 2012–2018. This accounts for the time required for technologies to mature.
Regression analysis (see Table 3) suggests an overall negative and concave relationship of patent exposure and job growth. The overall negative relation is in line with the literature, where Kogan et al. [2020] identified a negative impact of breakthrough patents on job growth and Webb [2019] identified a negative correlation of exposure to robot and software patents and job growth. Our analysis builds on occupation-level labor market data, and the results have to be confirmed with micro data analysis. In addition, the regression does not account for various effects of automation on the labor market. Therefore, even though our analysis shows a negative relation of 4IR exposure on job growth, there may be a different overall impact, considering, for example, the impact of deepening automation and capital accumulation.
| (1) | (2) | (3) | (4) | (5) | (6) | |
| 4IR exposure92 | -0.17*** (-4.61) | -0.11*** (-2.85) | -0.13*** (-3.00) | -0.05 (-1.18) | -0.05 (-1.21) | |
| 4IR exposure922 | -0.09*** (-3.54) | -0.11*** (-4.23) | -0.11*** (-4.29) | |||
| Job Zone | 0.24*** (3.00) | 0.17*** ( 2.90) | 0.16*** (2.81) | 0.21*** (2.67) | ||
| LOG Wage | -0.02 (-0.36) | -0.06 (-0.93) | ||||
| Industry share | Yes | No | No | Yes | Yes | Yes |
| Adjusted R2 | 0.083 | 0.028 | 0.044 | 0.095 | 0.117 | 0.117 |
Note: Analysis of 704 observations based on BLS labor market data from 2012 and 2018. Industry share relates to the industry share of the occupation in 2012. 4IR exposure scores are based on 1992 patent exposure per occupation. * p<0.10, ** p<0.05, *** p<0.01.
6.3 Patent exposure scores as indicators for labor market analysis
This section discusses the potential use of our 4IR exposure scores and patent exposure scores by Webb [2019] and Kogan et al. [2020], for labor market analysis. Webb [2019] divided their analysis into three parts. They calculated exposure scores for robot, software, and AI patents. Kogan et al. [2020] created an occupation-level exposure score for breakthrough patents, which differ in text content from previous patents. These categories are different from our 4IR patent exposure scores, making a direct comparison impossible.
Figure 10 indicates a slight correlation of robot and software exposure by Webb [2019] to non-4IR patent exposure. Comparison with labor market indicators provides a similar overall picture. Exposure to software, robots, and 4IR scores is inversely related to education level (see F) and shows a concave relationship to exposure per wage percentile, with highest scores for medium-wage occupations. The AI exposure score by Webb has, like the 4IR exposure score, highest exposure for high wage occupations. Exposure per education differs slightly: whereas AI exposure correlates with education level, 4IR exposure is concave, with highest values for medium-high education levels. Even though some of the results overlap and suggest that the overall mapping approaches follow similar patterns, the 4IR exposure has a different scope than the patent exposure score provided by Webb (see section 7.5).
Similar to our approach, Kogan et al. [2020] uses text embeddings for mapping patents to occupations. Breakthrough patents have a similar exposure per wage percentile than non-4IR patents, with highest exposure for medium-wage occupations, and task-level exposure scores show similar patterns to 4IR patent exposure scores for some task types (see Section 4.3 for analysis of exposure per task type). The vast majority of patents in the 1980 to 2002 period are non-4IR patents (see Figure 2), so it is not surprising that the exposure per wage percentile is similar to the exposure to non-4IR patents. However, a comparison of both scores needs to be reviewed with caution, as the approaches vary in a number of aspects. On the one hand, Kogan et al. present a different exposure score. They define breakthrough patents, which differ in text content from previous patents, and thus the nature of breakthrough patents changes over time. This changing scope may be appropriate for the long time frame of their analysis. Our score relates specifically to a set of selected 4IR patents. Some 4IR technologies were introduced decades ago and may no longer fall under the definition of breakthrough patents. On the other hand, Kogan et al. [2020] calculate the exposure score at an occupation level, whereas our analysis is conducted at a task level. As described in Section 3.2, this leads to a number of differences, such as that the task-level mapping accounts better for the high variety of tasks conducted within an occupation.
In general, it is difficult to compare the exposure scores of the different studies, as they have a different focus. However, our analysis provides a patent occupation mapping which allows us to calculate not only 4IR exposure scores but also exposure to any other technology. Aside from the 4IR exposure and 4IR exposure sub-scores, researchers can, for example, calculate exposure to AI, software, robot, or breakthrough patents, as long as patent technology concordances are available.
Both, Webb [2019] and Kogan et al. [2020] use their exposure scores to analyze the impact of technologies on the labor market. They analyze time frames from 1980 to 2010 and 1850 to 2010 respectively. They find an overall negative impact of technologies on the number of jobs. Their analyses are based on occupation descriptions from a given time, e.g., Webb [2019] used O*NET task descriptions from 2017. While those descriptions offer accurate insights into the tasks conducted by an occupation in 2017, and thus allow us to identify the relevant patents for those tasks, they might not appropriately reflect the task descriptions of these occupations some decades ago. Therefore, the further the analysis goes back in time, the more caution is needed when reading the results. Similarly, our analysis is based on current task descriptions by O*Net (in addition we calculate exposure scores based on 2012 task descriptions for the regression analysis). When using historic patent exposure scores, e.g., from 1992, we consider these scores valuable for explaining when technologies that shape current jobs were invented (see also Section 6.2). As the patent occupation mappings are based on current task descriptions, it is possible that exposure scores do not accurately reflect patent exposure of that occupation in 1992. Therefore, we believe these exposure scores, which are based on current task descriptions, are most useful for analyzing the recent changes in the labor market. For the regression analyses of job growth 2012 to 2018 we calculated patent exposure scores based on 2012 task descriptions (our general exposure scores are based on 2020 task descriptions provided by O*Net).
7 Direct comparison of 4IR exposure and other technology and automation indicators
Section 6 showed the potential contribution of the 4IR exposure score for labor market analyses. In this section we compare the 4IR exposure score to other 4IR, AI, and automation indicators. The 4IR exposure score provides a direct indicator of an occupation’s exposure to technologies of the fourth industrial revolution (4IR). Whereas our patent-based 4IR exposure scores and the AI exposure by Webb [2019] account for existing technological capabilities, Felten et al. [2021] provides a forward-looking indicator of occupation exposure to AI technologies based on scientific progress. In both cases, high exposure scores might indicate which occupations are particularly impacted by new technologies. On the one hand, this impact may include automation, which is a replacement of tasks conducted by humans, with machines. On the other hand, there is a reinstatement effect, leading to the creation of new tasks. Additionally, tasks may be augmented through new technologies. Existing exposure scores do not differentiate between these types of change. There exist automation exposure scores which indicate how likely technologies are to perform tasks currently performed by humans. Such automation exposure scores include suitability for machine learning (SML) by Brynjolfsson & Mitchell [2017], computerization probability (CP) by Frey & Osborne [2017], and automation potential by Manyika et al. [2017]. This section explores the relationship of the 4IR exposure score with the aforementioned scores in order to provide additional context to the 4IR exposure. Table 4 provides an overview of these indicators.
| 4IR exposure (this article) | AI exposure [Felten et al., 2021] | SML [Brynjolfsson & Mitchell, 2017] | CP [Frey & Osborne, 2017] | Automation potential [Manyika et al., 2017] | AI exposure [Webb, 2019] | |
|---|---|---|---|---|---|---|
| Description | Exposure to technologies of the fourth industrial revolution (most of which enable the introduction of AI) | Exposure to artificial intelligence technology | Suitability for machine learning technologies | Risk of being automated through AI and robotics | Share of activities potentially being automated through automation technology | Exposure to AI patents |
| Level of analysis | Tasks conducted by occupations (O*Net) | Abilities required by occupations (O*Net) | Tasks conducted by occupations (O*Net) | Occupation level, scaled through abilities (O*Net) | 18 performance capabilities (based on O*Net abilities) | Tasks conducted by occupations (O*Net) |
| Index basis | Relevant patents per task | Scientific AI advances, as described by the EFF, per ability | Online survey of SML characteristics per task | Expert evaluation of selected occupations automation potential | Expert evaluation of technology performance per capability | Relevant patents per task |
| Measure interpretation | Existing technology 4IR capabilities based on patents (current diffusion) | Existing theoretical AI capabilities based on scientific articles (possibly near future diffusion) | Potential future capability of ML (possible future diffusion) | Potential future capabilities of technology (possible future diffusion) | Potential future capabilities of technology (possible future diffusion) | Existing technology AI capabilities based on patents (current diffusion) |
Most of the scores in our comparison refer to AI or machine learning, whereas the 4IR exposure score relates to technologies of the fourth industrial revolution. 4IR technologies, as defined in our work, are not limited to machine learning patents. Instead, they include a range of technologies, including “core technology fields” IT hardware, software, and connectivity technologies, as well as “applications” technologies, such as remote health monitoring, predictive maintenance, and smart ATMs. However, even though not all those technologies directly relate to machine learning, they allow data generation, transmission, and analysis, thus contributing to an environment that enables the application of “smart” AI technologies. Meindl & Mendonça [2021] explain that, with the increasing maturity of the 4IR, the concept increasingly centers around artificial intelligence. Additionally, Frank et al. [2019a] explain in their widely used framework of Industry 4.0, that several base technologies (e.g., cloud computing) support the implementation of “smart” (or intelligent) front end technologies. Therefore, depending on the definition of artificial intelligence, we consider that 4IR exposure scores may be comparable to the AI exposure indices. We decide not to rely on the “core AI” 4IR sub-exposure score (see Section 5.2 for more background on 4IR sub scores) for this comparison, which mainly relates to AI algorithms itself, but may not reflect the full potential impact of AI, e.g., through smart office solutions or autonomous vehicles.
7.1 Comparison of 4IR exposure and AIOI index by Felten et al.
Felten et al. [2021] create an occupation level AI exposure score (AIOE). They identify the most relevant AI capabilities based on the Electronic Frontier Foundation (EFF) AI Progress Measurement project and link those capabilities to occupational abilities, as described by O*Net. They calculate the AI exposure score as a relative measure, accounting for all abilities related to an occupation.
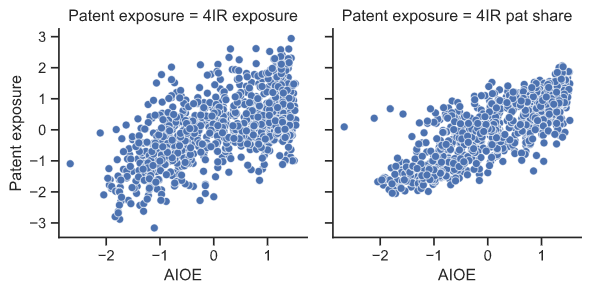
Figure 6 shows a correlation between AIOE and both 4IR exposure and the share of 4IR patents within all patents related to an occupation. The correlation is stronger for AIOE and 4IR patent share. The strong AIOE and 4IR patent share correlation is not surprising, as both measures describe occupations which mainly relate to abilities and tasks which can only be conducted using AI or 4IR technologies. A high 4IR exposure score indicates that there is a high number of total patents related to the occupation. This could indicate that the 4IR technologies are already in a more advanced state. A high 4IR patent share does not necessarily indicate a high number of total patents, but only relates to the share of 4IR patents of all related patents. Some occupations, such as lawyers and compliance officers, have many tasks for which overall few relevant patents exist, and within those, many patents are about information and communication technologies related to the 4IR. Similarly, high AIOE occupations require many abilities which can be addressed by AI (but not by traditional technologies), independently if these technologies are already diffused. In addition, even though AI technologies have certain capabilities (such as image recognition), this does not necessarily mean that solutions have already been invented which can help workers conduct their tasks. Accordingly, Felten et al. [2021] describe their exposure score as being forward-looking.
Following this argumentation, the 4IR patent share describes the degree to which occupational tasks can be conducted or supported by 4IR technologies, whereas 4IR patent exposure takes into account the actual capabilities of current 4IR technologies.
7.2 Combining 4IR exposure score and suitability for machine learning
Brynjolfsson & Mitchell review occupational task descriptions with regard to whether they are potentially suitable for machine learning. A high SML indicates a high risk of automation (due to the various effects described; this does not necessarily mean decreasing labor demand of related tasks). A low SML may comprise two types of tasks: first, “old” tasks, which are not automatable; second, “new” tasks, which themselves result from the introduction of machine-learning technologies such as “Develop or apply data mining and machine learning algorithms.”
We consider the 4IR exposure to describe the diffusion of technologies enabling the (front end) application of machine-learning technologies. The SML score presents the general automation potential once technologies are fully implemented. Therefore, SML and 4IR exposure scores can complement each other. Figure 7 maps occupations based on their 4IR exposure score and their SML score. Overall, there is a correlation, which indicates that high automation suitability is also related to a high number of 4IR patents. However, various occupations are outside this pattern; therefore we look at the graph along its four quadrants for interpretation of potential changes that occupations might undergo. We define quadrants along the mean values of the SML and the 4IR scores.

Quadrant I comprises occupations highly suitable for machine learning, and exposed to many automation patents. Through technology availability and automation suitability, these occupations might undergo significant changes in the future. They include consumer services, banking services, professional sales, web/digital communications, and travel/tourism occupations. Work activities which relate to this quadrant include “interacting with computers,” “perform administrative activities,” “selling and influencing others,” and “analyzing data or information.”
Quadrant II describes occupations highly suitable for automation but with a low number of patents. These occupations might include many tasks which require more innovation before automation can happen. This group includes early childhood development and services, power, structural & technical systems, lodging, agribusiness systems, and human resource management occupations. Work activities in this quadrant include “judging the quality of things, services, or people”; “establishing or maintaining interpersonal relationships”; and “guiding, directing, and motivating subordinates.”
Quadrant III comprises occupations which might not undergo large changes through the 4IR. They only have a few tasks suitable for automation and only a few automation patents associated with those tasks. This quadrant includes construction, maintenance operations, and performing arts occupations. Work activities in this quadrant include “updating and using relevant knowledge”; “coaching and developing others”; and “resolving conflicts and negotiating with others.”
Quadrant IV describes occupations exposed to a high number of 4IR patents but with many tasks with low SML. These occupations might either already have undergone changes due to the 4IR or mainly benefit from 4IR technologies through newly-created tasks or labor augmentation effects. This quadrant includes programming and software development, transportation systems or infrastructure planning, marketing communications, and professional support services occupations. Work activities in this quadrant include: “monitoring and controlling resources”; and “performing for or working directly with the public.”
The four quadrants could also help to describe the pressure for change to the occupations. In Quadrant I, where there is a high 4IR exposure and a high SML, there might be a high pressure on the occupations to adapt to new technologies, change tasks, reskill, or upskill. In Quadrant IV, there is also a high 4IR exposure, but due to the low SML score, there might be a lower pressure to adapt to the new technology as activities might not become obsolete as quickly, but rather benefit through augmentation. Even though there is a high SML potential for Quadrant II occupations, the pressure on those occupations is lower due to the slow diffusion of 4IR technologies in those areas. Finally, Quadrant III is impacted least by current 4IR technologies. Further analysis revealed that since 2001 the 4IR exposure grew more for occupations in the Quadrants II and III than in the highly exposed Quadrants I and IV. This delayed 4IR exposure growth suggests that technology diffusion is slower for those occupations.
Overall there is a correlation between 4IR exposure and SML scores. This correlation is strongest within the least-educated occupations (less than 10% of workers with a college degree). The Pearson’s r for low education is 0.40 vs. 0.29 for others). Low education occupations are primarily in Quadrant III and there are hardly any in Quadrant IV. High-education occupations (more than 80% college degree) mostly have average 4IR exposure scores and are distributed across all quadrants. Medium education occupations are slightly more present in Quadrants I and IV. Therefore, there is only a small share of low-education occupations in Quadrant IV, which possibly describes occupations benefiting from 4IR technologies through labor augmentation.
Overall, the four quadrants could be described as follows in the context of the 4IR. Quadrant IV includes 4IR augmented occupations, which are likely benefiting most from 4IR occupations and have a high chance of being suitable to use labor-augmenting 4IR technologies. A relatively high share of these are highly educated. Quadrant I is currently undergoing big changes, and Quadrant II will change when more technology is developed. Quadrant III occupations have many tasks which are little impacted by the 4IR.
7.3 Comparison of exposure scores to computerization probabilities by Frey and Osborn
A highly-cited risk of automation index has been provided by Frey & Osborne [2017]. They asked a group of experts whether selected occupations may be automatable and used those ratings as a basis to calculate automation probability (CP) scores for all occupations. They consider 47% of US automation to have a high computerization probability. Frey & Osborne label high CP scores if their calculation leads to a risk of automation above 80%. The results were bimodally distributed, with most occupations on the high and low extremes. Arntz et al. [2017] show that accounting for job heterogeneity within occupations leads to a more normal distribution with more medium CP jobs, and thus much fewer “high-risk” occupations.
We compare the CP score with SML [Brynjolfsson & Mitchell, 2017] and find there is little or no correlation (see G.1 for the analysis). This is surprising, as both indices aim to estimate future automation potential for occupations. Whereas the SML score is based on a structured analysis of the suitability for machine learning at a task level, the CP has been calculated based on expert evaluations of overall occupations. Unlike SML scores, it appears that CP scores are closely related to education level. Arntz et al. [2020] describe that this represents the idea of skill-biased technological change, which was observed before the 1980s and has been replaced by routine-replacing technological change. One possible explanation of this bias towards low-skilled automation by Frey & Osborne is the method they use for calculating the CP scores. They identify automation bottlenecks comprising nine skills and capabilities (features) to calculate CP scores. However, theory suggests that task content has a higher relevance for predicting automation potential than the skills a machine can perform, as skills do not directly translate into automatable tasks [Acemoglu & Autor, 2011]. The SML score is calculated based on task-level indicators, and Brynjolfsson & Mitchell [2017] find that artificial intelligence-driven automation might impact a much broader range of tasks and occupations than described by previous models. Brynjolfsson & Mitchell found that, for example, even tasks from occupations that require social interaction, such as sales and customer interaction or family and community services, are suitable for machine learning. Those occupations have low CP scores, even when they are low-educated. In turn, there are high CP scores for manual tasks such as construction, production, and maintenance, which have low or medium SML scores. Finally, CP scores are very low for most high-skilled education, whereas Brynjolfsson & Mitchell [2017] find that those occupations also include a number of tasks that are suitable for machine learning. Information technology occupations, for example, have the lowest CP scores and medium SML scores.
Next, we explore the relationship of 4IR exposure and CP scores. Figure 8 shows that (similarly to the comparison of CP and SML scores) there is no overall correlation of 4IR exposure and CP. We evaluate the graph along three groups (highlighted as boxes A, B, and C) which comprise most occupations. In group A, we find that low CP occupations, which are also high-education occupations666We consider an education level high if more than 80% of workers in an occupation hold a college degree. Results are similar if skill level is measured according to O*Net Job Zones., generally having low exposure to non-4IR patents. These occupations include the fields of information technology; science, technology, engineering, mathematics; education and training; human services; health sciences; and arts, video technology & communications. Next, we describe occupations in groups B and C. Those have a high CP, are mostly low-skilled, and the 4IR exposure is inversely related to the exposure to non-4IR patents. Group B comprises those occupations with high 4IR exposure and medium non-4IR exposure, including mainly low-skilled administrative and clerical occupations in the fields of finance, marketing, and business management & administration. Group C comprises low 4IR exposure and high non-4IR exposure occupations, which are mainly manual occupations, including the fields of transportation and logistics, hospitality & tourism; agriculture, food & natural resources; and manufacturing, and construction.
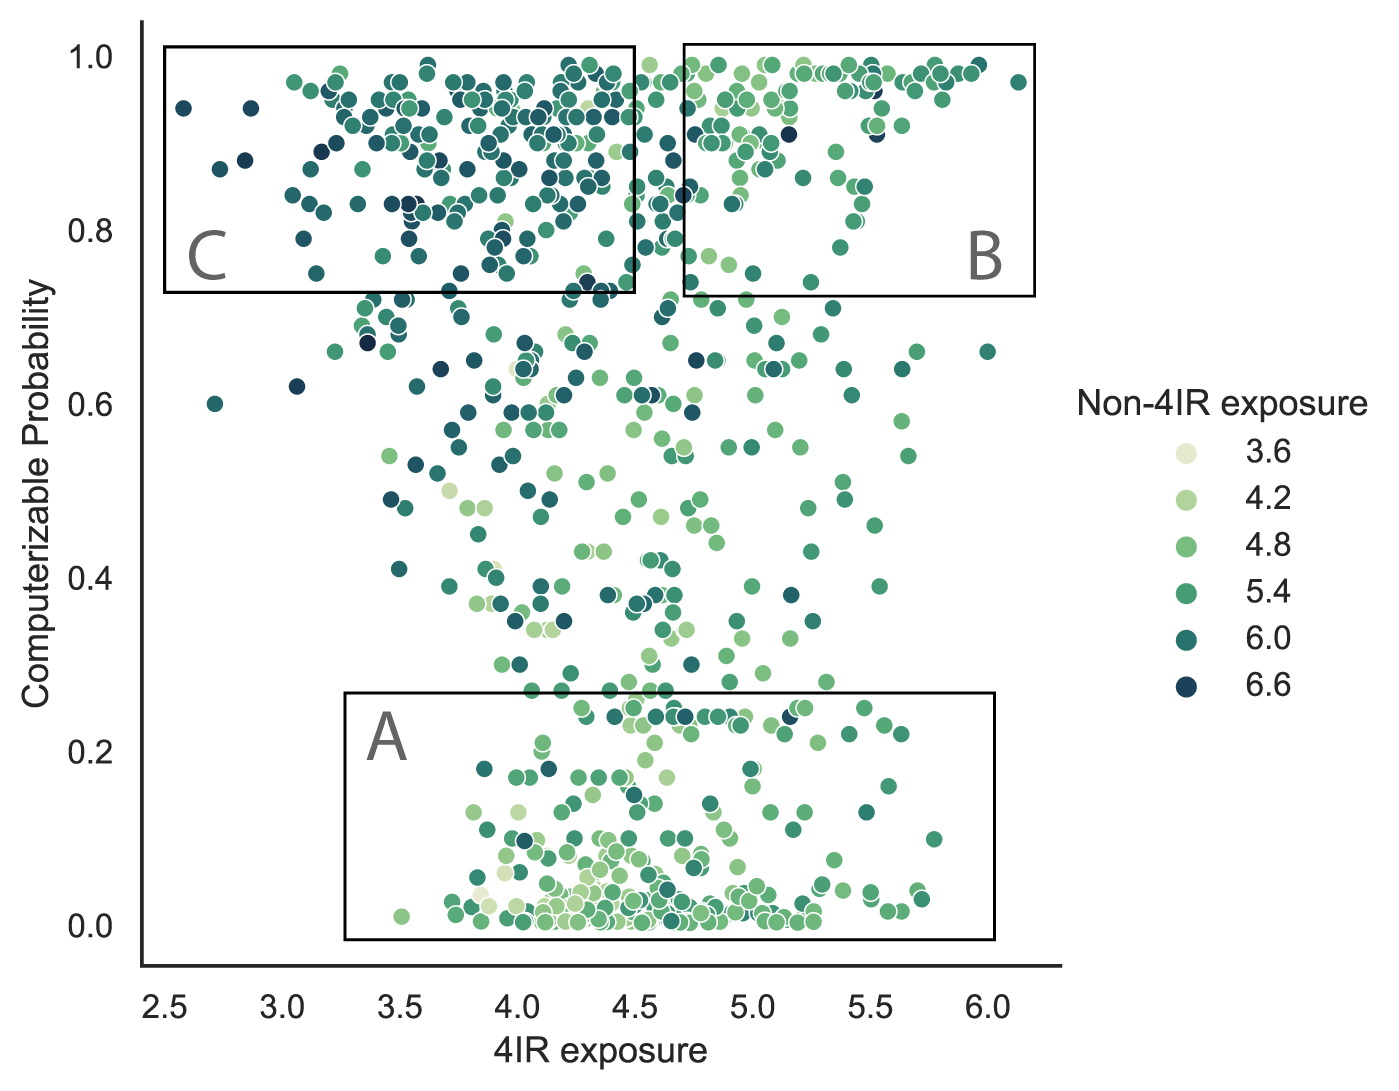
Overall, the two main predictors for high CP scores are low education and a medium or high exposure to non-4IR patents. While an interpretation of this observation is difficult, it raises the question of whether the expert evaluation of automation probability is biased towards skill-biased technological change and ignores the disruptive impact of machine learning, which might significantly differ from previous waves of automation.
7.4 Comparison of exposure scores to MGI automation scores.
The McKinsey Global Institute Manyika et al. [2017] conducted a detailed evaluation of the automation potential of occupations, in which they identified which sets of capabilities are required for each of over 2000 work activities (O*NET detailed work activities). For each of these capabilities they evaluated the technological readiness to automate these capabilities until 2030, which served as a basis for the evaluation of which share of jobs can be automated per occupation777The dataset can be explored through a Tableau public dataset at https://public.tableau.com/profile/mckinsey.analytics#!/ vizhome/AutomationandUSjobs/USAutomationlandscape, accessed on April 10, 2021..
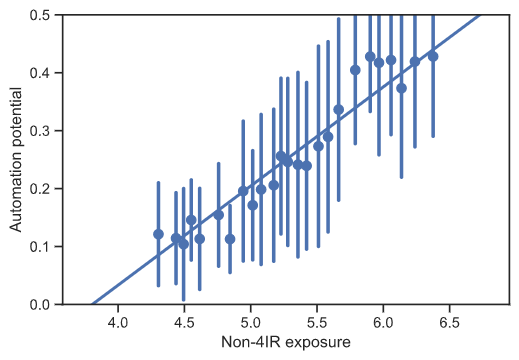
We compare patent exposure scores with MGI automation potential estimates in Figure 9. The correlation shows that exposure to non-4IR patents relates to higher automation potential, whereas automation potential is lowest for medium to high 4IR exposure occupations. Whereas SML and CP scores describe general automation potential, the MGI describes which automation might actually be implemented by 2030. The results suggest that most automation potential relies on non-4IR technologies, whereas occupations with higher exposure to 4IR patents (except for very high exposure) seem more prone to short-term automation. They include administrative support, sales and service, quality assurance, and health informatics occupations, and they also have high SML scores. These high 4IR and occupations are possibly the first to feel the automation impact of 4IR technologies. If we assume that high 4IR exposure is due to an advanced development of associated technologies, this is in line with Kogan et al. [2020], who highlight that some time is required before new technologies have an impact on jobs.

7.5 Comparison of 4IR exposure and Webb’s exposure scores
Webb [2019] created a mapping of occupations to AI, software, and robot patents. Webb uses a different NLP approach for mapping patents to jobs than the present article (for a detailed comparison see section 2). Additionally, the method for construction of the exposure score differs. Whereas Webb [2019] creates separate exposure scores for 3 technologies, our article provides one main exposure score to patents of the fourth industrial revolution and additionally more than 300 exposure sub-scores for a broad range of 4IR technologies, such as computer-aided design, NLP, and smart office solutions.
Figure 10 compares Webb’s exposure scores with our 4IR and Non-4IR patent exposure. The results show that there is no correlation for AI patents and only a slight correlation between software exposure and exposure to non-4IR patents. Also, considering 4IR sub-scores related to AI and software (see D.2), we cannot find a strong correlation of Webb’s scores and our 4IR exposure scores. There are various reasons for the non-correlation. First, the fundamentally different algorithm of mapping patents and tasks can be a reason why the exposure scores per occupation differ. Second, the scores created (4IR, vs. AI, software, robot) are different. Whereas our 4IR definition is very broad, Webb’s definition relates to specific technologies. Further, Webb selects technology patents via text search, while our approach relies on CPC classifications of patents. Third, the aggregation method for task scores to occupation scores differs between the two approaches.
8 Conclusions and future work
The aim of this paper is to better understand the exposure of occupations to technologies of the 4IR. Several existing indicators describe the theoretical automation potential or future exposure potential of occupations. We introduce an indicator reflecting actual technology diffusion, based on patent data. This paper presents a method for mapping patents to tasks and introduces an occupation and task-level indicator of exposure to patents of the 4IR (4IR exposure score). We refine existing approaches to better account for task-level differences in patent exposure and the context in which an activity is conducted (e.g., diagnose machine condition vs. diagnose patient condition). We therefore consider that this approach offers a highly valuable contribution towards mapping patents to tasks and occupations.
Occupations with higher exposure scores may, for example, be more impacted by 4IR technologies. The analysis shows that ratio of exposure to 4IR and non-4IR patents differs per occupation. Occupations with many manual tasks, such as manufacturing and construction, have high non-4IR exposure and low 4IR exposure, whereas many non-manual occupations, such as finance and marketing occupations, have a higher ratio of 4IR exposure.
The 4IR exposure score is also valuable as a complementary score to other technology or automation scores. For example, comparing theoretical and actual technology exposure can provide insights into which occupations might undergo changes through current technologies versus future diffusion.
This direct measure of technological progress can provide highly valuable data for further exploration of the impact of technological change on employment [Mitchell & Brynjolfsson, 2017] and may serve as a source for labor market analysis to explore impact patterns of technologies on jobs.
We compared our 4IR exposure scores with labor market indicators and found that exposure to non-4IR patents is highest for medium-wage occupations, and that 4IR exposure is highest for high-wage occupations. Further, regression analysis showed a negative (concave) relation of 4IR exposure to job growth. Patent exposure 10 and 20 years ago showed higher coefficients on the impact on job growth than more recent patent exposure. The gap may reflect the time between invention and technology diffusion and is in line with findings of Kogan et al. [2020]. Further analysis with micro data is required to confirm these findings. To estimate the overall impact on the labor market, more complex modeling is required, e.g., considering the effect of deepening of automation or capital accumulation.
Acemoglu & Restrepo [2019] observed that different technologies may have different impact patterns on the labor markets. Therefore, differentiating between 4IR technologies may offer additional value for labor market analyses. Researchers can build on our mapping for technology-level analysis. On the one hand, we provide technology-specific exposure scores (e.g., CAD, augmented reality for surgery, and smart office technologies). On the other hand, our mapping of patents to tasks allows researchers to build any other exposure scores, such as robots, or breakthrough patents, as long as a patent technology mapping is available. Also, patent data is available at firm level and allows for time-varying measures.
Our work provides an occupation (and task)-level indicator of 4IR patent exposure. Patents describe inventions, and not all inventions have an equal impact. Future work could thus further improve the indicator by accounting for a patent’s impact. The count of patent citations is frequently discussed as potential measure for novelty and social usefulness, but its validity is ambiguous [Strumsky & Lobo, 2015]. Another approach is described by Kelly et al. [2020], who describe “breakthrough patents” which significantly differ in text content from previous patents and thus might have particularly high impact.
Our approach builds on occupation and task description data provided by O*Net. We take advantage of its extensive and hierarchical descriptions of occupational activities and tasks. Future work could rely on additional information provided by O*Net. For example, at a task and occupation level, the dataset indicates which technologies and tools are used, such as word processing software or programmable logic controllers. Building on this information may provide information on inventions related specifically to labor augmentation. The O*Net database describes occupations in the context of the US labor market. There exist concordance tables, which can help to use the patent occupation mapping in other contexts. These might provide additional accuracy to directly map patents to those regional occupation descriptions, if regional databases with similar hierarchical structures exist.
Acknowledgments
The authors thank the Studienstiftung des Deutschen Volkes for financial support and MIT Portugal, who supported the visiting stay at the Massachusetts Institute of Technology. Further, we thank IN+ Projecto 1801P.00962.1.01 - IN+ UIDP/50009/2020 - IST-ID for financial support.
Competing interests
We declare that we have no significant competing financial, professional, or personal interests that might have influenced the performance or presentation of the work described in this manuscript.
References
- Acemoglu & Autor [2011] Acemoglu, D., & Autor, D. (2011). Skills, tasks and technologies: Implications for employment and earnings. Handbook of Labor Economics, 4, 1043–1171. doi:10.1016/S0169-7218(11)02410-5.
- Acemoglu et al. [2020] Acemoglu, D., Autor, D., Hazell, J., & Restrepo, P. (2020). AI and Jobs: Evidence from Online Vacancies. NBER Working Paper, No. w28257. doi:10.3386/w28257.
- Acemoglu & Restrepo [2018] Acemoglu, D., & Restrepo, P. (2018). Demographics and Automation. doi:10.3386/w24421.
- Acemoglu & Restrepo [2019] Acemoglu, D., & Restrepo, P. (2019). Automation and new tasks: How technology displaces and reinstates labor. Journal of Economic Perspectives, 33, 3–30. doi:10.1257/jep.33.2.3.
- Arntz et al. [2017] Arntz, M., Gregory, T., & Zierahn, U. (2017). Revisiting the risk of automation. Economics Letters, 159, 157–160. doi:10.1016/j.econlet.2017.07.001.
- Arntz et al. [2020] Arntz, M., Gregory, T., & Zierahn, U. (2020). Digitalization and the future of work: Macroeconomic consequences. In K. F. Zimmermann (Ed.), Handbook of Labor, Human Resources and Population Economics ZEW Discussion Papers. Cham: Springer. doi:https://dx.doi.org/10.2139/ssrn.3413653.
- Aschhoff et al. [2010] Aschhoff, B., Crass, D., Cremers, K., Grimpe, C., Rammer, C., Brandes, F., Diaz-Lopez, F., Woolthuis, R. K., Mayer, M., & Montalvo, C. (2010). European Competitiveness in Key Enabling Technologies. European Competitiveness in KETs, .
- Autor & Dorn [2013] Autor, D., & Dorn, D. (2013). The Growth of Low-Skill Service Jobs and the Polarization of the US Labor Market. American Economic Review, 103, 1553–1597. doi:10.1257/aer.103.5.1553.
- Autor et al. [2006] Autor, D., Katz, L., & Kearney, M. (2006). The Polarization of the U.S. Labor Market. The American economic review, 96, 189–194. doi:10.1257/000282806777212620.
- Autor [2015] Autor, D. H. (2015). Why Are There Still So Many Jobs? The History and Future of Workplace Automation. Journal of Economic Perspectives, 29, 3–30. doi:10.1257/jep.29.3.3.
- Benzineb & Guyot [2011] Benzineb, K., & Guyot, J. (2011). Automated Patent Classification. In L. M., M. K., T. J., & T. A. (Eds.), Current Challenges in Patent Information Retrieval. The Information Retrieval Series, vol 29. (pp. 239–261). Springer Berlin Heidelberg. doi:10.1007/978-3-642-19231-9_12.
- Bessen [2019] Bessen, J. E. (2019). Automation and Jobs: When Technology Boosts Employment. Economic Policy, 34, 589—-626. doi:https://doi.org/10.1093/epolic/eiaa001.
- Brynjolfsson & Mitchell [2017] Brynjolfsson, E., & Mitchell, T. (2017). What can machine learning do? Workforce implications. Science, 358, 1530–1534. doi:10.1126/science.aap8062.
- Dechezleprêtre et al. [2020] Dechezleprêtre, A., Hémous, D., Olsen, M., & Zanella, C. (2020). Automating Labor: Evidence from Firm-level Patent Data. doi:10.2139/ssrn.3508783.
- Felten et al. [2021] Felten, E., Raj, M., & Seamans, R. (2021). Occupational, Industry, and Geographic Exposure to Artificial Intelligence: A Novel Dataset and Its Potential Uses. Strategic Management Journal, (pp. 1–23). doi:10.1002/smj.3286.
- Frank et al. [2019a] Frank, A. G., Dalenogare, L. S., & Néstor, F. A. (2019a). Industry 4.0 technologies: Implementation patterns in manufacturing companies. International Journal of Production Economics, 210, 15–26. doi:10.1016/j.ijpe.2019.01.004.
- Frank et al. [2019b] Frank, M. R., Autor, D., Bessen, J. E., Brynjolfsson, E., Cebrian, M., Deming, D. J., Feldman, M., Groh, M., Lobo, J., Moroa, E., Wang, D., Youn, H., & Rahwan, I. (2019b). Toward understanding the impact of artificial intelligence on labor. PNAS, 116, 6531–6539. doi:10.1073/pnas.1900949116.
- Frey & Osborne [2017] Frey, C. B., & Osborne, M. A. (2017). The future of employment: How susceptible are jobs to computerisation? Technological Forecasting and Social Change, 114, 254–280. doi:10.1016/j.techfore.2016.08.019.
- Goos et al. [2014] Goos, M., Manning, A., & Salomons, A. (2014). Explaining Job Polarization: Routinization and Offshoring. American Economic Review, 104, 1–20. doi:10.1257/aer.104.8.2509.
- Gregory et al. [2016] Gregory, T., Salomons, A., & Zierahn, U. (2016). Racing With or Against the Machine? Evidence from Europe. doi:10.2139/ssrn.2815469.
- Kagermann et al. [2013] Kagermann, H., Wahlster, W., & Helbig, J. (2013). Recommendations for implementing the strategic initiative INDUSTRIE 4.0. Technical Report April Forschungsunion. doi:10.13140/RG.2.1.1205.8966.
- Kelly et al. [2020] Kelly, B. T., Papanikolaou, D., Seru, A., & Taddy, M. (2020). Measuring Technological Innovation over the Long Run. SSRN Electronic Journal, . doi:10.2139/ssrn.3279254.
- Kogan et al. [2020] Kogan, L., Papanikolaou, D., Schmidt, L., & Seegmiller, B. (2020). Technological Change and Occupations over the Long Run. SSRN Electronic Journal, . doi:10.2139/ssrn.3585676.
- Lybbert & Zolas [2014] Lybbert, T. J., & Zolas, N. J. (2014). Getting patents and economic data to speak to each other: An ‘Algorithmic Links with Probabilities’ approach for joint analyses of patenting and economic activity. Research Policy, 43, 530–542. doi:10.1016/j.respol.2013.09.001.
- Mann & Püttmann [2017] Mann, K., & Püttmann, L. (2017). Benign Effects of Automation: New Evidence From Patent Texts, .
- Manyika et al. [2017] Manyika, J., Chui, M., Miremadi, M., Bughin, J., George, K., Willmott, P., & Dewhurst, M. (2017). A future that works: AI, automation, employment, and productivity. Technical Report McKinsey Global Institute. URL: https://www.mckinsey.com/{~}/media/McKinsey/FeaturedInsights/DigitalDisruption/Harnessingautomationforafuturethatworks/MGI-A-future-that-works{_}Executive-summary.pdf.
- Meindl et al. [2021] Meindl, B., Ayala, N. F., Mendonça, J., & Frank, A. G. (2021). The four smarts of Industry 4. 0: evolution of ten years of research and future. Technological Forecasting and Social Change, 168, 120784. doi:10.1016/j.techfore.2021.120784.
- Meindl & Mendonça [2021] Meindl, B., & Mendonça, J. (2021). Mapping Industry 4.0 Technologies: From Cyber-Physical Systems to Artificial Intelligence [Unpublished].
- Ménière et al. [2020] Ménière, Y., Philpott, J., Rodríguez, J. P., Rudyk, I., Wewege, S., & Wienold, N. (2020). Patents and the Fourth Industrial Revolution (EPO). December. Munich: European Patent Office.
- Mikolov et al. [2018] Mikolov, T., Grave, E., Bojanowski, P., Puhrsch, C., & Joulin, A. (2018). Advances in Pre-Training Distributed Word Representations. In Proceedings of the International Conference on Language Resources and Evaluation (LREC 2018).
- Mitchell & Brynjolfsson [2017] Mitchell, T., & Brynjolfsson, E. (2017). Track how technology is transforming work. Nature, 544, 290–292. doi:10.1038/544290a.
- Mokyr et al. [2015] Mokyr, J., Vickers, C., & Ziebarth, N. L. (2015). The History of Technological Anxiety and the Future of Economic Growth: Is This Time Different? Journal of Economic Perspectives, 29, 31–50. doi:10.1257/jep.29.3.31.
- Oesch & Menés [2011] Oesch, D., & Menés, J. R. (2011). Upgrading or polarization? Occupational change in Britain, Germany, Spain and Switzerland, 1990-2008. Socio-Economic Review, 9, 503–531. doi:10.1093/ser/mwq029.
- Risch & Krestel [2019] Risch, J., & Krestel, R. (2019). Domain-specific word embeddings for patent classification. Data Technologies and Applications, 53, 108–122. doi:10.1108/DTA-01-2019-0002.
- Schmoch [2008] Schmoch, U. (2008). Concept of a Technology Classification for Country Comparisons. Technical Report June World Intellectual Property Organisation (WIPO).
- Silverman [2002] Silverman, B. S. (2002). Technological resources and the logic of corporate diversification. London: Routledge.
- Strumsky & Lobo [2015] Strumsky, D., & Lobo, J. (2015). Identifying the sources of technological novelty in the process of invention. Research Policy, 44, 1445–1461. doi:10.1016/j.respol.2015.05.008.
- Webb [2019] Webb, M. (2019). The Impact of Artificial Intelligence on the Labor Market. Available at SSRN 3482150, .
Appendix A Patents per year in our dataset
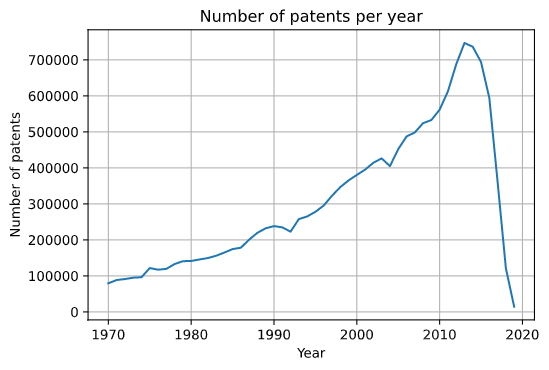
Appendix B Validity check through comparing both word embeddings.
Our approach compares texts of patent abstracts and task descriptions. Calculation of text similarity relies on word embedding (see Section 3.2). Our results comprise relevant patents identified through two different embeddings. One embedding represents patent-specific language; the other embedding builds on a more general language (common crawl embeddings). Our approach identifies almost twice as many patents through the patent-specific embeddings. Only 35% of the patent-task relations identified through the general language embeddings overlap with the patent-specific embeddings.
We compare the results of both embeddings, to validate our overall results. First, we evaluate, if an embedding biases results toward certain technologies. Table 6 shows that the results per technology sector only differ slightly between both approaches. Therefore, we do not expect a bias towards certain technologies. Second, we examine whether there is a bias towards certain task types, e.g., if more patents are mapped to certain tasks. Table 6 shows no indication of a bias of embeddings towards a task type. Those identical patterns indicate that the approach is robust enough so that the choice of word embedding did not systematically bias the results.
| Share of patents per technology sector | ||
|---|---|---|
| General corpus | Patent corpus | |
| Chemistry | 8% | 10% |
| Electrical engineering | 50% | 46% |
| Instruments | 18% | 19% |
| Mechanical engineering | 16% | 17% |
| Other fields | 8% | 9% |
Note: Percentages do not sum up due to rounding
| Share of patents per task type | ||
|---|---|---|
| General corpus | Patent corpus | |
| Information input | 15% | 14% |
| Interacting with Others | 14% | 16% |
| Mental processes | 14% | 12% |
| Work output | 58% | 58% |
Note: Percentages do not sum up due to rounding
Appendix C Patent per technology fields and task type
PATSTAT provides a classification of patents into technology clusters, based on Schmoch [2008]. We use this classification to evaluate our results and show to which technology clusters our results refer. These results are particularly relevant for validating our mapping. The results show that patents in the field of IT methods for management are, on average, relevant for most tasks. Also control, computer technology, and digital communication technologies are frequently linked to occupations. Other fields, such as chemistry or nanotechnology do not provide many direct links to tasks.
Our mapping provides links of patents to occupations at a task level. In Figure 12 we explore which tasks are exposed to which technology fields. Therefore, we group tasks into four high-level activity categories and evaluate the share of patents per activity category associated with each of the technology fields.

Information input tasks have a particularly high share of measurement patents; mental process tasks and interaction with other tasks have a particularly high share of computer technology, IT, and communication and control patents. Finally, work-output-related tasks have a high share of machine tool and civil engineering patents. Those findings confirm expectations on task-technology links and suggest the validity of our mapping.
Appendix D 4IR exposure sub scores
D.1 Example exposure of occupation to 4IR sub-scores
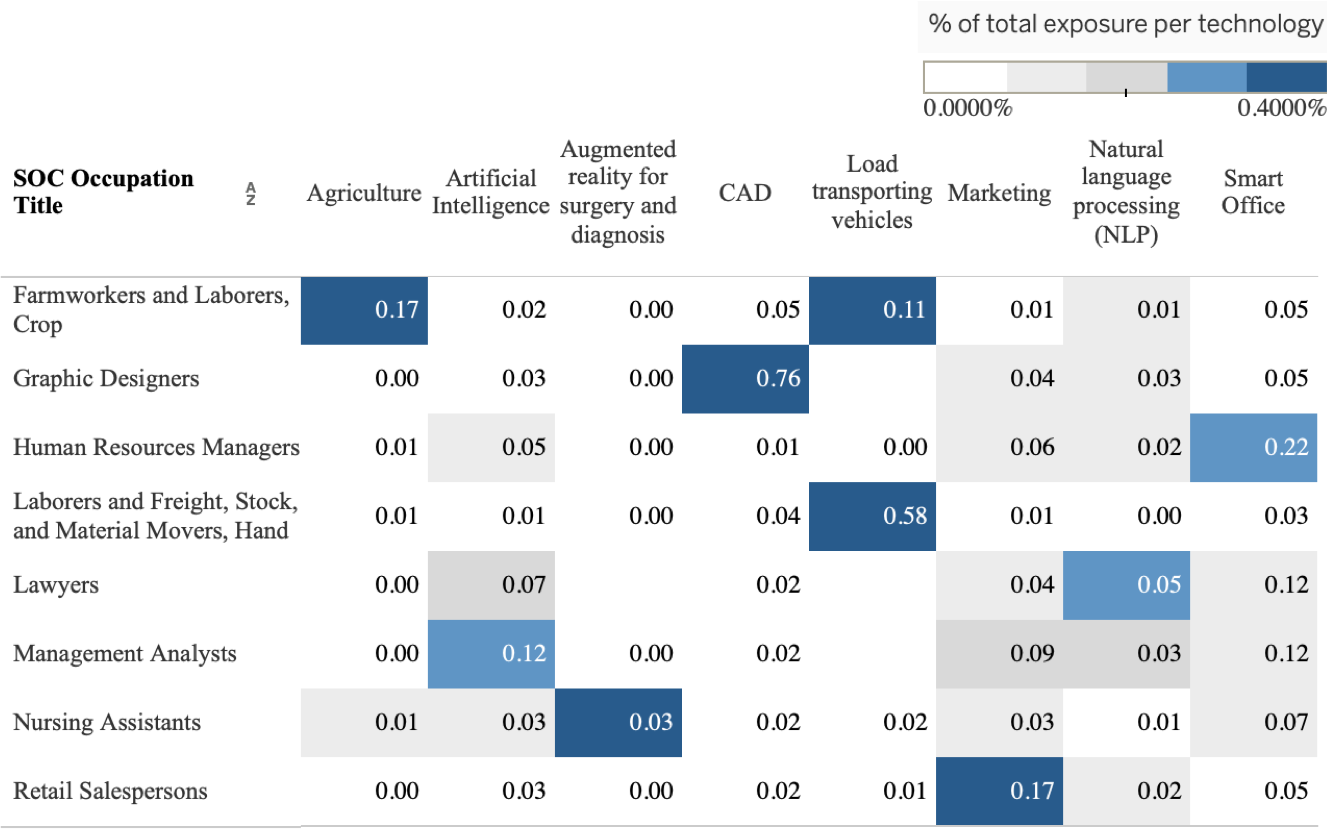
D.2 4IR exposure sub scores and Webb patent exposure
Appendix E Exposure to non-4IR patents
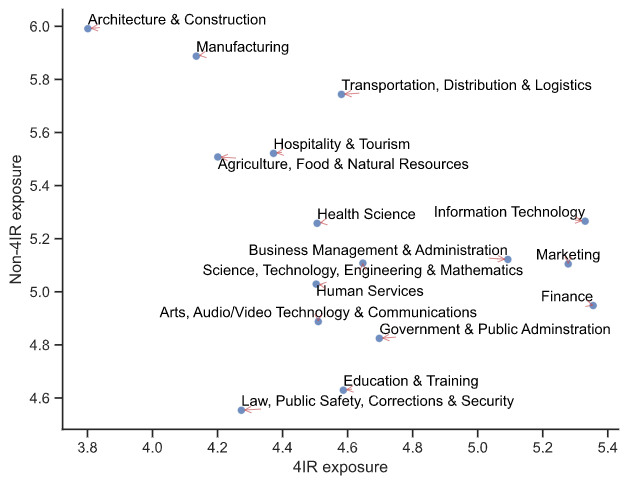
Appendix F Education and patent exposure
Figure 15 describes the exposure to patents per education level for non-4IR patents and 4IR patents. The analysis shows that non-4IR patents show an inverse correlation to education level, whereas 4IR exposure is highest for medium-to-high education levels.


Webb [2019] found that exposure to robot and software patents is inversely correlated to education level and is lowest for low-education occupations. This pattern is similar to our exposure scores to non-4IR patents. Webb’s AI patent exposure is higher for higher-educated occupations, whereas 4IR exposure scores are highest for medium-to-high occupations.
Appendix G Impact of historic patent exposure on jobs
| (1) | (2) | (3) | (4) | (5) | |
| 4IR exposure 1982 | -0.10** (-2.00) | ||||
| 4IR exposure 19822 | -0.07** (-2.31) | ||||
| 4IR exposure 1992 | -0.05 (-1.18) | ||||
| 4IR exposure19922 | -0.11*** (-4.23) | ||||
| 4IR exposure 2002 | -0.07 (-1.42) | ||||
| 4IR exposure 20022 | -0.12*** (-3.76) | ||||
| 4IR exposure 2007 | -0.07 (-1.38) | ||||
| 4IR exposure 20072 | -0.12*** (-3.70) | ||||
| 4IR exposure 2012 | -0.07 (-1.44) | ||||
| 4IR exposure 20122 | -0.11*** (-3.60) | ||||
| Industry Education | Yes | Yes | Yes | Yes | Yes |
| Adj. R2 | 0.102 | 0.117 | 0.107 | 0.105 | 0.103 |
Note: Analysis of 720 observations based on BLS labor market data from 2011 and 2018. Controls IE indicates that industry and education (Job Zone) controls were included. Industry share relates to the industry share of the occupation in 2011. * p<0.10, ** p<0.05, *** p<0.01.
| (6) | (7) | (8) | (9) | (10) | |
| 4IR exposure 1982 | -0.15*** (-3.18) | ||||
| 4IR exposure 1992 | -0.13*** (-3.00) | ||||
| 4IR exposure 2002 | -0.10** (-2.20) | ||||
| 4IR exposure 2007 | -0.10** (-2.03) | ||||
| 4IR exposure 2012 | -0.09* (-1.83) | ||||
| Industry Education | Yes | Yes | Yes | Yes | Yes |
| Adj. R2 | 0.096 | 0.095 | 0.090 | 0.089 | 0.088 |
Note: Analysis of 704 observations based on BLS labor market data from 2011 and 2018. Controls IE indicates that industry and education (Job Zone) controls were included. Industry share relates to the industry share of the occupation in 2011. * p<0.10, ** p<0.05, *** p<0.01.
| (11) | (12) | (13) | (14) | (15) | |
| 4IR exposure 1982 | -0.23*** (-6.33) | ||||
| 4IR exposure 1992 | -0.17*** (-4.61) | ||||
| 4IR exposure 2002 | -0.07* (-1.79) | ||||
| 4IR exposure 2007 | -0.05 (-1.35) | ||||
| 4IR exposure 2012 | -0.05 (-1.44) | ||||
| Industry Education | No | No | No | No | No |
| Adj. R2 | 0.053 | 0.028 | 0.003 | 0.001 | 0.002 |
Note: Analysis of 720 observations based on BLS labor market data from 2011 and 2018. Controls IE indicates that industry and education (Job Zone) controls were included. Industry share relates to the industry share of the occupation in 2011. * p<0.10, ** p<0.05, *** p<0.01.
G.1 Comparison of SML and CP scores
Figure 16 compares CP and SML scores. We group occupation scores by SOC career clusters for better readability.
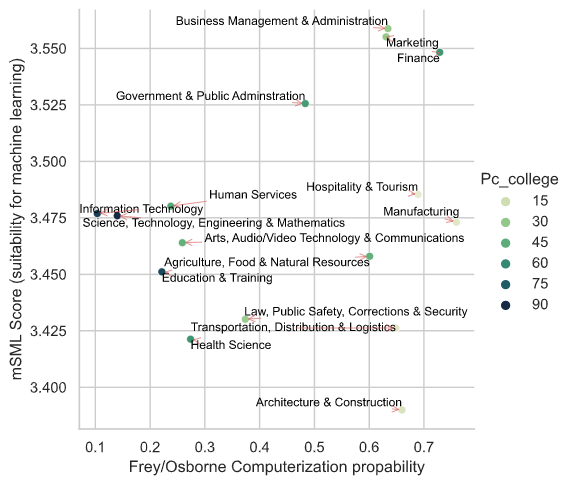
G.2 4IR exposure sub-scores per wage percentile
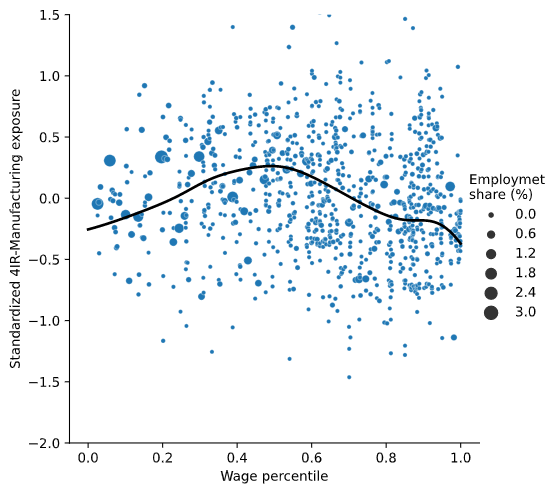
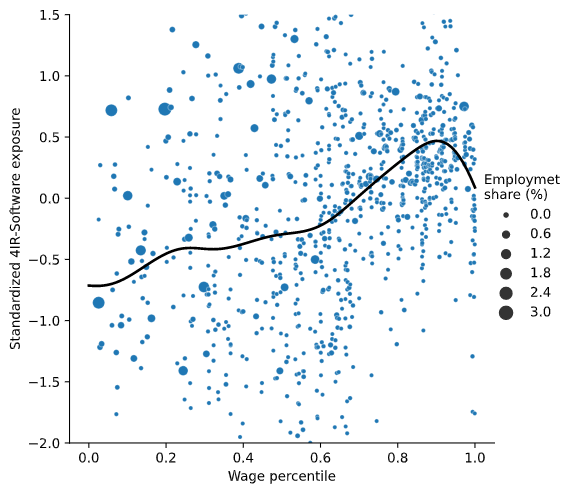
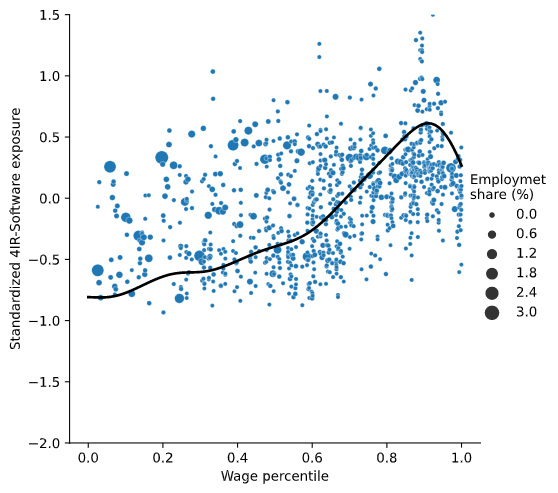
Appendix H 4IR exposure scores
Our approach maps patents to tasks, leading to task-level patent exposure scores. We aggregate those scores at an occupation level for occupation 4IR exposure scores. This section provides an overview of patent exposure scores at a task and occupation level.
H.1 Task- and activity-level 4IR exposure scores
The analysis provides exposure scores for more than 20k tasks. This section provides some example scores at a task level as well as aggregated scores at a work activity level. Table 10 shows the highest and lowest exposure scores at a work activity level. 11 shows exposure scores for randomly-selected detailed work activities.
| Work Activities Element Name | Mean 4IR exposure |
|---|---|
| Interacting With Computers | 5.76 |
| Documenting/Recording Information | 5.30 |
| Selling or Influencing Others | 4.98 |
| Processing Information | 4.97 |
| … | … |
| Controlling Machines and Processes | 4.10 |
| Repairing and Maintaining Mechanical Equipment | 4.05 |
| Staffing Organizational Units | 3.92 |
| Resolving Conflicts and Negotiating with Others | 3.82 |
| DWA Title | 4IR exposure |
|---|---|
| Develop data analysis or data management procedures. | 6.03 |
| Measure equipment outputs. | 5.70 |
| Correspond with customers to answer questions or resolve complaints. | 5.54 |
| Modify software programs to improve performance. | 5.42 |
| Manage financial activities of the organization. | 5.40 |
| Process library materials. | 4.99 |
| Develop plans for programs or services. | 4.77 |
| Monitor construction operations. | 3.98 |
| Inspect operations of green energy facilities. | 3.96 |
| Develop organizational goals or objectives. | 3.66 |
H.2 4IR exposure scores per occupation
| O*NET-SOC Code | Title | 4IR exposure |
| 43-4041.01 | Credit Authorizers | 6.13 |
| 43-9111.00 | Statistical Assistants | 6.00 |
| 15-1152.00 | Computer Network Support Specialists | 5.99 |
| 43-9021.00 | Data Entry Keyers | 5.96 |
| 43-9041.01 | Insurance Claims Clerks | 5.93 |
| 43-3031.00 | Bookkeeping, Accounting, and Auditing Clerks | 5.87 |
| 43-4071.00 | File Clerks | 5.82 |
| 43-3011.00 | Bill and Account Collectors | 5.81 |
| 43-9041.02 | Insurance Policy Processing Clerks | 5.80 |
| 41-9041.00 | Telemarketers | 5.77 |
| 41-3041.00 | Travel Agents | 5.77 |
| 43-4041.02 | Credit Checkers | 5.77 |
| 15-1199.12 | Document Management Specialists | 5.75 |
| 15-1142.00 | Network and Computer Systems Administrators | 5.72 |
| 43-3071.00 | Tellers | 5.72 |
| 13-2071.00 | Credit Counselors | 5.70 |
| 43-9111.01 | Bioinformatics Technicians | 5.70 |
| 15-1199.06 | Database Architects | 5.69 |
| 43-3021.02 | Billing, Cost, and Rate Clerks | 5.69 |
| 41-2021.00 | Counter and Rental Clerks | 5.68 |
| 41-3011.00 | Advertising Sales Agents | 5.66 |
| 15-1199.07 | Data Warehousing Specialists | 5.64 |
| 41-2011.00 | Cashiers | 5.64 |
| 43-5081.02 | Marking Clerks | 5.64 |
| 43-4131.00 | Loan Interviewers and Clerks | 5.63 |
| 13-2052.00 | Personal Financial Advisors | 5.63 |
| 41-3031.01 | Sales Agents, Securities and Commodities | 5.63 |
| 15-1199.05 | Geographic Information Systems Technicians | 5.63 |
| 15-2041.02 | Clinical Data Managers | 5.63 |
| 15-1134.00 | Web Developers | 5.60 |
| 43-9031.00 | Desktop Publishers | 5.58 |
| 41-3031.02 | Sales Agents, Financial Services | 5.57 |
| 13-2041.00 | Credit Analysts | 5.57 |
| 15-1199.04 | Geospatial Information Scientists and Technolo… | 5.56 |
| 13-1199.06 | Online Merchants | 5.56 |
| 41-9091.00 | Door-To-Door Sales Workers, News and Street Ve… | 5.55 |
| 15-1199.01 | Software Quality Assurance Engineers and Testers | 5.54 |
| 43-3041.00 | Gaming Cage Workers | 5.54 |
| 41-3021.00 | Insurance Sales Agents | 5.53 |
| 39-3012.00 | Gaming and Sports Book Writers and Runners | 5.53 |
| 15-1143.01 | Telecommunications Engineering Specialists | 5.52 |
| 43-4031.03 | License Clerks | 5.52 |
| 39-3011.00 | Gaming Dealers | 5.52 |
| 43-3051.00 | Payroll and Timekeeping Clerks | 5.51 |
| 27-4013.00 | Radio Operators | 5.51 |
| 15-1141.00 | Database Administrators | 5.50 |
| 15-2091.00 | Mathematical Technicians | 5.50 |
| 27-3043.04 | Copy Writers | 5.50 |
| 43-2021.00 | Telephone Operators | 5.50 |
| 41-2031.00 | Retail Salespersons | 5.49 |
| 27-4014.00 | Sound Engineering Technicians | 5.48 |
| 43-2011.00 | Switchboard Operators, Including Answering Ser… | 5.48 |
| 43-5041.00 | Meter Readers, Utilities | 5.48 |
| 41-4011.00 | Sales Representatives, Wholesale and Manufactu… | 5.47 |
| 15-1199.10 | Search Marketing Strategists | 5.47 |
| 15-1122.00 | Information Security Analysts | 5.47 |
| 41-2012.00 | Gaming Change Persons and Booth Cashiers | 5.46 |
| 41-2022.00 | Parts Salespersons | 5.45 |
| 43-6013.00 | Medical Secretaries | 5.44 |
| 41-4012.00 | Sales Representatives, Wholesale and Manufactu… | 5.43 |
| 43-9022.00 | Word Processors and Typists | 5.43 |
| 19-4099.03 | Remote Sensing Technicians | 5.42 |
| 43-3021.01 | Statement Clerks | 5.41 |
| 15-2041.00 | Statisticians | 5.41 |
| 43-4141.00 | New Accounts Clerks | 5.41 |
| 43-4171.00 | Receptionists and Information Clerks | 5.39 |
| 43-5031.00 | Police, Fire, and Ambulance Dispatchers | 5.39 |
| 43-5081.04 | Order Fillers, Wholesale and Retail Sales | 5.39 |
| 13-2071.01 | Loan Counselors | 5.38 |
| 41-9011.00 | Demonstrators and Product Promoters | 5.38 |
| 15-1199.03 | Web Administrators | 5.37 |
| 43-9011.00 | Computer Operators | 5.37 |
| 15-1199.02 | Computer Systems Engineers/Architects | 5.37 |
| 43-4011.00 | Brokerage Clerks | 5.37 |
| 43-4021.00 | Correspondence Clerks | 5.36 |
| 31-9094.00 | Medical Transcriptionists | 5.35 |
| 41-1012.00 | First-Line Supervisors of Non-Retail Sales Wor… | 5.35 |
| 53-3031.00 | Driver/Sales Workers | 5.34 |
| 53-2022.00 | Airfield Operations Specialists | 5.34 |
| 41-3099.01 | Energy Brokers | 5.33 |
| 43-4151.00 | Order Clerks | 5.33 |
| 41-1011.00 | First-Line Supervisors of Retail Sales Workers | 5.31 |
| 43-3061.00 | Procurement Clerks | 5.30 |
| 15-2021.00 | Mathematicians | 5.30 |
| 43-5052.00 | Postal Service Mail Carriers | 5.29 |
| 15-1132.00 | Software Developers, Applications | 5.28 |
| 15-1151.00 | Computer User Support Specialists | 5.28 |
| 15-2011.00 | Actuaries | 5.28 |
| 15-1143.00 | Computer Network Architects | 5.27 |
| 15-1199.08 | Business Intelligence Analysts | 5.27 |
| 13-2072.00 | Loan Officers | 5.27 |
| 15-1199.11 | Video Game Designers | 5.26 |
| 41-3031.03 | Securities and Commodities Traders | 5.26 |
| 41-9031.00 | Sales Engineers | 5.26 |
| 29-2032.00 | Diagnostic Medical Sonographers | 5.26 |
| 19-2099.01 | Remote Sensing Scientists and Technologists | 5.25 |
| 27-4012.00 | Broadcast Technicians | 5.25 |
| 15-1131.00 | Computer Programmers | 5.24 |
| 41-4011.07 | Solar Sales Representatives and Assessors | 5.22 |
| 15-1133.00 | Software Developers, Systems Software | 5.22 |
| 43-6012.00 | Legal Secretaries | 5.22 |
| 41-9022.00 | Real Estate Sales Agents | 5.22 |
| 13-2053.00 | Insurance Underwriters | 5.22 |
| 53-4041.00 | Subway and Streetcar Operators | 5.21 |
| 17-2072.01 | Radio Frequency Identification Device Specialists | 5.21 |
| 15-1121.00 | Computer Systems Analysts | 5.21 |
| 43-4051.00 | Customer Service Representatives | 5.20 |
| 31-9099.01 | Speech-Language Pathology Assistants | 5.20 |
| 19-4061.00 | Social Science Research Assistants | 5.20 |
| 13-1032.00 | Insurance Appraisers, Auto Damage | 5.19 |
| 21-1023.00 | Mental Health and Substance Abuse Social Workers | 5.19 |
| 19-3092.00 | Geographers | 5.19 |
| 53-2021.00 | Air Traffic Controllers | 5.17 |
| 17-3027.01 | Automotive Engineering Technicians | 5.16 |
| 13-2099.01 | Financial Quantitative Analysts | 5.16 |
| 17-3029.01 | Non-Destructive Testing Specialists | 5.16 |
| 43-4081.00 | Hotel, Motel, and Resort Desk Clerks | 5.16 |
| 43-9061.00 | Office Clerks, General | 5.16 |
| 43-5032.00 | Dispatchers, Except Police, Fire, and Ambulance | 5.16 |
| 13-2081.00 | Tax Examiners and Collectors, and Revenue Agents | 5.16 |
| 53-7071.00 | Gas Compressor and Gas Pumping Station Operators | 5.15 |
| 15-1121.01 | Informatics Nurse Specialists | 5.15 |
| 43-6014.00 | Secretaries and Administrative Assistants, Exc… | 5.14 |
| 15-2041.01 | Biostatisticians | 5.14 |
| 21-1015.00 | Rehabilitation Counselors | 5.13 |
| 43-5081.03 | Stock Clerks- Stockroom, Warehouse, or Storage… | 5.12 |
| 43-4061.00 | Eligibility Interviewers, Government Programs | 5.12 |
| 13-2011.02 | Auditors | 5.12 |
| 43-5061.00 | Production, Planning, and Expediting Clerks | 5.11 |
| 17-3029.10 | Fuel Cell Technicians | 5.10 |
| 53-3021.00 | Bus Drivers, Transit and Intercity | 5.10 |
| 21-1022.00 | Healthcare Social Workers | 5.10 |
| 13-1051.00 | Cost Estimators | 5.10 |
| 43-4111.00 | Interviewers, Except Eligibility and Loan | 5.09 |
| 51-8012.00 | Power Distributors and Dispatchers | 5.09 |
| 17-2199.05 | Mechatronics Engineers | 5.08 |
| 25-4031.00 | Library Technicians | 5.08 |
| 43-4121.00 | Library Assistants, Clerical | 5.08 |
| 13-2051.00 | Financial Analysts | 5.08 |
| 53-6041.00 | Traffic Technicians | 5.08 |
| 21-1093.00 | Social and Human Service Assistants | 5.08 |
| 53-3041.00 | Taxi Drivers and Chauffeurs | 5.07 |
| 29-2099.05 | Ophthalmic Medical Technologists | 5.07 |
| 15-2031.00 | Operations Research Analysts | 5.07 |
| 13-1081.02 | Logistics Analysts | 5.06 |
| 13-2021.01 | Assessors | 5.06 |
| 43-5081.01 | Stock Clerks, Sales Floor | 5.05 |
| 53-6021.00 | Parking Lot Attendants | 5.05 |
| 21-1014.00 | Mental Health Counselors | 5.05 |
| 13-2082.00 | Tax Preparers | 5.05 |
| 13-1022.00 | Wholesale and Retail Buyers, Except Farm Products | 5.04 |
| 21-1013.00 | Marriage and Family Therapists | 5.04 |
| 13-1021.00 | Buyers and Purchasing Agents, Farm Products | 5.03 |
| 19-4041.01 | Geophysical Data Technicians | 5.03 |
| 41-9021.00 | Real Estate Brokers | 5.03 |
| 17-2199.07 | Photonics Engineers | 5.02 |
| 13-2099.03 | Investment Underwriters | 5.02 |
| 21-1091.00 | Health Educators | 5.02 |
| 19-4099.02 | Precision Agriculture Technicians | 5.01 |
| 43-4181.00 | Reservation and Transportation Ticket Agents a… | 5.01 |
| 19-4061.01 | City and Regional Planning Aides | 5.01 |
| 29-2099.06 | Radiologic Technicians | 5.01 |
| 53-3033.00 | Light Truck or Delivery Services Drivers | 5.01 |
| 27-3031.00 | Public Relations Specialists | 5.00 |
| 11-3031.01 | Treasurers and Controllers | 5.00 |
| 53-6061.00 | Transportation Attendants, Except Flight Atten… | 5.00 |
| 11-1021.00 | General and Operations Managers | 5.00 |
| 25-9011.00 | Audio-Visual and Multimedia Collections Specia… | 5.00 |
| 53-2012.00 | Commercial Pilots | 5.00 |
| 13-2011.01 | Accountants | 5.00 |
| 43-4161.00 | Human Resources Assistants, Except Payroll and… | 4.99 |
| 53-2011.00 | Airline Pilots, Copilots, and Flight Engineers | 4.99 |
| 21-1021.00 | Child, Family, and School Social Workers | 4.98 |
| 29-2035.00 | Magnetic Resonance Imaging Technologists | 4.98 |
| 43-5051.00 | Postal Service Clerks | 4.97 |
| 29-2034.00 | Radiologic Technologists | 4.97 |
| 27-3012.00 | Public Address System and Other Announcers | 4.97 |
| 53-3022.00 | Bus Drivers, School or Special Client | 4.97 |
| 13-1011.00 | Agents and Business Managers of Artists, Perfo… | 4.97 |
| 17-2031.00 | Biomedical Engineers | 4.96 |
| 17-2199.02 | Validation Engineers | 4.96 |
| 11-9071.00 | Gaming Managers | 4.96 |
| 13-2099.02 | Risk Management Specialists | 4.95 |
| 13-1031.01 | Claims Examiners, Property and Casualty Insurance | 4.95 |
| 19-4041.02 | Geological Sample Test Technicians | 4.95 |
| 11-2031.00 | Public Relations and Fundraising Managers | 4.95 |
| 29-2031.00 | Cardiovascular Technologists and Technicians | 4.95 |
| 43-9081.00 | Proofreaders and Copy Markers | 4.95 |
| 43-6011.00 | Executive Secretaries and Executive Administra… | 4.95 |
| 29-2071.00 | Medical Records and Health Information Technic… | 4.94 |
| 21-1011.00 | Substance Abuse and Behavioral Disorder Counse… | 4.94 |
| 27-3021.00 | Broadcast News Analysts | 4.94 |
| 43-5021.00 | Couriers and Messengers | 4.93 |
| 17-3031.02 | Mapping Technicians | 4.93 |
| 53-2031.00 | Flight Attendants | 4.93 |
| 17-1021.00 | Cartographers and Photogrammetrists | 4.93 |
| 19-3022.00 | Survey Researchers | 4.93 |
| 19-1029.01 | Bioinformatics Scientists | 4.93 |
| 53-4031.00 | Railroad Conductors and Yardmasters | 4.93 |
| 13-1121.00 | Meeting, Convention, and Event Planners | 4.92 |
| 53-6031.00 | Automotive and Watercraft Service Attendants | 4.91 |
| 17-2199.08 | Robotics Engineers | 4.91 |
| 27-3011.00 | Radio and Television Announcers | 4.90 |
| 17-3029.04 | Electronics Engineering Technologists | 4.90 |
| 39-1011.00 | Gaming Supervisors | 4.90 |
| 25-4011.00 | Archivists | 4.90 |
| 27-4011.00 | Audio and Video Equipment Technicians | 4.90 |
| 11-9199.07 | Security Managers | 4.90 |
| 11-2011.01 | Green Marketers | 4.89 |
| 27-4032.00 | Film and Video Editors | 4.89 |
| 17-2141.01 | Fuel Cell Engineers | 4.89 |
| 29-2057.00 | Ophthalmic Medical Technicians | 4.89 |
| 21-1094.00 | Community Health Workers | 4.88 |
| 43-5111.00 | Weighers, Measurers, Checkers, and Samplers, R… | 4.88 |
| 13-2021.02 | Appraisers, Real Estate | 4.88 |
| 27-3022.00 | Reporters and Correspondents | 4.88 |
| 11-9199.03 | Investment Fund Managers | 4.88 |
| 13-2031.00 | Budget Analysts | 4.87 |
| 53-6051.07 | Transportation Vehicle, Equipment and Systems … | 4.87 |
| 11-9039.01 | Distance Learning Coordinators | 4.87 |
| 43-9071.00 | Office Machine Operators, Except Computer | 4.87 |
| 25-9031.01 | Instructional Designers and Technologists | 4.86 |
| 43-5011.00 | Cargo and Freight Agents | 4.85 |
| 17-3029.06 | Manufacturing Engineering Technologists | 4.85 |
| 17-3029.05 | Industrial Engineering Technologists | 4.85 |
| 29-2081.00 | Opticians, Dispensing | 4.85 |
| 25-4021.00 | Librarians | 4.85 |
| 11-9061.00 | Funeral Service Managers | 4.85 |
| 17-2141.02 | Automotive Engineers | 4.85 |
| 19-3093.00 | Historians | 4.85 |
| 11-3031.02 | Financial Managers, Branch or Department | 4.84 |
| 27-4021.00 | Photographers | 4.84 |
| 21-1012.00 | Educational, Guidance, School, and Vocational … | 4.84 |
| 49-2097.00 | Electronic Home Entertainment Equipment Instal… | 4.84 |
| 17-2041.00 | Chemical Engineers | 4.84 |
| 13-1111.00 | Management Analysts | 4.83 |
| 53-6051.08 | Freight and Cargo Inspectors | 4.82 |
| 43-4031.02 | Municipal Clerks | 4.82 |
| 29-1071.00 | Physician Assistants | 4.82 |
| 11-9199.08 | Loss Prevention Managers | 4.82 |
| 29-2052.00 | Pharmacy Technicians | 4.82 |
| 17-2072.00 | Electronics Engineers, Except Computer | 4.82 |
| 13-1023.00 | Purchasing Agents, Except Wholesale, Retail, a… | 4.81 |
| 29-1122.01 | Low Vision Therapists, Orientation and Mobilit… | 4.81 |
| 17-2199.03 | Energy Engineers | 4.81 |
| 29-1051.00 | Pharmacists | 4.81 |
| 53-6051.01 | Aviation Inspectors | 4.80 |
| 13-1031.02 | Insurance Adjusters, Examiners, and Investigators | 4.80 |
| 17-3029.03 | Electromechanical Engineering Technologists | 4.80 |
| 13-1131.00 | Fundraisers | 4.79 |
| 25-9021.00 | Farm and Home Management Advisors | 4.79 |
| 19-1031.03 | Park Naturalists | 4.78 |
| 39-1021.01 | Spa Managers | 4.78 |
| 39-3091.00 | Amusement and Recreation Attendants | 4.78 |
| 27-1024.00 | Graphic Designers | 4.78 |
| 43-1011.00 | First-Line Supervisors of Office and Administr… | 4.78 |
| 29-1126.00 | Respiratory Therapists | 4.78 |
| 17-3023.01 | Electronics Engineering Technicians | 4.78 |
| 33-9091.00 | Crossing Guards | 4.78 |
| 11-9081.00 | Lodging Managers | 4.77 |
| 29-1141.03 | Critical Care Nurses | 4.77 |
| 33-9031.00 | Gaming Surveillance Officers and Gaming Invest… | 4.77 |
| 17-2141.00 | Mechanical Engineers | 4.76 |
| 49-9021.01 | Heating and Air Conditioning Mechanics and Ins… | 4.76 |
| 49-2093.00 | Electrical and Electronics Installers and Repa… | 4.75 |
| 13-1161.00 | Market Research Analysts and Marketing Special… | 4.75 |
| 39-3031.00 | Ushers, Lobby Attendants, and Ticket Takers | 4.75 |
| 43-4031.01 | Court Clerks | 4.75 |
| 53-1011.00 | Aircraft Cargo Handling Supervisors | 4.75 |
| 49-3023.02 | Automotive Specialty Technicians | 4.74 |
| 43-5011.01 | Freight Forwarders | 4.74 |
| 19-4021.00 | Biological Technicians | 4.74 |
| 17-2061.00 | Computer Hardware Engineers | 4.74 |
| 11-3071.03 | Logistics Managers | 4.74 |
| 49-2011.00 | Computer, Automated Teller, and Office Machine… | 4.74 |
| 29-2099.01 | Neurodiagnostic Technologists | 4.73 |
| 51-8013.00 | Power Plant Operators | 4.73 |
| 29-1125.01 | Art Therapists | 4.73 |
| 19-2032.00 | Materials Scientists | 4.73 |
| 13-1199.02 | Security Management Specialists | 4.73 |
| 19-4091.00 | Environmental Science and Protection Technicia… | 4.73 |
| 17-3021.00 | Aerospace Engineering and Operations Technicians | 4.73 |
| 27-1026.00 | Merchandise Displayers and Window Trimmers | 4.73 |
| 49-9091.00 | Coin, Vending, and Amusement Machine Servicers… | 4.72 |
| 19-3031.03 | Counseling Psychologists | 4.72 |
| 15-1111.00 | Computer and Information Research Scientists | 4.72 |
| 27-2023.00 | Umpires, Referees, and Other Sports Officials | 4.72 |
| 29-1125.00 | Recreational Therapists | 4.72 |
| 33-3041.00 | Parking Enforcement Workers | 4.72 |
| 33-3021.06 | Intelligence Analysts | 4.72 |
| 39-1012.00 | Slot Supervisors | 4.71 |
| 17-3029.12 | Nanotechnology Engineering Technicians | 4.71 |
| 29-2054.00 | Respiratory Therapy Technicians | 4.71 |
| 29-1124.00 | Radiation Therapists | 4.71 |
| 43-4051.03 | Patient Representatives | 4.71 |
| 11-2021.00 | Marketing Managers | 4.71 |
| 53-7073.00 | Wellhead Pumpers | 4.70 |
| 13-1041.02 | Licensing Examiners and Inspectors | 4.70 |
| 29-1011.00 | Chiropractors | 4.70 |
| 43-5071.00 | Shipping, Receiving, and Traffic Clerks | 4.70 |
| 29-2092.00 | Hearing Aid Specialists | 4.69 |
| 29-1181.00 | Audiologists | 4.69 |
| 13-1199.04 | Business Continuity Planners | 4.69 |
| 29-1128.00 | Exercise Physiologists | 4.69 |
| 13-1199.01 | Energy Auditors | 4.69 |
| 17-3026.00 | Industrial Engineering Technicians | 4.69 |
| 11-9131.00 | Postmasters and Mail Superintendents | 4.68 |
| 11-9031.00 | Education Administrators, Preschool and Childc… | 4.68 |
| 49-2098.00 | Security and Fire Alarm Systems Installers | 4.68 |
| 11-9051.00 | Food Service Managers | 4.68 |
| 11-1011.03 | Chief Sustainability Officers | 4.68 |
| 11-3061.00 | Purchasing Managers | 4.67 |
| 17-3029.02 | Electrical Engineering Technologists | 4.67 |
| 13-1081.01 | Logistics Engineers | 4.67 |
| 29-1141.02 | Advanced Practice Psychiatric Nurses | 4.67 |
| 53-3032.00 | Heavy and Tractor-Trailer Truck Drivers | 4.67 |
| 29-1125.02 | Music Therapists | 4.67 |
| 11-2011.00 | Advertising and Promotions Managers | 4.67 |
| 17-3027.00 | Mechanical Engineering Technicians | 4.67 |
| 29-1066.00 | Psychiatrists | 4.67 |
| 25-2059.01 | Adapted Physical Education Specialists | 4.67 |
| 17-3025.00 | Environmental Engineering Technicians | 4.66 |
| 17-2199.06 | Microsystems Engineers | 4.66 |
| 17-3029.07 | Mechanical Engineering Technologists | 4.66 |
| 51-6091.00 | Extruding and Forming Machine Setters, Operato… | 4.66 |
| 27-4031.00 | Camera Operators, Television, Video, and Motio… | 4.66 |
| 51-4012.00 | Computer Numerically Controlled Machine Tool P… | 4.66 |
| 11-2022.00 | Sales Managers | 4.66 |
| 43-5053.00 | Postal Service Mail Sorters, Processors, and P… | 4.66 |
| 49-2094.00 | Electrical and Electronics Repairers, Commerci… | 4.66 |
| 29-1141.00 | Registered Nurses | 4.66 |
| 31-9011.00 | Massage Therapists | 4.66 |
| 51-6092.00 | Fabric and Apparel Patternmakers | 4.65 |
| 13-2099.04 | Fraud Examiners, Investigators and Analysts | 4.65 |
| 31-9095.00 | Pharmacy Aides | 4.65 |
| 19-2021.00 | Atmospheric and Space Scientists | 4.65 |
| 53-6011.00 | Bridge and Lock Tenders | 4.65 |
| 17-2112.00 | Industrial Engineers | 4.65 |
| 11-3021.00 | Computer and Information Systems Managers | 4.65 |
| 29-1061.00 | Anesthesiologists | 4.65 |
| 29-1127.00 | Speech-Language Pathologists | 4.64 |
| 17-2071.00 | Electrical Engineers | 4.64 |
| 33-9032.00 | Security Guards | 4.64 |
| 51-8093.00 | Petroleum Pump System Operators, Refinery Oper… | 4.64 |
| 53-7072.00 | Pump Operators, Except Wellhead Pumpers | 4.64 |
| 53-5031.00 | Ship Engineers | 4.64 |
| 39-5093.00 | Shampooers | 4.64 |
| 17-2199.11 | Solar Energy Systems Engineers | 4.64 |
| 13-2061.00 | Financial Examiners | 4.64 |
| 19-4051.02 | Nuclear Monitoring Technicians | 4.63 |
| 49-9099.01 | Geothermal Technicians | 4.63 |
| 53-5021.03 | Pilots, Ship | 4.63 |
| 11-9161.00 | Emergency Management Directors | 4.63 |
| 27-1023.00 | Floral Designers | 4.62 |
| 33-9093.00 | Transportation Security Screeners | 4.62 |
| 29-2041.00 | Emergency Medical Technicians and Paramedics | 4.62 |
| 29-1141.04 | Clinical Nurse Specialists | 4.62 |
| 17-3024.01 | Robotics Technicians | 4.62 |
| 29-2055.00 | Surgical Technologists | 4.62 |
| 17-2121.01 | Marine Engineers | 4.62 |
| 29-1069.04 | Neurologists | 4.62 |
| 17-2131.00 | Materials Engineers | 4.62 |
| 17-1022.01 | Geodetic Surveyors | 4.61 |
| 49-2091.00 | Avionics Technicians | 4.61 |
| 25-9041.00 | Teacher Assistants | 4.61 |
| 31-9093.00 | Medical Equipment Preparers | 4.61 |
| 51-1011.00 | First-Line Supervisors of Production and Opera… | 4.61 |
| 29-1069.09 | Preventive Medicine Physicians | 4.61 |
| 35-9031.00 | Hosts and Hostesses, Restaurant, Lounge, and C… | 4.61 |
| 13-1141.00 | Compensation, Benefits, and Job Analysis Speci… | 4.61 |
| 19-4093.00 | Forest and Conservation Technicians | 4.61 |
| 53-4021.00 | Railroad Brake, Signal, and Switch Operators | 4.61 |
| 17-2011.00 | Aerospace Engineers | 4.60 |
| 53-1031.00 | First-Line Supervisors of Transportation and M… | 4.60 |
| 19-4099.01 | Quality Control Analysts | 4.60 |
| 29-2053.00 | Psychiatric Technicians | 4.60 |
| 51-8099.02 | Methane/Landfill Gas Generation System Technic… | 4.59 |
| 11-9111.00 | Medical and Health Services Managers | 4.59 |
| 29-9092.00 | Genetic Counselors | 4.59 |
| 51-5112.00 | Printing Press Operators | 4.59 |
| 11-9121.01 | Clinical Research Coordinators | 4.59 |
| 29-1123.00 | Physical Therapists | 4.59 |
| 33-9099.02 | Retail Loss Prevention Specialists | 4.59 |
| 51-8011.00 | Nuclear Power Reactor Operators | 4.59 |
| 51-4011.00 | Computer-Controlled Machine Tool Operators, Me… | 4.59 |
| 17-3029.08 | Photonics Technicians | 4.59 |
| 11-3071.01 | Transportation Managers | 4.59 |
| 19-3041.00 | Sociologists | 4.59 |
| 11-9032.00 | Education Administrators, Elementary and Secon… | 4.59 |
| 49-2095.00 | Electrical and Electronics Repairers, Powerhou… | 4.59 |
| 27-3091.00 | Interpreters and Translators | 4.58 |
| 39-6012.00 | Concierges | 4.58 |
| 29-1199.05 | Orthoptists | 4.58 |
| 17-2151.00 | Mining and Geological Engineers, Including Min… | 4.58 |
| 29-1069.01 | Allergists and Immunologists | 4.58 |
| 31-9092.00 | Medical Assistants | 4.57 |
| 29-9099.01 | Midwives | 4.57 |
| 49-2096.00 | Electronic Equipment Installers and Repairers,… | 4.57 |
| 47-2231.00 | Solar Photovoltaic Installers | 4.57 |
| 19-3032.00 | Industrial-Organizational Psychologists | 4.57 |
| 11-1011.00 | Chief Executives | 4.57 |
| 53-1021.01 | Recycling Coordinators | 4.57 |
| 29-1069.03 | Hospitalists | 4.56 |
| 31-2012.00 | Occupational Therapy Aides | 4.56 |
| 23-2093.00 | Title Examiners, Abstractors, and Searchers | 4.56 |
| 33-9021.00 | Private Detectives and Investigators | 4.56 |
| 29-1122.00 | Occupational Therapists | 4.56 |
| 17-2112.01 | Human Factors Engineers and Ergonomists | 4.56 |
| 29-2061.00 | Licensed Practical and Licensed Vocational Nurses | 4.56 |
| 11-9199.02 | Compliance Managers | 4.56 |
| 39-9032.00 | Recreation Workers | 4.56 |
| 53-1021.00 | First-Line Supervisors of Helpers, Laborers, a… | 4.55 |
| 11-9141.00 | Property, Real Estate, and Community Associati… | 4.55 |
| 29-1141.01 | Acute Care Nurses | 4.55 |
| 25-3099.02 | Tutors | 4.55 |
| 25-4012.00 | Curators | 4.55 |
| 11-9151.00 | Social and Community Service Managers | 4.55 |
| 51-8092.00 | Gas Plant Operators | 4.54 |
| 11-3051.00 | Industrial Production Managers | 4.54 |
| 17-2051.01 | Transportation Engineers | 4.54 |
| 25-3011.00 | Adult Basic and Secondary Education and Litera… | 4.54 |
| 53-4013.00 | Rail Yard Engineers, Dinkey Operators, and Hos… | 4.54 |
| 25-4013.00 | Museum Technicians and Conservators | 4.54 |
| 53-7061.00 | Cleaners of Vehicles and Equipment | 4.54 |
| 45-4023.00 | Log Graders and Scalers | 4.53 |
| 13-1199.05 | Sustainability Specialists | 4.53 |
| 11-3071.02 | Storage and Distribution Managers | 4.53 |
| 39-7011.00 | Tour Guides and Escorts | 4.53 |
| 21-2011.00 | Clergy | 4.53 |
| 27-2042.02 | Musicians, Instrumental | 4.53 |
| 17-2199.04 | Manufacturing Engineers | 4.53 |
| 29-1161.00 | Nurse Midwives | 4.53 |
| 51-8031.00 | Water and Wastewater Treatment Plant and Syste… | 4.53 |
| 49-1011.00 | First-Line Supervisors of Mechanics, Installer… | 4.53 |
| 17-2199.01 | Biochemical Engineers | 4.53 |
| 17-2199.10 | Wind Energy Engineers | 4.53 |
| 19-4011.02 | Food Science Technicians | 4.53 |
| 51-2092.00 | Team Assemblers | 4.53 |
| 19-3091.01 | Anthropologists | 4.52 |
| 11-3051.01 | Quality Control Systems Managers | 4.52 |
| 29-2056.00 | Veterinary Technologists and Technicians | 4.52 |
| 29-1071.01 | Anesthesiologist Assistants | 4.52 |
| 49-9081.00 | Wind Turbine Service Technicians | 4.52 |
| 11-9121.00 | Natural Sciences Managers | 4.52 |
| 39-1021.00 | First-Line Supervisors of Personal Service Wor… | 4.52 |
| 17-3012.01 | Electronic Drafters | 4.52 |
| 17-2021.00 | Agricultural Engineers | 4.52 |
| 19-3031.01 | School Psychologists | 4.51 |
| 17-3024.00 | Electro-Mechanical Technicians | 4.51 |
| 29-2033.00 | Nuclear Medicine Technologists | 4.51 |
| 19-4051.01 | Nuclear Equipment Operation Technicians | 4.51 |
| 53-7111.00 | Mine Shuttle Car Operators | 4.51 |
| 17-2081.00 | Environmental Engineers | 4.51 |
| 17-3023.03 | Electrical Engineering Technicians | 4.51 |
| 11-9121.02 | Water Resource Specialists | 4.51 |
| 43-9051.00 | Mail Clerks and Mail Machine Operators, Except… | 4.51 |
| 25-2023.00 | Career/Technical Education Teachers, Middle Sc… | 4.50 |
| 11-9199.09 | Wind Energy Operations Managers | 4.50 |
| 17-2081.01 | Water/Wastewater Engineers | 4.50 |
| 25-3021.00 | Self-Enrichment Education Teachers | 4.50 |
| 29-1067.00 | Surgeons | 4.50 |
| 29-1023.00 | Orthodontists | 4.50 |
| 53-4012.00 | Locomotive Firers | 4.50 |
| 47-2111.00 | Electricians | 4.50 |
| 15-1199.09 | Information Technology Project Managers | 4.50 |
| 35-1012.00 | First-Line Supervisors of Food Preparation and… | 4.50 |
| 13-1151.00 | Training and Development Specialists | 4.49 |
| 27-2012.03 | Program Directors | 4.49 |
| 29-1069.02 | Dermatologists | 4.49 |
| 33-3052.00 | Transit and Railroad Police | 4.49 |
| 53-3011.00 | Ambulance Drivers and Attendants, Except Emerg… | 4.49 |
| 11-9039.02 | Fitness and Wellness Coordinators | 4.49 |
| 31-2011.00 | Occupational Therapy Assistants | 4.49 |
| 27-2041.04 | Music Composers and Arrangers | 4.49 |
| 49-2022.00 | Telecommunications Equipment Installers and Re… | 4.49 |
| 29-1069.10 | Radiologists | 4.49 |
| 51-9011.00 | Chemical Equipment Operators and Tenders | 4.49 |
| 39-6011.00 | Baggage Porters and Bellhops | 4.49 |
| 29-1069.06 | Ophthalmologists | 4.48 |
| 13-1041.01 | Environmental Compliance Inspectors | 4.48 |
| 25-2021.00 | Elementary School Teachers, Except Special Edu… | 4.48 |
| 11-9199.01 | Regulatory Affairs Managers | 4.48 |
| 13-1199.03 | Customs Brokers | 4.48 |
| 19-3031.02 | Clinical Psychologists | 4.48 |
| 13-1081.00 | Logisticians | 4.48 |
| 51-8021.00 | Stationary Engineers and Boiler Operators | 4.48 |
| 21-1092.00 | Probation Officers and Correctional Treatment … | 4.48 |
| 53-4011.00 | Locomotive Engineers | 4.48 |
| 19-2041.01 | Climate Change Analysts | 4.47 |
| 27-2021.00 | Athletes and Sports Competitors | 4.47 |
| 53-7081.00 | Refuse and Recyclable Material Collectors | 4.47 |
| 35-1011.00 | Chefs and Head Cooks | 4.47 |
| 29-1199.04 | Naturopathic Physicians | 4.47 |
| 17-2171.00 | Petroleum Engineers | 4.47 |
| 25-2032.00 | Career/Technical Education Teachers, Secondary… | 4.47 |
| 29-1065.00 | Pediatricians, General | 4.46 |
| 25-1194.00 | Vocational Education Teachers, Postsecondary | 4.46 |
| 39-9021.00 | Personal Care Aides | 4.46 |
| 25-1081.00 | Education Teachers, Postsecondary | 4.46 |
| 25-2031.00 | Secondary School Teachers, Except Special and … | 4.46 |
| 29-1069.08 | Physical Medicine and Rehabilitation Physicians | 4.46 |
| 25-2022.00 | Middle School Teachers, Except Special and Car… | 4.46 |
| 29-1171.00 | Nurse Practitioners | 4.46 |
| 11-3111.00 | Compensation and Benefits Managers | 4.46 |
| 25-1123.00 | English Language and Literature Teachers, Post… | 4.45 |
| 31-2022.00 | Physical Therapist Aides | 4.45 |
| 31-1013.00 | Psychiatric Aides | 4.45 |
| 25-1111.00 | Criminal Justice and Law Enforcement Teachers,… | 4.45 |
| 11-3011.00 | Administrative Services Managers | 4.44 |
| 25-1051.00 | Atmospheric, Earth, Marine, and Space Sciences… | 4.44 |
| 25-2052.00 | Special Education Teachers, Kindergarten and E… | 4.44 |
| 13-1071.00 | Human Resources Specialists | 4.44 |
| 25-1082.00 | Library Science Teachers, Postsecondary | 4.44 |
| 11-9199.11 | Brownfield Redevelopment Specialists and Site … | 4.44 |
| 25-1126.00 | Philosophy and Religion Teachers, Postsecondary | 4.43 |
| 39-7012.00 | Travel Guides | 4.43 |
| 47-1011.00 | First-Line Supervisors of Construction Trades … | 4.43 |
| 25-1022.00 | Mathematical Science Teachers, Postsecondary | 4.43 |
| 11-9199.04 | Supply Chain Managers | 4.43 |
| 29-1062.00 | Family and General Practitioners | 4.43 |
| 25-1063.00 | Economics Teachers, Postsecondary | 4.43 |
| 25-1065.00 | Political Science Teachers, Postsecondary | 4.43 |
| 25-1064.00 | Geography Teachers, Postsecondary | 4.43 |
| 25-1031.00 | Architecture Teachers, Postsecondary | 4.43 |
| 25-9031.00 | Instructional Coordinators | 4.42 |
| 27-3042.00 | Technical Writers | 4.42 |
| 25-1124.00 | Foreign Language and Literature Teachers, Post… | 4.42 |
| 25-1192.00 | Home Economics Teachers, Postsecondary | 4.42 |
| 39-9031.00 | Fitness Trainers and Aerobics Instructors | 4.42 |
| 25-1193.00 | Recreation and Fitness Studies Teachers, Posts… | 4.42 |
| 51-2022.00 | Electrical and Electronic Equipment Assemblers | 4.42 |
| 31-9097.00 | Phlebotomists | 4.42 |
| 25-1112.00 | Law Teachers, Postsecondary | 4.41 |
| 17-3029.09 | Manufacturing Production Technicians | 4.41 |
| 25-1125.00 | History Teachers, Postsecondary | 4.41 |
| 17-1022.00 | Surveyors | 4.41 |
| 25-1021.00 | Computer Science Teachers, Postsecondary | 4.41 |
| 51-9061.00 | Inspectors, Testers, Sorters, Samplers, and We… | 4.41 |
| 25-1011.00 | Business Teachers, Postsecondary | 4.41 |
| 25-1062.00 | Area, Ethnic, and Cultural Studies Teachers, P… | 4.40 |
| 25-1043.00 | Forestry and Conservation Science Teachers, Po… | 4.40 |
| 29-1131.00 | Veterinarians | 4.40 |
| 25-1113.00 | Social Work Teachers, Postsecondary | 4.40 |
| 53-7063.00 | Machine Feeders and Offbearers | 4.40 |
| 51-5111.00 | Prepress Technicians and Workers | 4.40 |
| 11-3051.04 | Biomass Power Plant Managers | 4.40 |
| 25-1067.00 | Sociology Teachers, Postsecondary | 4.40 |
| 21-2021.00 | Directors, Religious Activities and Education | 4.40 |
| 49-2021.00 | Radio, Cellular, and Tower Equipment Installer… | 4.40 |
| 27-2042.01 | Singers | 4.40 |
| 29-1063.00 | Internists, General | 4.40 |
| 25-1053.00 | Environmental Science Teachers, Postsecondary | 4.40 |
| 49-3031.00 | Bus and Truck Mechanics and Diesel Engine Spec… | 4.39 |
| 53-5021.01 | Ship and Boat Captains | 4.39 |
| 25-1032.00 | Engineering Teachers, Postsecondary | 4.39 |
| 25-1072.00 | Nursing Instructors and Teachers, Postsecondary | 4.39 |
| 33-3051.01 | Police Patrol Officers | 4.39 |
| 25-1054.00 | Physics Teachers, Postsecondary | 4.38 |
| 53-7064.00 | Packers and Packagers, Hand | 4.38 |
| 25-1122.00 | Communications Teachers, Postsecondary | 4.38 |
| 17-3011.01 | Architectural Drafters | 4.38 |
| 51-9021.00 | Crushing, Grinding, and Polishing Machine Sett… | 4.38 |
| 29-1031.00 | Dietitians and Nutritionists | 4.38 |
| 19-3094.00 | Political Scientists | 4.38 |
| 13-1041.06 | Coroners | 4.38 |
| 11-9033.00 | Education Administrators, Postsecondary | 4.38 |
| 45-4022.00 | Logging Equipment Operators | 4.38 |
| 17-2111.02 | Fire-Prevention and Protection Engineers | 4.38 |
| 25-1041.00 | Agricultural Sciences Teachers, Postsecondary | 4.37 |
| 39-3021.00 | Motion Picture Projectionists | 4.37 |
| 25-1071.00 | Health Specialties Teachers, Postsecondary | 4.37 |
| 29-1199.01 | Acupuncturists | 4.37 |
| 25-2051.00 | Special Education Teachers, Preschool | 4.37 |
| 17-2121.02 | Marine Architects | 4.37 |
| 31-1014.00 | Nursing Assistants | 4.37 |
| 17-3031.01 | Surveying Technicians | 4.37 |
| 19-3011.01 | Environmental Economists | 4.37 |
| 25-2053.00 | Special Education Teachers, Middle School | 4.36 |
| 31-9099.02 | Endoscopy Technicians | 4.36 |
| 25-2054.00 | Special Education Teachers, Secondary School | 4.36 |
| 51-8091.00 | Chemical Plant and System Operators | 4.36 |
| 25-1052.00 | Chemistry Teachers, Postsecondary | 4.36 |
| 51-6062.00 | Textile Cutting Machine Setters, Operators, an… | 4.36 |
| 25-1121.00 | Art, Drama, and Music Teachers, Postsecondary | 4.36 |
| 51-8099.04 | Hydroelectric Plant Technicians | 4.36 |
| 29-1069.12 | Urologists | 4.36 |
| 29-1064.00 | Obstetricians and Gynecologists | 4.36 |
| 51-2021.00 | Coil Winders, Tapers, and Finishers | 4.36 |
| 27-1014.00 | Multimedia Artists and Animators | 4.35 |
| 53-7121.00 | Tank Car, Truck, and Ship Loaders | 4.35 |
| 29-2091.00 | Orthotists and Prosthetists | 4.35 |
| 39-9041.00 | Residential Advisors | 4.35 |
| 19-2042.00 | Geoscientists, Except Hydrologists and Geograp… | 4.35 |
| 19-2012.00 | Physicists | 4.35 |
| 17-2111.03 | Product Safety Engineers | 4.35 |
| 25-1066.00 | Psychology Teachers, Postsecondary | 4.35 |
| 25-1061.00 | Anthropology and Archeology Teachers, Postseco… | 4.35 |
| 11-1031.00 | Legislators | 4.35 |
| 11-3121.00 | Human Resources Managers | 4.35 |
| 29-1151.00 | Nurse Anesthetists | 4.35 |
| 47-1011.03 | Solar Energy Installation Managers | 4.35 |
| 17-2051.00 | Civil Engineers | 4.35 |
| 25-1042.00 | Biological Science Teachers, Postsecondary | 4.34 |
| 29-9091.00 | Athletic Trainers | 4.34 |
| 19-1029.02 | Molecular and Cellular Biologists | 4.34 |
| 11-3051.02 | Geothermal Production Managers | 4.34 |
| 51-7032.00 | Patternmakers, Wood | 4.34 |
| 27-1011.00 | Art Directors | 4.34 |
| 41-9012.00 | Models | 4.34 |
| 51-9012.00 | Separating, Filtering, Clarifying, Precipitati… | 4.33 |
| 29-1069.05 | Nuclear Medicine Physicians | 4.33 |
| 51-4035.00 | Milling and Planing Machine Setters, Operators… | 4.33 |
| 19-2011.00 | Astronomers | 4.33 |
| 11-9013.02 | Farm and Ranch Managers | 4.33 |
| 25-1191.00 | Graduate Teaching Assistants | 4.33 |
| 29-1069.11 | Sports Medicine Physicians | 4.33 |
| 17-1011.00 | Architects, Except Landscape and Naval | 4.32 |
| 17-1012.00 | Landscape Architects | 4.32 |
| 49-2021.01 | Radio Mechanics | 4.32 |
| 27-1021.00 | Commercial and Industrial Designers | 4.32 |
| 25-2012.00 | Kindergarten Teachers, Except Special Education | 4.32 |
| 19-3099.01 | Transportation Planners | 4.31 |
| 27-2022.00 | Coaches and Scouts | 4.31 |
| 47-5021.00 | Earth Drillers, Except Oil and Gas | 4.31 |
| 11-9199.10 | Wind Energy Project Managers | 4.31 |
| 33-9092.00 | Lifeguards, Ski Patrol, and Other Recreational… | 4.31 |
| 51-9151.00 | Photographic Process Workers and Processing Ma… | 4.31 |
| 31-9096.00 | Veterinary Assistants and Laboratory Animal Ca… | 4.30 |
| 23-2011.00 | Paralegals and Legal Assistants | 4.30 |
| 53-7062.00 | Laborers and Freight, Stock, and Material Move… | 4.30 |
| 29-2011.01 | Cytogenetic Technologists | 4.30 |
| 19-3011.00 | Economists | 4.30 |
| 27-3041.00 | Editors | 4.30 |
| 47-3013.00 | Helpers–Electricians | 4.30 |
| 19-2043.00 | Hydrologists | 4.30 |
| 29-1069.07 | Pathologists | 4.30 |
| 31-2021.00 | Physical Therapist Assistants | 4.30 |
| 31-9091.00 | Dental Assistants | 4.29 |
| 17-3029.11 | Nanotechnology Engineering Technologists | 4.29 |
| 19-3091.02 | Archeologists | 4.29 |
| 17-2161.00 | Nuclear Engineers | 4.29 |
| 19-2041.00 | Environmental Scientists and Specialists, Incl… | 4.29 |
| 29-2099.07 | Surgical Assistants | 4.29 |
| 51-9198.00 | Helpers–Production Workers | 4.28 |
| 51-8099.03 | Biomass Plant Technicians | 4.28 |
| 11-3051.05 | Methane/Landfill Gas Collection System Operators | 4.28 |
| 17-3022.00 | Civil Engineering Technicians | 4.28 |
| 27-1022.00 | Fashion Designers | 4.28 |
| 39-3093.00 | Locker Room, Coatroom, and Dressing Room Atten… | 4.27 |
| 29-9012.00 | Occupational Health and Safety Technicians | 4.27 |
| 25-2011.00 | Preschool Teachers, Except Special Education | 4.27 |
| 27-3043.05 | Poets, Lyricists and Creative Writers | 4.27 |
| 11-9041.00 | Architectural and Engineering Managers | 4.27 |
| 19-1029.03 | Geneticists | 4.26 |
| 29-9011.00 | Occupational Health and Safety Specialists | 4.26 |
| 19-4092.00 | Forensic Science Technicians | 4.26 |
| 19-4011.01 | Agricultural Technicians | 4.26 |
| 51-9023.00 | Mixing and Blending Machine Setters, Operators… | 4.26 |
| 33-1021.01 | Municipal Fire Fighting and Prevention Supervi… | 4.26 |
| 11-3131.00 | Training and Development Managers | 4.26 |
| 13-1074.00 | Farm Labor Contractors | 4.25 |
| 53-7051.00 | Industrial Truck and Tractor Operators | 4.25 |
| 29-2011.02 | Cytotechnologists | 4.25 |
| 19-1031.01 | Soil and Water Conservationists | 4.25 |
| 49-9012.00 | Control and Valve Installers and Repairers, Ex… | 4.25 |
| 33-1011.00 | First-Line Supervisors of Correctional Officers | 4.24 |
| 19-2031.00 | Chemists | 4.24 |
| 51-9111.00 | Packaging and Filling Machine Operators and Te… | 4.24 |
| 29-1041.00 | Optometrists | 4.24 |
| 51-6063.00 | Textile Knitting and Weaving Machine Setters, … | 4.24 |
| 11-9013.03 | Aquacultural Managers | 4.24 |
| 49-9041.00 | Industrial Machinery Mechanics | 4.23 |
| 11-9021.00 | Construction Managers | 4.23 |
| 39-5094.00 | Skincare Specialists | 4.23 |
| 27-1025.00 | Interior Designers | 4.22 |
| 19-2041.03 | Industrial Ecologists | 4.22 |
| 51-9041.00 | Extruding, Forming, Pressing, and Compacting M… | 4.22 |
| 39-2021.00 | Nonfarm Animal Caretakers | 4.22 |
| 49-9031.00 | Home Appliance Repairers | 4.22 |
| 13-1041.04 | Government Property Inspectors and Investigators | 4.22 |
| 29-1081.00 | Podiatrists | 4.22 |
| 13-1041.07 | Regulatory Affairs Specialists | 4.22 |
| 51-9191.00 | Adhesive Bonding Machine Operators and Tenders | 4.22 |
| 49-9064.00 | Watch Repairers | 4.22 |
| 51-4062.00 | Patternmakers, Metal and Plastic | 4.22 |
| 19-2041.02 | Environmental Restoration Planners | 4.22 |
| 11-9013.01 | Nursery and Greenhouse Managers | 4.21 |
| 39-9011.01 | Nannies | 4.21 |
| 53-7011.00 | Conveyor Operators and Tenders | 4.21 |
| 49-9097.00 | Signal and Track Switch Repairers | 4.20 |
| 17-3013.00 | Mechanical Drafters | 4.20 |
| 33-1012.00 | First-Line Supervisors of Police and Detectives | 4.20 |
| 51-8099.01 | Biofuels Processing Technicians | 4.20 |
| 47-2152.02 | Plumbers | 4.20 |
| 51-3093.00 | Food Cooking Machine Operators and Tenders | 4.20 |
| 51-4021.00 | Extruding and Drawing Machine Setters, Operato… | 4.20 |
| 51-9141.00 | Semiconductor Processors | 4.20 |
| 51-9192.00 | Cleaning, Washing, and Metal Pickling Equipmen… | 4.20 |
| 31-1011.00 | Home Health Aides | 4.19 |
| 29-2051.00 | Dietetic Technicians | 4.19 |
| 49-9062.00 | Medical Equipment Repairers | 4.19 |
| 49-9061.00 | Camera and Photographic Equipment Repairers | 4.18 |
| 51-6064.00 | Textile Winding, Twisting, and Drawing Out Mac… | 4.18 |
| 27-1012.00 | Craft Artists | 4.18 |
| 51-4023.00 | Rolling Machine Setters, Operators, and Tender… | 4.18 |
| 45-1011.06 | First-Line Supervisors of Aquacultural Workers | 4.18 |
| 45-1011.07 | First-Line Supervisors of Agricultural Crop an… | 4.18 |
| 51-4081.00 | Multiple Machine Tool Setters, Operators, and … | 4.17 |
| 35-3031.00 | Waiters and Waitresses | 4.17 |
| 39-3092.00 | Costume Attendants | 4.17 |
| 27-2012.05 | Technical Directors/Managers | 4.17 |
| 27-1013.00 | Fine Artists, Including Painters, Sculptors, a… | 4.16 |
| 19-3039.01 | Neuropsychologists and Clinical Neuropsycholog… | 4.16 |
| 17-3011.02 | Civil Drafters | 4.16 |
| 49-3043.00 | Rail Car Repairers | 4.16 |
| 33-3021.01 | Police Detectives | 4.15 |
| 51-9121.00 | Coating, Painting, and Spraying Machine Setter… | 4.15 |
| 33-3021.03 | Criminal Investigators and Special Agents | 4.15 |
| 11-3051.06 | Hydroelectric Production Managers | 4.15 |
| 51-4034.00 | Lathe and Turning Machine Tool Setters, Operat… | 4.14 |
| 17-2111.01 | Industrial Safety and Health Engineers | 4.14 |
| 17-2199.09 | Nanosystems Engineers | 4.14 |
| 49-9052.00 | Telecommunications Line Installers and Repairers | 4.14 |
| 51-9032.00 | Cutting and Slicing Machine Setters, Operators… | 4.14 |
| 49-9095.00 | Manufactured Building and Mobile Home Installers | 4.13 |
| 27-1027.00 | Set and Exhibit Designers | 4.13 |
| 19-1012.00 | Food Scientists and Technologists | 4.13 |
| 45-1011.05 | First-Line Supervisors of Logging Workers | 4.13 |
| 33-3012.00 | Correctional Officers and Jailers | 4.13 |
| 51-6052.00 | Tailors, Dressmakers, and Custom Sewers | 4.13 |
| 33-3021.02 | Police Identification and Records Officers | 4.13 |
| 33-2022.00 | Forest Fire Inspectors and Prevention Specialists | 4.13 |
| 13-1041.03 | Equal Opportunity Representatives and Officers | 4.12 |
| 39-5011.00 | Barbers | 4.12 |
| 49-3023.01 | Automotive Master Mechanics | 4.12 |
| 33-1021.02 | Forest Fire Fighting and Prevention Supervisors | 4.12 |
| 27-2012.01 | Producers | 4.12 |
| 51-4032.00 | Drilling and Boring Machine Tool Setters, Oper… | 4.11 |
| 49-3053.00 | Outdoor Power Equipment and Other Small Engine… | 4.11 |
| 27-2041.01 | Music Directors | 4.11 |
| 29-2011.00 | Medical and Clinical Laboratory Technologists | 4.11 |
| 33-9011.00 | Animal Control Workers | 4.11 |
| 51-3091.00 | Food and Tobacco Roasting, Baking, and Drying … | 4.10 |
| 19-1041.00 | Epidemiologists | 4.10 |
| 27-2032.00 | Choreographers | 4.10 |
| 29-2012.00 | Medical and Clinical Laboratory Technicians | 4.10 |
| 47-4021.00 | Elevator Installers and Repairers | 4.10 |
| 51-9051.00 | Furnace, Kiln, Oven, Drier, and Kettle Operato… | 4.10 |
| 51-9193.00 | Cooling and Freezing Equipment Operators and T… | 4.09 |
| 53-7021.00 | Crane and Tower Operators | 4.08 |
| 33-3051.03 | Sheriffs and Deputy Sheriffs | 4.08 |
| 31-1015.00 | Orderlies | 4.08 |
| 49-3051.00 | Motorboat Mechanics and Service Technicians | 4.07 |
| 39-9011.00 | Childcare Workers | 4.07 |
| 33-3021.05 | Immigration and Customs Inspectors | 4.07 |
| 45-1011.08 | First-Line Supervisors of Animal Husbandry and… | 4.07 |
| 53-5011.00 | Sailors and Marine Oilers | 4.07 |
| 35-2012.00 | Cooks, Institution and Cafeteria | 4.06 |
| 19-4031.00 | Chemical Technicians | 4.06 |
| 53-5021.02 | Mates- Ship, Boat, and Barge | 4.06 |
| 49-9011.00 | Mechanical Door Repairers | 4.06 |
| 49-9021.02 | Refrigeration Mechanics and Installers | 4.06 |
| 49-9071.00 | Maintenance and Repair Workers, General | 4.06 |
| 35-3011.00 | Bartenders | 4.05 |
| 47-4099.02 | Solar Thermal Installers and Technicians | 4.05 |
| 33-2011.01 | Municipal Firefighters | 4.05 |
| 49-3092.00 | Recreational Vehicle Service Technicians | 4.05 |
| 53-7033.00 | Loading Machine Operators, Underground Mining | 4.04 |
| 19-1031.02 | Range Managers | 4.04 |
| 49-9098.00 | Helpers–Installation, Maintenance, and Repair… | 4.04 |
| 51-6061.00 | Textile Bleaching and Dyeing Machine Operators… | 4.04 |
| 51-4041.00 | Machinists | 4.04 |
| 47-4099.03 | Weatherization Installers and Technicians | 4.04 |
| 51-4061.00 | Model Makers, Metal and Plastic | 4.04 |
| 29-1021.00 | Dentists, General | 4.03 |
| 51-7031.00 | Model Makers, Wood | 4.03 |
| 51-9196.00 | Paper Goods Machine Setters, Operators, and Te… | 4.03 |
| 49-9051.00 | Electrical Power-Line Installers and Repairers | 4.03 |
| 49-9094.00 | Locksmiths and Safe Repairers | 4.03 |
| 47-4011.00 | Construction and Building Inspectors | 4.03 |
| 51-9031.00 | Cutters and Trimmers, Hand | 4.03 |
| 29-1022.00 | Oral and Maxillofacial Surgeons | 4.02 |
| 33-3011.00 | Bailiffs | 4.02 |
| 35-2013.00 | Cooks, Private Household | 4.01 |
| 19-1011.00 | Animal Scientists | 4.01 |
| 47-2041.00 | Carpet Installers | 4.01 |
| 19-3051.00 | Urban and Regional Planners | 4.00 |
| 23-1021.00 | Administrative Law Judges, Adjudicators, and H… | 4.00 |
| 27-2012.02 | Directors- Stage, Motion Pictures, Television,… | 4.00 |
| 33-2011.02 | Forest Firefighters | 3.99 |
| 47-2152.01 | Pipe Fitters and Steamfitters | 3.99 |
| 47-5013.00 | Service Unit Operators, Oil, Gas, and Mining | 3.98 |
| 47-5041.00 | Continuous Mining Machine Operators | 3.98 |
| 39-2011.00 | Animal Trainers | 3.98 |
| 47-5042.00 | Mine Cutting and Channeling Machine Operators | 3.98 |
| 37-1011.00 | First-Line Supervisors of Housekeeping and Jan… | 3.97 |
| 35-3041.00 | Food Servers, Nonrestaurant | 3.97 |
| 45-2021.00 | Animal Breeders | 3.97 |
| 11-3051.03 | Biofuels Production Managers | 3.97 |
| 35-3021.00 | Combined Food Preparation and Serving Workers,… | 3.96 |
| 19-1032.00 | Foresters | 3.96 |
| 49-3041.00 | Farm Equipment Mechanics and Service Technicians | 3.95 |
| 33-3031.00 | Fish and Game Wardens | 3.95 |
| 47-2073.00 | Operating Engineers and Other Construction Equ… | 3.95 |
| 17-3012.02 | Electrical Drafters | 3.95 |
| 23-1022.00 | Arbitrators, Mediators, and Conciliators | 3.95 |
| 35-3022.01 | Baristas | 3.94 |
| 49-9043.00 | Maintenance Workers, Machinery | 3.94 |
| 37-1012.00 | First-Line Supervisors of Landscaping, Lawn Se… | 3.94 |
| 45-2092.02 | Farmworkers and Laborers, Crop | 3.94 |
| 51-4051.00 | Metal-Refining Furnace Operators and Tenders | 3.94 |
| 51-2023.00 | Electromechanical Equipment Assemblers | 3.94 |
| 51-2011.00 | Aircraft Structure, Surfaces, Rigging, and Sys… | 3.94 |
| 19-1023.00 | Zoologists and Wildlife Biologists | 3.93 |
| 47-5011.00 | Derrick Operators, Oil and Gas | 3.93 |
| 49-3091.00 | Bicycle Repairers | 3.93 |
| 47-5081.00 | Helpers–Extraction Workers | 3.93 |
| 51-4191.00 | Heat Treating Equipment Setters, Operators, an… | 3.93 |
| 47-5012.00 | Rotary Drill Operators, Oil and Gas | 3.92 |
| 45-4021.00 | Fallers | 3.92 |
| 51-4192.00 | Layout Workers, Metal and Plastic | 3.92 |
| 45-2011.00 | Agricultural Inspectors | 3.91 |
| 49-3042.00 | Mobile Heavy Equipment Mechanics, Except Engines | 3.91 |
| 51-4031.00 | Cutting, Punching, and Press Machine Setters, … | 3.90 |
| 23-1023.00 | Judges, Magistrate Judges, and Magistrates | 3.90 |
| 23-1012.00 | Judicial Law Clerks | 3.90 |
| 29-2021.00 | Dental Hygienists | 3.90 |
| 51-4122.00 | Welding, Soldering, and Brazing Machine Setter… | 3.90 |
| 53-5022.00 | Motorboat Operators | 3.90 |
| 45-2093.00 | Farmworkers, Farm, Ranch, and Aquacultural Ani… | 3.89 |
| 27-2011.00 | Actors | 3.89 |
| 51-6031.00 | Sewing Machine Operators | 3.89 |
| 49-2092.00 | Electric Motor, Power Tool, and Related Repairers | 3.88 |
| 49-9096.00 | Riggers | 3.88 |
| 27-2012.04 | Talent Directors | 3.88 |
| 51-9195.04 | Glass Blowers, Molders, Benders, and Finishers | 3.88 |
| 49-3052.00 | Motorcycle Mechanics | 3.88 |
| 13-1075.00 | Labor Relations Specialists | 3.88 |
| 39-5012.00 | Hairdressers, Hairstylists, and Cosmetologists | 3.87 |
| 45-2041.00 | Graders and Sorters, Agricultural Products | 3.86 |
| 51-3011.00 | Bakers | 3.86 |
| 51-4033.00 | Grinding, Lapping, Polishing, and Buffing Mach… | 3.86 |
| 33-2021.02 | Fire Investigators | 3.86 |
| 49-9092.00 | Commercial Divers | 3.86 |
| 35-3022.00 | Counter Attendants, Cafeteria, Food Concession… | 3.85 |
| 19-1042.00 | Medical Scientists, Except Epidemiologists | 3.84 |
| 23-1011.00 | Lawyers | 3.84 |
| 35-2015.00 | Cooks, Short Order | 3.84 |
| 51-4111.00 | Tool and Die Makers | 3.84 |
| 51-9082.00 | Medical Appliance Technicians | 3.83 |
| 51-7011.00 | Cabinetmakers and Bench Carpenters | 3.83 |
| 29-1024.00 | Prosthodontists | 3.83 |
| 39-4021.00 | Funeral Attendants | 3.83 |
| 53-7041.00 | Hoist and Winch Operators | 3.82 |
| 27-2031.00 | Dancers | 3.81 |
| 51-5113.00 | Print Binding and Finishing Workers | 3.81 |
| 19-1013.00 | Soil and Plant Scientists | 3.81 |
| 51-4193.00 | Plating and Coating Machine Setters, Operators… | 3.80 |
| 49-9044.00 | Millwrights | 3.79 |
| 33-2021.01 | Fire Inspectors | 3.79 |
| 51-4052.00 | Pourers and Casters, Metal | 3.79 |
| 51-7042.00 | Woodworking Machine Setters, Operators, and Te… | 3.79 |
| 47-4071.00 | Septic Tank Servicers and Sewer Pipe Cleaners | 3.78 |
| 49-3093.00 | Tire Repairers and Changers | 3.76 |
| 47-2044.00 | Tile and Marble Setters | 3.76 |
| 51-4072.00 | Molding, Coremaking, and Casting Machine Sette… | 3.76 |
| 49-3022.00 | Automotive Glass Installers and Repairers | 3.75 |
| 49-3011.00 | Aircraft Mechanics and Service Technicians | 3.75 |
| 51-2031.00 | Engine and Other Machine Assemblers | 3.75 |
| 35-2014.00 | Cooks, Restaurant | 3.74 |
| 19-1022.00 | Microbiologists | 3.74 |
| 51-6021.00 | Pressers, Textile, Garment, and Related Materials | 3.73 |
| 51-9022.00 | Grinding and Polishing Workers, Hand | 3.73 |
| 19-1021.00 | Biochemists and Biophysicists | 3.72 |
| 47-3015.00 | Helpers–Pipelayers, Plumbers, Pipefitters, an… | 3.72 |
| 45-3011.00 | Fishers and Related Fishing Workers | 3.71 |
| 23-2091.00 | Court Reporters | 3.71 |
| 51-6093.00 | Upholsterers | 3.71 |
| 47-2121.00 | Glaziers | 3.71 |
| 45-2091.00 | Agricultural Equipment Operators | 3.70 |
| 39-4031.00 | Morticians, Undertakers, and Funeral Directors | 3.70 |
| 51-4022.00 | Forging Machine Setters, Operators, and Tender… | 3.69 |
| 45-4011.00 | Forest and Conservation Workers | 3.68 |
| 51-7041.00 | Sawing Machine Setters, Operators, and Tenders… | 3.68 |
| 35-2021.00 | Food Preparation Workers | 3.68 |
| 47-2132.00 | Insulation Workers, Mechanical | 3.67 |
| 45-2092.01 | Nursery Workers | 3.67 |
| 47-2061.00 | Construction Laborers | 3.67 |
| 47-2072.00 | Pile-Driver Operators | 3.66 |
| 51-6041.00 | Shoe and Leather Workers and Repairers | 3.66 |
| 49-3021.00 | Automotive Body and Related Repairers | 3.63 |
| 29-2011.03 | Histotechnologists and Histologic Technicians | 3.62 |
| 51-6051.00 | Sewers, Hand | 3.62 |
| 51-4194.00 | Tool Grinders, Filers, and Sharpeners | 3.62 |
| 51-9194.00 | Etchers and Engravers | 3.61 |
| 47-4051.00 | Highway Maintenance Workers | 3.60 |
| 47-2211.00 | Sheet Metal Workers | 3.60 |
| 51-4121.06 | Welders, Cutters, and Welder Fitters | 3.59 |
| 51-9199.01 | Recycling and Reclamation Workers | 3.59 |
| 35-9021.00 | Dishwashers | 3.58 |
| 35-9011.00 | Dining Room and Cafeteria Attendants and Barte… | 3.58 |
| 47-2151.00 | Pipelayers | 3.57 |
| 47-2131.00 | Insulation Workers, Floor, Ceiling, and Wall | 3.57 |
| 47-4041.00 | Hazardous Materials Removal Workers | 3.57 |
| 35-2011.00 | Cooks, Fast Food | 3.55 |
| 47-2021.00 | Brickmasons and Blockmasons | 3.55 |
| 47-4061.00 | Rail-Track Laying and Maintenance Equipment Op… | 3.54 |
| 53-7032.00 | Excavating and Loading Machine and Dragline Op… | 3.54 |
| 47-2081.00 | Drywall and Ceiling Tile Installers | 3.54 |
| 39-5092.00 | Manicurists and Pedicurists | 3.54 |
| 47-2221.00 | Structural Iron and Steel Workers | 3.54 |
| 47-2031.01 | Construction Carpenters | 3.53 |
| 47-5031.00 | Explosives Workers, Ordnance Handling Experts,… | 3.52 |
| 51-9197.00 | Tire Builders | 3.52 |
| 53-7031.00 | Dredge Operators | 3.52 |
| 47-2171.00 | Reinforcing Iron and Rebar Workers | 3.51 |
| 47-2031.02 | Rough Carpenters | 3.51 |
| 39-5091.00 | Makeup Artists, Theatrical and Performance | 3.51 |
| 51-9195.03 | Stone Cutters and Carvers, Manufacturing | 3.50 |
| 51-9083.00 | Ophthalmic Laboratory Technicians | 3.50 |
| 51-2041.00 | Structural Metal Fabricators and Fitters | 3.50 |
| 47-2011.00 | Boilermakers | 3.49 |
| 51-9122.00 | Painters, Transportation Equipment | 3.49 |
| 51-9071.06 | Gem and Diamond Workers | 3.47 |
| 49-9063.00 | Musical Instrument Repairers and Tuners | 3.47 |
| 47-3011.00 | Helpers–Brickmasons, Blockmasons, Stonemasons… | 3.47 |
| 51-6042.00 | Shoe Machine Operators and Tenders | 3.47 |
| 51-9195.05 | Potters, Manufacturing | 3.47 |
| 47-5061.00 | Roof Bolters, Mining | 3.46 |
| 39-4011.00 | Embalmers | 3.46 |
| 37-2021.00 | Pest Control Workers | 3.45 |
| 51-3092.00 | Food Batchmakers | 3.44 |
| 51-4121.07 | Solderers and Brazers | 3.44 |
| 37-3013.00 | Tree Trimmers and Pruners | 3.43 |
| 51-9071.01 | Jewelers | 3.41 |
| 51-9195.07 | Molding and Casting Workers | 3.40 |
| 47-3016.00 | Helpers–Roofers | 3.39 |
| 11-9041.01 | Biofuels/Biodiesel Technology and Product Deve… | 3.38 |
| 51-3021.00 | Butchers and Meat Cutters | 3.37 |
| 51-4071.00 | Foundry Mold and Coremakers | 3.36 |
| 47-5071.00 | Roustabouts, Oil and Gas | 3.36 |
| 47-4031.00 | Fence Erectors | 3.36 |
| 51-6011.00 | Laundry and Dry-Cleaning Workers | 3.35 |
| 47-3012.00 | Helpers–Carpenters | 3.34 |
| 51-7021.00 | Furniture Finishers | 3.34 |
| 37-2012.00 | Maids and Housekeeping Cleaners | 3.34 |
| 47-2071.00 | Paving, Surfacing, and Tamping Equipment Opera… | 3.32 |
| 51-9123.00 | Painting, Coating, and Decorating Workers | 3.30 |
| 51-9071.07 | Precious Metal Workers | 3.28 |
| 47-3014.00 | Helpers–Painters, Paperhangers, Plasterers, a… | 3.26 |
| 51-2091.00 | Fiberglass Laminators and Fabricators | 3.26 |
| 51-2093.00 | Timing Device Assemblers and Adjusters | 3.25 |
| 47-2181.00 | Roofers | 3.23 |
| 51-9081.00 | Dental Laboratory Technicians | 3.23 |
| 37-2011.00 | Janitors and Cleaners, Except Maids and Housek… | 3.22 |
| 37-3011.00 | Landscaping and Groundskeeping Workers | 3.21 |
| 47-5051.00 | Rock Splitters, Quarry | 3.20 |
| 49-9045.00 | Refractory Materials Repairers, Except Brickma… | 3.18 |
| 47-2022.00 | Stonemasons | 3.17 |
| 47-2141.00 | Painters, Construction and Maintenance | 3.14 |
| 47-2142.00 | Paperhangers | 3.12 |
| 49-9093.00 | Fabric Menders, Except Garment | 3.12 |
| 47-4091.00 | Segmental Pavers | 3.12 |
| 47-2042.00 | Floor Layers, Except Carpet, Wood, and Hard Tiles | 3.09 |
| 47-2082.00 | Tapers | 3.06 |
| 37-3012.00 | Pesticide Handlers, Sprayers, and Applicators,… | 3.05 |
| 47-2161.00 | Plasterers and Stucco Masons | 3.04 |
| 45-3021.00 | Hunters and Trappers | 2.94 |
| 47-2051.00 | Cement Masons and Concrete Finishers | 2.87 |
| 47-2053.00 | Terrazzo Workers and Finishers | 2.84 |
| 47-2043.00 | Floor Sanders and Finishers | 2.73 |
| 51-3023.00 | Slaughterers and Meat Packers | 2.71 |
| 51-3022.00 | Meat, Poultry, and Fish Cutters and Trimmers | 2.58 |