CI Tau: A controlled experiment in disk-planet interaction
Abstract
CI Tau is a young ( Myr) T Tauri system with a substantial near-infrared excess in its SED, indicating that the protoplanetary disk extends very close to its star. This is seemingly at odds with the radial-velocity discovery of CI Tau b, a planet at au, which would be expected to carve a wide, deep cavity in the innermost disk. To investigate this apparent contradiction, we run 2D hydrodynamics simulations to study the effect of the planet on the disk, then post-process the results with radiative transfer to obtain an SED. We find that at au, even such a massive companion has little impact on the near-infrared excess, a result that holds regardless of planetary eccentricity and dust size distribution. Conversely, the observed full-disk signature in CI Tau’s SED is consistent with the existence of the hot super-Jupiter CI Tau b. As our simulations uncover, clear transition-disk signatures in SEDs are more likely to be signposts of nascent “warm” Jupiters, located at around 1 AU in the future habitable zones of their host stars.
1 Introduction
The spectral energy distribution (SED) of a planet-forming system consists of three basic components: the stellar photosphere, accretion luminosity, and an excess at infrared and longer wavelengths emitted by dust in the protoplanetary disk. In some cases, the near-infrared (NIR) portion of the disk excess is reduced, implying that dust has been depleted in the innermost, hottest part of the disk. Such SEDs are thought to reflect a “transitional” phase in disk evolution (e.g., Calvet et al., 2002, 2005) where they clear from the inside out, a picture increasingly borne out in recent years by high-resolution observations (e.g., Andrews et al., 2011; Espaillat et al., 2014; van der Marel et al., 2018)
Given their ubiquity, planets are expected to play a key role in carving transition cavities, and conversely, transition cavities are thought to be signposts of planet formation. These prospects have received substantial theoretical (Dodson-Robinson & Salyk, 2011; Zhu et al., 2011, 2012; Dong et al., 2012a; Muley et al., 2019; Bae et al., 2019) and observational (Sallum et al., 2015; Keppler et al., 2018) interest. However, planets are difficult to directly image in transition disks, and often have large, model-dependent uncertainties in mass that make their role in carving a given cavity unclear (see Müller et al., 2018; Asensio-Torres et al., 2021, and references therein).
In this context, the Myr old CI Tauri system is of particular interest. It is one of the rare protoplanetary-disk systems where a super-Jupiter planet candidate has been detected independently of imaging—in this case, by radial velocity (Johns-Krull et al., 2016). The detection of CI Tau b is not uncontroversial at the moment (Donati et al., 2020). The companion is predicted to have a mass of , a semimajor axis of au, and an eccentricity of (Flagg et al., 2019; Donati et al., 2020). However, the NIR excess of the system is characteristic of a full, unperturbed disk, with no obvious signs of disk-planet interactions (e.g., McClure et al., 2013a, b). Determining that the cavity excavated by CI Tau b would not substantially impact the SED would resolve this apparent contradiction. This would provide a starting point to test which disk and planet parameters do impact the SED, and more broadly, under what circumstances transitional disk-like SEDs can be seen as signposts of inner massive planets. The existence of hot Jupiters in Myr old systems would pose a direct test of formation models such as in-situ growth or disk migration (Dawson & Johnson, 2018).
To this end, we carry out hydrodynamical simulations of disk-planet interactions, then post-process the results with a radiative-transfer code, in order to obtain disk structures and SEDs. We vary parameters such as planetary semimajor axis, eccentricity, and dust size distribution. By focusing on cavities au in width extending all the way to the star, and by self-consistently importing a dust distribution from the hydrodynamics, our study complements previous work by Zhu et al. (2012) and Dong et al. (2012b), who used semi-analytic modeling to study the SED of disks with au and au cavities respectively. Section 2 contains our methods, Section 3 our results, and Section 4 our conclusions.
2 Methods
2.1 Full-disk case
Before investigating the effect of a planet, we first use the HOCHUNK3D Monte Carlo ray-tracing code (Whitney et al., 2013) to find an unperturbed, analytical disk model that best reproduces the observed photometric SED. We largely follow the CI Tau model in Ballering & Eisner (2019) in this step. We use a photospheric temperature of K and a total luminosity of (Andrews et al., 2013);111Corrected for the fact that Andrews et al. (2013) used a distance of 140 pc for CI Tau instead of the Gaia distance of 158 pc. we assume that 75% of this luminosity () comes from direct photospheric emission, while 25% () comes from accretion onto the star, in order to match the modeling work of McClure et al. (2013a) at The photospheric luminosity corresponds to a stellar radius of , typical of T Tauri stars. Using this radius, and using a stellar mass of (Guilloteau et al., 2014; Flagg et al., 2019) we estimate a mass accretion rate of , within order-unity of that in McClure et al. (2013a). As they did, we model the accretion luminosity as an 8000 K blackbody emanating evenly from the stellar surface, and find likewise that we reproduce the observed SED in the optical. We use photon packets to perform ray-tracing.
Our models use Kim et al. (1994) small interstellar medium grains (hereafter ISM), which provide a good fit to the SED photometry for wavelengths 100, as well as the 10 feature observed by Spitzer/IRS. Such grains, with Stokes numbers , are well-coupled to the gas, and so do not require separate modeling in our hydrodynamics simulations (Section 2.2). We use a dust sublimation temperature K, with a sublimation radius at au and a curved wall with au to account for pressure-mediated vertical dependence in the sublimation radius (Isella & Natta, 2005). We assume a dust-to-gas ratio of 0.01, and fiducially assign 10% of this mass to small grains (Dong et al., 2012b); we plot the relevant opacity in Figure 1. The rest of the dust mass is assumed to be in bigger grains. Because our focus is on the NIR excess, we need not model this population of larger grains, which supply only a negligibly small fraction of total opacity at .
Our disk is flared, with an aspect ratio of
| (1) |
where is the sound speed, the Keplerian velocity, the distance from the star, the aspect ratio at 1 au, and the flaring index. These parameters are constrained by fitting the disk SED (Ballering & Eisner, 2019). The disk profile thus does not reflect that obtained by simply taking the radiative transfer output temperature and assuming hydrostatic equilibrium. Such parametrizations are often adopted in disk modeling (e.g., Andrews et al., 2011; Dong et al., 2012b; Zhang et al., 2014), as certain physical processes that affect the thermal state of the disk, including planetary shocks and viscous heating in a deep cavity, are not readily and self-consistently treated in radiative transfer codes.
We use a total (gas and dust) mass of inside its outer boundary au. The surface density scales as
| (2) |
where and au—where the rotation period of the star (and therefore, that of its frozen-in magnetic field) coincides with the Keplerian period, leading to a magnetospheric truncation of the disk. This happens to coincide with the dust sublimation radius.
2.2 Planet-carved cavity case
To simulate the effect of CI Tau b on its disk, we run 2D hydrodynamics simulations with PEnGUIn (Fung, 2015), a GPU-accelerated, Lagrangian-remap code that employs the piecewise parabolic method (PPM) of fluid reconstruction. As in Muley et al. (2021), we solve the viscous, compressible Navier-Stokes equations, with gravitational forces from both the star and the planet. We relax the local temperature in each grid cell to the background temperature on a timescale local dynamical times, making our simulations effectively locally isothermal (Miranda & Rafikov, 2020). This facilitates comparison with previous simulations of super-Jupiters (e.g, Dunhill et al., 2013; Ragusa et al., 2018; Muley et al., 2019; Teyssandier & Lai, 2020), and simplifies the complex thermal physics (Rafikov, 2016) and gas-grain coupling issues (Bae et al., 2021) that would emerge for the strong shocks they would generate.
Per Flagg et al. (2019), we set CI Tau b’s mass and the stellar mass . We use a semimajor axis au, and test eccentricities of , bracketing the range expected from observations. These parameters are fixed throughout the simulation, and do not change due to the gravitational back-reaction of disk material onto the planet; however, similar values are naturally achievable for super-Jupiter planets when the planet is free to migrate (Papaloizou et al., 2001; Bitsch et al., 2013; Dunhill et al., 2013; Ragusa et al., 2018; Muley et al., 2019).
We allow the planet to accrete disk material according to the prescription of Muley et al. (2019), at a rate
| (3) |
where , the typical free-fall timescale , and the typical accretion radius ( are cylindrical coordinates of a grid cell within the disk, while is the instantaneous radial location and is the Hill radius of the planet). This rate is limited, spatially, by a Gaussian function centered on the planet:
| (4) |
where we pick , allowing essentially unlimited accretion within the planet’s Hill radius. The accreted mass is removed from the domain entirely and is not added to that of the planet.
We use a Shakura-Sunyaev viscosity prescription with , a value commonly used in hydrodynamical simulations of protoplanetary disks (e.g., Fung et al., 2014; Fung & Chiang, 2016; Bae et al., 2019) and emerging naturally from small-scale turbulence in nearly-isothermal disks such as the one we use (Manger et al., 2021). Following Ballering & Eisner (2019) we set the background temperature equal to that implied by Equation 1, scaling as (note that the disk is being heated by both stellar irradiation and accretion). The initial surface density is given by Equation 2, augmented with an additional exponential truncation factor for au, to minimize spurious addition and removal of mass and angular momentum at the (circularly symmetric) outer boundary. As shown later, we mainly focus on the inner disk structure within 1 AU and photometry at wavelengths shorter than .
We run hydrodynamics simulations to 25 years, or 1143 orbits of CI Tau b, long enough to establish a quasi-steady state. Our domain spans a radial range of au, and the full in azimuth; we use a zero-gradient outflow condition at the inner boundary, and a fixed condition at the outer one. Numerical tests (not shown here) reveal that shifting the inner boundary inward by a factor of 2 does not impact cavity depth. We cover this range with cells, logarithmically spaced in radius and evenly spaced in azimuth, yielding an effective resolution of 9 cells per scale height at the location of the planet. This resolution is similar to that of the CI Tau simulations in Teyssandier & Lai (2020), which in turn is based on detailed numerical tests by Teyssandier & Ogilvie (2017).
For our radiative-transfer modeling, we rescale the innermost part of our grid such that au, and cut out the innermost cells up to au. For computational efficiency, we downsample the hydrodynamics grid by a factor of 2, and pad the remainder of the 100 au domain with surface density matched at the hydrodynamics cut and scaling as ; we normalize in each case such that disk mass always equals the fiducial . Subsequently, we vertically “puff up” the 2D disk assuming local hydrostatic equilibrium as a Gaussian, with standard deviation given by Figure 1. This gives us a 3D polar grid with resolution for au. In the vertical direction, we cover a range of , spacing cells parabolically so .
3 Results
3.1 Hydrodynamics
Planets open gaps in disks by the action of ordinary Lindblad torques on the surrounding disk material. When the planet-star mass ratio , a secondary effect—the eccentric Lindblad torques—become prominent and excite eccentricity in the disk (Kley & Dirksen, 2006). Gas parcels with large semimajor axes can thus intersect the planet’s orbit and get consumed by accretion, leaving a wider gap than ordinary Lindblad torques alone would indicate. These effects are enhanced substantially when the planet is itself eccentric and exposed to a wider swathe of the disk, as visible in Figure 2. This is similar to the result in Muley et al. (2019), but the locking of disk and planet pericenters means the disk remains eccentric in our present work, rather than circularizing as in theirs. Our simulations also show “horseshoes”, azimuthal asymmetries in surface density formed by companions with mass ratios (Ragusa et al., 2020).
In Figure 3, we show more quantitative disk surface density profiles for all the eccentricities we test, with radial cuts of the closest and farthest approaches of the cavity edge. Our plot assumes the fiducial au, corresponding to CI Tau’s orbital parameters; we note that maintaining a disk mass of means that plotted densities scale down, and distances scale up, by factors of () and 10 (). For large eccentricities, the cavity width is up to 5 the planetary semimajor axis at its widest point, and can be depleted by a factor of ; in the zero-eccentricity case, the cavity is only about as wide as the planetary, but deeper than in the eccentric case. Our cavity depths are broadly consistent with those of Teyssandier & Lai (2020), who focused on pulsed accretion, also observed here. However, we concentrate on gap depths, so we use a zero-gradient inner boundary that allows material to flow into and out of the domain. It is not as well-suited to studying pulsed accretion as their “diode” boundary, which only allows material to exit; this enforces an at all times, at the cost of some excess cavity depletion.
3.2 Radiative transfer
In Figure 4, we plot model SEDs for the three planetary eccentricities we test, along with a full-disk SED, and compare them with observed photometry points (Andrews et al., 2013). For the fiducial cavity ( au, leading to au, increasing with eccentricity), shown in the upper panel, eccentricity has limited observational impact, with the full disk and cases all agreeing with each other, as well as the observed CI Tau SED at . We conclude that the existence of a companion in CI Tau is compatible with the system’s SED.
Zhu et al. (2012) used hydrodynamics and radiative transfer to study transition cavities between au. We connect to their parameter space by rescaling our simulation domain such that au. The order-of-magnitude range comfortably accommodates not only changes in planetary position, but also any gap-width variations that might be expected due to variations in scale height or viscosity (Dong & Fung, 2017). When we do so, the differences between the full-disk and planetary cases become more pronounced than for . Given the opacities in Figure 1, and the surface densities in Figure 3 (as rescaled for the planet location), planetary depletion is sufficient to make the deepest parts of the cavity optically thin; furthermore, it lowers the altitude of the radial surface, meaning cavity material is less irradiated (e.g., Dong, 2015). Both of these effects contribute to a weaker NIR excess at , while the latter opens up the cavity wall to direct stellar irradiation, creating an excess at ; the precise cutoffs shift outward with increasing cavity radius. Effects are somewhat stronger for , on account of the wider cavity in those cases, than for . We stress that all of these results were obtained with an accreting, massive companion, and thus represent a best-case scenario for carving cavities with transitional disk-like SEDs.
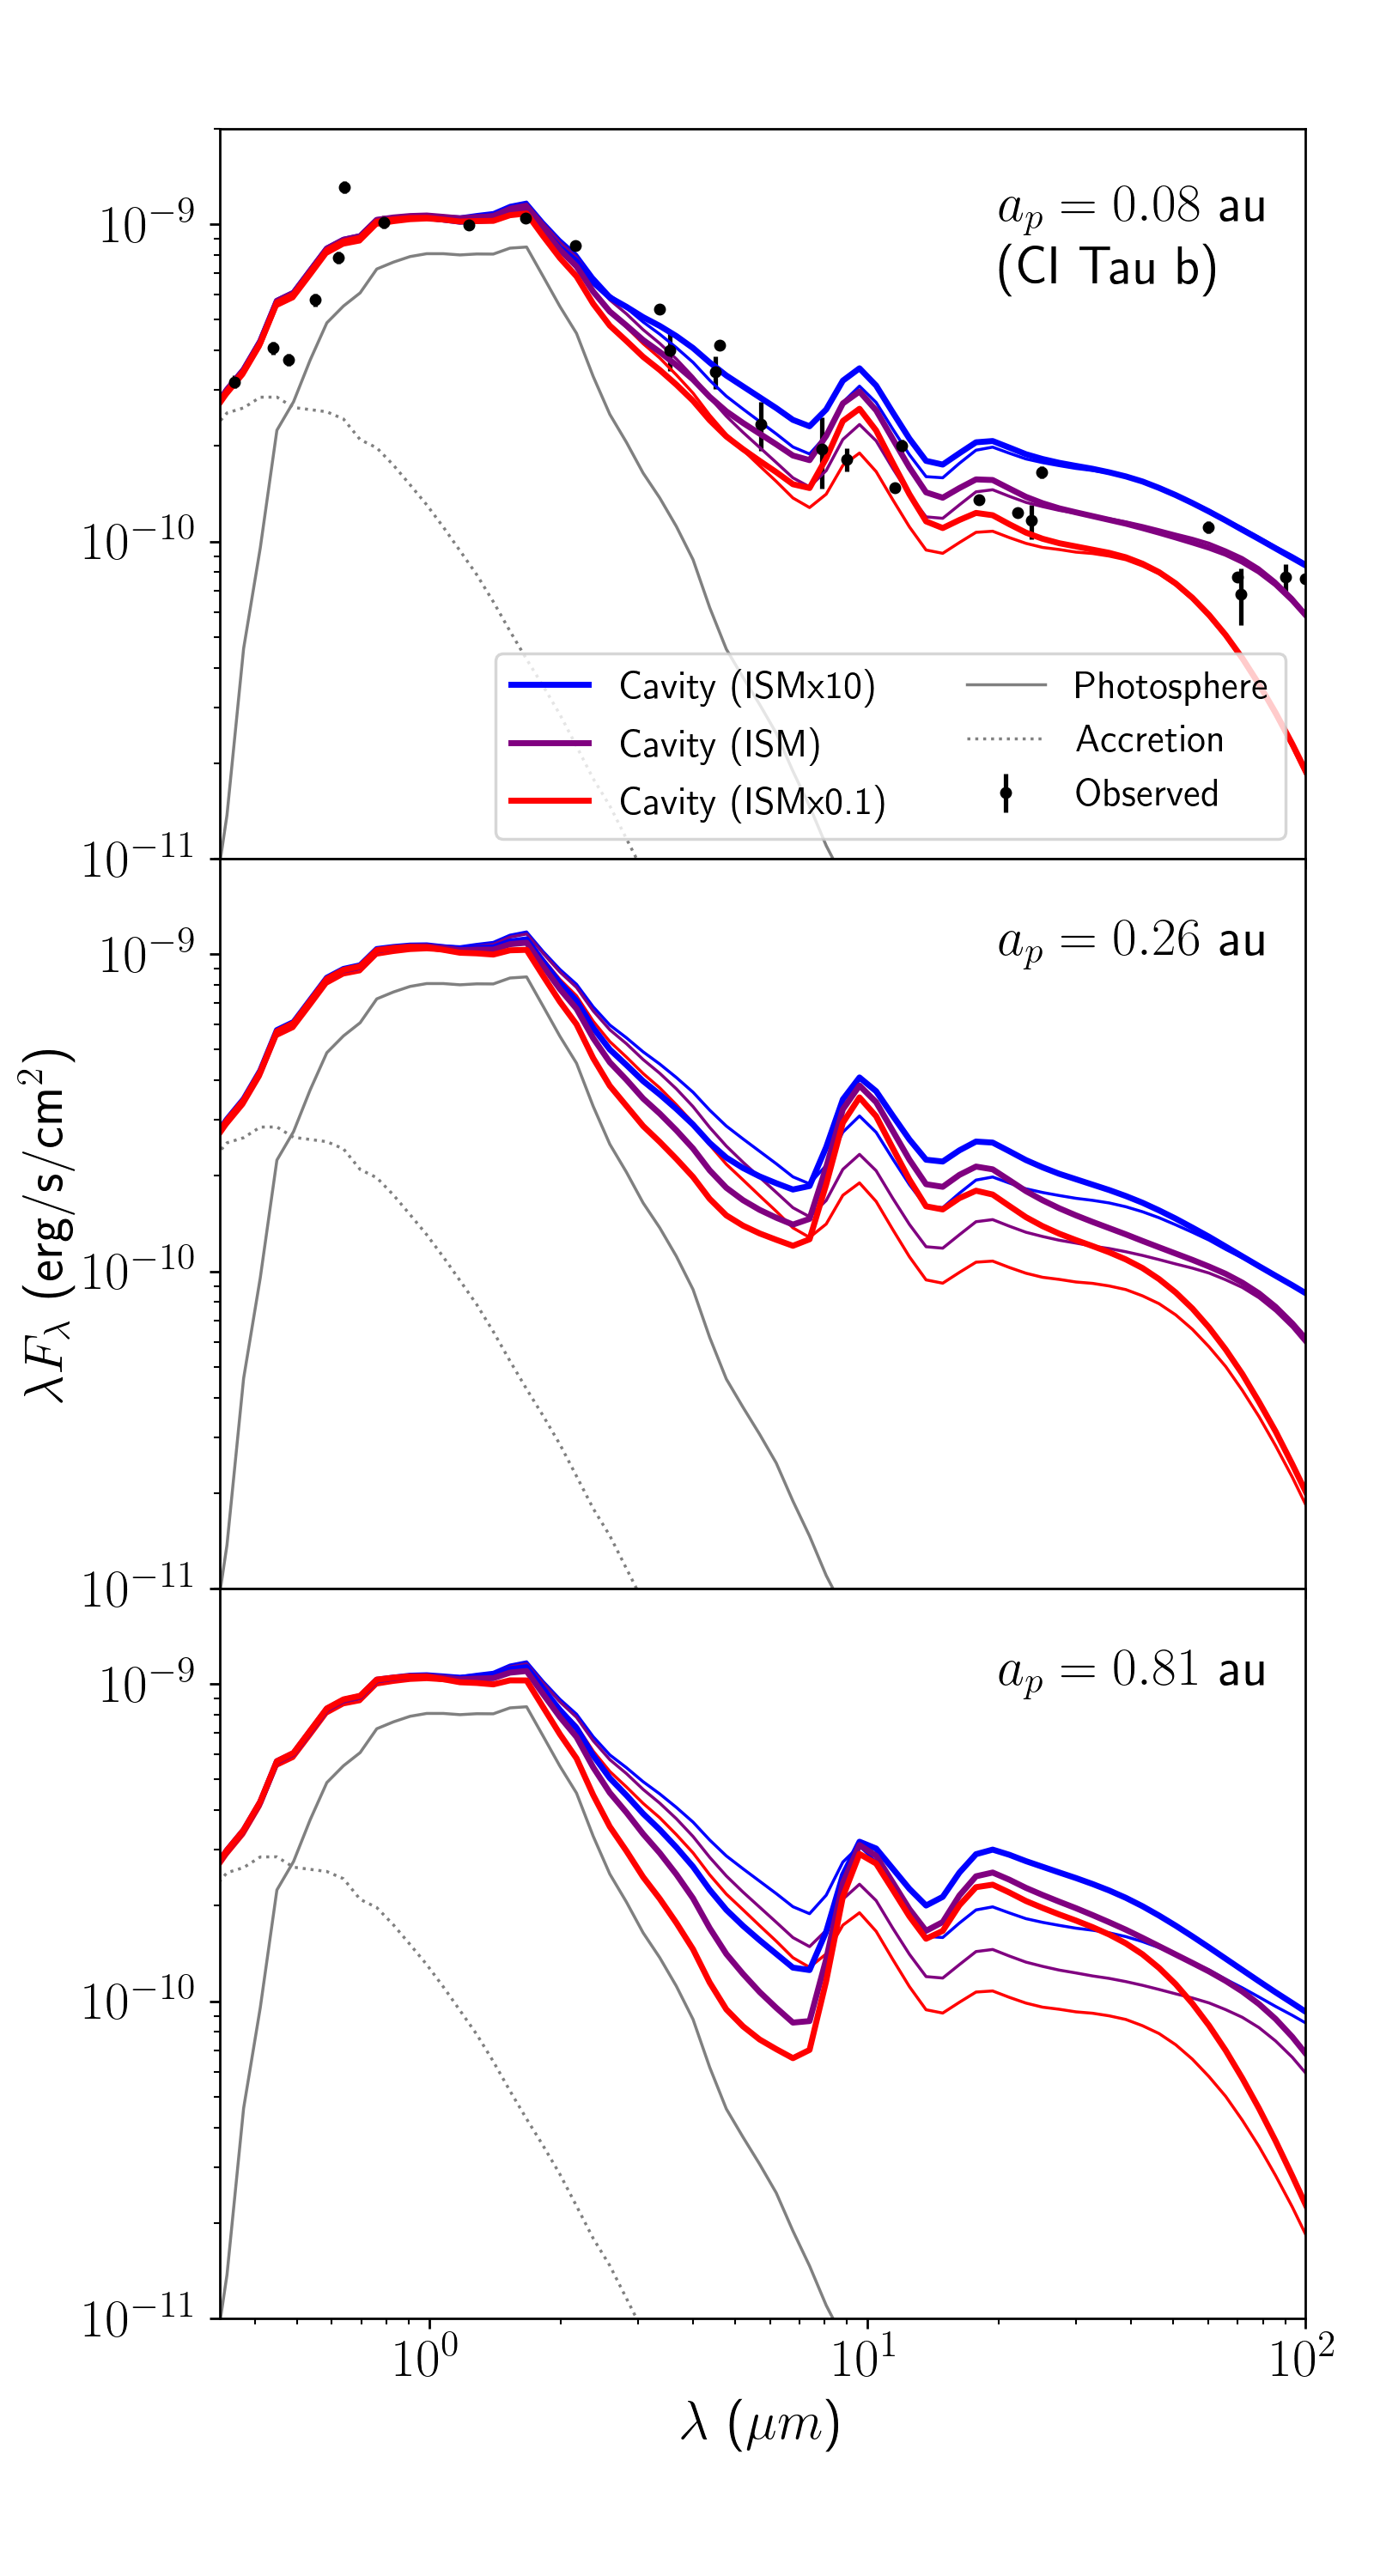
Besides planetary parameters, dust properties also play a role in transition-disk cavity visibility. Coagulation of dust into larger-sized grains reduces the effective surface area per unit mass, and thus opacity, while fragmentation does the reverse (Birnstiel et al., 2012). In our radiative-transfer models, we parametrize these effects by scaling the small dust abundance to , and its fiducial ratio; this is equivalent to assigning 100%, 10%, and 1% of dust mass to small grains, respectively. Alternatively, these rescalings provide a computationally inexpensive way to bracket the effects that a change in gap depth—and thus, viscosity and scale height Fung et al. (2014) —might have on the SED. As elsewhere in this work, we do not include emission from large grains.
We plot our results in Figure 5 for the full disk and all of au, choosing the models as they represent the best-case scenario for transition-cavity formation. Given the same fractional cavity depletion, the altitude of the radial surface is more strongly reduced, and more of the cavity becomes optically thin, when small grains are fewer to begin with. As expected, for , the observational impact of this is minimal, but for , a small-dust fraction our fiducial value can lead to a transition disk-like dip that almost fully exposes the bare stellar photosphere. The same process increases the fraction of the cavity wall that is directly irradiated, creating a larger proportional increase in the excess at .
4 Conclusion
Inspired by the CI Tau system, we use hydroynamical simulations and radiative-transfer post-processing to study the properties of cavities carved by closely orbiting super-Jupiters in protoplanetary disks. All of our simulations use the same, freely accreting companion orbiting a 0.9 star. We test three different orbital eccentricities, . While the fiducial model mimics the CI Tau system with a planet at 0.08 au, we experiment with different semimajor axis and dust-to-gas ratio by testing au and , with respect to the fiducial values. Our SED modeling builds on previous work (e.g., Zhu et al., 2012; Dong et al., 2012b; Muley et al., 2019) both by studying cavities au in radius, and by self-consistently taking dust surface density from the hydrodynamics rather than parametrizing it with piecewise analytic functions.
By design, our setup represents an extremely optimistic scenario for transition-cavity formation. Our cavity is depleted by a factor of and excavated to a width of the planet’s orbit, the larger figures contingent on the existence of planetary eccentricity. For a planetary semimajor axis au, this makes the deepest part of the cavity optically thin, while lowering the radial surface to expose the cavity wall. This, in turn, creates the characteristic transition disk-like dip from , and an additional excess at , which become more pronounced for high planetary eccentricities and low initial fractions of small dust. While the same mechanisms are at play for a closer semimajor axis of au, the -smaller surface area of the excavated cavity means that the NIR excess is indistinguishable from that of an unperturbed disk—a result that holds even in tests with a cavity artificially depleted by a factor of (not shown here). We thus infer that the SED photometry of the CI Tau system is consistent with the existence of the close-in, multi-Jupiter-mass companion, CI Tau b.
While transitional and pre-transitional SED features are not formed by hot Jupiters per se, they are good signposts for nascent “warm” super-Jupiters in the eventual habitable zones of their host stars. Future theoretical studies of such systems may sample more finely in time, in order to better understand observed variability in near-infrared excess (e.g., Espaillat et al., 2011; Flaherty et al., 2012). Additionally, a coupled dust-gas code would accurately model large-grain dynamics in such systems, and allow radiative transfer to reproduce the long-wavelength part of the SED. Observationally, such systems may be targeted for radial-velocity surveys if appropriately inclined, or for interferometric observations that reveal the telltale eccentric cavity (e.g., Kraus et al., 2013, Fig. 2 in this work). Beyond individual systems, comparing the populations of disks with transitional SED features to those of warm Jupiters—as van der Marel & Mulders (2021) did for resolved transition disks and massive planets more generally—would help elucidate formation mechanisms for these systems.
References
- Andrews et al. (2013) Andrews, S. M., Rosenfeld, K. A., Kraus, A. L., & Wilner, D. J. 2013, ApJ, 771, 129, doi: 10.1088/0004-637X/771/2/129
- Andrews et al. (2011) Andrews, S. M., Wilner, D. J., Espaillat, C., et al. 2011, ApJ, 732, 42, doi: 10.1088/0004-637X/732/1/42
- Asensio-Torres et al. (2021) Asensio-Torres, R., Henning, T., Cantalloube, F., et al. 2021, arXiv e-prints, arXiv:2103.05377. https://arxiv.org/abs/2103.05377
- Bae et al. (2021) Bae, J., Teague, R., & Zhu, Z. 2021, ApJ, 912, 56, doi: 10.3847/1538-4357/abe45e
- Bae et al. (2019) Bae, J., Zhu, Z., Baruteau, C., et al. 2019, ApJ, 884, L41, doi: 10.3847/2041-8213/ab46b0
- Ballering & Eisner (2019) Ballering, N. P., & Eisner, J. A. 2019, AJ, 157, 144, doi: 10.3847/1538-3881/ab0a56
- Birnstiel et al. (2012) Birnstiel, T., Andrews, S. M., & Ercolano, B. 2012, A&A, 544, A79, doi: 10.1051/0004-6361/201219262
- Bitsch et al. (2013) Bitsch, B., Crida, A., Libert, A. S., & Lega, E. 2013, A&A, 555, A124, doi: 10.1051/0004-6361/201220310
- Calvet et al. (2002) Calvet, N., D’Alessio, P., Hartmann, L., et al. 2002, ApJ, 568, 1008, doi: 10.1086/339061
- Calvet et al. (2005) Calvet, N., D’Alessio, P., Watson, D. M., et al. 2005, ApJ, 630, L185, doi: 10.1086/491652
- Dawson & Johnson (2018) Dawson, R. I., & Johnson, J. A. 2018, ARA&A, 56, 175, doi: 10.1146/annurev-astro-081817-051853
- Dodson-Robinson & Salyk (2011) Dodson-Robinson, S. E., & Salyk, C. 2011, ApJ, 738, 131, doi: 10.1088/0004-637X/738/2/131
- Donati et al. (2020) Donati, J. F., Bouvier, J., Alencar, S. H., et al. 2020, MNRAS, 491, 5660, doi: 10.1093/mnras/stz3368
- Dong (2015) Dong, R. 2015, ApJ, 810, 6, doi: 10.1088/0004-637X/810/1/6
- Dong & Fung (2017) Dong, R., & Fung, J. 2017, ApJ, 835, 146, doi: 10.3847/1538-4357/835/2/146
- Dong et al. (2012a) Dong, R., Rafikov, R., Zhu, Z., et al. 2012a, ApJ, 750, 161, doi: 10.1088/0004-637X/750/2/161
- Dong et al. (2012b) Dong, R., Hashimoto, J., Rafikov, R., et al. 2012b, ApJ, 760, 111, doi: 10.1088/0004-637X/760/2/111
- Dunhill et al. (2013) Dunhill, A. C., Alexander, R. D., & Armitage, P. J. 2013, MNRAS, 428, 3072, doi: 10.1093/mnras/sts254
- Espaillat et al. (2011) Espaillat, C., Furlan, E., D’Alessio, P., et al. 2011, ApJ, 728, 49, doi: 10.1088/0004-637X/728/1/49
- Espaillat et al. (2014) Espaillat, C., Muzerolle, J., Najita, J., et al. 2014, in Protostars and Planets VI, ed. H. Beuther, R. S. Klessen, C. P. Dullemond, & T. Henning, 497, doi: 10.2458/azu_uapress_9780816531240-ch022
- Flagg et al. (2019) Flagg, L., Johns-Krull, C. M., Nofi, L., et al. 2019, ApJ, 878, L37, doi: 10.3847/2041-8213/ab276d
- Flaherty et al. (2012) Flaherty, K. M., Muzerolle, J., Rieke, G., et al. 2012, ApJ, 748, 71, doi: 10.1088/0004-637X/748/1/71
- Fung (2015) Fung, J. 2015, PhD thesis, University of Toronto, Canada
- Fung & Chiang (2016) Fung, J., & Chiang, E. 2016, ApJ, 832, 105, doi: 10.3847/0004-637X/832/2/105
- Fung et al. (2014) Fung, J., Shi, J.-M., & Chiang, E. 2014, ApJ, 782, 88, doi: 10.1088/0004-637X/782/2/88
- Guilloteau et al. (2014) Guilloteau, S., Simon, M., Piétu, V., et al. 2014, A&A, 567, A117, doi: 10.1051/0004-6361/201423765
- Isella & Natta (2005) Isella, A., & Natta, A. 2005, A&A, 438, 899, doi: 10.1051/0004-6361:20052773
- Johns-Krull et al. (2016) Johns-Krull, C. M., McLane, J. N., Prato, L., et al. 2016, ApJ, 826, 206, doi: 10.3847/0004-637X/826/2/206
- Keppler et al. (2018) Keppler, M., Benisty, M., Müller, A., et al. 2018, A&A, 617, A44, doi: 10.1051/0004-6361/201832957
- Kim et al. (1994) Kim, S.-H., Martin, P. G., & Hendry, P. D. 1994, ApJ, 422, 164, doi: 10.1086/173714
- Kley & Dirksen (2006) Kley, W., & Dirksen, G. 2006, A&A, 447, 369, doi: 10.1051/0004-6361:20053914
- Kraus et al. (2013) Kraus, S., Ireland, M. J., Sitko, M. L., et al. 2013, ApJ, 768, 80, doi: 10.1088/0004-637X/768/1/80
- Manger et al. (2021) Manger, N., Pfeil, T., & Klahr, H. 2021, MNRAS, doi: 10.1093/mnras/stab2599
- McClure et al. (2013a) McClure, M. K., D’Alessio, P., Calvet, N., et al. 2013a, ApJ, 775, 114, doi: 10.1088/0004-637X/775/2/114
- McClure et al. (2013b) McClure, M. K., Calvet, N., Espaillat, C., et al. 2013b, ApJ, 769, 73, doi: 10.1088/0004-637X/769/1/73
- Miranda & Rafikov (2020) Miranda, R., & Rafikov, R. R. 2020, ApJ, 892, 65, doi: 10.3847/1538-4357/ab791a
- Muley et al. (2021) Muley, D., Dong, R., & Fung, J. 2021, arXiv e-prints, arXiv:2107.06323. https://arxiv.org/abs/2107.06323
- Muley et al. (2019) Muley, D., Fung, J., & van der Marel, N. 2019, ApJ, 879, L2, doi: 10.3847/2041-8213/ab24d0
- Müller et al. (2018) Müller, A., Keppler, M., Henning, T., et al. 2018, A&A, 617, L2, doi: 10.1051/0004-6361/201833584
- Papaloizou et al. (2001) Papaloizou, J. C. B., Nelson, R. P., & Masset, F. 2001, A&A, 366, 263, doi: 10.1051/0004-6361:20000011
- Rafikov (2016) Rafikov, R. R. 2016, ApJ, 831, 122, doi: 10.3847/0004-637X/831/2/122
- Ragusa et al. (2020) Ragusa, E., Alexander, R., Calcino, J., Hirsh, K., & Price, D. J. 2020, MNRAS, 499, 3362, doi: 10.1093/mnras/staa2954
- Ragusa et al. (2018) Ragusa, E., Rosotti, G., Teyssandier, J., et al. 2018, MNRAS, 474, 4460, doi: 10.1093/mnras/stx3094
- Sallum et al. (2015) Sallum, S., Follette, K. B., Eisner, J. A., et al. 2015, Nature, 527, 342, doi: 10.1038/nature15761
- Teyssandier & Lai (2020) Teyssandier, J., & Lai, D. 2020, MNRAS, 495, 3920, doi: 10.1093/mnras/staa1363
- Teyssandier & Ogilvie (2017) Teyssandier, J., & Ogilvie, G. I. 2017, MNRAS, 467, 4577, doi: 10.1093/mnras/stx426
- van der Marel & Mulders (2021) van der Marel, N., & Mulders, G. D. 2021, AJ, 162, 28, doi: 10.3847/1538-3881/ac0255
- van der Marel et al. (2018) van der Marel, N., Williams, J. P., Ansdell, M., et al. 2018, ApJ, 854, 177, doi: 10.3847/1538-4357/aaaa6b
- Whitney et al. (2013) Whitney, B. A., Robitaille, T. P., Bjorkman, J. E., et al. 2013, ApJS, 207, 30, doi: 10.1088/0067-0049/207/2/30
- Zhang et al. (2014) Zhang, K., Isella, A., Carpenter, J. M., & Blake, G. A. 2014, ApJ, 791, 42, doi: 10.1088/0004-637X/791/1/42
- Zhu et al. (2012) Zhu, Z., Nelson, R. P., Dong, R., Espaillat, C., & Hartmann, L. 2012, ApJ, 755, 6, doi: 10.1088/0004-637X/755/1/6
- Zhu et al. (2011) Zhu, Z., Nelson, R. P., Hartmann, L., Espaillat, C., & Calvet, N. 2011, ApJ, 729, 47, doi: 10.1088/0004-637X/729/1/47