New constraints on the minimum mass for thermonuclear lithium burning in brown dwarfs ††thanks: Based on observations made with the Gran Telescopio Canarias (GTC), installed in the Spanish Observatorio del Roque de los Muchachos of the Instituto de Astrofísica de Canarias, in the island of La Palma (programmes GTC100-20B and GTC51-21B).
Abstract
The theory of substellar evolution predicts that there is a sharp mass boundary between lithium and non-lithium brown dwarfs, not far below the substellar-mass limit. The imprint of thermonuclear burning is carved on the surface lithium abundance of substellar-mass objects during the first few hundred million years of their evolution, leading to a sharp boundary between lithium and non-lithium brown dwarfs, so-called, the lithium test. The theoretical predictions can be tested by comparing with observations of lithium in the individual components of binaries with dynamical masses measured from orbital motions. New optical spectroscopic observations of the binaries DENIS J063001.4184014AB and DENIS J225210.7173013AB obtained using the 10.4-m Gran Telescopio de Canarias are reported here. They allow us to re-determine their combined optical spectral types (M9.5 and L6.5, respectively) and to search for the presence of the Li I resonance doublet. The non detection of the Li I feature in the combined spectrum of DENIS J063001.4184014AB is converted into estimates for the depletion of lithium in the individual components of this binary system. In DENIS J225210.7173013AB we report the detection of a weak Li I feature which we tentatively ascribe as arising from the contribution of the T3.5-type secondary. Combining our results with data for seven other brown dwarf binaries in the literature treated in a self-consistent way, we confirm that there is indeed a sharp transition in mass for lithium depletion in brown dwarfs, as expected from theoretical calculations. We estimate such mass boundary is observationally located at 51.48 , which is lower than the theoretical determinations.
keywords:
brown dwarfs – spectroscopy – binaries: visual – abundances – stars: individual: Sahlmann 2 AB1 Introduction
Brown dwarfs are objects that do not have enough mass to settle on the H-burning main-sequence because they develop cores dominated by degenerate electrons as they keep contracting and cooling forever. For solar chemical composition, the limiting mass of a star was found to be located at 73 for completely convective numerical models (Kumar, 1963), which is close to the modern theoretical value of 78.5 (e.g., Baraffe et al., 2015).
Since lithium is destroyed by proton bombardment at temperatures around 2106 K, just below those required for H-fusion, there is a minimum mass for thermonuclear lithium burning (MMLB), which is slightly below the stellar/substellar boundary. The MMLB was estimated to lie at around 63 (Pozio, 1991; Nelson et al., 1993), and the search for the Li I resonance doublet in optical spectra of brown dwarf candidates became known as the lithium test (Magazzu et al., 1993). Objects cooler than effective temperature 2700 K, corresponding to spectral type M7 and later (Rajpurohit et al., 2013), and with lithium detected, are considered as certified bona fide brown dwarfs with masses below 63 (e.g., Tinney, 1998; Kirkpatrick et al., 2000).
Not long after the first bona fide brown dwarf was discovered in the Pleiades cluster (Rebolo et al., 1995), the first brown dwarf binary was revealed (Basri & Martín, 1999). Careful astrometric and spectroscopic monitoring of the gravitational interactions between the components of ultracool binary systems are able to yield dynamical masses that lie below the minimum stellar mass, supporting the brown dwarf status of one or both components (e.g., Zapatero Osorio et al., 2004; Burgasser & Blake, 2009; Dupuy et al., 2009). In some cases the brown dwarf status is confirmed both by dynamical mass and by the detection of lithium (e.g. Sahlmann et al., 2015b; Dupuy & Liu, 2017).
A long-term astrometric monitoring campaign using the FORS2 optical camera mounted on the Very Large Telescope (VLT) focused on 20 ultracool dwarfs (Sahlmann et al., 2014) that had been discovered in a photometric and proper motion study of 4800 squared degrees at low galactic latitude covered by the DENIS survey (Phan-Bao et al., 2008). Two of those objects were found to be binaries. Here we focus on DENIS J063001.4184014AB (hereafter Sahlmann 2 AB, inspired by the Washington Double Star catalog convention of naming objects after the discoverer of the binary nature), which was classified as an M8.5 dwarf from optical low-resolution reconnaissance spectroscopy and it was found to be an astrometric binary with an orbital period of years (Sahlmann et al., 2015a). The dynamical mass of each component in the binary has been obtained from combining the astrometric data with spatially resolved near-infrared imaging, and radial velocities for the primary (Sahlmann et al., 2021). These authors noted that there was no sign of strong Li I resonance doublet in a high-resolution optical spectrum of the system, despite the low masses of and of the components, but they could only place a upper limit of 1 Å on the measurable pseudo-equivalent width (pEW) because of low signal to noise ratio.
The second focus of this work is on the binary DENIS J225210.7173013AB (hereafter Reid 1 AB). This object was identified as an L7.5 nearby ultracool dwarf from near-infrared spectroscopic follow-up of candidates detected in the DENIS survey using CGS4 on UKIRT (Kendall et al., 2004). High resolution images obtained with the Near-Infrared Camera and Multi-Object Spectrometer (NICMOS) on the Hubble Space Telescope (HST) resolved the object into two components with an angular separation of 0.13 arcsec (Reid et al., 2006). These authors also obtained low-resolution near-infrared spectra with Spex on the NASA IRTF telescope and estimated individual spectral types of L61 and T21 for Reid 1 A and Reid 1 B, respectively. Monitoring of the orbital motion of the Reid 1 AB system was carried out with the Canada-France-Hawaii Telescope, the Keck telescopes and HST (Dupuy & Liu, 2017). These authors derived an orbital period of years, and estimated a spectral type of L41 and a mass of for the primary, and a spectral type of T3.50.5 and a mass of for the secondary. No detection of the Li I resonance doublet was reported by Reid et al. (2008) in the optical spectrum of the integrated light from the binary.
This paper is structured as follows: In Section 2, we present new optical spectra specifically aimed at searching for lithium in these two binaries. It turns out that we do not detect lithium in Sahlmann 2 AB, which allows us to infer that both components have experienced Li depletion, and we do detect weak lithium in Reid 1 AB that we interpret as likely coming from the secondary. In Section 3, our results are put in context with other very low-mass (VLM) binaries for which dynamical masses and lithium data are available in the literature. The consistency between ages and metallicities obtained from stars and brown dwarfs for three VLM binaries that are members in hierarchical multiple systems is discussed in Section 4. In Section 5, we compare our results with calculations of lithium burning, and we confirm that there is a sharp transition in dynamical mass between non lithium bearing and lithium bearing brown dwarfs, as expected from the theory of substellar evolution. However, the location of the MMLB from the observational side is not completely consistent with theoretical calculations. Section 6 provides a summary of our conclusions and a discussion of future prospects that are opened by this research.
2 Observations, data reduction and spectroscopic measurements
Optical spectra of the integrated light of the Sahlmann 2 AB and the Reid 1 AB systems were collected in service mode with the Optical System for Imaging and low Resolution Integrated Spectroscopy (OSIRIS; Cepa et al., 2000) instrument on the 10.4-m Gran Telescopio de Canarias (GTC). Sahlmann 2 AB was observed on 2021 February 18th (UT) for programme GTC100-20B, and Reid 1 AB was observed on 2021 August 4th (UT) for programme GTC51-21A. In the later programme, a spectrum of the known (Cruz et al., 2003) L1-type lithium dwarf 2MASS J205754090252302 (hereafter 2M2057-02) was taken with the same instrumental configuration. The Principal Investigator (PI) for both programmes was the lead author of this paper.
The R1000R grating covering the 5100–10000 Å wavelength range and a slit width of 1.0 arcsec, yielding a spectral resolving power of 672 at the central wavelength, was used. The sky conditions were clear and with subarcsecond seeing. Four on-source integrations with individual exposure times of 630 s were obtained for Sahlmann 2 AB, six exposures of 1500 s for Reid 1 AB and also six exposures of 1260 s each for 2M2057+0252. The targets were nodded by 15 arcsec on the slit to allow us for sky subtraction. Parallactic angle was selected to minimize atmospheric refraction. Flat field lamp, arc lamp, and dark frame exposures were used for standard calibrations within the IRAF environment (Tody, 1993).
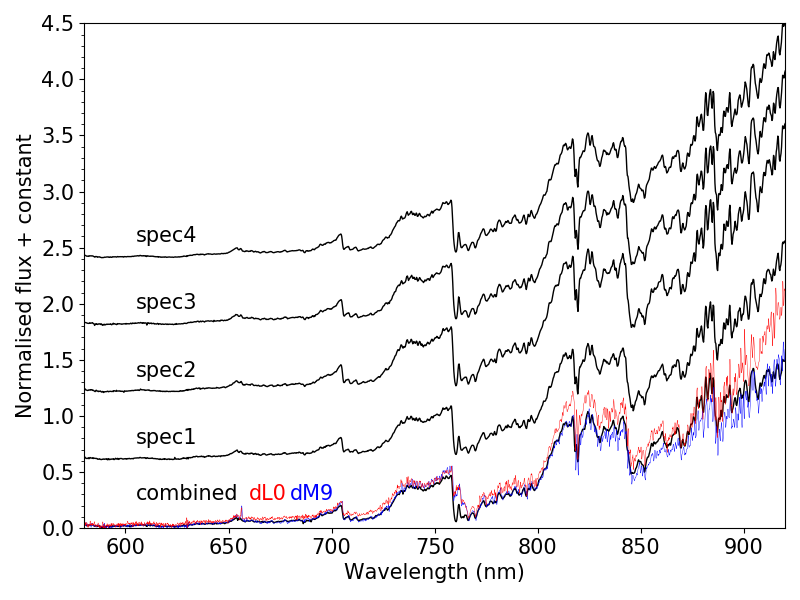
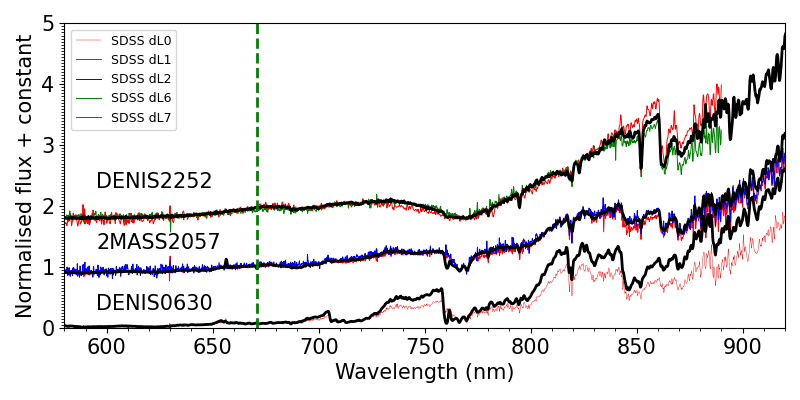
The four individual spectra of Sahlmann 2 AB and the mean combined one are shown in Fig. 1. The mean combined spectrum of Sahlmann 2 AB, Reid 1 AB and the L1-type lithium dwarf 2M2057-02 are displayed in Fig. 2.
Following the same procedure as in our previous work in the nearby open clusters the Hyades (Martín et al., 2018) and Coma Berenices (Martín et al., 2020), where we used similar instrumental setup, spectral types were derived by comparison with field late-M and L dwarfs from the Sloan database (Bochanski et al., 2010; Schmidt et al., 2010). The GTC/OSIRIS mean spectrum of the Sahlmann 2 AB system was found to be intermediate between the M9 and the L0 standards, and hence it is classified as M9.50.5 type, i.e., one spectral subclass later than the classification of M8.5 reported by Phan-Bao et al. (2008). The GTC/OSIRIS mean spectrum of the Reid 1 AB system was found to be intermediate between the L6 and the L7 standards, and hence it is classified as L6.50.5 type, i.e., one spectral subclass earlier than it was estimated in Knapp et al. (2004).
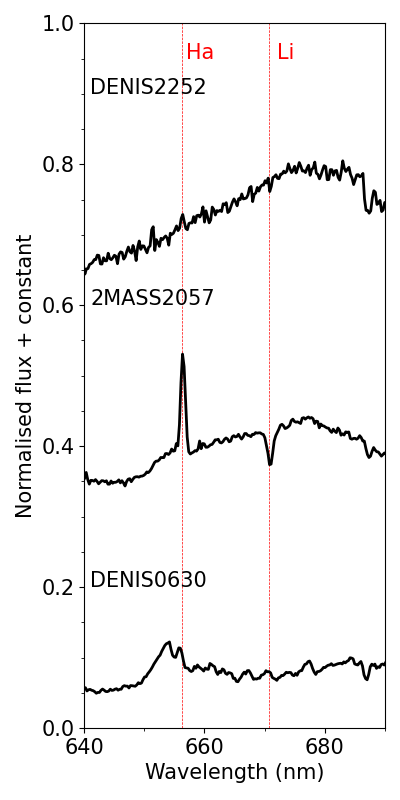
The following atomic spectral features were clearly detected in the spectra: Hα in emission, the Rb I resonance doublet at 780.03 and 794.76 nm, the Na I subordinate doublet at 819.0 nm and the Cs I resonance doublet at 852.11 and 894.30 nm. Pseudo equivalent widths (pEW) were measured by direct integration of the line profiles with respect to the local pseudo-continuum using the task splot in the IRAF environment. Gaussian fitting was applied to each spectral line to help guiding the choice of the integration boundaries for pEW determination.
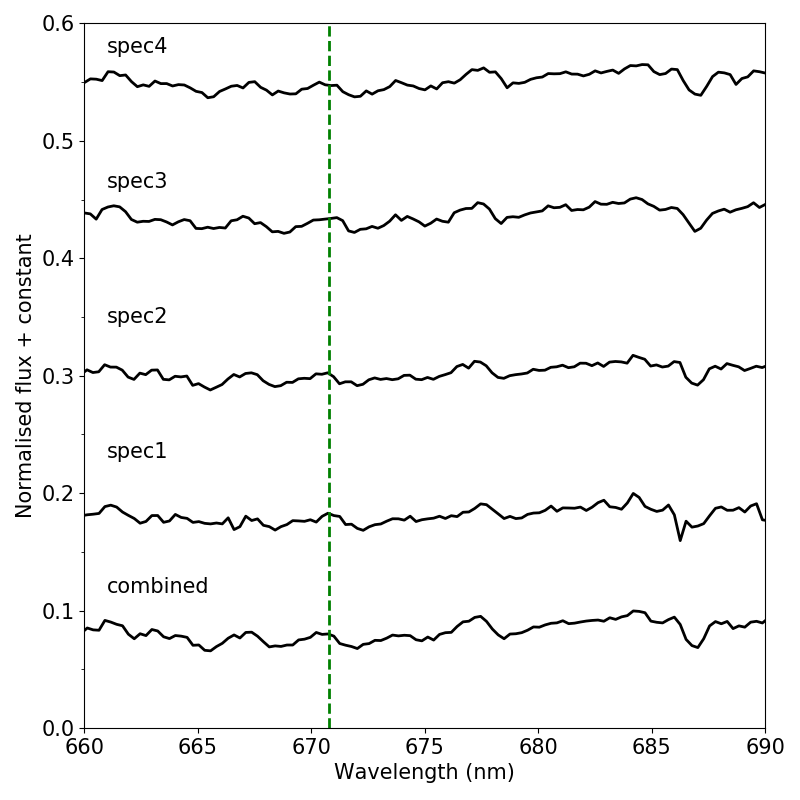
The Li I feature was not detected in any of our GTC/OSIRIS spectra of Sahlmann 2 AB. A zoom on the Li I spectral region of each individual spectrum is shown in the lower panel of Fig. 1. Conversely, a weak Li I feature was detected in our mean combined GTC/OSIRIS spectrum of Reid 1 AB and a strong feature was detected in the L1 standard. These spectra are displayed in Fig. 3.
Signal-to-noise ratios (SNR) in a spectral region relatively free from strong absorption features in the GTC spectra of our targets (between 680.5 and 683.5 nm) were measured with key ”m” in the splot task to estimate the sensitivity of the data to detection of the Li I resonance doublet at 670.8 nm.
We used a spectral region slightly different than that adopted by Martín et al. (2018) because we could see an obvious absorption bandhead in the spectrum of Sahlmann 2 AB in the region between 675.0 and 680.0 nm. Our SNR estimates are conservative because there is no region completely free from absorption features in the spectra of ultracool dwarfs.
The spectroscopic measurements and their uncertainties are summarized in Table LABEL:tab_Phan2:pew. The adopted 1 upper limits and the uncertainties on the pEW measurements come from a conservative assessment of the errors obtained from the SNR of the combined spectra using the equation discussed in Martín et al. (2018), and the errors obtained manually using the task splot with the options for direct integration and gaussian fitting. The weak Hα in emission and the line strength of the Cs I and Na I measured in Sahlmann 2 AB are normal for an old field M9.5 dwarf of solar-metallicity. There is no spectroscopic sign of youth in the Na I doublet of the Sahlmann 2 AB system which is an indicator of low surface gravity if it is weaker than the average for field dwarfs (Martín et al., 2010). The upper limit on the presence of the Li I in Sahlmann 2 AB is rather conservative because in fact we could not see any feature whose pseudo-equivalent width is pEW 0.1 Å around 670.8 nm in any of the spectra. Our adopted upper limit of 0.17 Å on the pEW of the Li I resonance doublet in Sahlmann 2 AB improves the sensitivity to lithium detection in Sahlmann 2 AB by a factor of almost six times over the upper limit of 1 Å reported in Sahlmann et al. (2021) from a noisy (SNR 3) high-resolution UVES spectrum obtained with the European Southern Observatory Very Large Telescope.
For Reid 1 AB, we also detect weak Hα in emission, which is unusual for a late-L dwarf because this chromospheric indicator is detected in less than about 20% of field L5–L8 dwarfs (Pineda et al., 2016). The strength of the Cs I and Rb I features in Reid 1 AB are similar to those reported in the literature (Martín et al., 1999; Kirkpatrick et al., 2000; Lodieu et al., 2015a; Pineda et al., 2016). The detection of a weak Li I feature is highly unusual for a late-L dwarf.
| Name | Hα | Li I | Rb I | Rb I | Na I | Cs I | Cs I | SNR |
|---|---|---|---|---|---|---|---|---|
| 656.28 nm | 670.78 nm | 780.03 nm | 794.76 nm | 819.0 nm | 852.11 nm | 8943.0 nm | 680.5–683.5 nm | |
| Reid 1 AB | 0.90.6 | 0.50.1 | 4.90.1 | 5.60.1 | 4.90.6 | 5.10.1 | 4.50.1 | 26 |
| Sahlmann 2 AB | 1.10.4 | 0.17 | 1.00.2 | 2.30.1 | 8.30.5 | 1.40.1 | 1.50.1 | 53 |
| 2MASS2057-02 | 12.60.2 | 4.50.1 | 2.40.1 | 2.50.1 | 5.60.5 | 1.60.1 | 1.90.1 | 35 |
3 Dynamical mass and lithium in the individual components of VLM binaries
3.1 Lithium depletion in each component of Sahlmann 2 AB
To convert the adopted upper limit pEW Li I of 0.17 Å for the combined light of the Sahlmann 2 AB system into lithium detection limits for each component, the individual contributions to the flux around the spectral region of the Li I resonance doublet are needed. Sahlmann et al. (2021) estimated = 2.80.5 mag from a Keck adaptive optics assisted spatially resolved imaging observation that gave = 1.740.06 mag. These authors also carried out binary fitting of the low-resolution near-infrared spectral data of Sahlmann 2 AB from Bardalez Gagliuffi et al. (2019) and concluded that the best-fit was M8.50.5 for Sahlmann 2 A and L4.52.5 for Sahlmann 2 B. In this work those individual spectral types are adopted. Using as photometric reference the bright ( = 15.0510.014 mag; Costa et al. (2005)) and nearby (d = pc) M8.5 dwarf DENIS J104814.6395606, a color of = 6.600.02 mag is assumed for Sahlmann 2 A. On the other hand, we take an average color of = 7.60.2 mag for the two L5 standards of Liebert & Gizis (2006) as representative of Sahlmann 2 B. From those colors, we obtain = 2.90.2 mag or flux ratio of 14.61.0 around the spectral region of the Li I resonance doublet.
The second step is to estimate the upper limits on the pEW Li I for each component. The contribution to the flux of each component was accounted for by multiplying the pEW by a factor , where , where is the ratio of the fluxes, and the ratio of the areas (Martin & Rebolo, 1993). Assuming that both components in the Sahlmann 2 AB system have the same radii, the upper limit for Sahlmann 2 A is pEW Li I 0.18 Å and for Sahlmann 2 B is pEW Li I 2.7 Å.
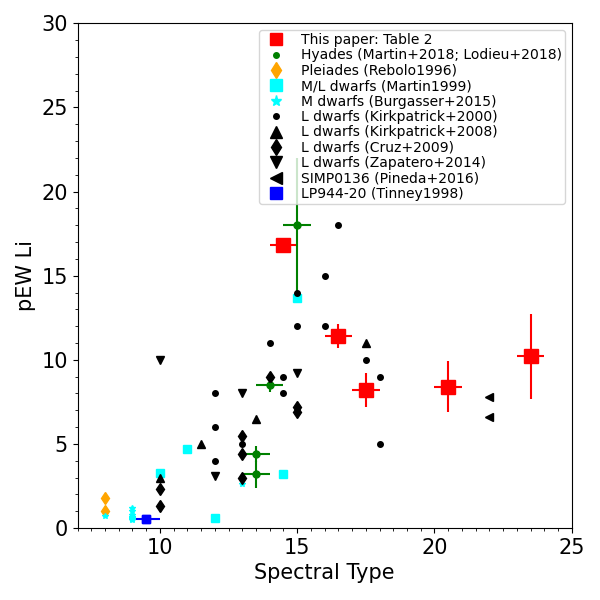
The third step is to compare the upper limit on the pEW Li I for each component to the upper envelope of pEW Li I in ultracool dwarfs as a function of spectral class. The pEW Li I depends strongly on the spectral type as illustrated in Fig. 4. Both components in the Sahlmann 2 AB system have about a factor of at least four weaker pEW Li I than the maximum values for their Li bearing counterparts of the same spectral type implying more than a factor of 10 Li depletion according to the calculations provided in Martín et al. (2018), i.e., they have destroyed more than 90% of their initial Li content. Their Li depletion factors are estimated in more detail in Section 5.
3.2 Lithium in each component of Reid 1 AB
We follow the same approach to disentangle the contributions to the lithium detection in the components of Reid 1 AB. Following Dupuy & Liu (2012), we consider that the primary has a spectral type of L4.51.5, the secondary has a spectral type of T3.50.5, and the magnitude difference between them is 0.980.03 mag in the HST F110W-band. Using the flux ratio at -band between L4.5 and L8.5 derived from the data of Liebert & Gizis (2006), a flux ratio of 3.10.6 in the -band is obtained. This ratio is multiplied by a factor of 6.25 obtained from the flux ratio between the L8 and the T3 dwarfs illustrated in Figure 16 of Burgasser et al. (2003) from Keck LRIS optical spectra to yield a flux ratio of 19.40.8. No lithium detection was reported by Reid et al. (2008) from optical spectra obtained with GMOS with resolving power of R = 1220. They did note lithium detections with GMOS in eight L dwarfs and provided pEW Li I measurements between 3.5 and 12.2 Å for them. Our GTC spectra improve the sensitivity to Li I detection by almost an order of magnitude given that we are able to measure a pEW Li I 0.5 0.1 Å. If this Li I feature comes from the primary, it would mean a very large Li depletion because it is much weaker than those measured in late-L dwarfs. On the other hand, if the Li I feature comes from the secondary, it implies an upper limit of pEW Li I 0.51 Å for Reid 1 A, and pEW Li I 10.22.5 Å for Reid 1 B. Such a value of pEW Li I for Reid 1 B is similar to those reported for the T0.5 dwarf Luhman16B (Lodieu et al., 2015b) and the T2 dwarf SIMP0136+0933 (Pineda et al., 2016), which supports our interpretation that the Li I feature in our integrated light GTC spectrum most likely comes from the secondary.
3.3 Lithium in the individual components of VLM binaries from the literature
We made a search for published results to put our results for Sahlmann 2 AB and Reid 1 AB in context. The criteria employed to select the VLM binaries for this study are the following: total mass 150 , error in total mass 10%, spectral type of the components between M8.50.5 and T3.50.5, and individual dynamical mass of each component determined from orbital motion. The early spectral type limit at M8.50.5 corresponds to the lithium depletion boundary (LDB) at an age of about 150 Myr. At an age of 1125 Myr the LDB has been determined at M7 in the Pleiades cluster by Dahm (2015). The late spectral type limit corresponds to the latest dwarf with lithium detection, beyond which there might be significant chemical depletion of pure neutral lithium atoms due to the formation of Li-bearing molecules (Lodders, 1999; Gharib-Nezhad et al., 2021). Even though it is predicted that the Li I resonance doublet could remain strong down to Teff = 500 K (Burrows et al., 2002), this feature has not yet been observed at spectral type later than T3.50.5 (this work), and thus we limit our study to objects not later than T31.0, corresponding to Teff about 1100 K. The relevant information available in the literature for the sample of seven VLM binaries that meet our criteria, together with that for Sahlmann 2 AB and Reid 1 AB, are summarized in Table LABEL:tab_Phan2:LiMass.
Two of the binaries, namely Epsilon Indi Ba,b, and Luhman 16 AB, are the two closest substellar systems to the Sun, they have dynamic mass measurements (Dupuy et al., 2019; Lazorenko & Sahlmann, 2018), and they have spatially resolved optical spectra of the individual components with sufficient quality to detect the Li I resonance doublet. It is indeed detected in both components of Luhman 16 AB (Faherty et al., 2014; Lodieu et al., 2015b), but not in the components of Epsilon Indi B (King et al., 2010). Epsilon Indi Ba has a spectral type of T11, which is just at the edge of our range of study (considering the uncertainty), and we include it in the analysis. Epsilon Indi Bb has a spectral type of T61, outside our range, and we exclude it from the analysis.
The other five binaries from the literature have published optical spectra for the spatially unresolved light of the components. In the previous section we estimated upper limits to the pEW of the Li I resonance doublet in each individual component of Sahlmann 2 AB. Here, we apply the same method to the four other binaries in our sample for which upper limits on the pEW of the Li I resonance doublet of the integrated light are available in the literature.
The first one that we consider is GJ 569 B, which is composed of two M9 components with an observed magnitude difference of 0.70.2 mag in the HST -band filter (Martín et al., 2006). Since the two components have similar optical spectral type, we assume that that they also have similar color and that the flux ratio in the spectral region of the Li I feature is 1.90.4, which implies that the upper limit of pEW Li I = 0.05 Å from a Keck HIRES spectrum (Zapatero Osorio et al., 2005) translates into an upper limit of 0.08 Å for the primary and 0.17 Å for the secondary.
The second system is 2MASS J070036643157266AB which is composed of an L31 primary and an L6.51.5 secondary with a magnitude difference of 1.490.02 mag in the -band (Dupuy & Liu, 2012). Using the = 5.910.05 color of the L3 standard, and the average color = 6.20.2 mag of the L6 and L7 standards from Liebert & Gizis (2006), we estimate a magnitude difference of 2.30.3 mag in the -band, and a flux ratio of 8.32.7. The upper limit of pEW Li I of 0.3 Å in the combined light is from a spectrum obtained by Thorstensen & Kirkpatrick (2003). From these considerations, we obtain pEW Li I 0.3 Å for 2MASS J07003157 A and pEW Li I 3.6 Å for 2MASS J07003157 B.
The third binary is 2MASS J2132114134148 AB. The A component has a spectral type of L4.51.5, the B component has a spectral type of L8.51.5, and the magnitude difference is 0.850.04 mag in the J-band (Dupuy & Liu, 2012). Using again the data of Liebert & Gizis (2006), a flux ratio of 3.10.6 in the -band is obtained. An optical spectrum of 2MASS J21321341 AB was obtained by Cruz et al. (2007) using the Gemini Multi-object spectrometer (GMOS) with a resolving power of R = 1220. These authors do not note the presence of the Li I resonance doublet in their GMOS data. On the other hand, they note the presence of the Li I feature in a spectrum of the L5 dwarf 2MASS J0310140275645, which has almost the same apparent near-infrared magnitudes as 2MASS J21321341 AB, and it was observed with the same GMOS intrumental configuration. They provide a measurement of pEW Li I 101 Å for 2MASS J0310140275645. Plots of the spectra of both 2MASS J0310140275645 and 2MASS J21321341 AB are available at http://database.bdnyc.org/query. We zoomed the plots on the spectral region from 667.0 nm to 687.0 nm, and we digitized them using the online tool WebPlotDigitizer. Using the IRAF task splot, we obtain a pEW Li I consistent with the published value for 2MASS J0310140275645 and an upper limit for 2MASS J21321341 AB of pEW Li I 0.8 Å from which we derive pEW Li I 1.1 Å for the A component and pEW Li I 3.8 Å for the B component.
| Name | pEW(Li I)1 | pEW(Li I)2 | M1 | M2 | Age | SpT |
|---|---|---|---|---|---|---|
| Å | Å | MJup | MJup | Myr | ||
| GJ 569 Ba,Bb | 0.08 | 0.17 | 44060 | M9,M9 | ||
| Epsilon Indi Ba,Bb | 0.10 | 0.10 | 4000500 | T1,T6 | ||
| 2MASS J07003157 AB | 0.35 | 3.6 | 2000700 | L3,L6.5 | ||
| 2MASS J21321341AB | 1.1 | 3.8 | 1440370 | L4.5,L8.5 | ||
| Reid 1 AB | 0.51 | 10.22.5 | 1110220 | L4.5,T3.5 | ||
| Sahlmann 2 AB | 0.18 | 2.7 | 20050 | M8.5,L4.5 | ||
| Gl 417 BC | 16.80.3 | 49040 | L4.5,L6 | |||
| SDSS J0423414AB | 11.40.7 | 81090 | L6.5,T2.5 | |||
| Luhman 16 AB | 8.21.0 | 8.41.5 | 1000800 | L7.5,T0.5 |
For the two brown dwarf binaries with lithium detections, namely Gl 417 BC and SDSS J04230414AB we check whether or not it is reasonable that both components have preserved their initial lithium content. Gl 417 BC is composed of a L4.51 primary and a L61 secondary with a magnitude difference of 0.3470.025 mag in the -band (Dupuy & Liu, 2012). According to the same authors, SDSS J04230414 AB is composed of an L6.5 primary and a T2.5 secondary with a magnitude difference of 1.180.08 mag in the -band. Using the same procedures as outlined above for binaries with components of similar spectral type, the flux ratios derived for the -band are 1.90.1 and 27.80.9, respectively.
Kirkpatrick et al. (2001) measured a pEW Li I of 11.5 Å for the combined-light spectrum Keck/LRIS of Gl 417 BC obtained with LRIS at Keck-I. They did not give an error bar, but from their Figure 2, we estimate 0.2 Å. We derive a pEW Li I of 16.80.3 Å for the A component. This is consistent with the upper envelope of pEW Li I measured in field L4.5 dwarfs (see Fig. 4). There could be a modest contribution of the B component to the Li I feature, but we cannot quantify it precisely with the data in hand. High spectral resolution spectroscopy might be able to resolve the two Li I features from the components in this system.
Kirkpatrick et al. (2008) measured a pEW Li I of 11 Å for the spatially unresolved spectrum of SDSS J04230414 AB obtained with LRIS at Keck-I. They did not provide an error bar, but the spectrum shown in their Figure 16 is of high quality, and hence we assign an error bar of 0.5 Å, which is the upper limit they assign to their high quality objects without lithium detection. Using the flux ratio we obtain pEW Li I of 11.40.7 Å for the A component, which is also consistent with the upper envelope of Li measurements for L6.5 spectral class (see Fig. 4). The contribution of the B component is negligible because of the high flux ratio of 27.80.9 that we estimated previously.
3.4 Unresolved pairs of brown dwarfs
It has been noted that some of the objects in our sample could be unresolved pairs of brown dwarfs because the evolutionary models cannot provide a consistent account of their age, luminosity and mass. Simon et al. (2006) suggested that GJ 569Bb could be a pair of brown dwarfs with masses of about 40 each. Dupuy & Liu (2017) considered that 2MASS J07003157 B could be composed of two equal mass brown dwarfs with mass of 36.7 MJup each. Sahlmann et al. (2021) proposed that Sahlmann 2 B is made up of two unresolved brown dwarfs with mass of 25 each.
All these possible unresolved candidate pairs have individual masses well below those adopted in this work. Should it be demonstrated that any of them, or all of them, are indeed composed of two lower-mass objects, the non-detection of Li in them could be surprising. We strongly encourage additional observations of these three objects in particular to try to resolve them into their putative pairs, and try to get the lithium detections, spectral types, and individual masses. One possible solution is that the individual masses of the unresolved pairs are so low that their spectral types are cooler than T4, and they might be affected by significant weakening of the Li I resonance doublet due to Li locking into dust grains and molecules.
4 Ages and metallicities from stellar companions
Three of the VLM binaries considered in this study are wide companions of stars and can be assumed they are members in hierarchical multiple systems sharing a common origin. We estimate here the ages and metallicities of these three stars, which can serve as reference in their respective systems.
We inferred the stellar parameters of the three stars using the Bayesian inference code of del Burgo & Allende Prieto (2016, 2018) and incorporating the data from Gaia DR2 (Gaia Collaboration et al., 2018). This statistical method was applied to the PARSEC v1.2S library of stellar evolution models (Bressan et al., 2012). It has been proven that its predicted masses for main-sequence stars are, on average, within 4% of accuracy when compared with the dynamical masses of detached eclipsing binaries (del Burgo & Allende Prieto, 2018). In this analysis, the code takes as input the absolute magnitude (obtained from the apparent magnitude and the parallax), colour, [Fe/H], and their uncertainties, returning theoretical predictions for a series of stellar parameters. We adopted the corrected Gaia photometry passbands (, , and ) from Maíz Apellániz & Weiler (2018). The values for the iron abundance [Fe/H] were averaged from those with given uncertainties for these stars in the PASTEL catalogue, which is based on high-resolution spectra (Soubiran et al., 2016).
| Name | Alternative name | [Fe/H] | |||||
|---|---|---|---|---|---|---|---|
| () | () | () | () | (dex) | |||
| Gl 417 | HD 97334 | G2/? | 6.2410 0.0006 | 6.5882 0.0028 | 5.802 0.005 | 44.14 0.04 | 0.07 0.04 |
| GJ 569 A | BD162708 | M3V | 9.1256 0.0008 | 10.350 0.003 | 8.059 0.003 | 100.68 0.05 | -0.15 0.20 |
| Epsilon Indi | HD 209100 | K5V | 4.273 0.005 | 4.9221 0.0008 | 3.6386 0.0018 | 274.80 0.25 | -0.13 0.09 |
| Name | phase | ||||||
|---|---|---|---|---|---|---|---|
| (R☉) | () | (M☉) | (: cm s-2) | (: L☉) | |||
| Gl 417 | 1.032 0.009 | 5913 18 | 1.063 0.028 | 4.437 0.017 | 0.070 0.005 | 2600 1180 | MS |
| GJ 569 A | 0.540 0.010 | 3432 42 | 0.44 0.07 | 4.61 0.10 | -1.438 0.008 | 87 | PMS |
| Epsilon Indi | 0.7068 0.0028 | 4676 8 | 0.730 0.014 | 4.603 0.010 | -0.667 0.004 | 92662114 | MS |
Gl 417 A: Our Bayesian analysis provides a most likely mean age of 2.601.18 Gyr, on the Main-Sequence (MS). Kirkpatrick et al. (2001) estimated an age in the range from 80 to 300 Myr, based on several indicators such as the X-ray luminosity (log(LX/Lbol)= 4.55), the CaII emission (log=-4.40), and the rotational period (7.6 days). However, Dupuy et al. (2019) derived a gyrochronology age of 750 Myr and found the estimate of Kirkpatrick et al. (2001) inconsistent. The TESS light curve also yields a rotational period of about 7.5 days, which suggests an age similar to the Praesepe open cluster (670 Myr) according to the calibration provided by Curtis et al. (2019). The age inferred from the substellar evolution models is 0.490.04 Gyr (Dupuy & Liu, 2017), which is in good agreement with our estimate (within 1.8).
GJ 569 A: Our analysis places it on the pre-MS phase, with an upper limit for the mean age 240 Myr. This is somewhat lower, but not far from the value of 300 Myr from its kinematics, which places it as a member of the Ursa Major moving group (Kenworthy et al., 2001). The age inferred from the substellar evolution models is 44060 Myr (Dupuy & Liu, 2017), which is somewhat older than the PMS age that we obtain for the stellar primary, but within 1.75.
Epsilon Indi A: We infer a mean age of 92 Gyr (on the MS). This is consistent with the value of 9.87 Gyr derived from the kinematics (Eker et al., 2015), but greater than the range of 3.75.7 Gyr given by Feng et al. (2019), which is based on the same rotation-age relationship of Eker et al. (2015). The TESS light curve indicates a rotation period longer than 18 days, which would imply an age older than 1 Gyr (Curtis et al., 2019). The age from the substellar evolution models is 4.00.5 Gyr (Dieterich et al., 2018), which a factor of two younger than our Bayesian estimate, comparing mean values, but only within 2 of discrepancy in view of the uncertainties.
For all the three stellar companions, our Bayesian analysis and those obtained by other authors for the brown dwarfs are in agreement within 2 uncertainty level. We note that our conclusions on the location of the MMLB does not depend on the precise age adopted for the systems under study, as long as they are not extremely young (150 Myr). If any of the systems under study would be younger than about 150 Myr, the MMLB could be shifted to higher massess because the brown dwarfs may not have had enough time to complete their Li burning.
The iron abundances of the three stars are similar to the Sun (within about 50%), providing support to our assumption of solar metallicity for the comparison of the observed MMLB with the theoretical MMLB, which is discussed in the next section.
5 The minimum mass for thermonuclear lithium burning in brown dwarfs
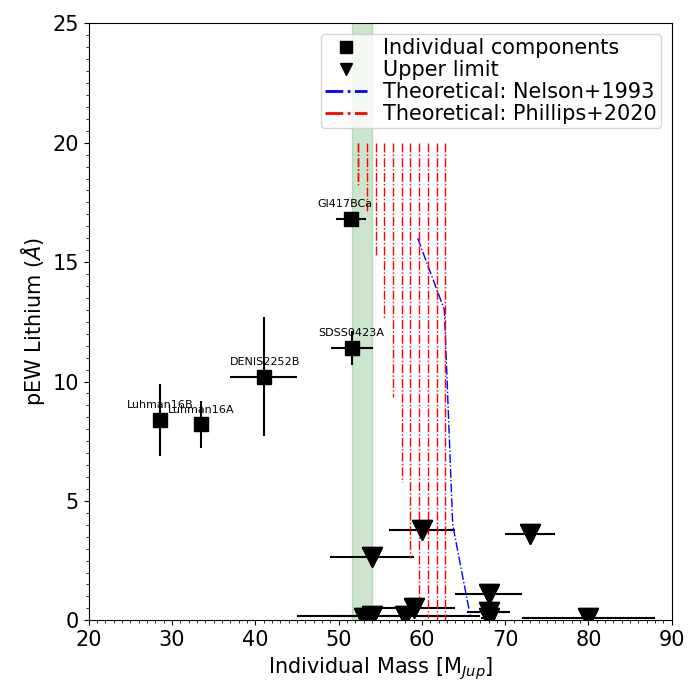
Detailed theoretical calculations of the minimum mass for thermonuclear lithium burning (MMLB) have been carried out by several groups using different numerical codes. Pozio (1991) found that a 63 model with solar composition could destroy 90% of its initial Li content. Nelson et al. (1993) obtained slightly less Li depletion, i.e. their model with 65 destroyed 90% of lithium.Chabrier et al. (1996) found that their model with was able to destroy 99% of lithium. The very recent models with updated equation of state and opacities (Phillips et al., 2020) destroy 90% of lithium at a mass of . In this work we adopt as the definition of the MMLB the mass at which the permanent imprint of thermonuclear lithium fusion leaves an amount of 10% of the original Li abundance in the photosphere of the brown dwarf. The calculations of Nelson et al. (1993) and Phillips et al. (2020) bracket the range of theoretical MMLB values found in the literature, which we summarize as MMLBth = 635.
The availability of individual dynamical masses, effective temperatures, bolometric luminosities and lithium data for the components of very low-mass (VLM) binary systems makes it possible to test observationally the theoretical predictions for the hydrogen and lithium burning minimum masses. An early attempt to carry out such a test was performed by Zapatero Osorio et al. (2005) using only GJ 569B, but the uncertainties were to high to draw strong conclusions. Based on a sample of 13 VLM binaries, the minimum mass for hydrogen burning (MMHB) was estimated at and the MMLB at by Dupuy & Liu (2017). They noted that their results were in agreement with the models of Baraffe et al. (2015), but not with those by Burrows et al. (1997).
A comparison between the pEW versus dynamical mass data and two different sets of evolutionary models is illustrated in Fig. 5. The data and the models coincide on the fact that there is a sharp mass boundary between lithium depletion versus preservation in brown dwarfs. However, the data suggest that the boundary is displaced to lower mass than what the models predict, as can be appreciated by eye from the location of the boundary between the objects with and without lithium, depicted as a green band in Fig. 5, and the location of the theoretical curves. Random uncertainties in the dynamical mass measurements could make the objects scatter around the true MMLB, making it appear as if some objects with lithium could have a mass higher than other objects without lithium. Other factors such as a spread in age or metallicity could also make the MMLB wider. However, that is not observed, suggesting that mass is by far the single most dominant factor.
5.1 Lithium abundances, lithium depletion factors and the observed mass boundary
We used the pEW values listed in Table LABEL:tab_Phan2:LiMass and the basic parameters from the literature Lodieu et al. (2015b); Dupuy & Liu (2017); Dupuy et al. (2019), to calculate the Li abundances or upper limits for 14 individual components of VLM binaries using the same procedures as in our previous work on L-type members in the Coma Ber and Hyades open clusters (Martín et al., 2018, 2020). The resulting abundances and depletion factors are summarized in Table LABEL:tab_Phan2:LiAbundances. For each object, we also estimated the Li depletion factor predicted by the models of Phillips et al. (2020) using the age and mass estimates given in Table LABEL:tab_Phan2:LiMass. We find a good agreement between the Li depletion factors estimated from the observations and those predicted by the models, except for the two components of Sahlmann 2 AB which are both more depleted than the theoretical expectation. Therefore, we note that this binary system is particularly critical to test the validity of the models.
| Name | log (Lbol/L⊙) | Teff | log g | pEW(Li I)obs/ | logN(Li) | Li depletion | Li depletion |
|---|---|---|---|---|---|---|---|
| (K) | pEW(Li I)max | (observed) | (predicted) | ||||
| GJ 569 Ba | -3.440.04 | 242040 | 5.2 | 0.04 | 0.5 | 99.5% | 100% |
| GJ 569 Bb | -3.670.03 | 217050 | 5.2 | 0.11 | 1.3 | 95% | 1-100% |
| Epsilon Indi Ba | -4.700.02 | 131010 | 5.4 | 0.01 | 0.1 | 99.9% | 100% |
| 2MASS J07003157 A | -3.950.04 | 186040 | 5.4 | 0.05 | 0.6 | 99.5% | 100% |
| 2MASS J07003157 B | -4.450.04 | 1430100 | 5.4 | 0.24 | 2.0 | 90% | 100% |
| 2MASS J21321341A | -4.220.05 | 5.3 | 0.06 | 0.8 | 99.5% | 100% | |
| 2MASS J21321341B | 5.3 | 0.42 | 2.5 | 80% | 35-100% | ||
| Reid 1 A | 159050 | 5.3 | 0.05 | 0.6 | 99.5% | 85-100% | |
| Reid 1 B | 5.2 | 1.00.1 | 3.30.1 | 0-10% | 0% | ||
| Sahlmann 2 A | -3.30.1 | 2400100 | 5.1 | 0.10 | 1.3 | 99% | 0-93% |
| Sahlmann 2 B | -4.10.1 | 1400100 | 5.1 | 0.16 | 1.7 | 97.5% | 0-36% |
| Gl 417 B | -4.130.03 | 5.1 | 1.00.1 | 3.30.1 | 0-10% | 1-11% | |
| SDSS J0423414A | -4.410.04 | 5.2 | 0.80.2 | 3.10.3 | 0-70% | 1-14% | |
| Luhman 16 A | -4.680.08 | 5.0 | 0.80.2 | 3.10.3 | 0-70% | 0% | |
| Luhman 16 B | -4.710.10 | 4.9 | 1.00.1 | 3.30.1 | 0-10% | 0% |
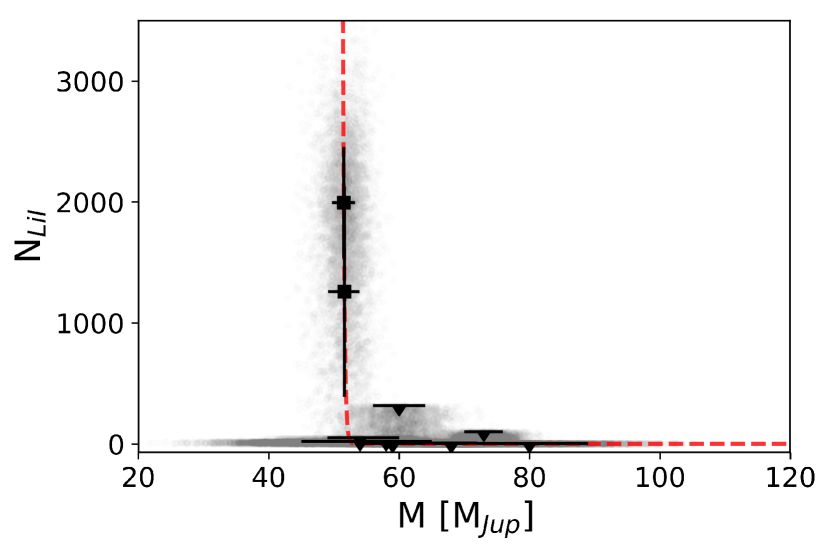
We performed curve fitting for our compilation of Li abundance versus individual dynamical mass. To explore the constraints obtained from the data on the location of the MMLB, we chose a natural exponential decay function and excluded the two points corresponding to the binary components of the system Luhman 16AB as well as Reid1 B because they are well below the MMLB boundary. We neither employ Epsilon Indi Bb in the analysis. The curve_fit function of the Open Source Python111https://docs.python.org scientific library SciPy (Virtanen et al., 2020) was used to derive the free parameters , , and . A Monte Carlo simulation was carried out to derive the uncertainties. We generated 10 000 distributions of points and applied our fitting approach rejecting bad fits before extracting the statistics. Assuming the original pairs and their uncertainties adjust to Gaussian distributions, we employed the NumPy222https://numpy.org/ function random.normal to generate suitable samples. For the upper limits of Li abundance, we used the NumPy function random.random. The exponential that fits the original distribution has a very steep decay. For we adopted the value that better fits this distribution and increased its uncertainty in view of the shift with respect to the most likely value of that emerges from the Monte Carlo simulation. Our approach yields MJup.
An exponential law is a well-motivated approximation based on the estimate that thermonuclear Li burning is a extremely strong function of the maximum central temperature attained in the interior of brown dwarfs (Bildsten et al., 1997). Besides, the observed data distribution supports it. In conclusion, we obtain MMLBobs= 51.48 . The result and scaffolding of this fitting exercise are illustrated in Fig. 6.
.
6 Final remarks and future prospects
The main goal of this work is to set observational constraints on the MMLB for solar metallicity and intermediate age brown dwarfs, and to test the validity of evolutionary models. We have considered a total of 15 individual components that belong to nine different binary systems, six of them are in common with the study of Dupuy & Liu (2017). The new binaries considered in this work are GJ 569 Ba,Bb, Epsilon Indi Ba,Bb, and Sahlmann 2 AB, and we have provided additional data for the binary Reid 1 AB.
From the study of this sample of 15 objects with dynamical mass and lithium data, we have determined a value of MMLBobs=51.48 , which is lower than all of the available theoretical determinations of the MMLB location by the following amount: MMLBMMLB= 12.0 . This difference is minimized, but not cancelled for the models computed by Phillips et al. (2020). There seems to be a historical trend that when the evolutionary models get updated their predicted MMLB diminishes slightly. Further updates may bring the observational and theoretical MMLB to a complete agreement.
Uncertainties in the models of lithium depletion for very low mass stars and brown dwarfs have been discussed in detail by Burke et al. (2004), although they neither consider masses below , nor ages older than 200 Myr. Sources of theoretical uncertainty considered by those authors include the equation of state, the treatment of convective transport, the opacity data, the outer (atmospheric) and inner boundary conditions, and the effects of rotation. Another point of interest for the theoretical determination of the MMLB are the effects of dark matter accretion in the evolution of brown dwarfs, which have been suggested to be of potential relevance for the location of the H-burning minimum mass (Zentner & Hearin, 2011). In view of the increasing precision on the determination of the MMLB from BD binaries, it would be worthwhile to explore the effects of different dark matter candidates in the lithium burning of fully convective stars and degenerate brown dwarfs, particularly in environments where condensations of dark matter may be expected, such as the Galactic center.
From the observational side, it is clear that more work is worthwhile to increase the accuracy of dynamical masses, and to expand the sample of brown dwarf binaries with dynamical masses and lithium abundance determination. With a larger sample it should be possible to increase the statistical significance of the observational constraints on the MMLB, and to check on the effects of age, metallicity, rotation, and other factors that could play a role in shaping the imprint of lithium burning in brown dwarf evolution. In future work, we plan to present new observations of lithium in brown dwarf binaries aimed at increasing the constraints on the determination of the MMLB as a function of age, mass, metallicity, rotation, and possible accretion and accumulation of dark matter in environments close to the Galactic center.
Besides testing substellar evolutionary models, the determination of the observational MMLB can provide a useful benchmark to understand the properties of transiting brown dwarfs for which dynamical mass determinations can also be made. There is a growing number of these systems being discovered thanks to several transit surveys (e.g., Acton et al. (2021)). Comparison of their present mass, presence of lithium, stellar age, and the observational MMLB can set interesting constraints on their mass loss rate.
Acknowledgements
This research has been supported by the Spanish Ministry of Economy and Competitiveness (MINECO) and the Fondo Europeo de Desarrollo Regional (FEDER) under grants PID2019-109522GB-C53 and PID2019-107061GB-C66. This research made use of the databases at the Centre de Données astronomiques de Strasbourg (http://cds.u-strasbg.fr); NASA’s Astrophysics Data System Service (http://adsabs.harvard.edu/abstract_service.html), and the paper repositories at arXiv. This research has made use of the SIMBAD database, operated at CDS, Strasbourg, France and NASA’s Astrophysics Data System. This research has made use of the VizieR catalogue access tool, CDS, Strasbourg, France. The original description of the VizieR service was published in A&AS 143, 23. This work has made use of data from the European Space Agency (ESA) mission Gaia (https://www.cosmos.esa.int/gaia), processed by the Gaia Data Processing and Analysis Consortium (DPAC, https://www.cosmos.esa.int/web/gaia/dpac/consortium). Funding for the DPAC has been provided by national institutions, in particular the institutions participating in the Gaia Multilateral Agreement. This research made use of Matplotlib and Scipy, two community-developed core Python packages. We thank Gilles Chabrier and Isabelle Baraffe for kindly providing a digitized version of the calculations that are used in Fig. 5 and for comments on the manuscript. We are grateful for the helpful referee review provided by John Gizis, and we also thank Trent Dupuy, Yakiv Pavlenko, Rafael Rebolo, Victor Sanchez Bejar and Maria Rosa Zapatero Osorio for reviewing the manuscript and providing comments. Jun-Yan Zhang assisted with digitizing the spectra from the BDNYC database.
Data availability
The data underlying this article will be placed in the GTC archive.
References
- Acton et al. (2021) Acton J. S., et al., 2021, arXiv e-prints, p. arXiv:2105.08574
- Baraffe et al. (2015) Baraffe I., Homeier D., Allard F., Chabrier G., 2015, A&A, 577, A42
- Bardalez Gagliuffi et al. (2019) Bardalez Gagliuffi D. C., et al., 2019, ApJ, 883, 205
- Basri & Martín (1999) Basri G., Martín E. L., 1999, AJ, 118, 2460
- Bildsten et al. (1997) Bildsten L., Brown E. F., Matzner C. D., Ushomirsky G., 1997, ApJ, 482, 442
- Bochanski et al. (2010) Bochanski J. J., Hawley S. L., Covey K. R., West A. A., Reid I. N., Golimowski D. A., Ivezić Ž., 2010, AJ, 139, 2679
- Bressan et al. (2012) Bressan A., Marigo P., Girardi L., Salasnich B., Dal Cero C., Rubele S., Nanni A., 2012, MNRAS, 427, 127
- Burgasser & Blake (2009) Burgasser A. J., Blake C. H., 2009, AJ, 137, 4621
- Burgasser et al. (2003) Burgasser A. J., Kirkpatrick J. D., Liebert J., Burrows A., 2003, ApJ, 594, 510
- Burgasser et al. (2015) Burgasser A. J., et al., 2015, AJ, 149, 104
- Burke et al. (2004) Burke C. J., Pinsonneault M. H., Sills A., 2004, ApJ, 604, 272
- Burrows et al. (1997) Burrows A., et al., 1997, ApJ, 491, 856
- Burrows et al. (2002) Burrows A., Ram R. S., Bernath P., Sharp C. M., Milsom J. A., 2002, ApJ, 577, 986
- Cepa et al. (2000) Cepa J., et al., 2000, in M. Iye & A. F. Moorwood ed., Society of Photo-Optical Instrumentation Engineers (SPIE) Conference Series Vol. 4008, Society of Photo-Optical Instrumentation Engineers (SPIE) Conference Series. pp 623–631
- Chabrier et al. (1996) Chabrier G., Baraffe I., Plez B., 1996, ApJ, 459, L91
- Costa et al. (2005) Costa E., Méndez R. A., Jao W. C., Henry T. J., Subasavage J. P., Brown M. A., Ianna P. A., Bartlett J., 2005, AJ, 130, 337
- Cruz et al. (2003) Cruz K. L., Reid I. N., Liebert J., Kirkpatrick J. D., Lowrance P. J., 2003, AJ, 126, 2421
- Cruz et al. (2007) Cruz K. L., et al., 2007, AJ, 133, 439
- Cruz et al. (2009) Cruz K. L., Kirkpatrick J. D., Burgasser A. J., 2009, AJ, 137, 3345
- Curtis et al. (2019) Curtis J. L., Agüeros M. A., Douglas S. T., Meibom S., 2019, ApJ, 879, 49
- Dahm (2015) Dahm S. E., 2015, ApJ, 813, 108
- Dieterich et al. (2018) Dieterich S. B., et al., 2018, ApJ, 865, 28
- Dupuy & Liu (2012) Dupuy T. J., Liu M. C., 2012, ApJS, 201, 19
- Dupuy & Liu (2017) Dupuy T. J., Liu M. C., 2017, ApJS, 231, 15
- Dupuy et al. (2009) Dupuy T. J., Liu M. C., Ireland M. J., 2009, ApJ, 699, 168
- Dupuy et al. (2019) Dupuy T. J., et al., 2019, AJ, 158, 174
- Eker et al. (2015) Eker Z., et al., 2015, AJ, 149, 131
- Faherty et al. (2014) Faherty J. K., Beletsky Y., Burgasser A. J., Tinney C., Osip D. J., Filippazzo J. C., Simcoe R. A., 2014, ApJ, 790, 90
- Feng et al. (2019) Feng F., et al., 2019, ApJS, 242, 25
- Gaia Collaboration et al. (2018) Gaia Collaboration Brown A. G. A., Vallenari A., Prusti T., de Bruijne J. H. J., Babusiaux C., Bailer-Jones C. A. L., 2018, preprint
- Gharib-Nezhad et al. (2021) Gharib-Nezhad E., Marley M. S., Batalha N. E., Visscher C., Freedman R. S., Lupu R. E., 2021, arXiv e-prints, p. arXiv:2106.00781
- Hunter (2007) Hunter J. D., 2007, Computing in Science and Engineering, 9
- Kendall et al. (2004) Kendall T. R., Delfosse X., Martín E. L., Forveille T., 2004, A&A, 416, L17
- Kenworthy et al. (2001) Kenworthy M., et al., 2001, ApJ, 554, L67
- King et al. (2010) King R. R., McCaughrean M. J., Homeier D., Allard F., Scholz R. D., Lodieu N., 2010, A&A, 510, 99
- Kirkpatrick et al. (2000) Kirkpatrick J. D., et al., 2000, AJ, 120, 447
- Kirkpatrick et al. (2001) Kirkpatrick J. D., Dahn C. C., Monet D. G., Reid I. N., Gizis J. E., Liebert J., Burgasser A. J., 2001, AJ, 121, 3235
- Kirkpatrick et al. (2008) Kirkpatrick J. D., et al., 2008, ApJ, 689, 1295
- Knapp et al. (2004) Knapp G. R., et al., 2004, AJ, 127, 3553
- Kumar (1963) Kumar S. S., 1963, ApJ, 137, 1121
- Lazorenko & Sahlmann (2018) Lazorenko P. F., Sahlmann J., 2018, A&A, 618, A111
- Liebert & Gizis (2006) Liebert J., Gizis J. E., 2006, PASP, 118, 659
- Lodders (1999) Lodders K., 1999, ApJ, 519, 793
- Lodieu et al. (2015a) Lodieu N., Zapatero Osorio M. R., Rebolo R., Béjar V. J. S., Pavlenko Y., Pérez-Garrido A., 2015a, A&A, 581, A73
- Lodieu et al. (2015b) Lodieu N., Zapatero Osorio M. R., Rebolo R., Béjar V. J. S., Pavlenko Y., Pérez-Garrido A., 2015b, A&A, 581, A73
- Lodieu et al. (2018) Lodieu N., Rebolo R., Pérez-Garrido A., 2018, A&A, 615, L12
- Magazzu et al. (1993) Magazzu A., Martin E. L., Rebolo R., 1993, ApJ, 404, L17
- Maíz Apellániz & Weiler (2018) Maíz Apellániz J., Weiler M., 2018, A&A, 619, A180
- Martin & Rebolo (1993) Martin E. L., Rebolo R., 1993, A&A, 274, 274
- Martín et al. (1999) Martín E. L., Delfosse X., Basri G., Goldman B., Forveille T., Zapatero Osorio M. R., 1999, AJ, 118, 2466
- Martín et al. (2006) Martín E. L., Brandner W., Bouy H., Basri G., Davis J., Deshpande R., Montgomery M. M., 2006, A&A, 456, 253
- Martín et al. (2010) Martín E. L., et al., 2010, A&A, 517, A53
- Martín et al. (2018) Martín E. L., Lodieu N., Pavlenko Y., Béjar V. J. S., 2018, ApJ, 856, 40
- Martín et al. (2020) Martín E. L., Lodieu N., Béjar V. J. S., 2020, A&A, 640, A9
- Nelson et al. (1993) Nelson L. A., Rappaport S., Chiang E., 1993, ApJ, 413, 364
- Phan-Bao et al. (2008) Phan-Bao N., et al., 2008, MNRAS, 383, 831
- Phillips et al. (2020) Phillips M. W., et al., 2020, A&A, A38, 637
- Pineda et al. (2016) Pineda J. S., Hallinan G., Kirkpatrick J. D., Cotter G., Kao M. M., Mooley K., 2016, ApJ, 826, 73
- Pozio (1991) Pozio F., 1991, Mem. Soc. Astron. Italiana, 62, 171
- Rajpurohit et al. (2013) Rajpurohit A. S., Reylé C., Allard F., Homeier D., Schultheis M., Bessell M. S., Robin A. C., 2013, preprint
- Rebolo et al. (1995) Rebolo R., Zapatero Osorio M. R., Martín E. L., 1995, Nature, 377, 129
- Rebolo et al. (1996) Rebolo R., Martin E. L., Basri G., Marcy G. W., Zapatero-Osorio M. R., 1996, ApJ, 469, L53
- Reid et al. (2006) Reid I. N., Lewitus E., Burgasser A. J., Cruz K. L., 2006, ApJ, 639, 1114
- Reid et al. (2008) Reid I. N., Cruz K. L., Kirkpatrick J. D., Allen P. R., Mungall F., Liebert J., Lowrance P., Sweet A., 2008, AJ, 136, 1290
- Sahlmann et al. (2014) Sahlmann J., Lazorenko P. F., Ségransan D., Martín E. L., Mayor M., Queloz D., Udry S., 2014, A&A, 565, A20
- Sahlmann et al. (2015a) Sahlmann J., Lazorenko P. F., Ségransan D., Martín E. L., Mayor M., Queloz D., Udry S., 2015a, A&A, 577, A15
- Sahlmann et al. (2015b) Sahlmann J., et al., 2015b, A&A, 579, A61
- Sahlmann et al. (2021) Sahlmann J., et al., 2021, MNRAS, 500, 5453
- Schmidt et al. (2010) Schmidt S. J., West A. A., Hawley S. L., Pineda J. S., 2010, AJ, 139, 1808
- Simon et al. (2006) Simon M., Bender C., Prato L., 2006, ApJ, 644, 1183
- Soubiran et al. (2016) Soubiran C., Le Campion J.-F., Brouillet N., Chemin L., 2016, A&A, 591, A118
- Thorstensen & Kirkpatrick (2003) Thorstensen J. R., Kirkpatrick J. D., 2003, PASP, 115, 1207
- Tinney (1998) Tinney C. G., 1998, MNRAS, 296, L42
- Tody (1993) Tody D., 1993, in Hanisch R. J., Brissenden R. J. V., Barnes J., eds, Astronomical Society of the Pacific Conference Series Vol. 52, Astronomical Data Analysis Software and Systems II. p. 173
- Virtanen et al. (2020) Virtanen P., et al., 2020, Nature Methods, 17, 261
- Zapatero Osorio et al. (2004) Zapatero Osorio M. R., Lane B. F., Pavlenko Y., Martín E. L., Britton M., Kulkarni S. R., 2004, ApJ, 615, 958
- Zapatero Osorio et al. (2005) Zapatero Osorio M. R., Martín E. L., Lane B. F., Pavlenko Y., Bouy H., Baraffe I., Basri G., 2005, Astronomische Nachrichten, 326, 948
- Zentner & Hearin (2011) Zentner A. R., Hearin A. P., 2011, Phys. Rev. D, 84, 101302
- del Burgo & Allende Prieto (2016) del Burgo C., Allende Prieto C., 2016, MNRAS, 463, 1400
- del Burgo & Allende Prieto (2018) del Burgo C., Allende Prieto C., 2018, MNRAS, 479, 1953