Double Proton Transfer in Hydrated Formic Acid Dimer: Interplay of Spatial Symmetry and Solvent-Generated Force on Reactivity
Abstract
The double proton transfer (DPT) reaction in hydrated formic acid dimer (FAD) is investigated at molecular-level detail. For this, a global and reactive machine learned (ML) potential energy surface (PES) is developed to run extensive (more than 100 ns) mixed ML/MM molecular dynamics (MD) simulations in explicit molecular mechanics (MM) solvent at MP2-quality for the solute. Simulations with fixed - as in a conventional empirical force field - and conformationally fluctuating - as available from the ML-based PES - charge models for FAD shows significant impact on the competition between DPT and dissociation of FAD into two formic acid monomers. With increasing temperature the barrier height for DPT in solution changes by about 10 % ( kcal/mol) between 300 K and 600 K. The rate for DPT is largest, ns-1, at 350 K and decreases for higher temperatures due to destabilisation and increased probability for dissociation of FAD. The water solvent is found to promote the first proton transfer by exerting a favourable solvent-induced Coulomb force along the O–HO hydrogen bond whereas the second proton transfer is significantly controlled by the O–O separation and other conformational degrees of freedom. Double proton transfer in hydrated FAD is found to involve a subtle interplay and balance between structural and electrostatic factors.
University of Basel]Department of Chemistry, University of Basel, Klingelbergstrasse 80, CH-4056 Basel, Switzerland. University of Basel]Department of Chemistry, University of Basel, Klingelbergstrasse 80, CH-4056 Basel, Switzerland. University of Basel]Department of Chemistry, University of Basel, Klingelbergstrasse 80, CH-4056 Basel, Switzerland.
1 Introduction
Understanding the molecular details of chemical reactions in solution
is one of the challenges in physical and general chemistry at
large.1, 2, 3, 4, 5, 6, 7, 8, 9, 10
These processes are at the center of interest of organic, inorganic and
biological
chemistry as the environment in which they take place can determine
reaction products, their rates and propensities. However, the direct
and atomistically resolved experimental characterization by which the
solvent influences reactions is challenging because simultaneous
control over temporal (i.e. “rates”) and spatial (“collocation”
and local solvation) aspects of the process along the progression
coordinate is rarely possible. On the other hand, computer simulations
have matured to a degree that allows the study of realistic processes
at a sufficiently high level of theory including the
environment.11, 12
More specifically, polar solvents such as water, can stabilize the
transitions state (TS) of the
reactant.13, 14, 4 For the Claisen
rearrangement the origin of the catalytic effect of the water solvent
is the differentially stronger hydrogen bonding to the TS structure
(allyl phenyl ether) compared with that to the reactant structure
because the TS is more polar which lowers the reaction
barrier.15, 16 Further stabilization of the TS
and lowering of the reaction barrier by the water solvent can be
affected by solvent polarizability and dipole-dipole interaction
between solute in its TS structure and the solvent.16
The explicit description of solvent effects by full ab initio
MD simulations for reactive systems in solution is computationally
very demanding and can be typically only followed on the picosecond
time scale.17, 18 To avoid this, the
(reactive) solute can be treated quantum mechanically (QM - ranging
from tight-binding to post-Hartree-Fock methods) whereas the remaining
degrees of freedom are described by an empirical force
field.19, 20, 21 Alternatively, reactive
force fields have been developed which allow to follow chemical
reactions in solution on extended time
scales.1, 22, 23 More recently,
another possibility has emerged by developing a machine learned
(ML) representation for the solute that can be used together with an
implicit24, 25 or explicit description of the
environment at an empirical level. The present work develops such a
scheme and applies it to formic acid dimer in solution.
Formic acid dimer (FAD) has been subject of several
computational26, 27, 28, 29, 30, 31, 32, 33, 34, 35, 36, 37, 38, 39, 40, 41
and experimental
studies.42, 43, 44, 45, 46, 47, 36, 48
In the gas phase, formic acid exists as hydrogen bonded
dimers49 making it a prototype for complexes
with hydrogen bonds such as enzymes or DNA base
pairs.50 Such conformations allow double proton
transfer (DPT) to occur which leads to broadening of the line shape
for the O-H frequency in IR-spectra.36 The
dissociation energy of FAD into two formic acid monomers (FAMs) has
been determined from spectroscopy and statistical thermodynamics to be
kJ/mol ( kcal/mol)47
which compares with kcal/mol from recent
computations.41
Another quantity that has been accurately measured experimentally is
the tunneling splitting for which a recent value of 331.2 MHz is
available from microwave spectroscopy.51 From this,
a barrier for DPT of 2559 cm-1 (30.6 kJ/mol or 7.3 kcal/mol)
from analysis of a 3D model was determined.51. The
tunneling splitting from the microwave data compares with values of
0.011 cm-1 (340.8 MHz) 52 and 0.016 cm-1
(473.7 MHz)53, 54 from infrared
spectroscopy. Computationally, a high-quality (CCSD(T)-F12a/haTZ),
full-dimensional PES for FAD has been determined and represented as
permutationally invariant polynomials which features a DPT barrier of
2853 cm-1 (8.16 kcal/mol).35 The computed
splitting on this PES from using a ring-polymer instanton approach was
0.014 cm-1 (420 MHz).37
Given its thorough characterization in the gas phase, FAD is also an
interesting system to study reactions in solution. In particular the
balance between DPT and the dissociation of FAD into two monomers
provides an attractive aspect of the system to be explored also as a
proxy for DNA base-pair dimers.55, 56 The
homologous series of carboxylic acids (formic, acetic, propionic,
butyric) in water have also served as model systems for studying the
balance and role of hydrogen bonding, hydrophobicity and entropy
changes which is of particular relevance in the context of protein
folding and stability.57
For FAD in pure water detailed experimental results are scarce. Early
work reported that dimerization is most relevant for the
low-concentration range for all carboxylic acids investigated,
including formic acid.58 This was subsequently
challenged and measurements in 3 m NaCl by potentiometric titrations
were interpreted as leading to singly H-bonded, extended formic acid
oligomers.59 The hydration of formic acid in pure
water was also investigated with neutron diffraction experiments for
higher formic acid concentrations.60 At all
conditions studied, a pronounced peak for the OO separation
with a maximum at 2.7 Å was reported which, together with a peak
for the OHO angle at , supports formation of singly
H-bonded or cyclic FAD. It is of interest to note that the extended
structures proposed by Scheraga are incompatible with the neutron
scattering results.60 Surface scattering experiments
found that FAD colliding with the liquid water surface almost
completely inserts in its cyclic form into bulk water even at low
collision energies.61 This indicates that H-bond
breaking in FAD is not essential for uptake. Whether or not and for
how long FAD remains in its cyclic form inside water was, however, not
determined in these studies.61 Accompanying ab
initio MD simulations reported that the cyclic dimer has fewer
FAD-water hydrogen bonds (i.e. is “more hydrophobic”) than the
branched, singly H-bonded FAD isomer.62 Finally, a
study considering clathrate formation involving formic acid and water
interpreted the measured infrared spectra as partially originating
from water-mediated cyclic formic acid dimers in which the two formic
acid monomers are H-bonded by a bridging water
molecule.63 An independent MD simulation for FAD
in water reported57 a negligible stabilization free
energy for cyclic FAD of kcal/mol which is surprising given the
substantial gas phase stability of FAD of
kcal/mol.33, 41 Very recent Raman
spectroscopy measurements reported formation of both, singly and
cyclic H-bonded FADs.64 Taken together, the available
studies suggest that FAD on and in pure water can exist as an
equilibrium between cyclic and singly H-bonded dimers. Therefore, the
present work will focus on the dynamics of cyclic FAD in pure water.
The aim of the present work is to characterize DPT dynamics in FAD in
aqueous solution.
First, the methods and the ML/MM embedding are
described. Next, the quality of the PES is reported and the
structural dynamics, free energies, and rates together with
conformational coordinates relevant for DPT of FAD in solution are
discussed. This is followed by an analysis of the solvent
distributions for reactant and transition state structures, and the
effect of the solvent-generated electrical field. Finally, the
results are discussed in a broader context.
2 Methods
This section describes the generation of the potential energy surface
for the simulation of FAD in water and the molecular dynamics (MD)
simulations performed within the Atomic Simulation Environment (ASE).
65 In the following the potential energy of FAD
is represented as a Neural Network (NN),66 referred
to as “ML” or “PhysNet” whereas solvent water is described with
the TIP3P model (MM).67 First, the reference data
generation, the training of the NN-based PES and the embedding of the
ML (FAD) part in the MM environment (water) is described. This is
followed by a description of the MD simulations and their analysis.
2.1 Potential Energy Surface
All electronic structure calculations were carried out at the
MP2/aug-cc-pVTZ level of theory using the MOLPRO software
package.68
The reference data included
structures, energies, forces, and dipole moments for FAM (5000
structures), FAD (47069), and a number (6000) of related fragments
(“amons”)69 including H2, CO, H2O, CH4,
CH2O and CH3OH. Structures were generated from MD simulations,
carried out at the PM7 level of theory using ASE. The “amons” were
only used for training the NN and help in generalizing the ML model.
Additional FAD structures were generated from simulations in
solution (akin to adaptive sampling) by using PhysNet trained only
on gas-phase structures.70, 41
The energies of the FAD structures cover a range up to kcal/mol above the global minimum compared with the TS for DPT
which is kcal/mol above the global minimum.
For the final
training the 58069 reference structures were split into training
(49300), validation (5800) and testing (2969) sets. The parameters of
PhysNet were fitted to reproduce ab initio energies, forces and
dipole moments of the training set.66 Including FAD
conformations exhibiting two, one or no H-bond in the training
set has been shown essential to ensure the correct propensity
towards the global minimum conformation of FAD with two formed
H-bonds.
PhysNet computes the total potential energy for given coordinates and nuclear charges of atoms from atomic energies and pairwise electrostatic and dispersion interactions according to
| (1) |
The prediction of the atomic energies and charges is based
on feature vectors that encode the local chemical environment of each
atom to all atoms within a cutoff radius that was
Å in the present work.71 For
charge conservation, the partial charges are scaled to the
correct total charge of the system and used for the calculation of the
electrostatic interaction energy where is the Coulomb constant
and is the distance between atoms and . For small
distances the electrostatic energy is damped to avoid instabilities
due to the singularity at .66 The initial
parameters for the dispersion correction are the
standard values recommended for the revPBE level of
theory.72 Since the atomic features, electrostatic and
dispersion interaction depend only on pairwise distances and are
combined by summation, the PES is invariant to translation, rotation
and permutation of equivalent atoms. The forces
with respect to the atomic coordinates are
computed by reverse mode automatic differentiation provided by
Tensorflow.73, 74 For further details, the
reader is referred to Ref.66.
For the water solvent the TIP3P model67 as
implemented in the GPAW program package75 is used
with a cutoff range of Å due to its improved performance
compared to that of ASE. The interaction between formic acid and the
water solvent includes van-der-Waals and electrostatic terms which
were treated with a cutoff at Å or half the simulation box
edge length at most. The van-der-Waals interactions are calculated
using the Lennard-Jones-Potential and the parameters from
CGenFF76 for formic acid.
The electrostatic interactions between the TIP3P atomic charges of water and the NN-predicted atomic charges of FAD are computed within PhysNet. This allows exploitation of reverse mode automatic differentiation to calculate the necessary derivatives of the fluctuating atomic charges from the atomic coordinates and ensures energy conservation. For the van-der-Waals and electrostatic interactions between the “high level” treatment (here PhysNet) and MM atoms a switch function
| (2) | ||||
| (3) |
was used to set the interactions zero in the range from Å to Å, where is the separation between ML and MM atoms, respectively. Additionally, the electrostatic Coulomb potential is shifted to zero at the cutoff distance of Å following the shifted force method to prevent the inconsistent gradient at the cutoff point.77 While the van-der-Waals interaction between both species become negligible at that cutoff distances, this is not the case for the Coulomb forces between two charges and of atoms from the ML part and from the MM part separated by .
| (4) | ||||
| (5) | ||||
| (6) |
An ASE calculator class for the PhysNet model was written as interface
to the ASE program package. Further extensions are implemented to
enable constant atomic charges in formic acid only for the calculation
of the electrostatic potential between the ML and MM part of the
simulation setup. In addition, custom energy functions were added to
the potential energy to perform biased
simulations.78
2.2 Molecular Dynamics Simulations
All MD simulations were performed using Python packages of a modified
version of ASE ().
65 Simulations are initialized with FAD in its
minimum conformation in a cubic simulation box with edge length
Å containing 729 water molecules which corresponds to a
density of g/cm3. The density is not adjusted for
simulations at different temperatures. All simulations were run with
periodic boundary conditions. To maintain the solute near the center
of the simulation box a center-of-mass harmonic constraint with a
force constant of kcal/mol/Å2 was applied on formic
acid molecules when moving further than 10 Å from the center of
the simulation box. RATTLE-type holonomic
constraints79 as implemented in the GPAW program
package80 were applied to the oxygen-hydrogen and
hydrogen-hydrogen distances of the water molecules. The simulations
are carried out in the ensemble using the Langevin propagator
with a time step of fs and a friction coefficient of
ps-1.
First, the structure of the system was minimized to release strain. A
heating run is performed for ps to reach the respective target
temperatures of 300 K, 350 K, 400 K, 450 K, 500 K and 600 K. As
no rigorous implementation of a barostat is available in ASE,
simulations at constant volume but increased temperature were carried
out to qualitatively assess the influence of increased pressure on the
DPT dynamics. The system equilibrates within ps during the
heating runs. Equilibration is followed by production simulations of
ps each, accumulating to a total of ns simulation time at
each temperature. Positions and momenta are stored (1) every fs
for the complete trajectory and (2) every fs in a time window of
fs around every attempt of a
reaction registered during the simulation (see Analysis).
The implementation is validated by examining energy conservation for a
100 ps MD simulation at 600 K. The total energies at each time
step are within a standard deviation of kcal/mol
from the average total energy with a maximum deviation of kcal/mol and no drift is found. This confirms that the
forces are correctly implemented.
To determine the impact of the fluctuating atomic charges available
from PhysNet on the dynamics and energetics, MD simulations were also
performed by fixing the atomic charges to those of the TS structure of
FAD to retain the symmetry of the system before and after PT. These
fixed atomic charges were used for the solute-solvent interaction
only. For the internal interaction of the ML part (FAD) fluctuating
charges were retained in order to correctly represent the PES for the
isolated solute.
Finally, as FAD was found to be largely
hydrophobic from earlier simulations62, 57
and to probe the effect of the electrostatic interactions between
solute and solvent on DPT, simulations were also carried out with
zeroed charges on all atoms of the solute.
2.3 Analysis
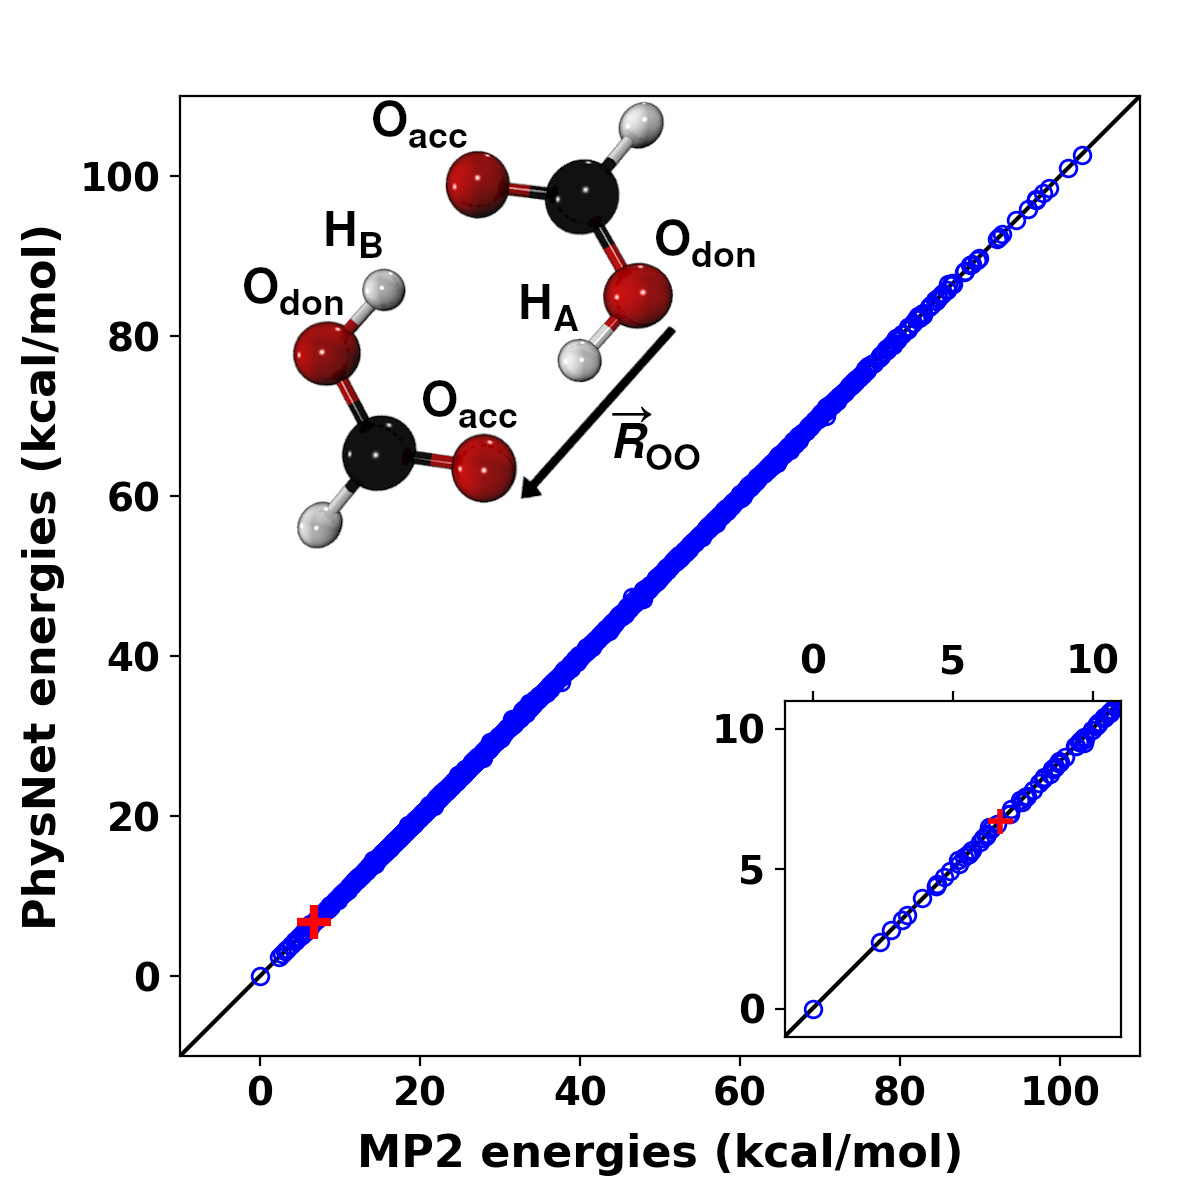
Proton transfer (PT) is a transient process. To characterize a PT
event it is often useful to use a geometric
criterion.81 Here, the criterion was the distance
between the hydrogen and the oxygen atoms OA and
OB of the respective H-bond. A PT in one H-bond was
identified by a sign change of the progression (or reaction)
coordinate . Further, the oxygen atom bonded to the
hydrogen atom is the donor oxygen (Odon) and the second
oxygen atom in the H-bond is the acceptor oxygen (Oacc),
see Figure 1.
Successful and attempted DPT always
involve two consecutive PTs, see Figure S1. For
“successful” DPT the two PTs include a “first” and a “second”
hydrogen atom HA and HB in both H-bonds,
respectively, whereas for an “attempted” DPT both PTs involve only
hydrogen atom HA. DPT is considered to be successful when
a sign change in both progression coordinates and
occurs. Attempted - as opposed to successful - DPT events are those
for which only one forth and back PT occurs along the first H-bond
without PT along the second H-bond.
In addition to unbiased simulations, biased simulations were
carried out at different temperatures for FAD in the gas phase and in
solution. For this, an artificial harmonic potential involving both progression coordinates
and was added to the total potential energy. For FAD in
solution the force constant was
kcal/mol/Å2 and snapshots were recorded from 1 ns
trajectories at each temperature.
Both constraining harmonic
potentials are centered at the TS coordinate, , and the magnitude of the force constant was
chosen to lift the potential of the equilibrium conformation ( Å) of FAD roughly to the level of the
TS conformation. Additional tests were run with lower values of
. The resulting potentials of mean force (PMFs) were
found to be insensitive of this choice, see Figure S2.
3 Results
3.1 Quality of the Potential Energy Surface
Figure 1 shows the quality of the ML PES by comparing
reference MP2 energies with those predicted from the trained PhysNet
model for formic acid dimer for 2969 test structures. The energies of
the smaller fragments (“amons”) are outside the energy range of the
graph but are included in the root mean squared error (RMSE) of
kcal/mol and the Pearson coefficient is . The energy deviation between the MP2 energy and the PhysNet
model prediction is smaller than kcal/mol for the
minimum conformation of FAD and the TS for DPT.
The MP2 method is a good compromise between speed and accuracy. For
example, the barrier for DPT of kcal/mol compares with a value
of kcal/mol from a morphed MMPT-MP2 force field that is
consistent with infrared spectroscopy36 and a barrier
height of kcal/mol from analysis of microwave spectroscopy
data.51 Calculations at the CCSD(T) level of theory
report somewhat higher barriers of kcal/mol and
kcal/mol, depending on the basis set and additional F12
corrections used.36, 35 Furthermore, the
dissociation of the dimer into two monomers is of interest.
In
the gas phase the PhysNet model yields kcal/mol
which is also the value from the reference MP2/aug-cc-pVTZ
calculations. Ab initio calculations at the higher
CCSD(T)/aug-cc-pVTZ level of theory find kcal/mol33, 41 and
kcal/mol at the basis set limit.33
Next, the energetics of increasingly hydrated FAD is determined from
the present ML/MM energy function, from the CGenFF76
parametrization of FAD together with the TIP3P water model, and from
electronic structure calculations. For this, 50 snapshots from a 2 ns
ML/MD simulation with FAD in its dimeric structure were extracted. The
15 water molecules closest to the center of mass of FAD were retained
for each snapshot.
Electronic structure calculations for this
analysis were carried out at the B3LYP+D3/aug-cc-pVDZ level of
theory82, 83, 84 because MP2/aug-cc-pVTZ
calculations for FAD surrounded by up to 15 water molecules are
computationally too demanding.
The total interaction energies for
FAD–(H2O)n complexes were determined. Water
molecules were retained in increasing order of their distance from
FAD. The results are reported in Figures S3 and
S4 and the analysis shows that the interaction energies
with 15 water molecules from the MM/ML energy function differ on
average by less than 1 kcal/mol from the reference B3LYP+D3
calculations whereas CGenFF underestimates the reference results by
about 4 kcal/mol.
The 50 snapshots were also analyzed from retaining the 4, 8, and 12
closest water molecules and correlating the MM/ML and CGenFF
interaction energies with those from the reference B3LYP+D3
calculations (Figures S5 to S7).
Mean
absolute errors between MM/ML and DFT reference calculations are
, and kcal/mol compared with , and
kcal/mol for CGenFF. It is also worth to point out that
CGenFF finds a dimer stabilization energy of only kcal/mol in
the gas phase compared with high-level electronic structure
calculations that yield
kcal/mol33, 41 and
kcal/mol at the B3LYP+D3/aug-cc-pVDZ level which is
kcal/mol lower than for the MP2 and CCSD(T) levels of theory
with the aug-cc-pVTZ basis set.
Overall, the comparison with the
B3LYP+D3 results validates the quality of the ML/MM energy function
whereas the CGenFF parametrization is found to considerably
underestimate the stability of FAD.
3.2 Structural Dynamics in Solution
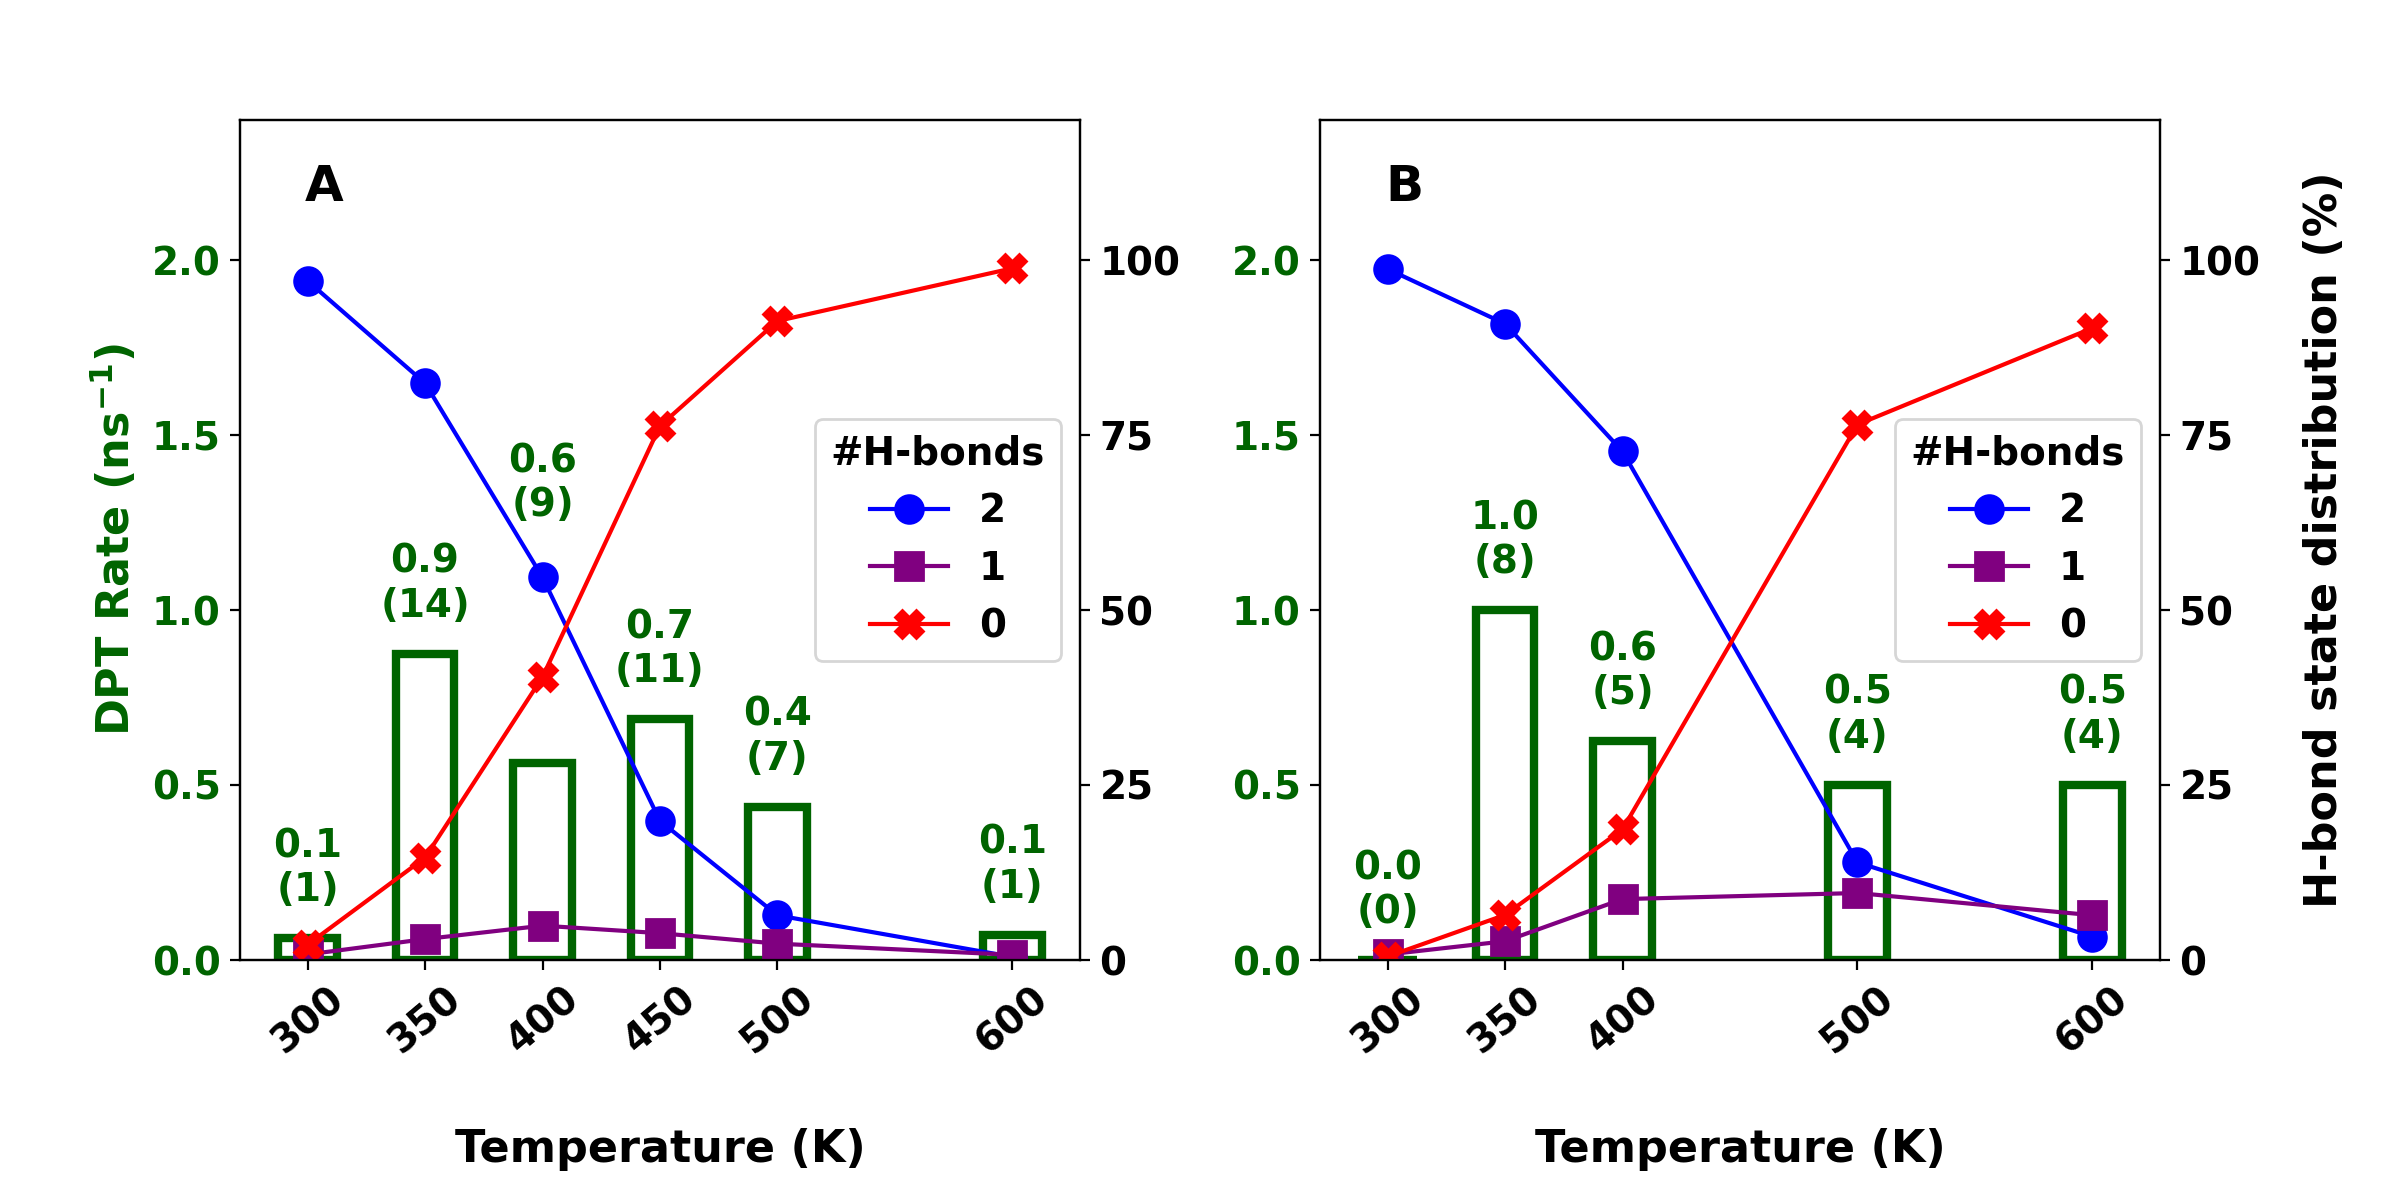
Figure 2 reports the propensity of FAD to exist as a doubly
(blue circle) or singly (violet square) H-bonded dimer or as two
separate monomers (red cross) in water. This is consistent with what
has been inferred from experiments.60, 61 For
the equilibrium conformation the Odon–Oacc distance
is Å. An H-bond in FAD is considered “broken” if the
Odon–Oacc distance exceeds 4 Å. MD simulations
with fluctuating atomic charges on FAD show (Figure 2A) that
the propensity for a doubly H-bonded FAD decreases from % at
300 K to % at 600 K. The probability for the singly H-bonded
dimer increases from % at 300 K to a maximum of % at
400 K and decreases again to % at 600 K. At the temperature
with the highest DPT rate (350 K) both H-bonds are formed for
% of the propagation time.
In conventional force fields the partial charges are
fixed76 and do not change with conformation.
PhysNet provides geometry-dependent charges, see
Figure S8, which fluctuate by e to e around their mean. The average charges for the C, HC and one of the oxygen atoms from PhysNet are similar to those
in CGenFF whereas for the HO and the second oxygen they
differ by about e. It is also found that the charge
distributions from PhysNet differ for cyclic and branched FAD.
Given these differences it is of interest to determine the differences
between the simulations analyzed with conformationally fluctuating
charges and those with fixed partial charges on the FAD. The charges
assigned to the atoms are those of the TS structure to ensure a
symmetric atomic charge distribution before and after successful
DPT. The distribution of formed H-bonds for FAD in water with
fluctuating and fixed charges in Figure 2 shows that the
propensity for H-bond formation significantly depends on fixing the
charges. With the fixed charge model the probability for the doubly
H-bonded dimer to exist is larger at all temperatures from 300 K
( %) to 600 K ( %) compared with the fluctuating charge
model ( % and % at 300 K and 600 K,
respectively). In addition, the probability for singly H-bonded FAD
and two separate monomers at 600 K differs with the fixed charge
model with % and %, respectively, from the
fluctuating charge model with % and %. Thus, a fixed
charge model with charges from the TS structure predicts a higher
propensity for FAD to exist in solution compared to the fluctuating
charge model.
The higher propensity for dimer dissociation in solution using
fluctuating rather than fixed charges correlates with the differences
in the magnitudes of the atomic charges between the two charge
models. From the equilibrium conformation of FAD towards separated
FAMs the polarization along the atoms in the H-bond increases. The
fluctuating charges along the Odon–HOacc
bond change from , , in the equilibrium
dimer conformation to for separated
monomers, respectively, which compares with
in the fixed charge models with charges taken from the TS
structure. Comparable amplitudes for charge transfer () have been found for the HOdon–HOaccH2 hydrogen bond in bulk water when the energy function was
fit to match experimental frequencies and intensities of the infrared
and Raman bands.85 The larger absolute values of the
atomic charges in the fluctuating charge model (differences of up to
% and % for the hydrogen and oxygen atoms of the H-bonds
relative to the charges in the TS structure, respectively) lead to
stronger electrostatic interactions with the surrounding solvent. This
also impacts on the conformational sampling and the reaction barrier
height.
To evaluate the effect of the water solvent on dissociation,
simulations for FAD in the gas phase were performed using the same
setup as for the simulations in solution. The presence of both H-bonds
is a prerequisite for DPT to occur as the top of the barrier becomes
inaccessible if even one H-bond is broken. Thus, dissociation of the
FAD competes with DPT and therefore governs the DPT rate. In the gas
phase it is found that - similar to the situation in solution - the
propensity towards broken H-bonds increases for higher
temperatures. At 300 K both H-bonds are formed for % of the
propagation time. This fraction decreases at higher temperatures:
% and % at 500 K and 600 K, respectively.
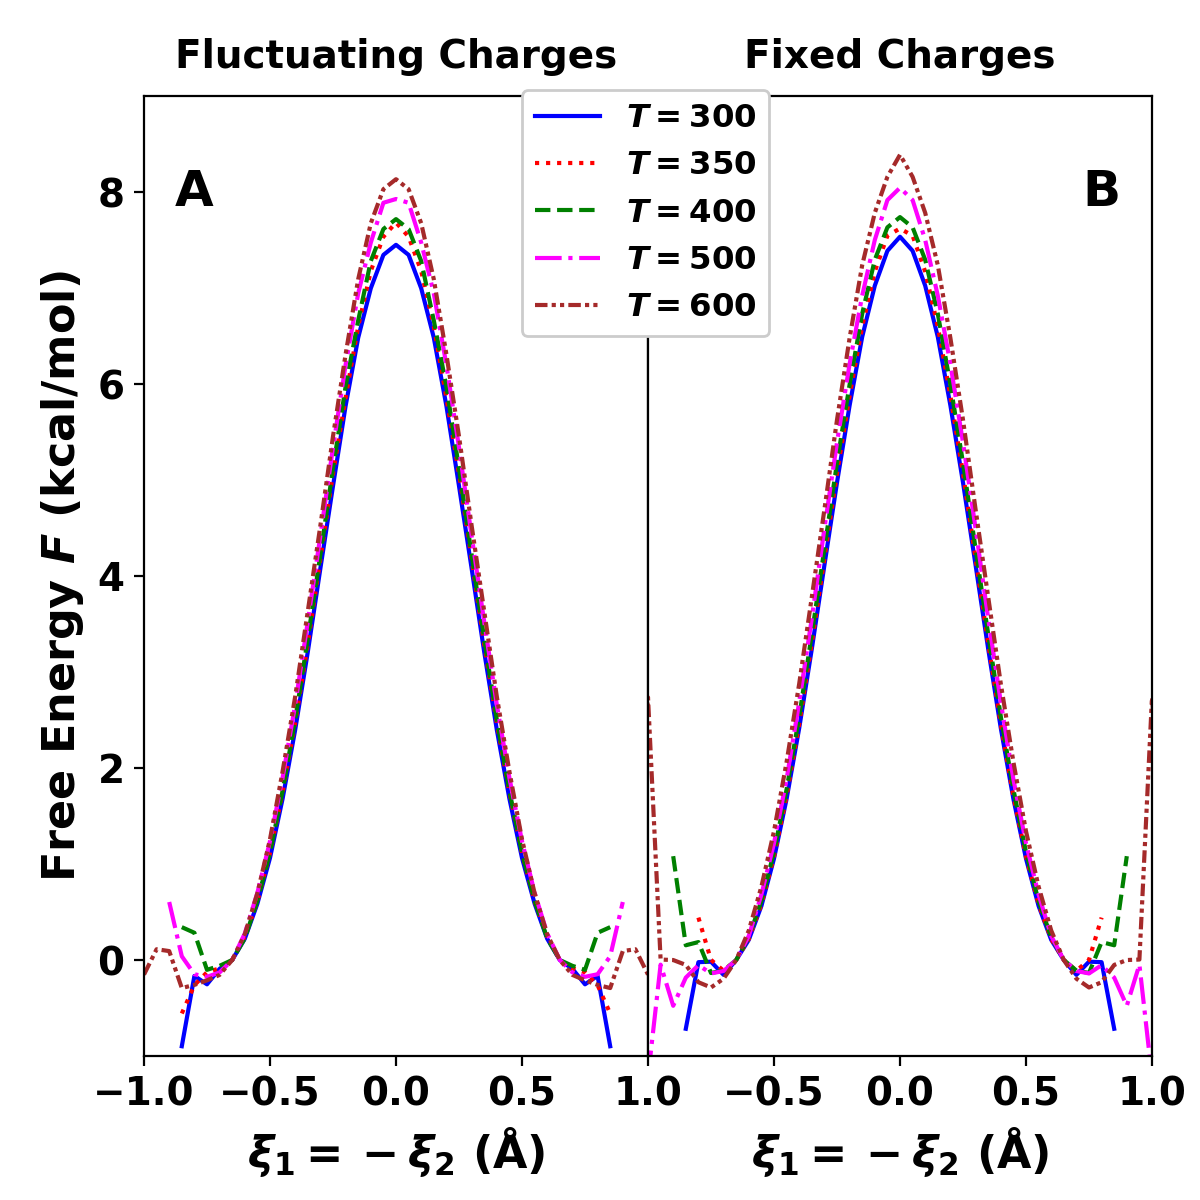
3.3 Free Energies of Activation and Rates for DPT
Biased simulations were performed to investigate the free energy
barrier for DPT. Figure 3 shows the 1-dimensional cuts along
the constrained progression coordinate .
The
2-dimensional free energy surfaces are given in
Figure S9.
The energies around the equilibrium
Å are set to zero. Biased simulations
are carried out for fluctuating and fixed charges. Between 300 K and
600 K the free energy barrier increases from kcal/mol to
kcal/mol for simulations using the fluctuating charge
model. With fixed charges the barriers change from kcal/mol to
kcal/mol. Thus, as a function of temperature, the barrier
increases by kcal/mol with fluctuating charges, compared with
kcal/mol with fixed charges. In other words, the change
of the barrier height as a function of temperature differs by 25 %
from fluctuating to fixed charges on solution.
Simulations were also carried out in the ensemble for FAD in the
gas phase and yield a free energy barrier for DPT of kcal/mol
at a temperature of 310 K which was determined from the kinetic
energy of all atoms in this biased simulation. Earlier classical
ab initio metadynamics simulations with the same reaction
coordinates as those used in the present work at the BLYP level with a
plane wave basis for FAD in the gas phase reported a free energy
barrier height of kcal/mol at 300 K compared with the
potential barrier height of kcal/mol.32 This
differs qualitatively from the present results for which the free
energy barrier in the gas phase increases from the potential barrier
of kcal/mol.
To quantify the electrostatic contribution of the solute/solvent
interactions to the free energy barrier, biased simulations of FAD in
solution were performed with the atomic charges of FAD set to zero. At
300 K the free energy of activation is kcal/mol and increases
by kcal/mol to kcal/mol at 600 K. This compares with
and kcal/mol with fluctuating and fixed charges at
300 K, respectively, which increase to and kcal/mol at
600 K. At 300 K the contribution of fluctuating electrostatics is
thus kcal/mol as opposed to kcal/mol if the charges
are fixed and a reduction by kcal/mol and an increase of kcal/mol at 600 K for fluctuating and fixed charges,
respectively. This finding suggests that FAD behaves largely as a
hydrophobic solute for which direct electrostatic interactions with
the solvent are less relevant.
The dependence to the free energy () suggests that
the change between the reactant and the TS state is
negative for all charge models used but the magnitude of
differs. This difference is accommodated in the solvent ordering
around the solute. Linear interpolation of the free energy barriers at
the different temperatures yields an activation enthalpy and activation
entropy of [ kcal/mol,
cal/mol/K] for fluctuating charges, [ kcal/mol,
cal/mol/K] for fixed charges, and [ kcal/mol,
cal/mol/K] for zero charges.
Because the constraints in the biased simulations favour FAD over two
separated monomers (and the dimer has been found to dissociate at
higher temperatures for free dynamics) it is mandatory to also run and
analyze unbiased simulations that allow DPT to occur in solution. For
this, an aggregate of 16 ns simulations was run and analyzed at each
temperature. As the barrier for DPT is relatively high, DPT is a rare
event. DPT rates in unbiased simulations are highest at 350 K for
both fluctuating and fixed charge models, see Figures 2A and
B. With the fluctuating charge model (Figure 2A) the rate is
ns-1 at 350 K and decreases to ns-1 at
500 K, while the dimer is only present for % and %
of the propagation time, respectively. Hence, the true rates are times higher at 500 K compared with those at 350 K.
Within transition state theory energy barriers of kcal/mol
from the biased simulations correspond to rates of ns-1 which is consistent with results from unbiased
simulations shown in Figure 2.
With the fixed charge model a similar increase of the DPT rates is
observed. At 300 K, no DPT was observed during 8 ns of propagation
time whereas for K and 500 K they are ns-1 and
ns-1, respectively. As the simulation time with fixed
charges is 8 ns - shorter than simulations with the fluctuating
charge model - the rates for DPT are based on fewer events with larger
uncertainties which are not quantified in this work.
3.4 Conformational Coordinates Involved in DPT
Conformationally relevant degrees of freedom to consider are the
Odon–Oacc and the CO bond distances. The
involvement of the Odon–Oacc separation
becomes apparent from noting that it contracts from
Å in the global minimum to
Å in the TS. In other words,
compressing the O–O separation towards the TS structure facilitates
(D)PT. The CO bond in the COH moiety has bond order 1 ()
whereas the second CO bond is formally a double bond (). This bonding pattern reverses after DPT and for the TS structure
all bond orders are .
The first PT leads to a short-lived, metastable ion-pair with one
protonated formic acid monomer and the corresponding anion, see Figure
S1. Subsequently, the transferred hydrogen atom returns
either to where it came from (attempted DPT) within an average delay
time of fs at 350 K or the hydrogen atom along the
second H-bond transfers (successful DPT) with an average delay time of
fs. At 450 K the analysis of unbiased simulations find
delay times of fs and fs for attempted
and successful DPT, respectively. This is consistent with results from
earlier work that reported an average delay time of fs for
successful DPT.30
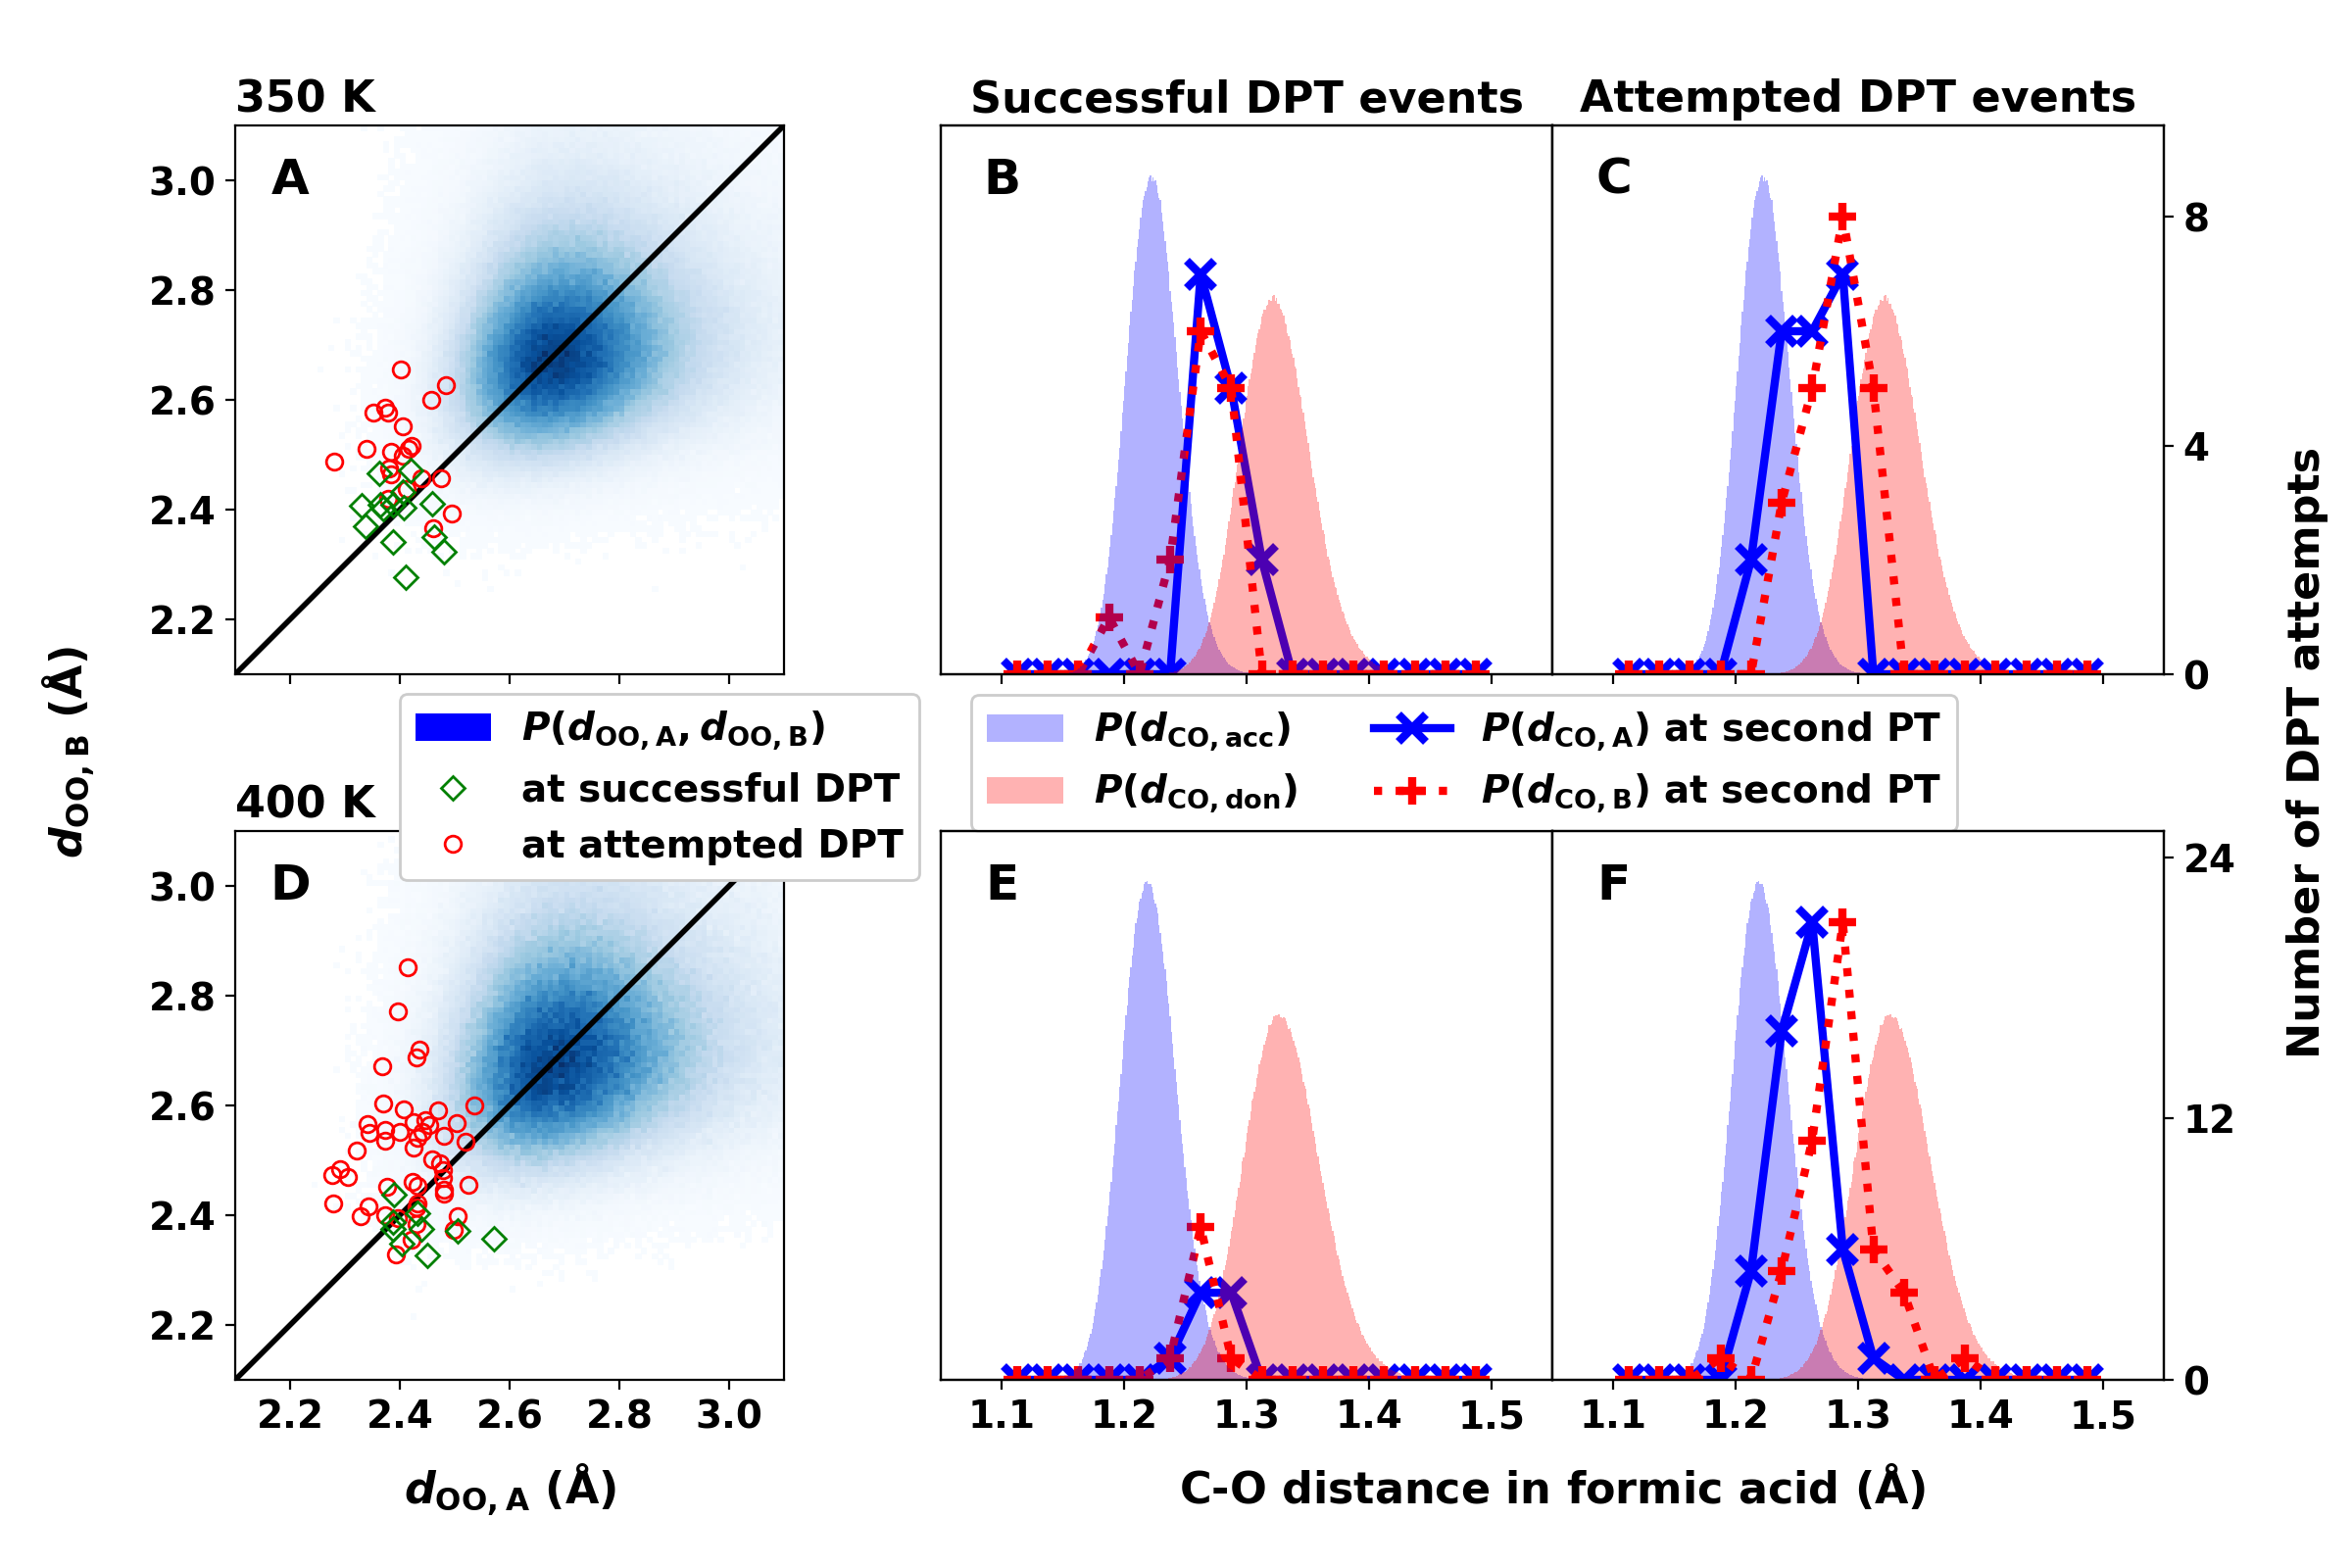
Figures 4A and D compare the instantaneous
Odon–Oacc separations at the time of the
second PT. The probability distribution functions for the O–O separations in unbiased
simulations at 350 K and 400 K peak at Å and
Å, respectively. These distances shorten
significantly to Å and Å
for successful DPT; see Figure 4. For successful DPT both
O–O separations are between 2.4 Å and 2.6 Å whereas for
attempted DPT the first O–O separation ranges from 2.3 Å to
2.5 Å but the second oxygen donor-acceptor distance covers a
range between 2.4 and 2.9 Å. This suggests that a more
symmetrical geometry at the time of the first PT increases the
probability for successful DPT during the second step, i.e. if the
distances between both oxygen atoms in the H-bonds are
simultaneously contracted.
Next, the CO bond lengths are analysed. Figure 4B, C, E, and
F shows the distribution of the COacc double and COdon single bond distances from all MD simulations at 350 K and
400 K. The maximum peak positions are clearly distinguishable and
demonstrate the single and double bond character of the CO bonds with
and , respectively. In addition, the
histograms for the CO distances at the second PT of a successful
(panels B and E) and attempted (panels C and F) DPTs are reported. For
successful DPT the distributions overlap for both temperatures and
whereas for attempted DPT they are clearly
non-overlapping and closer to and ,
respectively.
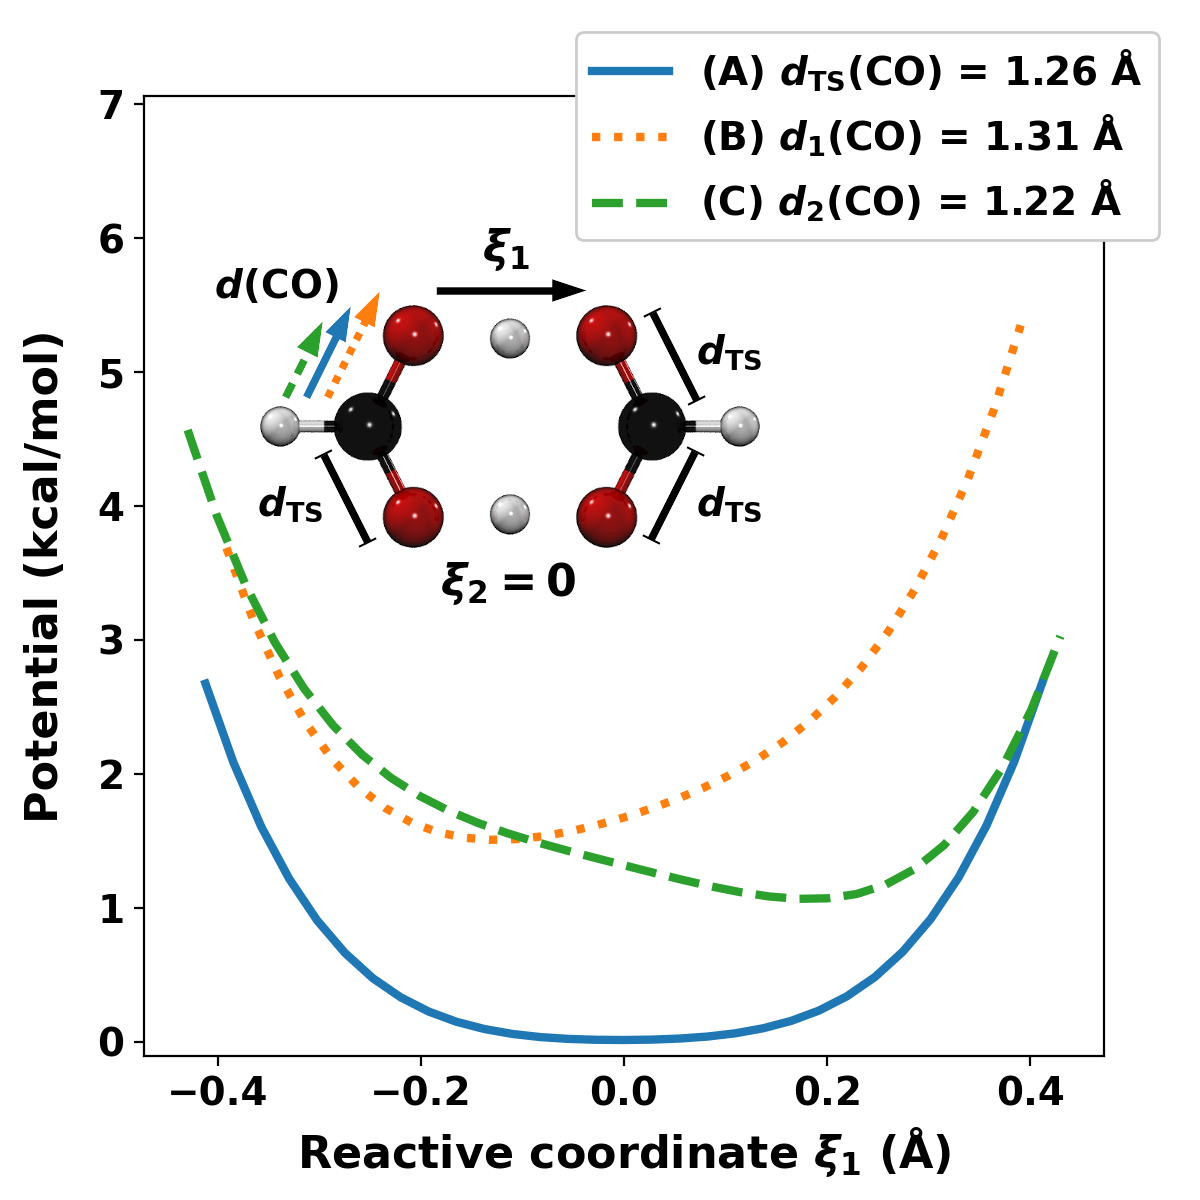
The correlation between narrowly overlapping distance distributions
of the CO single and double bond
and the higher probability for successful DPT
can be explained by the respective OH bond potential in the protonated
formic acid monomer. Figure 5 shows the PhysNet potential
along the progression coordinate of a hydrogen atom in the TS
of FAD. With all other bond lengths frozen in the TS conformation, a
scan along is performed for three different distances of the
CO bond involved in the first H-bond as in A) the TS conformation, B)
a CO single bond and C) CO double bond (see illustration in Figure
5). The remaining CO bonds are kept frozen at the TS bond
length of Å. For Å
(TS conformation with ) the potential minimum along
the reactive coordinate is at Å, which changes if the
CO bond contracts (B) or extends (C). The OH-stretch potential is
energetically more attractive in the covalent bonding range if the CO
bond has rather than . Vice versa, the
OH-stretch potential becomes repulsive at shorter CO distances as in
CO double bonds. Thus, hydrogen abstraction from an oxygen donor atom
involved in a CO double bond is energetically more favourable compared
to that involved in a CO single bond.
3.5 Solvent Distribution
MD simulations also provide information about the solvent distribution
along the reaction path. Figure 6 reports the radial and
distribution of the water oxygen atoms in the vicinity of the hydrogen
atoms in the H-bonds of FAD from simulations at 300 K and 400 K. The
solvent distributions are obtained either from unbiased MD simulations
with FAD primarily in its reactant state and from biased simulations
with FAD constrained close to its TS conformation by applying harmonic
constraints along and with a force constant of
kcal/mol/Å2. Analysis of the solvent distribution in the TS
compared with the reactant structure is of interest to assess the
amount of solvent reorganization that is required to reach the TS.
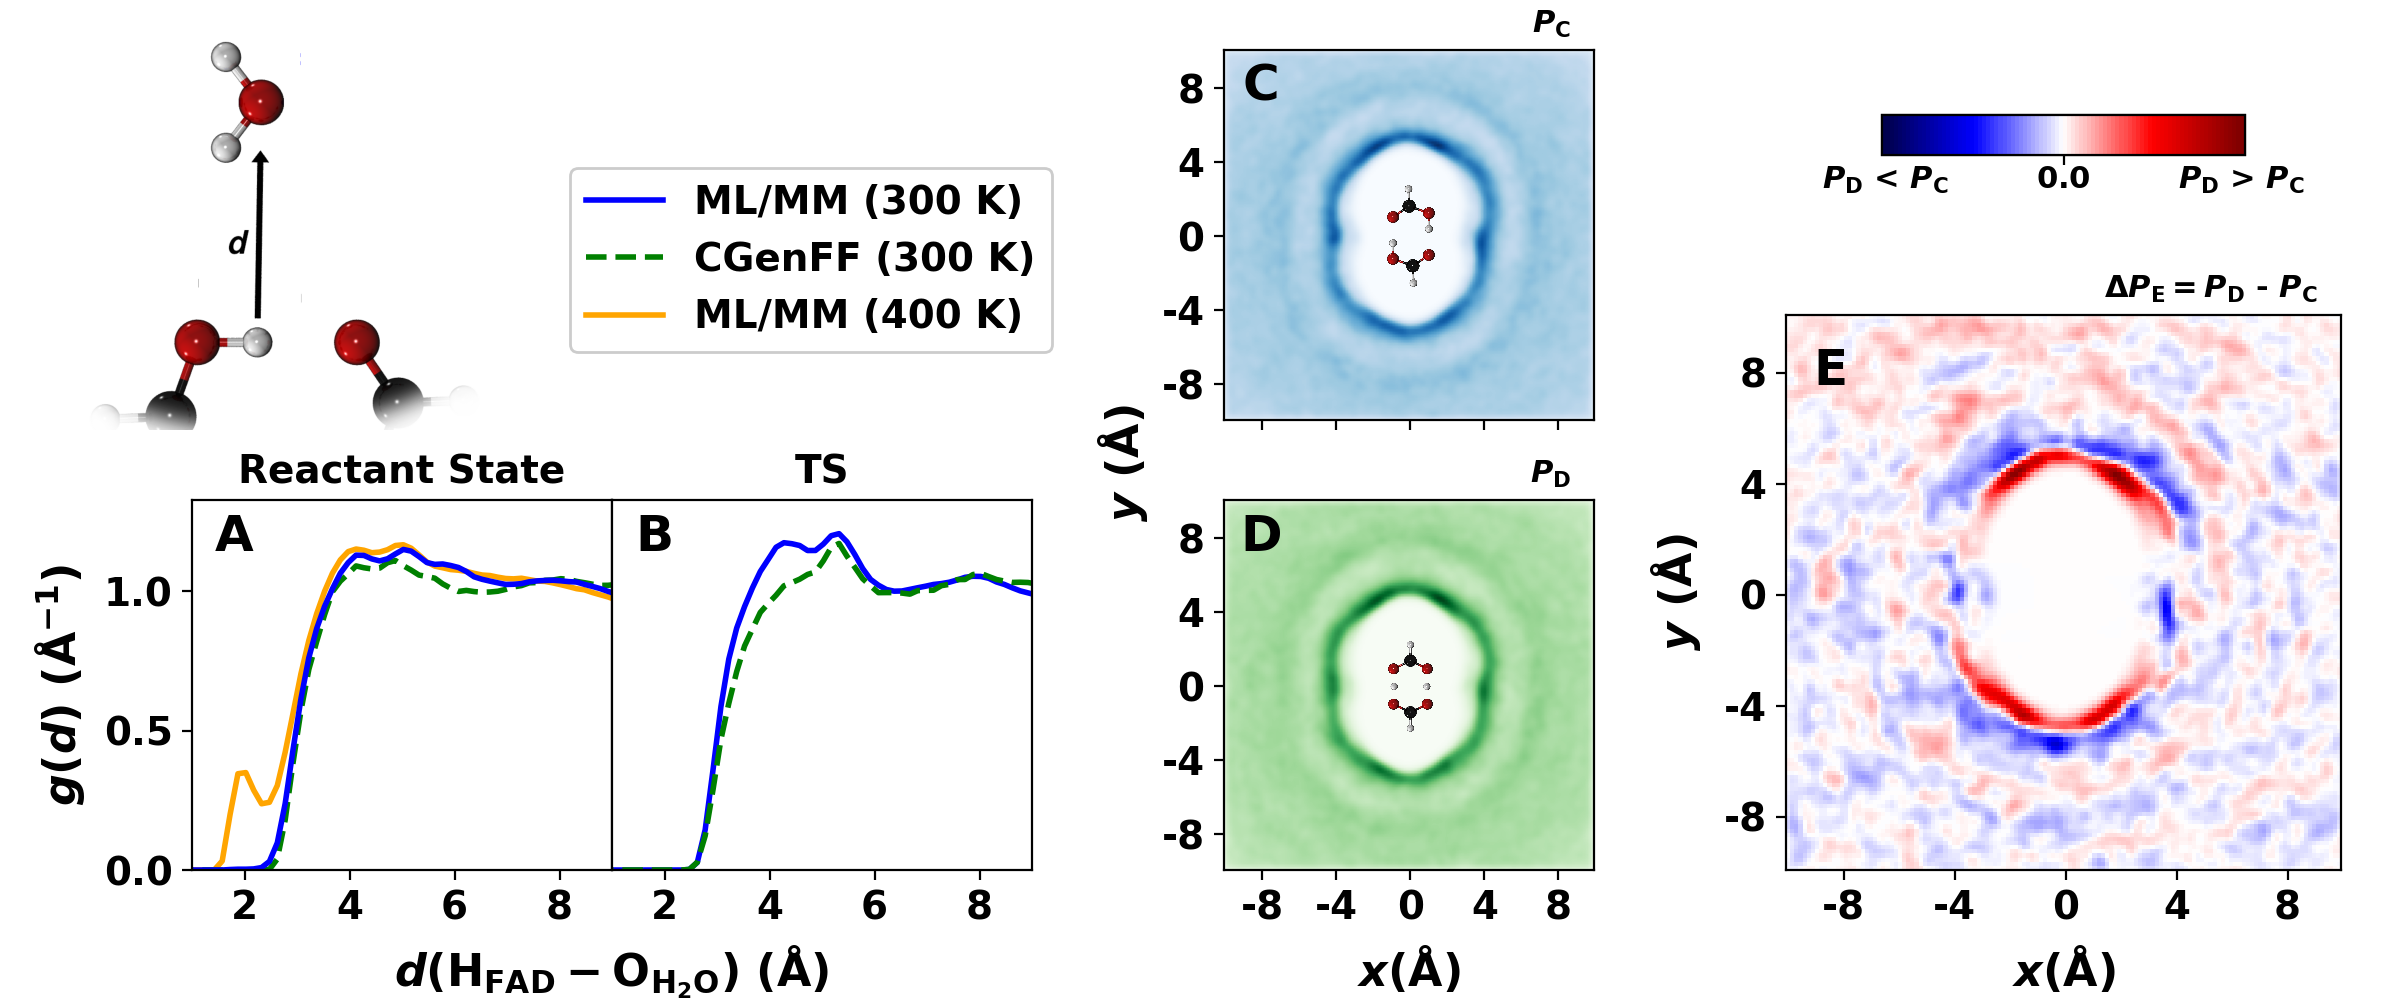
The solvent radial distribution functions around the hydrogen atoms of
the H-bonds in Figures 6A and B exhibit a weak double peak
between 4 and 6 Å. The maxima indicate the first solvation shell
around FAD and the double peak structure is more pronounced for
simulations with FAD in its TS structure. In the biased simulations
FAD is more rigid which leads to a more structured solvent
distribution. The radial distribution also shows a broad maximum
around 8 Å that can be associated with a second solvation
shell. The solvent radial distribution from simulation at 400 K
(orange line in Figure 6A) features an additional peak
around 2 Å that represents H-bond formation between branched,
i.e. non-cyclic FAD, separated formic acid monomers and water
molecules. Such H-bonds become available in simulation at temperatures
higher than 300 K as the probability for almost exclusively cyclic
FAD decreases significantly (see Figure 2A).
For a more comprehensive characterization of the changes in the
hydration of FAD between product/reactant geometries and the TS
structure, 2-dimensional solvent distributions were determined.
Figures 6C and D show the actual distributions projected
onto the plane which is the average plane containing the
solute. Figure 6E reports the solvent density difference
around FAD in its reactant and TS conformation, i.e. the difference
density from panels C and D in Figure 6. In the
2d-histograms the first and second solvation shells are clearly
visible as was also found from the radial distribution functions
(Figure 6A and B).
There is also a dent for the first
solvation shell at Å and Å along the
horizontal axis joining the hydrogen atoms along the H-bonds of FAD.
The solvent distribution difference in Figure 6E indicates a
shift of the first solvation shell closer to the side of the CH group
of FAD for the biased simulations due to the short monomer-monomer
distance in the TS structure compared with the reactant state. Hence,
the solvent probability in this region is higher for FAD in its TS
than in its reactant state. This is consistent with the shorter
monomer-monomer distance of FAD in the TS conformation. The
monomer-monomer contraction in the TS also flattens the dent towards
the hydrogen atoms in the H-bond as shown by the blue area that
indicates a lower solvent distribution density around FAD in the TS
than the reactant state conformation. Finally, the solvent
distribution difference exhibits the symmetry of FAD which indicates
the convergence of the simulations.
3.6 Influence of the Solvent-Generated Electrical Field
Finally, DPT events are analyzed from the perspective of the
alignment of the H-transfer motif relative to the solvent-generated
electric field.
Although cyclic FAD was found to be rather
hydrophobic, the long ranged nature of the solvent-generated
electric field can still significantly impact H-transfer along the
progression coordinate for DPT. The effect of external fields on
chemical reactions has been demonstrated from both,
experiments86 and computations.87
In the following the electric field at the position of the
transferring hydrogen atoms along the hydrogen bond was analyzed. For
this, the force on the transferring hydrogen atom at the time of PT
was determined as the linear interpolation of the forces for the
fs-frame before and after PT. The “time of PT” was determined
by the sign change of the linearly interpolated reactive coordinate
of the respective H-bond along which PT occurs. In Figures 7
and S10 the first PT - to which hydrogen atom HA is
attributed - is associated with the horizontal axis. In a
successful DPT, the second PT is performed by hydrogen atom
HB (vertical -axis) whereas in an attempted DPT the
second PT is also performed by HA (back-transfer).
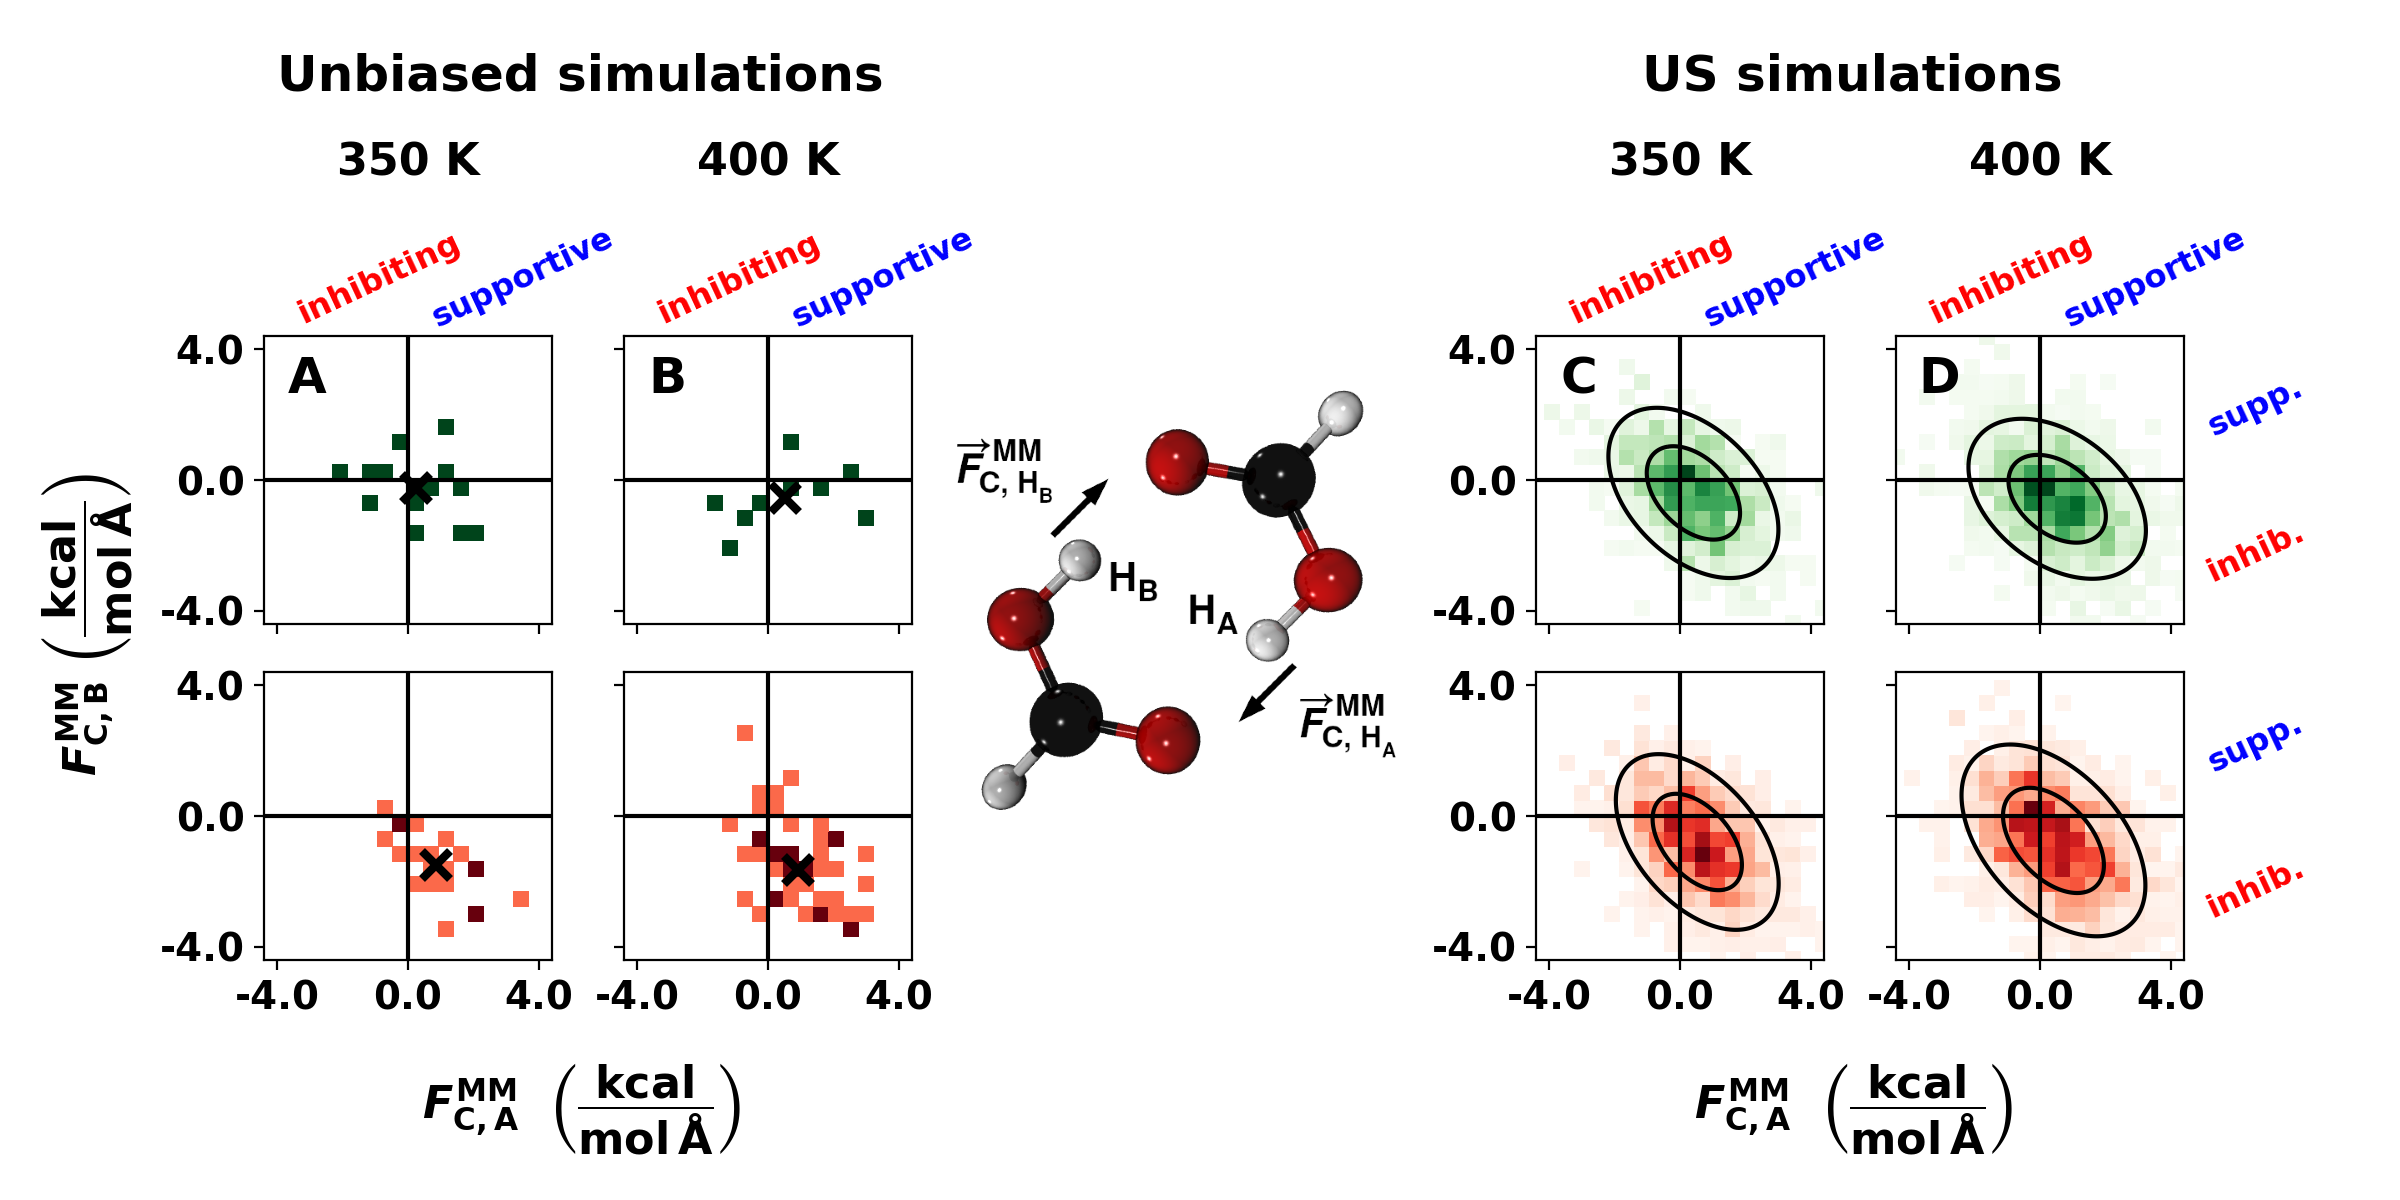
Figures 7 and S10 report the projection of the
solvent-generated (MM) Coulomb (C) force
along the Odon–HOacc and
Odon–HOacc hydrogen bonds for
successful and attempted DPTs during the first and second PT,
respectively. As per definition, a positive force always supports PT
of a hydrogen atom whereas a negative force has an inhibitory
effect. The analysis was carried out for the second PT independent of
whether transfer of HB did (successful DPT) or did not
(attempted DPT with HA transferring back) occur.
In the unbiased simulations, the first PT is typically accompanied by
a supportive Coulomb force. This effect is more pronounced at higher
temperatures ( K, see Figure 7B) than at lower
ones (see Figure 7A). Biased simulations increase the
probability for DPT and provide improved statistics which also allows
to fit 2-dimensional Gauss distributions to the data (Figures
7C and D). These results demonstrate that for the first PT
the field along the HA-bond is typically
supportive. Interestingly, for an attempted DPT the field along the
first HA-bond at the time of PT is supportive but
along the second HB-bond is
more inhibiting. This applies to both, unbiased and biased
simulations, see red distributions in Figure 7. Regarding
Figure 7 the gravity center of the average solvent-generated
Coulomb force is [,
] = [, ] and [,
] kcal/mol/Å for successful and attempted DPT at 350 K,
respectively, and shifts to [, ] and [,
] kcal/mol/Å at 400 K. In biased simulations the
gravity centers are at [, ] and [,
] kcal/mol/Å, [, ] and [,
] kcal/mol/Å accordingly. Hence, for successful DPT the
opposing electrostatic field along the second H-bond is considerably
smaller in magnitude than for attempted DPT in all cases.
For the second PT the solvent-generated Coulomb force along both
H-bonds is in general inhibiting (red distributions in Figure
S10). In unbiased simulations at 350 K the center of
gravity of the average solvent-generated Coulomb force is at
[,
] = [, ] and
[, ] kcal/mol/Å for successful and attempted DPT,
respectively. This shifts to [, ] and [,
] kcal/mol/Å at 400 K. In biased simulations the
gravity centers are at [] and [,
] kcal/mol/Å at 350 K and [, ] and
[, ] kcal/mol/Å at 400 K. Except for the sign
change in the projection of the Coulomb force on the hydrogen atoms of
the HA-bond the center of gravity does not change
significantly between the first and second PT in successful and
attempted DPT.
Comparison of the solvent-generated Coulomb force for successful and
attempted DPT further establishes that the field of the water
molecules at the position of the transferring hydrogen atom does not
change appreciably within fs, which is the maximum time
between first and second PT observed in the simulations at
350 K. This is expected as the rotational reorientation time of water
in solution is on the order of several picoseconds.88
The time evolution of the Coulomb force along the H-bonds is shown in
Figures S11 and S12 for an example of a
successful and attempted DPT, respectively.
In summary, successful DPT for FAD in water is often accompanied
by a mildly supporting solvent-generated Coulomb force along the
first PT in the HA-bond whereas for the second PT in the
HB-bond the force is inhibiting but smaller in magnitude
than for the back transfer along the first HA-bond. As
the inhibiting force along the HB-bond increases,
back-transfer along the first HA-bond becomes favoured
and results in attempted DPT with FAD returning to its initial
reactant conformation, see Figure S1. The findings
complete the picture that the probability for successful DPT primarily
depends on the conformation of FAD itself at the first PT event. At
conformation of high symmetry and low reaction barriers for PT events
in both H-bonds, the solvent-generated Coulomb field impacts the
probability of performing one PT in both H-bonds each (successful DPT)
or a forth and back PT along one H-bond (attempted DPT).
4 Discussion and Conclusions
In this work double proton transfer in cyclic FAD in solution was
characterized from extensive ML/MM MD simulations (total of
ns for all temperatures and all charge models considered) using an
energy function at MP2/aug-cc-pVTZ level quality for the solute akin
to a QM/MM treatment at this level of quantum chemical theory.
To
put the present simulations in context it is worthwhile to note that
100 ps of a ML/MM MD simulation (with ML trained at the
MP2/aug-cc-pVTZ level) on 1 CPU takes days for the energy and force evaluations. At the MP2/aug-cc-pVTZ level of
theory the energy evaluations alone, i.e. without
calculating forces, on 1 CPU would take at least 4200 days. Clearly,
QM/MM simulation at such a level of theory are not feasible at
present and in the foreseeable future. It is further worth to
mention that the PhysNet representation captures bond polarization
through geometry-dependent, fluctuating charges. On the other hand,
intramolecular polarization of FAD by the water solvent is not
included but is expected to be small due to the hydrophobicity of
cyclic FAD.
Spontaneous DPT is observed on the nanosecond time scale at 300 K to
350 K with a maximum rate of 0.9 ns-1 at 350 K. The total
ML/MM energy function used was validated vis-a-vis B3LYP+D3
calculations and agrees to within kcal/mol for hydrated FAD
with up to 15 surrounding water molecules. One particularly
interesting aspect of the dynamics of FAD in solution is the fact that
dissociation into a branched, singly H-bonded structure or into two
separate formic acid monomers competes with DPT. The present results
(see Figure 2) suggest that on the ns time scale
the probability to form branched, singly H-bonded structures is
considerably smaller than for cyclic FAD to exist (which decreases as
increases) or that of forming two separated monomers (which
increases as increases). Simulations at higher temperature allow
to qualitatively assess conditions at higher pressure which has been
used to induce proton transfer in other
systems.89, 90
Results from previous simulation studies are somewhat
ambiguous. Recent ab initio MD simulations using the BLYP
functional including dispersion correction point towards pronounced
hydrophobicity of cyclic FAD62 as was also found
from earlier simulations using a fully empirical force
field.57 Both are consistent with the present
work. On the other hand, simulations with this non-reactive, fully
empirical force field report facile transitions from FAD to branched
structures.57 Such branched structures were also
implied from experiments which were, however, carried out in 3 molal
NaCl.59
Analysis of the dependent free
energies for DPT yields a change in solvation entropy of cal/mol/K. It is of interest to juxtapose this value with
earlier work that rather focused on dissociation of FAD into two
separated monomers for which cal/mol/K was
reported also using the TIP3P water model.57 However,
it is quite likely that the two entropy values which differ by about
30 % are not directly comparable as dimerization is driven by the
different arrangements of solvent molecules around FAD and the FAMs
whereas for DPT the reorganization is less pronounced; see Figure
6E.
As the calculated p underestimates the experimentally
measured one by 1 to 2 units (0.25 vs. 1.2 to 2.1),57
it is expected that the energy function used in these earlier free
energy simulations for cyclic FAD57 underestimate the
enthalpic contribution by about one order of magnitude. The reported
stabilization from umbrella sampling simulations using the CHARMM22
force field was kcal/mol. Hence, to be
consistent with the experimentally determined p, the
enthalpic contribution to the stabilization of FAD in solution should
rather be kcal/mol or larger. Adding this to the stabilization
energy for FAD in the gas phase using the CGenFF energy function
( kcal/mol) yields an estimated stabilization of kcal/mol
or larger which is more consistent with results from recent high-level
electronic structure calculations which find a gas-phase stability for
cyclic FAD of kcal/mol.33, 41 In
other words, the unreactive, empirical CGenFF energy function
considerably underestimates the stabilization of cyclic FAD in the gas
phase and in solution which is also confirmed by the results in
Figures S3 to S7 and leads to ready
dissociation of FAD into two FAMs from such
simulations.57
Successful DPT is found to chiefly depend on the conformation of
the cyclic FAD. In particular, increased symmetry with
simultaneously contracted O–O distances in both H-bonds and CO
bonds with lowers the reaction barrier for PT
along both H-bonds. Successful DPT requires the solvent induced
electrostatic force to be only mildly inhibiting kcal/mol/Å along the second H-bond. If the inhibiting
force originating from the solvent is too strong along the second
H-bond, attempted DPT dominates. For DPT, the MD simulations show an
average delay between two PT events of and fs for
attempted and successful DPT at 350 K, respectively, and the
solvent-generated Coulomb field assists the first PT. A time
difference of fs between the successive PT events for
successful DPT compares with a time scale of fs for the
Odon–Oacc vibration. This suggests that DPT in
hydrated FAD is essentially concerted and not stepwise; both PTs
occur within one Odon–Oacc vibration period. For
a stepwise DPT the intermediate state (both protons on one FAM)
would need to stabilize, i.e. have a lifetime, which is, however,
not what is found here.
From a chemical perspective, one point of particular note is the
successful and correct description of the change between bond orders 1
and 2 for the CO bond in PhysNet. Conventional empirical force fields
encode the bond order in the equilibrium separation of the bonded term
which does not allow easily for changes in the bond order depending on
changes in the chemical environment. Although there are examples for
capturing such effects91 making provisions for it
in the context of empirical force fields is cumbersome. As Figures
4B, C, E, and F demonstrate, a NN-trained energy function
based on reference electronic structure calculations successfully
captures such chemical effects.
In summary, a ML/MM MD scheme was implemented and applied to DPT
for FAD in solution. The results from ns of ML/MM MD
simulations show that DPT and dissociation into two FAMs compete
depending on temperature. FAD is predominantly hydrophobic which
agrees with earlier findings, and the rate for DPT of ns-1 is consistent between biased and unbiased
simulations. Extending the present work to other reaction types and
protein-ligand binding will provide deeper chemical understanding and
improved models suitable for statistically significant sampling to
give molecular level insight into processes in the condensed
phase.
Contrary to straight AIMD simulations at the correlated
level, an ML/MM MD ansatz is feasible even for nanosecond time scale
simulations.
Supporting Information
The supporting information reports additional graphics S1-S14.
Data Availability Statement
The data needed for the PhysNet representation of the MP2 PES is available at https://github.com/MMunibas/fad.git.
Acknowledgments
This work was supported by the Swiss National Science Foundation grants 200021-117810, 200020-188724, NCCR MUST, and the University of Basel which is gratefully acknowledged. This project received funding from the European Union’s Horizon 2020 research and innovation program under the Marie Skłodowska-Curie grant agreement No 801459 - FP-RESOMUS.
References
- Warshel and Weiss 1980 Warshel, A.; Weiss, R. M. An Empirical Valence Bond Approach for Comparing Reactions in Solutions and in Enzymes. J. Am. Chem. Soc. 1980, 102, 6218–6226
- Åqvist and Warshel 1993 Åqvist, J.; Warshel, A. Simulation of Enzyme Reactions Using Valence Bond Force Fields and Other Hybrid Quantum/classical Approaches. Chem. Rev. 1993, 93, 2523–2544
- Gajewski and Brichford 1994 Gajewski, J.; Brichford, N. Secondary Deuterium Kinetic Isotope Effects in the Aqueous Claisen Rearrangement: Evidence against an Ionic Transition State. J. Am. Chem. Soc. 1994, 117, 3165–3166
- Brickel and Meuwly 2019 Brickel, S.; Meuwly, M. Molecular Determinants for Rate Acceleration in the Claisen Rearrangement Reaction. J. Phys. Chem. B 2019, 123, 448–456
- Meuwly 2021 Meuwly, M. Machine Learning for Chemical Reactions. Chem. Rev. 2021, 121, 10218–10239
- Kamerlin et al. 2009 Kamerlin, S. C.; Haranczyk, M.; Warshel, A. Are Mixed Explicit/implicit Solvation Models Reliable for Studying Phosphate Hydrolysis? A Comparative Study of Continuum, Explicit and Mixed Solvation Models. ChemPhysChem 2009, 10, 1125–1134
- Plech et al. 2004 Plech, A.; Wulff, M.; Bratos, S.; Mirloup, F.; Vuilleumier, R.; Schotte, F.; Anfinrud, P. A. Visualizing Chemical Reactions in Solution by Picosecond X-ray Diffraction. Phys. Rev. Lett. 2004, 92, 125505
- Hu and Yang 2008 Hu, H.; Yang, W. Free Energies of Chemical Reactions in Solution and in Enzymes with Ab Initio Quantum Mechanics/molecular Mechanics Methods. Ann. Rev. Phys. Chem. 2008, 59, 573–601
- Kim et al. 2015 Kim, K. H.; Kim, J. G.; Nozawa, S.; Sato, T.; Oang, K. Y.; Kim, T.; Ki, H.; Jo, J.; Park, S.; Song, C. et al. Direct Observation of Bond Formation in Solution with Femtosecond X-ray Scattering. Nature 2015, 518, 385–389
- Meuwly 2019 Meuwly, M. Reactive Molecular Dynamics: From Small Molecules to Proteins. WIREs Comput. Mol. Sci. 2019, 9, e1386
- Nerenberg and Head-Gordon 2018 Nerenberg, P. S.; Head-Gordon, T. New Developments in Force Fields for Biomolecular Simulations. Curr. Opin. Struct. Biol. 2018, 49, 129–138
- Koner et al. 2020 Koner, D.; Salehi, S. M.; Mondal, P.; Meuwly, M. Non-conventional Force Fields for Applications in Spectroscopy and Chemical Reaction Dynamics. J. Chem. Phys. 2020, 153, 010901
- Guest et al. 1997 Guest, J. M.; Craw, J. S.; Vincent, M. A.; Hillier, I. H. The Effect of Water on the Claisen Rearrangement of Allyl Vinyl Ether: Theoretical Methods Including Explicit Solvent and Electron Correlation. J. Chem. Soc., Perkin Trans. 2 1997, 71
- Jung and Marcus 2007 Jung, Y.; Marcus, R. A. On the Theory of Organic Catalysis “on Water”. J. Am. Chem. Soc. 2007, 129, 5492–5502, PMID: 17388592
- White and Wolfarth 1970 White, W. N.; Wolfarth, E. F. The O-claisen Rearrangement. Viii. Solvent Effects. J. Org. Chem. 1970, 35, 2196
- Acevedo and Armacost 2010 Acevedo, O.; Armacost, K. Claisen Rearrangements: Insight into Solvent Effects and “on Water” Reactivity from QM/MM Simulations. J. Am. Chem. Soc. 2010, 132, 1966
- van Keulen et al. 2017 van Keulen, S. C.; Solano, A.; Rothlisberger, U. How Rhodopsin Tunes the Equilibrium between Protonated and Deprotonated Forms of the Retinal Chromophore. J. Chem. Theo. Comp. 2017, 13, 4524–4534, PMID: 28731695
- El Hage et al. 2017 El Hage, K.; Brickel, S.; Hermelin, S.; Gaulier, G.; Schmidt, C.; Bonacina, L.; van Keulen, S. C.; Bhattacharyya, S.; Chergui, M.; Hamm, P. et al. Implications of Short Time Scale Dynamics on Long Time Processes. Struct. Dyn. 2017, 4, 061507
- Mulholland et al. 2000 Mulholland, A. J.; Lyne, P. D.; Karplus, M. Ab Initio QM/MM Study of the Citrate Synthase Mechanism. A Low-barrier Hydrogen Bond Is Not Involved. J. Am. Chem. Soc. 2000, 122, 534–535
- Senn and Thiel 2009 Senn, H. M.; Thiel, W. QM/MM Methods for Biomolecular Systems. Angew. Chem. Intern. Ed. 2009, 48, 1198–1229
- Groenhof 2013 Groenhof, G. In Biomolecular Simulations: Methods and Protocols; Monticelli, L., Salonen, E., Eds.; Humana Press: Totowa, NJ, 2013; pp 43–66
- van Duin et al. 2001 van Duin, A. C. T.; Dasgupta, S.; Lorant, F.; Goddard III, W. A. . ReaxFF: A Reactive Force Field for Hydrocarbons. J. Phys. Chem. A 2001, 105, 9396–9409
- Nagy et al. 2014 Nagy, T.; Yosa Reyes, J.; Meuwly, M. Multisurface Adiabatic Reactive Molecular Dynamics. J. Chem. Theo. Comp. 2014, 10, 1366–1375
- Ang et al. 2021 Ang, S. J.; Wang, W.; Schwalbe-Koda, D.; Axelrod, S.; Gómez-Bombarelli, R. Active Learning Accelerates Ab Initio Molecular Dynamics on Reactive Energy Surfaces. Chem 2021, 7, 738–751
- Böselt et al. 2021 Böselt, L.; Thürlemann, M.; Riniker, S. Machine Learning in QM/MM Molecular Dynamics Simulations of Condensed-phase Systems. J. Chem. Theo. Comp. 2021, 17, 2641–2658
- Pan and McAllister 1997 Pan, Y.; McAllister, M. A. Characterization of Low-barrier Hydrogen Bonds. 1. Microsolvation Effects. An Ab Initio and DFT Investigation. J. Am. Chem. Soc. 1997, 119, 7561–7566
- Lim et al. 1997 Lim, J.-H.; Lee, E. K.; Kim, Y. Theoretical Study for Solvent Effect on the Potential Energy Surface for the Double Proton Transfer in Formic Acid Dimer and Formamidine Dimer. J. Phys. Chem. A 1997, 101, 2233–2239
- Miura et al. 1998 Miura, S.; Tuckerman, M. E.; Klein, M. L. An Ab Initio Path Integral Molecular Dynamics Study of Double Proton Transfer in the Formic Acid Dimer. J. Chem. Phys. 1998, 109, 5290–5299
- Kohanoff et al. 2000 Kohanoff, J.; Koval, S.; Estrin, D. A.; Laria, D.; Abashkin, Y. Concertedness and Solvent Effects in Multiple Proton Transfer Reactions: The Formic Acid Dimer in Solution. J. Chem. Phys. 2000, 112, 9498–9508
- Ushiyama and Takatsuka 2001 Ushiyama, H.; Takatsuka, K. Successive Mechanism of Double-proton Transfer in Formic Acid Dimer: A Classical Study. J. Chem. Phys. 2001, 115, 5903–5912
- Kalescky et al. 2013 Kalescky, R.; Kraka, E.; Cremer, D. Local Vibrational Modes of the Formic Acid Dimer–the Strength of the Double Hydrogen Bond. Mol. Phys. 2013, 111, 1497–1510
- Ivanov et al. 2015 Ivanov, S. D.; Grant, I. M.; Marx, D. Quantum Free Energy Landscapes from Ab Initio Path Integral Metadynamics: Double Proton Transfer in the Formic Acid Dimer Is Concerted but Not Correlated. J. Chem. Phys. 2015, 143, 124304
- Miliordos and Xantheas 2015 Miliordos, E.; Xantheas, S. S. On the Validity of the Basis Set Superposition Error and Complete Basis Set Limit Extrapolations for the Binding Energy of the Formic Acid Dimer. J. Chem. Phys. 2015, 142, 094311
- Tew and Mizukami 2016 Tew, D. P.; Mizukami, W. Ab Initio Vibrational Spectroscopy of Cis-and Trans-formic Acid from a Global Potential Energy Surface. J. Phys. Chem. A 2016, 120, 9815–9828
- Qu and Bowman 2016 Qu, C.; Bowman, J. M. An Ab Initio Potential Energy Surface for the Formic Acid Dimer: Zero-point Energy, Selected Anharmonic Fundamental Energies, and Ground-State Tunneling Splitting Calculated in Relaxed 1–4-mode Subspaces. Phys. Chem. Chem. Phys. 2016, 18, 24835–24840
- Mackeprang et al. 2016 Mackeprang, K.; Xu, Z.-H.; Maroun, Z.; Meuwly, M.; Kjaergaard, H. G. Spectroscopy and Dynamics of Double Proton Transfer in Formic Acid Dimer. Phys. Chem. Chem. Phys. 2016, 18, 24654–24662
- Richardson 2017 Richardson, J. O. Full-and Reduced-dimensionality Instanton Calculations of the Tunnelling Splitting in the Formic Acid Dimer. Phys. Chem. Chem. Phys. 2017, 19, 966–970
- Qu and Bowman 2018 Qu, C.; Bowman, J. M. High-dimensional Fitting of Sparse Datasets of CCSD(T) Electronic Energies and MP2 Dipole Moments, Illustrated for the Formic Acid Dimer and Its Complex IR Spectrum. J. Chem. Phys. 2018, 148, 241713
- Qu and Bowman 2018 Qu, C.; Bowman, J. M. Quantum and Classical Ir Spectra of (HCOOH)2, (DCOOH)2 and (DCOOD)2 Using Ab Initio Potential Energy and Dipole Moment Surfaces. Faraday Discuss. 2018, 212, 33–49
- Qu and Bowman 2018 Qu, C.; Bowman, J. M. Ir Spectra of (HCOOH)2 and (DCOOH)2: Experiment, VSCF/VCI, and Ab Initio Molecular Dynamics Calculations Using Full-dimensional Potential and Dipole Moment Surfaces. J. Phys. Chem. Lett. 2018, 9, 2604–2610
- Käser and Meuwly 2022 Käser, S.; Meuwly, M. Transfer Learned Potential Energy Surfaces: Accurate Anharmonic Vibrational Dynamics and Dissociation Energies for the Formic Acid Monomer and Dimer. Phys. Chem. Chem. Phys. 2022,
- Ito and Nakanaga 2000 Ito, F.; Nakanaga, T. A Jet-cooled Infrared Spectrum of the Formic Acid Dimer by Cavity Ring-down Spectroscopy. Chem. Phys. Lett. 2000, 318, 571–577
- Freytes et al. 2002 Freytes, M.; Hurtmans, D.; Kassi, S.; Liévin, J.; Vander Auwera, J.; Campargue, A.; Herman, M. Overtone Spectroscopy of Formic Acid. Chem. Phys. 2002, 283, 47–61
- Georges et al. 2004 Georges, R.; Freytes, M.; Hurtmans, D.; Kleiner, I.; Vander Auwera, J.; Herman, M. Jet-cooled and Room Temperature FTIR Spectra of the Dimer of Formic Acid in the Gas Phase. Chem. Phys. 2004, 305, 187–196
- Zielke and Suhm 2007 Zielke, P.; Suhm, M. Raman Jet Spectroscopy of Formic Acid Dimers: Low Frequency Vibrational Dynamics and Beyond. Phys. Chem. Chem. Phys. 2007, 9, 4528–4534
- Xue and Suhm 2009 Xue, Z.; Suhm, M. A. Probing the Stiffness of the Simplest Double Hydrogen Bond: The Symmetric Hydrogen Bond Modes of Jet-cooled Formic Acid Dimer. J. Chem. Phys. 2009, 131, 054301
- Kollipost et al. 2012 Kollipost, F.; Larsen, R. W.; Domanskaya, A.; Nörenberg, M.; Suhm, M. Communication: The Highest Frequency Hydrogen Bond Vibration and an Experimental Value for the Dissociation Energy of Formic Acid Dimer. J. Chem. Phys. 2012, 136, 151101
- Nejad and Suhm 2020 Nejad, A.; Suhm, M. A. Concerted Pair Motion Due to Double Hydrogen Bonding: The Formic Acid Dimer Case. J. Ind. Inst. Sci. 2020, 100, 5–19
- Reutemann and Kieczka 2011 Reutemann, W.; Kieczka, H. Ullmann’s Encyclopedia of Industrial Chemistry; American Cancer Society, 2011
- Balabin 2009 Balabin, R. M. Polar (acyclic) Isomer of Formic Acid Dimer: Gas-phase Raman Spectroscopy Study and Thermodynamic Parameters. J. Phys. Chem. A 2009, 113, 4910–4918
- Li et al. 2019 Li, W.; Evangelisti, L.; Gou, Q.; Caminati, W.; Meyer, R. The Barrier to Proton Transfer in the Dimer of Formic Acid: A Pure Rotational Study. Angew. Chem. Intern. Ed. 2019, 58, 859–865
- Zhang et al. 2017 Zhang, Y.; Li, W.; Luo, W.; Zhu, Y.; Duan, C. High Resolution Jet-cooled Infrared Absorption Spectra of (HCOOH)2, (HCOOD)2, and HCOOH-HCOOD Complexes in 7.2 m Region. J. Chem. Phys. 2017, 146, 244306
- Ortlieb and Havenith 2007 Ortlieb, M.; Havenith, M. Proton Transfer in (HCOOH)2: An IR High-resolution Spectroscopic Study of the Antisymmetric C–O Stretch. J. Phys. Chem. A 2007, 111, 7355–7363
- Goroya et al. 2014 Goroya, K. G.; Zhu, Y.; Sun, P.; Duan, C. High Resolution Jet-cooled Infrared Absorption Spectra of the Formic Acid Dimer: A Reinvestigation of the C–O Stretch Region. J. Chem. Phys. 2014, 140, 164311
- Zoete and Meuwly 2004 Zoete, V.; Meuwly, M. Double Proton Transfer in the Isolated and DNA-embedded Guanine-cytosine Base Pair. J. Chem. Phys. 2004, 121, 4377–4388
- Arabi and Matta 2018 Arabi, A. A.; Matta, C. F. Effects of Intense Electric Fields on the Double Proton Transfer in the Watson–crick Guanine–Cytosine Base Pair. J. Phys. Chem. B 2018, 122, 8631–8641
- Chen et al. 2008 Chen, J.; Brooks, C. L.; Scheraga, H. A. Revisiting the Carboxylic Acid Dimers in Aqueous Solution: Interplay of Hydrogen Bonding, Hydrophobic Interactions, and Entropy. J. Phys. Chem. B 2008, 112, 242–249
- Katchalsky et al. 1951 Katchalsky, A.; Eisenberg, H.; Lifson, S. Hydrogen Bonding and Ionization of Carboxylic Acids in Aqueous Solutions. J. Am. Chem. Soc. 1951, 73, 5889–5890
- Schrier et al. 1964 Schrier, E. E.; Pottle, M.; Scheraga, H. A. The Influence of Hydrogen and Hydrophobic Bonds on the Stability of the Carboxylic Acid Dimers in Aqueous Solution. J. Am. Chem. Soc. 1964, 86, 3444–3449
- Soffientini et al. 2015 Soffientini, S.; Bernasconi, L.; Imberti, S. The Hydration of Formic Acid and Acetic Acid. J. Mol. Liqu. 2015, 205, 85–92
- Sobyra et al. 2017 Sobyra, T. B.; Melvin, M. P.; Nathanson, G. M. Liquid Microjet Measurements of the Entry of Organic Acids and Bases into Salty Water. J. Phys. Chem. C 2017, 121, 20911–20924
- Hänninen et al. 2018 Hänninen, V.; Murdachaew, G.; Nathanson, G. M.; Gerber, R. B.; Halonen, L. Ab Initio Molecular Dynamics Studies of Formic Acid Dimer Colliding with Liquid Water. Phys. Chem. Chem. Phys. 2018, 20, 23717–23725
- Tarakanova et al. 2019 Tarakanova, E.; Voloshenko, G.; Kislina, I.; Mayorov, V.; Yukhnevich, G.; Lyashchenko, A. Composition and Structure of Hydrates Formed in Aqueous Solutions of Formic Acid. J. Struct. Chem. 2019, 60, 255–267
- Dou et al. 2020 Dou, Z.; Wang, L.; Hu, J.; Fang, W.; Sun, C.; Men, Z. Hydrogen Bonding Effect on Raman Modes of Formic Acid-water Binary Solutions. J. Mol. Liq. 2020, 313, 113595
- Larsen et al. 2017 Larsen, A. H.; Mortensen, J. J.; Blomqvist, J.; Castelli, I. E.; Christensen, R.; Dułak, M.; Friis, J.; Groves, M. N.; Hammer, B.; Hargus, C. et al. The Atomic Simulation Environment – a Python Library for Working with Atoms. J. Phys. Condens. Matter 2017, 29, 273002
- Unke and Meuwly 2019 Unke, O. T.; Meuwly, M. Physnet: A Neural Network for Predicting Energies, Forces, Dipole Moments, and Partial Charges. J. Chem. Theo. Comp. 2019, 15, 3678–3693
- Jorgensen et al. 1983 Jorgensen, W. L.; Chandrasekhar, J.; Madura, J. D.; Impey, R. W.; Klein, M. L. Comparison of Simple Potential Functions for Simulating Liquid Water. J. Chem. Phys. 1983, 79, 926–935
- Werner et al. 2020 Werner, H.-J.; Knowles, P. J.; Manby, F. R.; Black, J. A.; Doll, K.; Heßelmann, A.; Kats, D.; Köhn, A.; Korona, T.; Kreplin, D. A. et al. The Molpro Quantum Chemistry Package. J. Chem. Phys. 2020, 152, 144107
- Huang and von Lilienfeld 2020 Huang, B.; von Lilienfeld, O. A. Quantum Machine Learning Using Atom-in-molecule-based Fragments Selected on the Fly. Nat. Chem. 2020, 12, 945–951
- Behler 2015 Behler, J. Constructing High-Dimensional Neural Network Potentials: A Tutorial Review. Int. J. Quantum. Chem. 2015, 115, 1032–1050
- Unke and Meuwly 2018 Unke, O. T.; Meuwly, M. A Reactive, Scalable, and Transferable Model for Molecular Energies from a Neural Network Approach Based on Local Information. J. Chem. Phys. 2018, 148, 241708
- Grimme et al. 2011 Grimme, S.; Ehrlich, S.; Goerigk, L. Effect of the Damping Function in Dispersion Corrected Density Functional Theory. J. Comput. Phys. 2011, 32, 1456–1465
- Abadi et al. 2015 Abadi, M.; Agarwal, A.; Barham, P.; Brevdo, E.; Chen, Z.; Citro, C.; Corrado, G. S.; Davis, A.; Dean, J.; Devin, M. et al. TensorFlow: Large-scale Machine Learning on Heterogeneous Systems. 2015; http://tensorflow.org/, Software available from tensorflow.org
- Baydin et al. 2018 Baydin, A. G.; Pearlmutter, B. A.; Radul, A. A.; Siskind, J. M. Automatic Differentiation in Machine Learning: A Survey. J. Mach. Learn. Res. 2018, 18, 1–43
- Mortensen et al. 2005 Mortensen, J. J.; Hansen, L. B.; Jacobsen, K. W. Real-space Grid Implementation of the Projector Augmented Wave Method. Phys. Rev. B 2005, 71, 035109
- Vanommeslaeghe et al. 2010 Vanommeslaeghe, K.; Hatcher, E.; Acharya, C.; Kundu, S.; Zhong, S.; Shim, J.; Darian, E.; Guvench, O.; Lopes, P.; Vorobyov, I. et al. CHARMM General Force Field: A Force Field for Drug-like Molecules Compatible with the CHARMM All-Atom Additive Biological Force Fields. J. Comput. Phys. 2010, 31, 671–690
- Spohr 1997 Spohr, E. Effect of Electrostatic Boundary Conditions and System Size on the Interfacial Properties of Water and Aqueous Solutions. J. Chem. Phys. 1997, 107, 6342–6348
- Torrie and Valleau 1977 Torrie, G. M.; Valleau, J. P. Nonphysical Sampling Distributions in Monte Carlo Free-energy Estimation: Umbrella Sampling. J. Chem. Phys. 1977, 23, 187–199
- Andersen 1983 Andersen, H. C. Rattle: A “Velocity” Version of the Shake Algorithm for Molecular Dynamics Calculations. J. Comput. Phys. 1983, 52, 24–34
- Enkovaara et al. 2010 Enkovaara, J.; Rostgaard, C.; Mortensen, J. J.; Chen, J.; Dułak, M.; Ferrighi, L.; Gavnholt, J.; Glinsvad, C.; Haikola, V.; Hansen, H. A. et al. Electronic Structure Calculations with GPAW: A Real-space Implementation of the Projector Augmented-wave Method. J. Phys.: Condens. Matter 2010, 22, 253202
- Meuwly and Karplus 2002 Meuwly, M.; Karplus, M. Simulation of Proton Transfer along Ammonia Wires: An “Ab Initio” and Semiempirical Density Functional Comparison of Potentials and Classical Molecular Dynamics. J. Chem. Phys. 2002, 116, 2572–2585
- Becke 1993 Becke, A. D. Density‐functional Thermochemistry. Iii. The Role of Exact Exchange. J. Chem. Phys. 1993, 98, 5648–5652
- Lee et al. 1988 Lee, C.; Yang, W.; Parr, R. G. Development of the Colle-Salvetti Correlation-energy Formula into a Functional of the Electron Density. Phys. Rev. B 1988, 37, 785–789
- Grimme et al. 2010 Grimme, S.; Antony, J.; Ehrlich, S.; Krieg, H. A Consistent and Accurate Ab Initio Parametrization of Density Functional Dispersion Correction (DFT-D) for the 94 Elements H-Pu. J. Chem. Phys. 2010, 132, 154104
- Sidler et al. 2018 Sidler, D.; Meuwly, M.; Hamm, P. An Efficient Water Force Field Calibrated against Intermolecular THz and Raman Spectra. J. Chem. Phys. 2018, 148, 244504
- Huang et al. 2019 Huang, X.; Tang, C.; Li, J.; Chen, L.-C.; Zheng, J.; Zhang, P.; Le, J.; Li, R.; Li, X.; Liu, J. et al. Electric Field–induced Selective Catalysis of Single-molecule Reaction. Science advances 2019, 5, eaaw3072
- Shaik et al. 2004 Shaik, S.; De Visser, S. P.; Kumar, D. External Electric Field Will Control the Selectivity of Enzymatic-like Bond Activations. J. Am. Chem. Soc. 2004, 126, 11746–11749
- Ropp et al. 2001 Ropp, J.; Lawrence, C.; Farrar, T.; Skinner, J. Rotational Motion in Liquid Water Is Anisotropic: A Nuclear Magnetic Resonance and Molecular Dynamics Simulation Study. J. Am. Chem. Soc. 2001, 123, 8047–8052
- Martins et al. 2009 Martins, D. M. S.; Middlemiss, D. S.; Pulham, C. R.; Wilson, C. C.; Weller, M. T.; Henry, P. F.; Shankland, N.; Shankland, K.; Marshall, W. G.; Ibberson, R. M. et al. Temperature- and Pressure-induced Proton Transfer in the 1:1 Adduct Formed between Squaric Acid and 4,4’-bipyridine. J. Am. Chem. Soc. 2009, 131, 3884–3893
- Ma et al. 2017 Ma, Z.; Li, J.; Sun, C.; Zhou, M. High Pressure Spectroscopic Investigation on Proton Transfer in Squaric Acid and 4,4’-bipyridine Co-crystal. Sci. Rep. 2017, 7, 4677
- Xu and Meuwly 2017 Xu, Z.-H.; Meuwly, M. Vibrational Spectroscopy and Proton Transfer Dynamics in Protonated Oxalate. J. Phys. Chem. A 2017, 121, 5389–5398