Droplet plume emission during plasmonic bubble growth in ternary liquids
Abstract
Plasmonic bubbles are of great relevance in numerous applications, including catalytic reactions, micro/nanomanipulation of molecules or particles dispersed in liquids, and cancer therapeutics. So far, studies have been focused on bubble nucleation in pure liquids. Here we investigate plasmonic bubble nucleation in ternary liquids consisting of ethanol, water, and trans-anethole oil which can show the so-called ouzo-effect. We find that oil (trans-anethole) droplet plumes are produced around the growing plasmonic bubbles. The nucleation of the microdroplets and their organization in droplet plumes is due to the symmetry breaking of the ethanol concentration field during the selective evaporation of ethanol from the surrounding ternary liquids into the growing plasmonic bubbles. Numerical simulations show the existence of a critical Marangoni number (the ratio between solutal advection rate and the diffusion rate), above which the symmetry breaking of the ethanol concentration field occurs, leading to the emission of the droplet plumes. The numerical results agree with the experimental observation that more plumes are emitted with increasing ethanol-water relative weight ratios and hence . Our findings on the droplet plume formation reveal the rich phenomena of plasmonic bubble nucleation in multicomponent liquids and help to pave the way to achieve enhanced mixing in multicomponent liquids in chemical, pharmaceutical, and cosmetic industries.
I Introduction
Plasmonic microbubbles are produced by immersed metal nanoparticles under laser irradiation due to plasmonic heating. They have received considerable attention, owing to their potential for numerous applications, such as biomedical diagnosis, cancer therapy liu2014 ; fan2014 ; shao2015 ; emelianov2009 ; lapotko2009 , micromanipulation of molecules or particles dispersed in solutions zhao2014 ; xie2017opt ; Tantussi2018 and locally enhanced chemical reactions adleman2009 ; baffou2014 . A proper understanding of the dynamics of these plasmonic bubbles is therefore not only of fundamental interest, but also essential from a technological viewpoint as it might provide routes to tailor the formation and growth of the plasmonic bubbles.
During the last decade, numerous studies have been performed to explore the nucleation mechanism and growth dynamics of plasmonic bubbles lombard2014 ; Lombard2015 ; Mahe2018 ; Lombard2016 ; wang2018 ; jollans2019 ; hou2015explosive , as well as the effects of dissolved gas zeng2020 ; Zaytsev2020 ; wang2017 ; li2019 ; baffou2014jpc and liquid types Zaytsev2018 on bubble growth dynamics. To date, these studies have nearly exclusively focused on plasmonic bubble formation in pure liquids. However, in many applications plasmonic bubbles nucleate in binary, ternary or even multicomponent liquids. This introduces new and rich physics and chemistry. E.g., due to selective evaporation, concentration gradients may occur, resulting in Marangoni forces and other rich physicochemical hydrodynamics levich1962 ; lohse2020 , which we want to further explore in this paper.
We have recently started this line of research and investigated plasmonic bubble nucleation in binary liquids of ethanol and water, and found that the solutal Marangoni flow, caused by the preferential vaporization of ethanol, results in the detachment of the bubbles from the substrate at low ethanol ratios () li2020jpcl . In binary liquids with ethanol ratios exceeding , on the contrary, bubbles remain attached to the substrate and first steadily grow until they suddenly shrink. The shrinkage is induced by the depinning of the three phase contact line from the laser spot region, which is due to the decreased opto-thermal efficiency. For plasmonic bubbles in ternary liquids, the phase equilibrium is continuously altered by liquid vaporization and mass and thermal diffusion, resulting in a much richer and more complex behavior than in pure liquids.
To gain insight into the dynamics of plasmonic bubbles in ternary and multicomponent liquids, we study here the bubble formation in a controlled specific category of ternary liquids. Namely, we have selected a ternary liquid which shows the so-called ouzo effect vital2003 ; tan2016pnas ; lohse2020 , namely a solution consisting of ethanol, water, and trans-anethole. The ouzo effect describes the spontaneous emulsification that occurs when water is added to dilute the solution, thus lowering its oil-solubility. The initially transparent solution then becomes milky because of the nucleation of oil microdroplets due to the reduced solubility of the oil in liquid mixtures with lower ethanol concentration ganachaud2005 ; vital2003 . The emulsification can also occur if the amount of ethanol is reduced in different ways, for instance, through preferential evaporation or dissolution tan2017sf ; tan2019jfm ; tan2016pnas .
In this work, we present experimental and numerical studies on plasmonic bubble formation in the ternary liquids of ethanol, water , and trans-anethole. Interestingly, for certain ternary liquid ratios, we observe the emission of droplet plumes from the growing plasmonic bubbles, carrying the nucleated oil microdroplets away from the bubble. We will show that the key parameter governing the pattern and number of these emitted plumes is the Marangoni number, which is the dimensionless number that compares the solutal advection rate with the diffusion rate. By considering the experiments, numerical simulation and theory, we can provide a detailed understanding of the physicochemical processes that occur during plasmonic bubble growth in these multicomponent liquids.
Note that the formation of trans-anethole droplets out of an oversaturated ternary solution is an interesting nucleation problem in itself. It could be addressed from the viewpoint of classcial nucleation theory (CNT) kashchiev2000 ; ayuba2018 ; vehkamaki2006 , but this is not the subject of the present paper. If one were to do so, one would choose a much simpler geometry, say, by injecting water into an ouzo solution of well-defined properties. We do not have this here, due to partial evaporation of the binary liquid and thermal effects. So here it would be impossible to determine the values of the material parameters required in classical nucleation theory. In addition, it is nearly impossible to identify the size of individual droplets or their numbers in the droplet plumes, due to the limited image resolution of the high-speed imaging system, as well as the cloudy nature of the plumes. In a nutshell, the cloud of nucleated microdroplets is used as a convenient indicator to signal flow regions of relatively high water concentration or equivalently low ethanol concentration. In fact, we will show that the plume formation also works around plasmonic bubble in binary liquids, and can optically be visualized for large enough density contrast of the two involved liquids.
The paper is organized as follows: In section II, we describe the experimental setup and procedure. Section III reports the experimental results for the plume formation around the growing plasmonic bubble in a ternary liquid and section IV compares them with those in a binary liquid. In section V, we present our corresponding numerical results, which, in section VI, are quantitatively compared with the experimental ones. The paper ends with conclusions and an outlook (section VII).
II Experimental setup and procedure
II.1 Sample Preparation
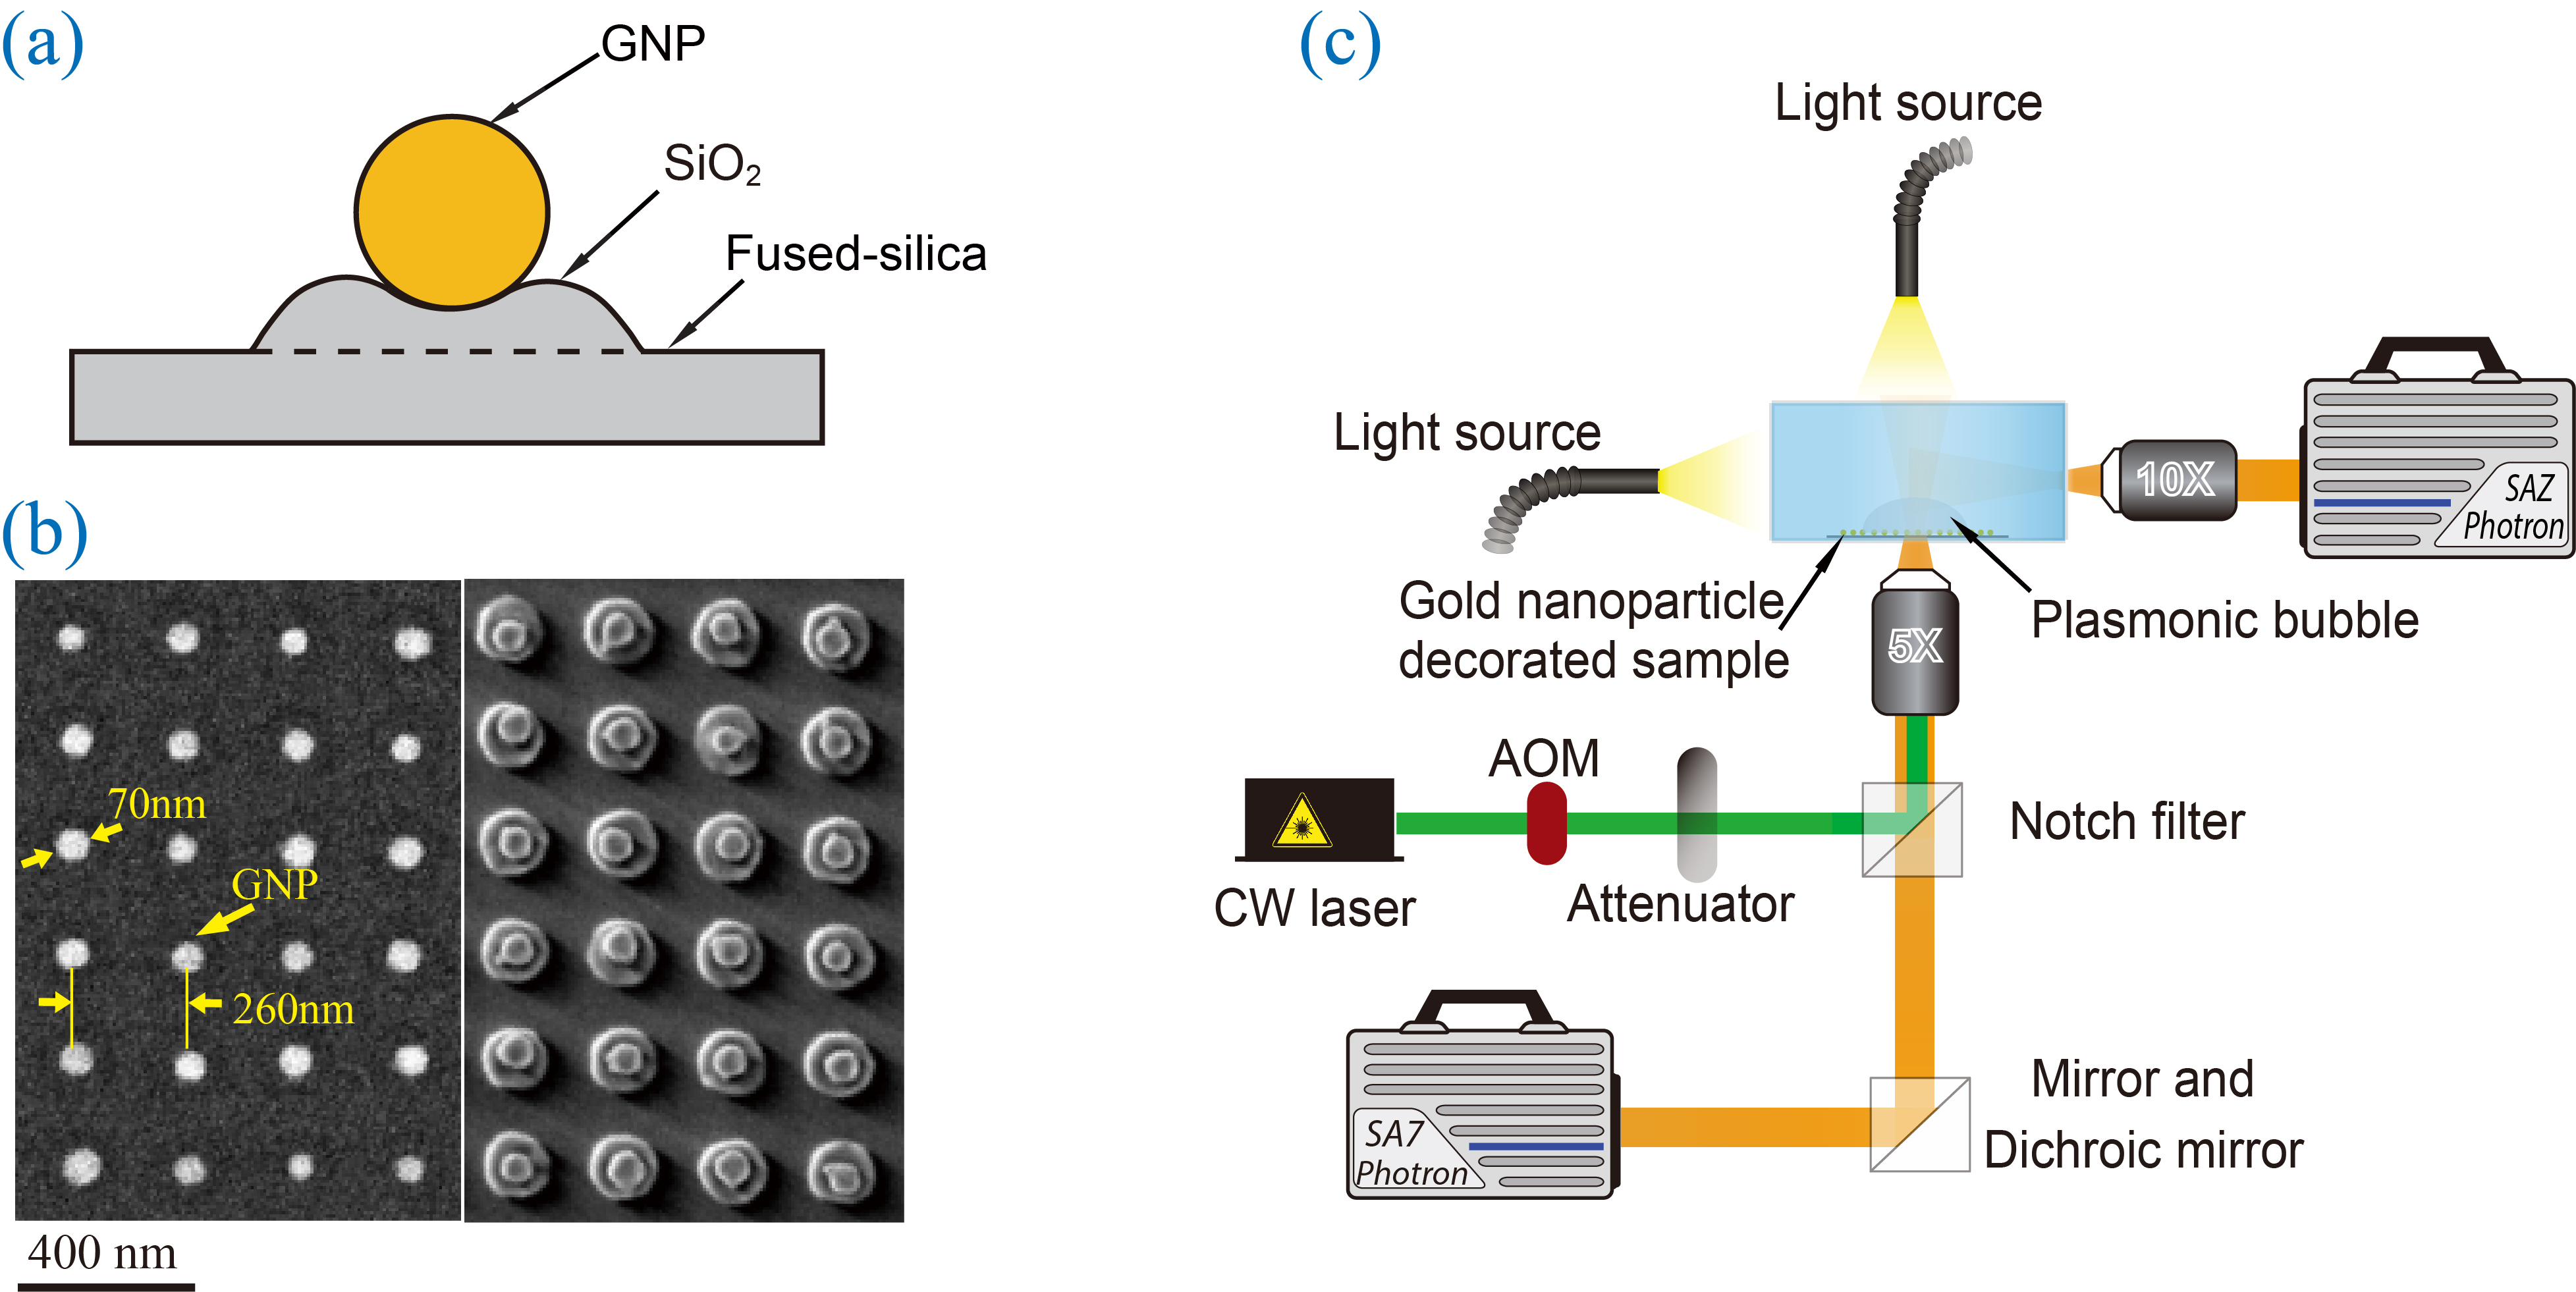
A fused silica surface patterned with an array of gold nanoparticles was used to produce plasmonic bubbles. A gold layer of approximately 45 nm was first deposited on an amorphous fused-silica wafer by using an ion-beam sputtering system (home-built T′COathy machine, MESA+ NanoLab, Twente University). A bottom anti-reflection coating (BARC) layer (186 nm) and a photoresist (PR) layer (200 nm) were subsequently coated on the wafer. Periodic nanocolumns with diameters of approximately 110 nm were patterned in the PR layer using displacement Talbot lithography (PhableR 100C, EULITHA). These periodic PR nanocolumns were subsequently transferred at wafer level to the underlying BARC layer, forming 110 nm BARC nanocolumns by using nitrogen plasma etching (home-built TEtske machine, NanoLab) at 10 mTorr and 25 W for 8 min. Using these BARC nanocolumns as a mask, the Au layer was subsequently etched by ion beam etching (Oxford i300, Oxford Instruments, United Kingdom) with 5 sccm Ar and 50-55 mA at an inclined angle of . The etching for 9 min resulted in periodic Au nanodots supported on cone-shaped fused-silica features. The remaining BARC was stripped using oxygen plasma for 10 min (TePla 300E, PVA TePla AG, Germany). The fabricated array of Au nanodots was heated to C in 90 min and subsequently cooled passively to room temperature. During the annealing process, these Au nanodots re-formed into spherical-shaped Au nanoparticles. Figure 1a shows the schematic of a gold nanoparticle sitting on a SiO2 island on a fused-silica. The energy-selective backscatter (ESB) and scanning electron microscope (SEM) images of the patterned gold nanoparticle sample surface are shown in Figure 1b (left) and Figure 1b (right), respectively.
II.2 Ternary liquid preparation
The ternary liquids used in our experiments are composed of ethanol (Sigma-Aldrich; 99.8), deionized (DI) water (Milli-Q Advantage A10 System, Germany), and trans-anethole oil (Sigma-Aldrich; trans-anethole, 99.8). The ethanol and water were air saturated by exposure to air for 8 hours. Subsequently, they were mixed with trans-anethole oil to prepare seven different ternary liquids, as shown in Table 2. After mixing, the ternary liquids were immediately transferred into a sealed cuvette with a size of 10mm 10mm 50mm for experiments. During experiments, the cuvette was fully filled with the ternary liquid.
II.3 Setup description
The experimental setup for plasmonic microbubble imaging is shown in Figure 1c. The gold nanoparticle decorated sample was placed in a quartz glass cuvette and filled with ternary liquid. A continuous-wave laser (Cobolt Samba) of 532 nm wavelength with a maximum power of 300 mW was used for sample irradiation. An acousto-optic modulator (Opto-Electronic, AOTFncVIS) was used as a shutter to control the laser irradiation on the sample surface. A pulse/delay generator (BNC model 565) was used to generate two different laser pulses of 400 and 4 s in order to study the short-term and the long-term dynamics of microbubbles, respectively. The laser power was controlled by using a half-wave plate and a polarizer and measured by a photodiode power sensor (S130C, ThorLabs). Two high-speed cameras were installed in the setup. One (Photron SA7) was equipped with a 5x long working distance objective (LMPLFLN, Olympus) and the other (Photron SAZ) is equipped with various long working distance objectives: 10 (LMPLFLN, Olympus) and operated at frame rate of 5 kfps. The first camera was used for top-view imaging and the second one was for side-view imaging. Two light sources, Olympus ILP-1 and Schott ACE I were applied to provide illumination for the two high-speed cameras. The optical images are processed with a home designed image segmentation algorithm for the optimized extraction of the bubble radius in MATLAB.
II.4 Experimental procedure
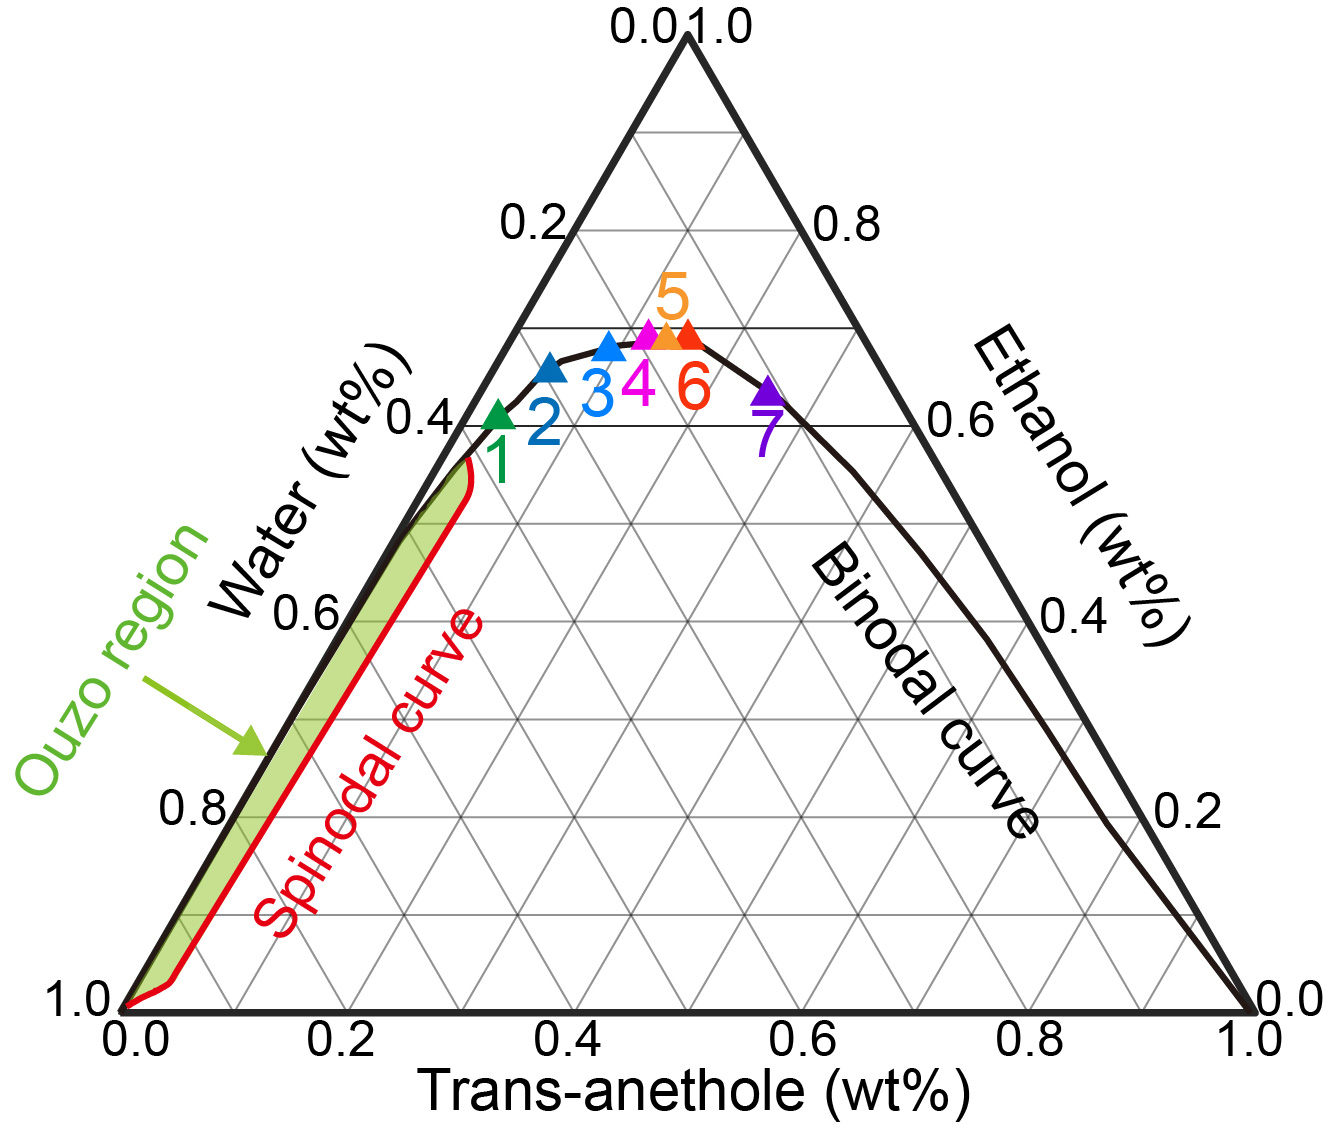
Plasmonic bubble generation experiments were performed in equilibrated ethanol-water-anethole mixtures. As depicted in the ternary diagram (Figure 2), ternary liquids with seven different weight ratios, labelled from 1 to 7, were selected on the binodal curve (phase separation curve) for our experiments. The phase separation curve is based on the study by Tan et al tan2016pnas . In the ternary mixtures, the weight ratios of ethanol, water, and anethole oil are , , and , respectively. Table 2 summarizes the detailed weight ratios of each component in the ternary liquid mixtures. Note that the absolute ethanol concentration non-monotonically changes along the binodal curve. The seven ternary liquids were actually labelled with increasing ethanol-water relative weight ratio of , which hereafter is used for analysis. At low ethanol concentrations, the plasmonic bubbles depin and detach due to the strong upward Marangoni force, which has been systematically investigated in our previous study li2020jpcl . In contrast, bubbles can steadily attach to the substrate at high ethanol fractions.
| Label | ) | |||
|---|---|---|---|---|
| 1 | 62.58 | 33.71 | 3.71 | 65.0% |
| 2 | 66.31 | 28.42 | 5.27 | 70.0% |
| 3 | 68.09 | 22.70 | 9.21 | 75.0% |
| 4 | 68.56 | 19.90 | 11.54 | 77.5% |
| 5 | 68.67 | 18.25 | 13.07 | 79.0% |
| 6 | 68.66 | 17.17 | 14.17 | 80.0% |
| 7 | 64.15 | 11.32 | 24.52 | 85.0% |
III Plume formation around the growing plasmonic bubble in a ternary liquid
We first report our finding for the second regime, i.e., the regime with high ethanol fractions. Figure 3a (I) shows a bottom-view image of a growing plasmonic bubble in a ternary liquid with ethanol-water relative weight ratio , corresponding to ethanol , water , and trans-anethole in weight fractions. Interestingly, a cloudy black region consisting of oil microdroplets is observed starting at 1.68s (Figure 3a II). The emulsification here results from the selective evaporation of ethanol from the ternary liquid vital2003 . Since ethanol has the lowest boiling temperature of the three components in the ternary liquid, ethanol vaporizes first, leading to an oversaturation of the left-behind liquid with the anethole oil and thus to the nucleation of anethole oil microdroplets. Remarkably, the cloudy region keeps rotating around the bubble. The bubble also displays some lateral movement (Figure 3a III and IV). Hereafter we refer to the localized cloudy microdroplet regions as droplet plumes.
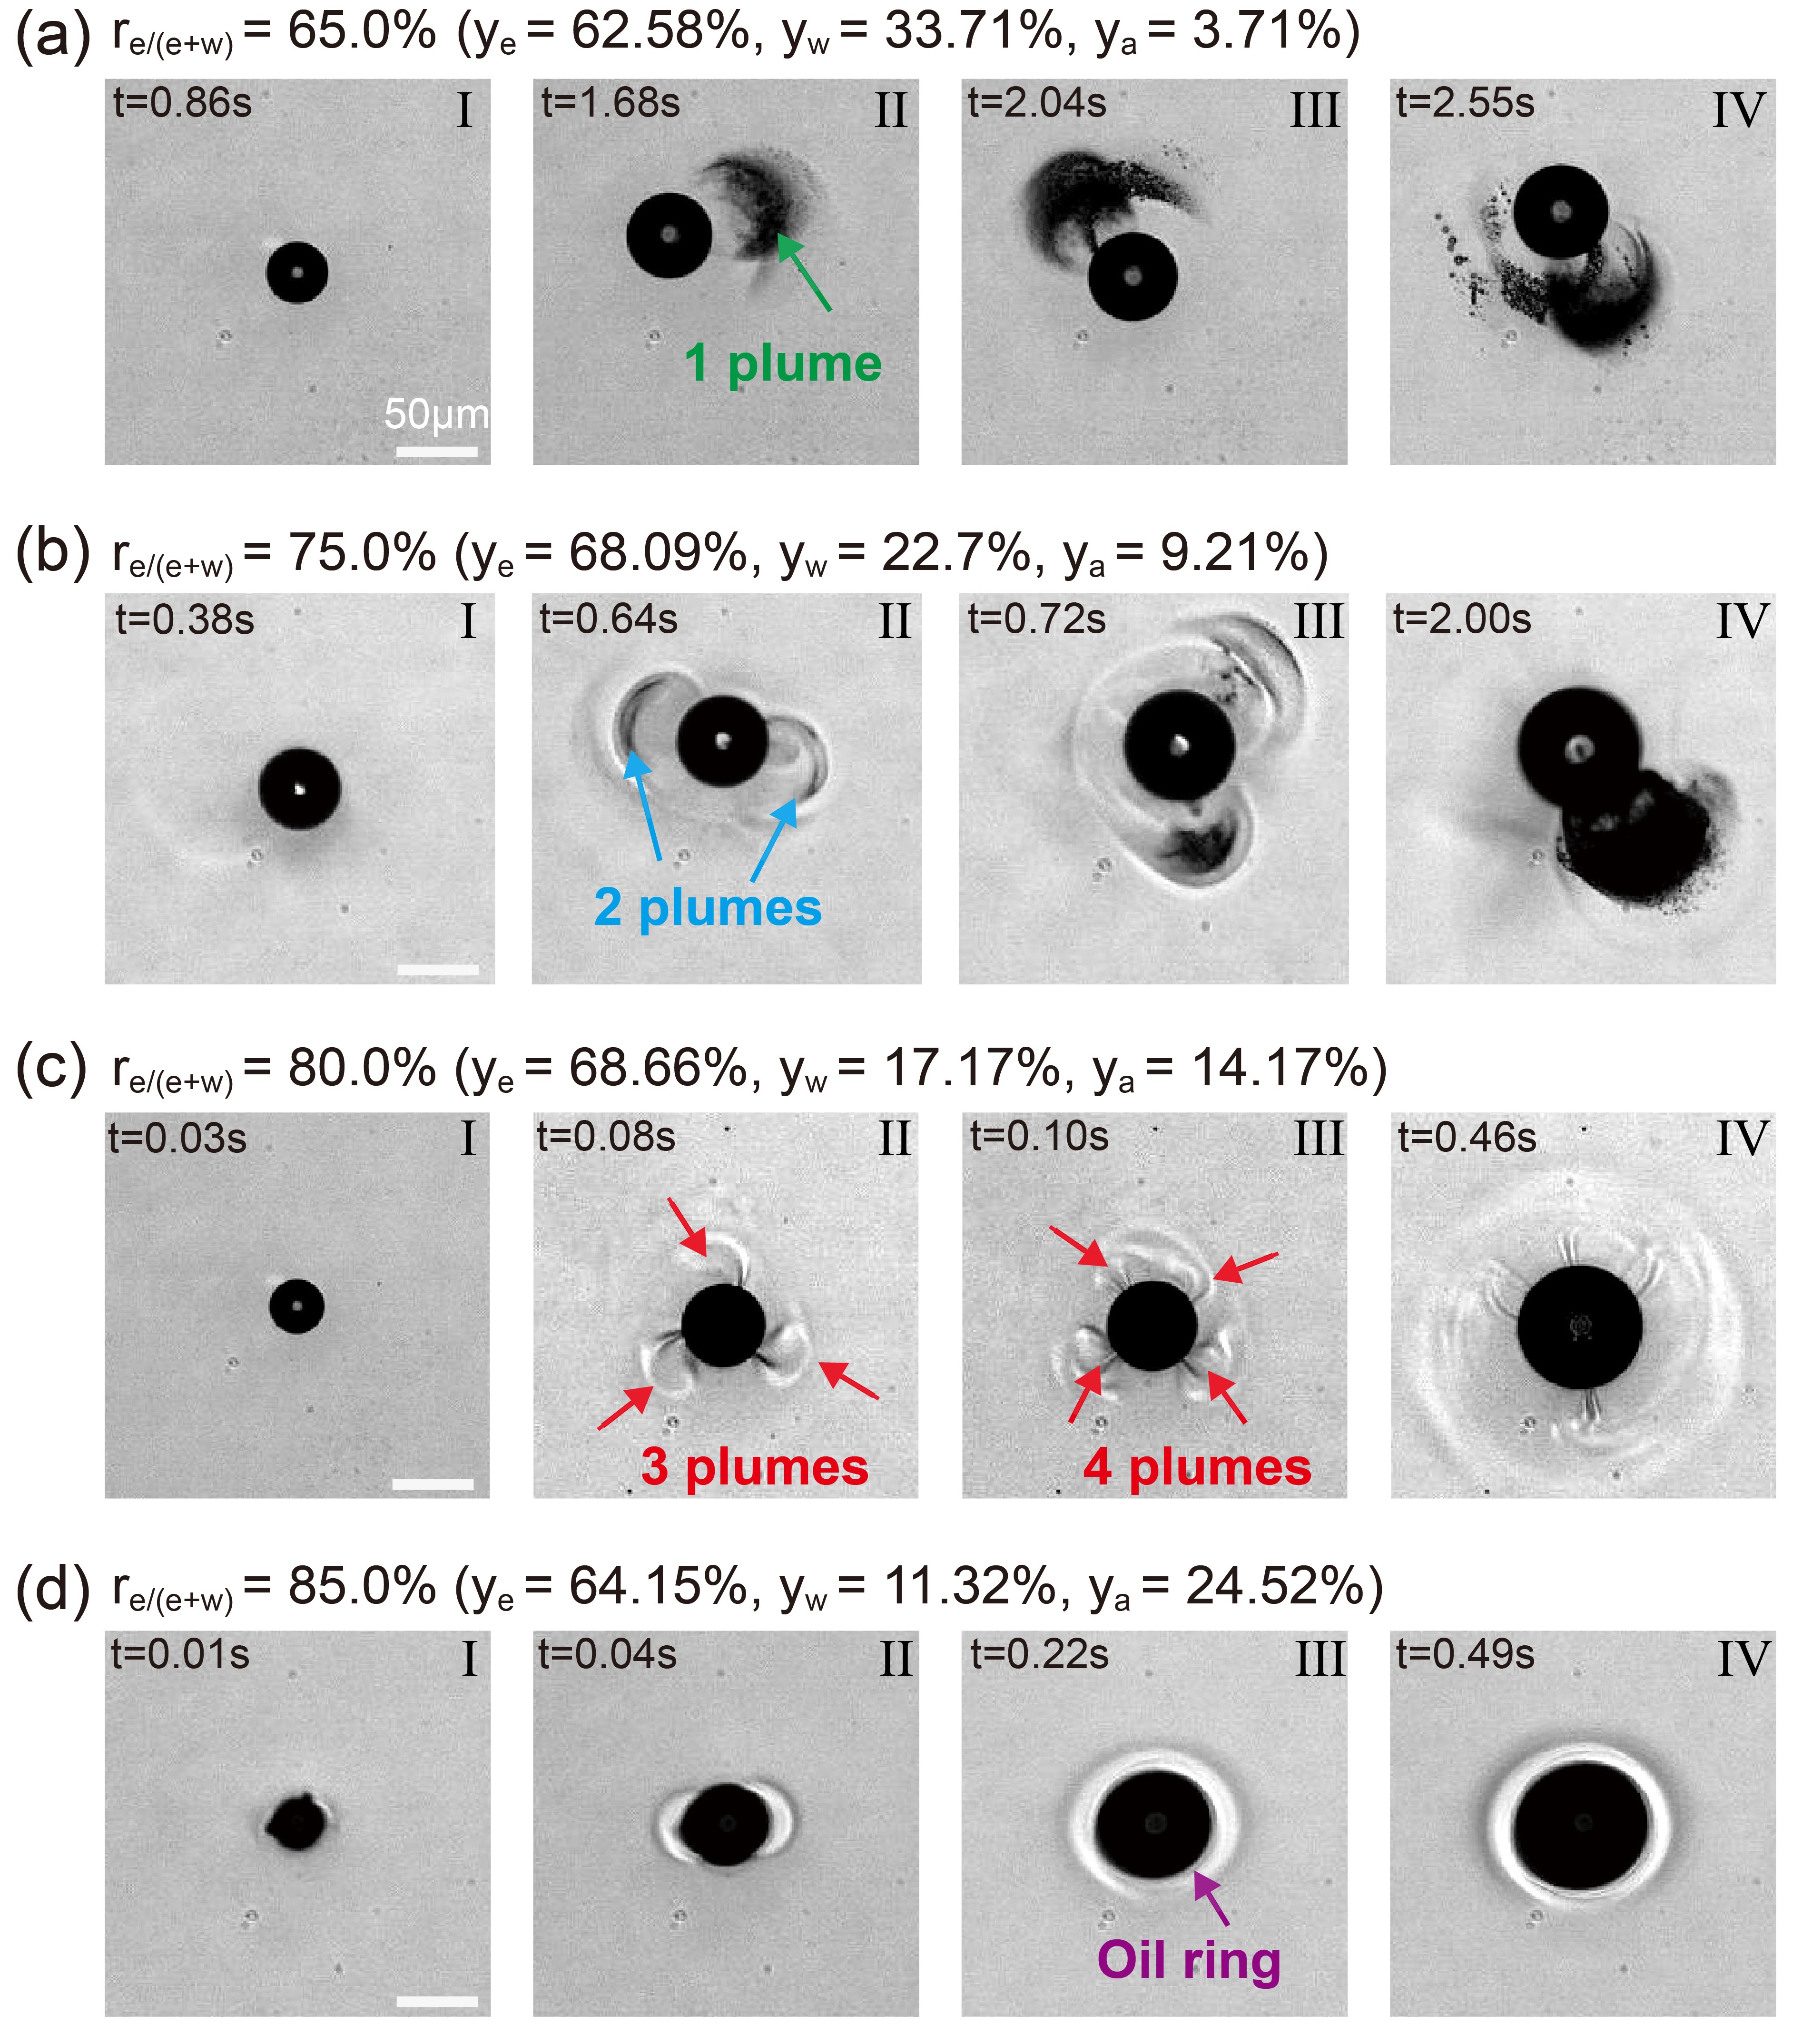
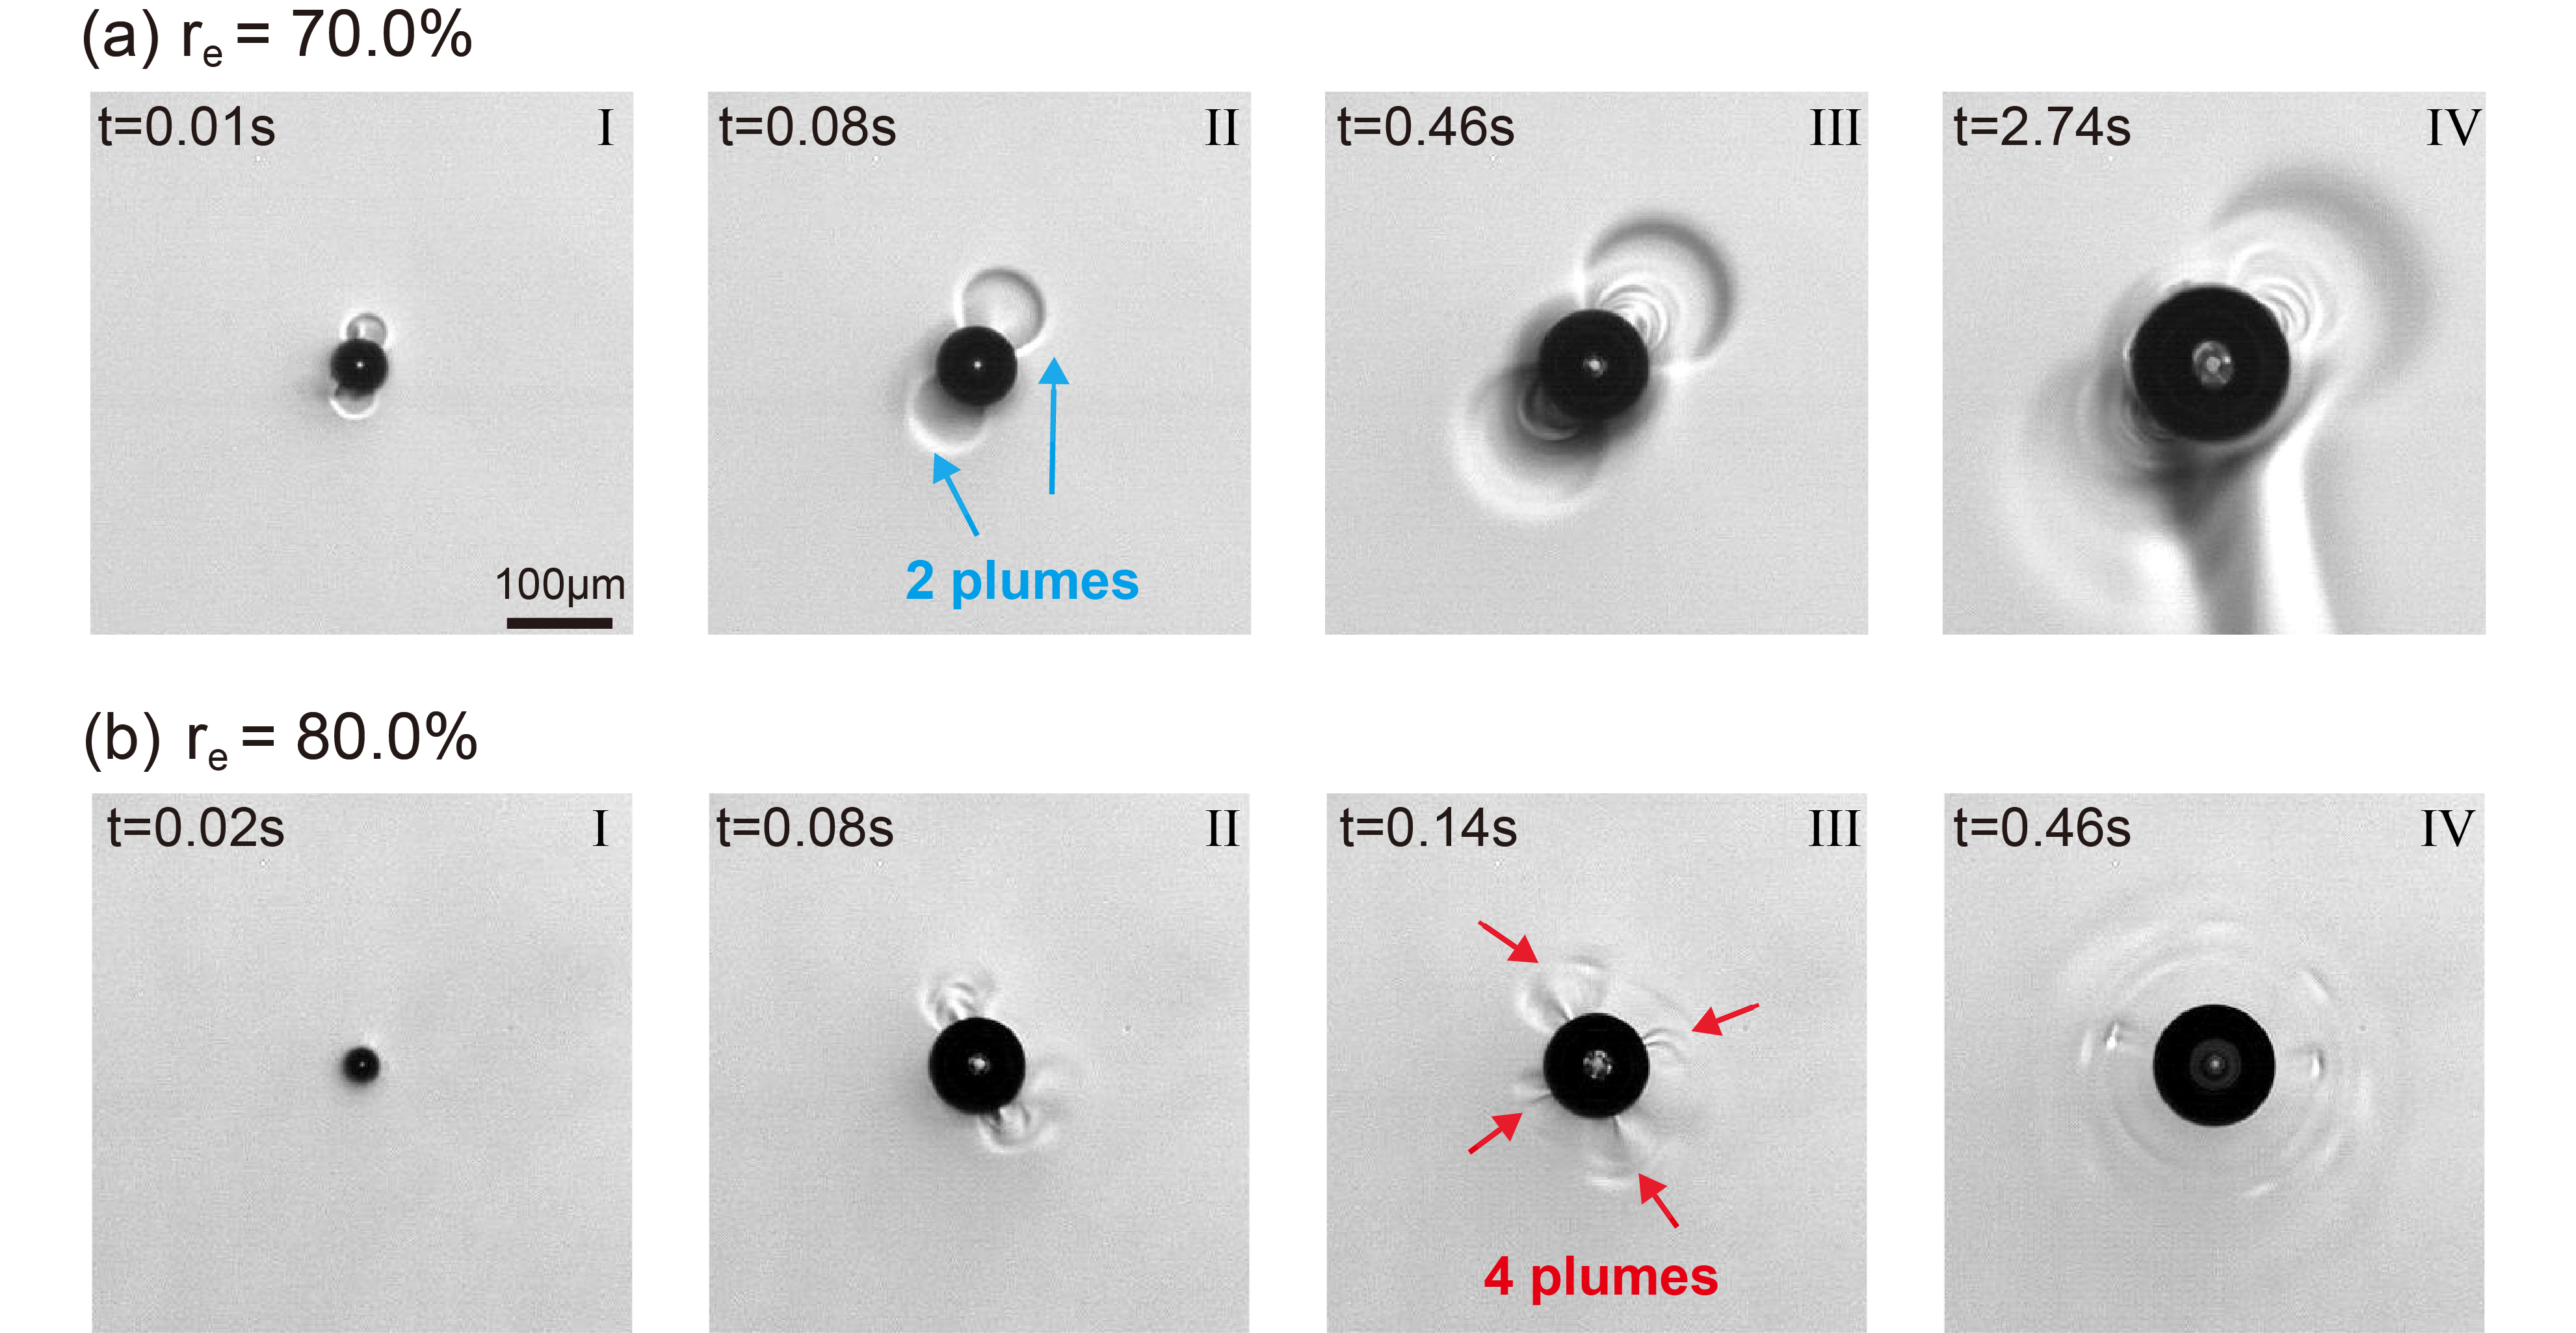
The formation of the droplet plumes is also observed in ternary liquids with the ethanol-water relative weight ratio of , as shown in Figure 3b-d. For , we observe the emission of two droplet plumes (Figure 3b II). The two plumes are formed at opposite sides of the bubble. Subsequently, they merge into a single droplet plume (Figure 3b III and IV). For , there are initially three plumes (Figure 3c II), which evolve later into four plumes (Figure 3c III). Similar to the case of , the plumes are first distributed symmetrically around the bubble until eventually the localized plumes merge (Figure 3c IV). However, in the ternary liquids with (Figure 3d), there is no pronounced droplet plume observed, but rather an oil ring is formed around the bubble (Figure 3d II-IV). This can be rationalized by the high oil concentration () dissolved in the original ternary liquids. Once the ethanol evaporates, the nucleated microdroplets accumulate around the bubble, coalesce and form the oil ring. Note that the bubble formation experiments were performed in a cuvette (10mm 10mm 50mm) fully filled with the ternary liquids. Therefore, the thickness of liquid inside the cuvette is about 10 mm, which is nearly 100 times larger than the bubble size (100 m). The influence of the wall and interface on convection is negligible.
To get more insight into the bubble dynamics and the droplet plume formation, the bubble volume and maximum plume number for different liquid ratios were extracted from our high-speed images. In Figures 4a and b we plotted the volume of the plasmonic bubble versus time and the maximum number of droplet plumes versus the ethanol ratio . Not surprisingly, the bubble growth in the ternary liquids here is very comparable to the bubble growth in ethanol-water binary liquids li2020jpcl . As shown in Figure 4a, for fixed laser irradiation time, the bubble volume increases with increasing ethanol-water relative weight ratio from to . The anethole oil ratio in our ternary system is very low and anethole oil has a much higher boiling temperature than ethanol and water. As a result, anethole oil has limited influence on the vaporization process and the bubble growth in the ternary liquids. A larger relative ethanol fraction in ethanol-water binary liquids results in a large bubble growth rate li2020jpcl . The maximum plume number, , was found to increase with increasing , see Figure 4b.
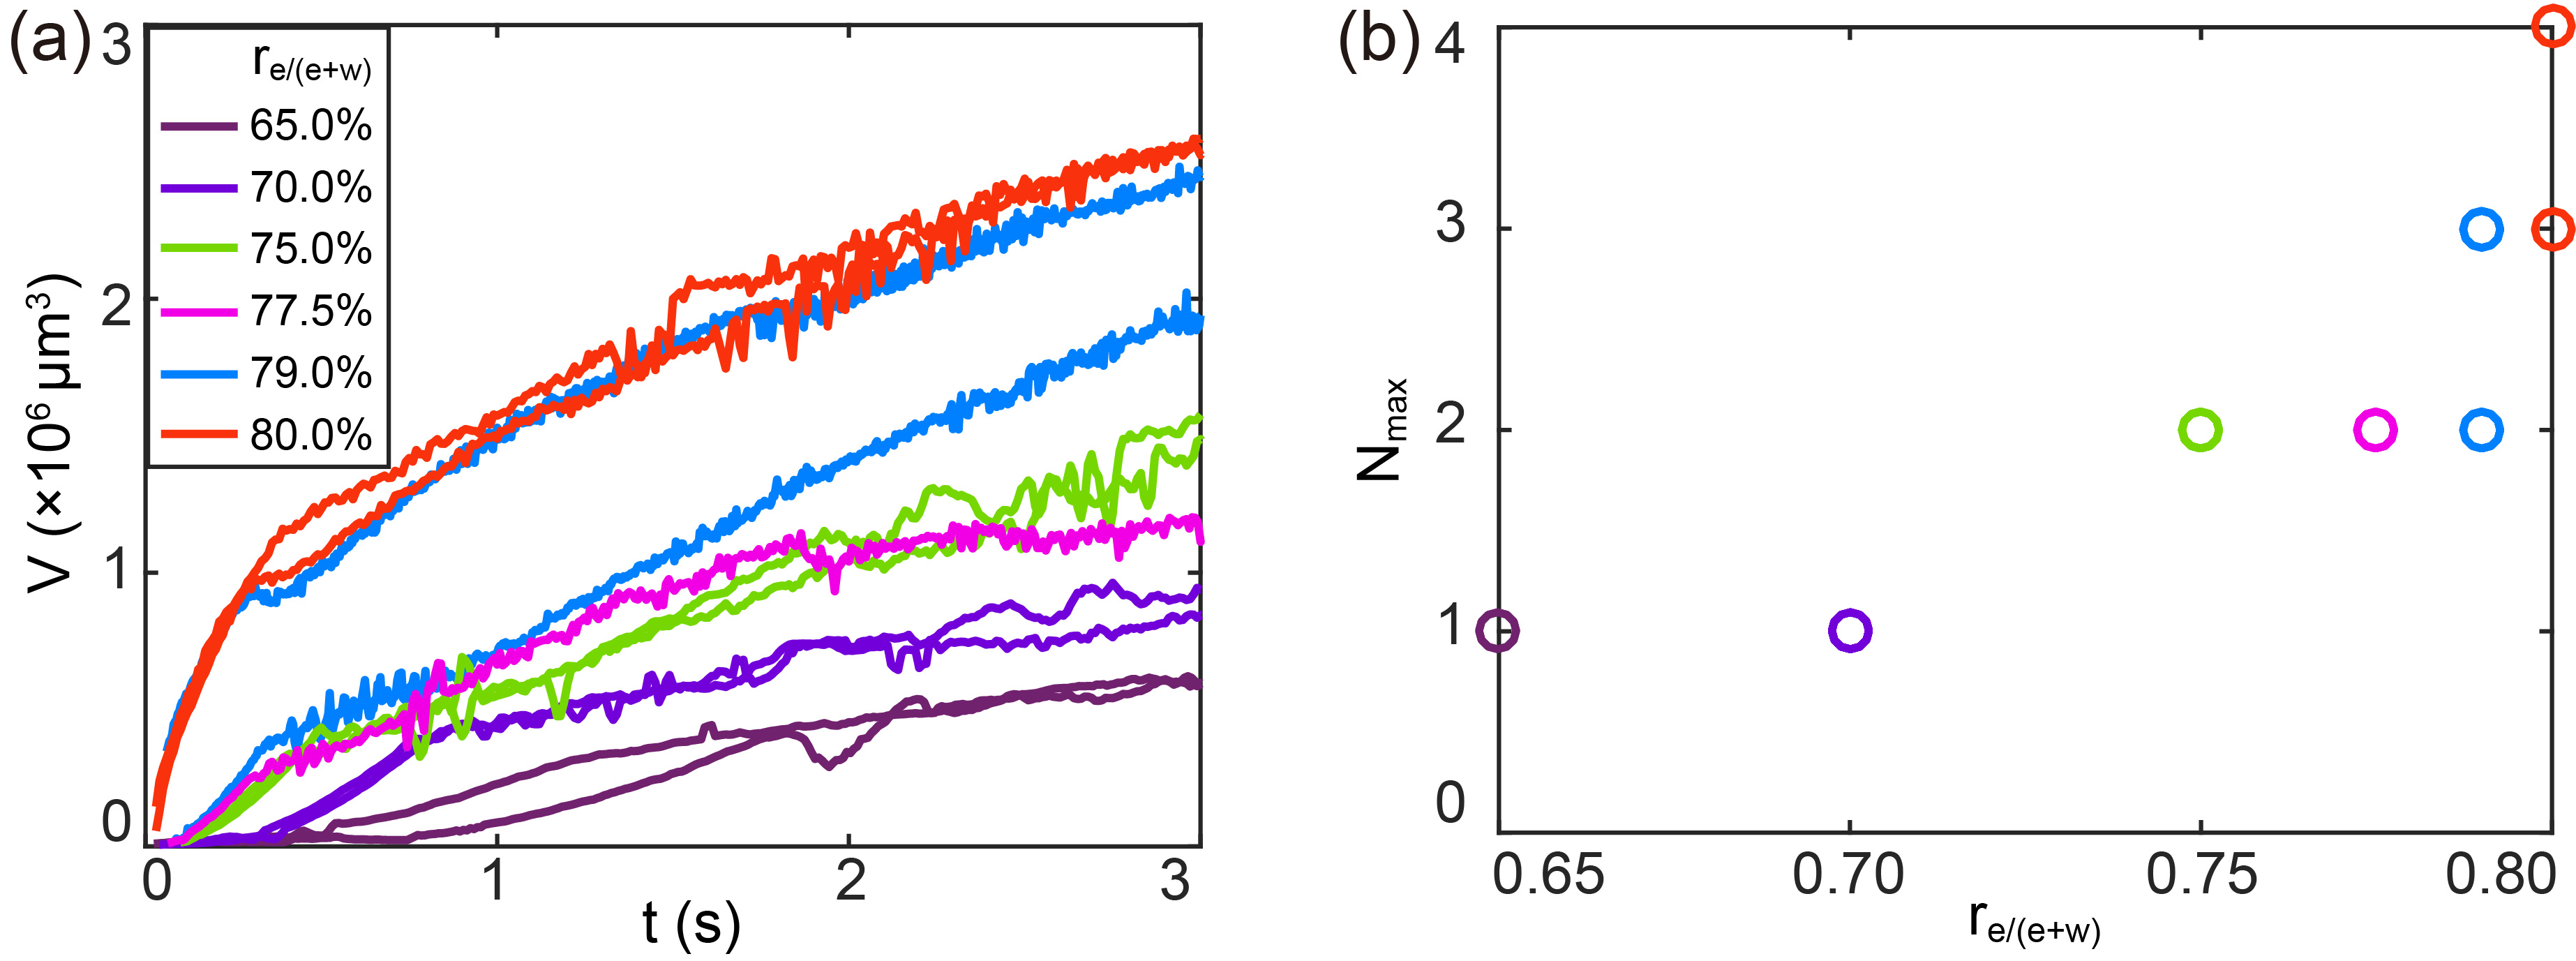
We note that the two curves at deviate from each other in Figure 4a. We believe that this is due to the fact that is close to the critical ethanol fraction (77.5-80.0) at which the transition from depinning (at ) to pinning (, see Figure 3c) of the plasmonic bubble to the laser spot occurs. For a high ethanol ratio , the bubble remains pinned to the laser spot region (Figure 3c), the position of which locates at the center of each image in Figure 3. As a result, one can barely see the lateral movement of the bubbles for . However, for a lower ethanol ratio , bubbles are not pinned at the laser spot (see Figures 3a and b). They could move away from the laser spot region. The laser spot has a Gaussian power density distribution, so the further the bubbles are located away from the laser spot center, the weaker the heating efficiency as well as the vaporization rate. As a result, apart from the dependence on the ethanol ratio , the growth rate of those bubbles that are depinned from the laser region is even smaller.
The mechanism of the droplet nucleation in experiments can be explained as follows. Under continuous laser heating the volatile ethanol in ternary liquids vaporizes into the bubble. Consequently, the liquid in the region near the bubble interface becomes ethanol depleted, and an ethanol concentration gradient emerges. The reduction of ethanol in the initially equilibrated ternary liquid leads to the oversaturation of the left-behind liquid with the anethole oil, and eventually to the nucleation of oil microdroplets (the so-called ouzo effect). However, the reason why the symmetry of oil droplet distribution around the bubble breaks and how the droplet plumes form remains to be explained, and we will do so below.
IV Comparison of plume formation around growing plasmonic bubbles in binary and in ternary liquids
To demonstrate that the oil droplets do not change the essence of the overall flow dynamics and to provide a comparison of the cases with and without oil microdroplet nucleation, we performed another experiment in a binary liquid of ethanol and trans-anethol oil, which are fully miscible. We observed a similar plume phenomenon, as shown in Figures 5a and b. Ethanol and anethol oil can be mixed in any ratio. During bubble growth under laser heating, it is ethanol which preferably vaporizes, due to the ethanol low boiling point. As a result, a concentration gradient of anethol oil in the vicinity of the laser irradiated area will form and can be visualized because of the different refractive index of ethanol and oil.
Figures 5a and b show the plasmonic bubble growth in ethanol anethol mixtures with ethanol ratio and 80%, respectively. It can be seen that during bubble growth, plumes are generated in the ethanol anethol oil mixtures, and the maximum plume number increases with increasing ethanol ratio. This verifies that the plumes can be formed regardless of the droplet nucleation.
For the droplet plumes in ternary liquids of ethanol, water and trans-anethol, the hydrodynamics of the plumes is coupled with the droplet nucleation. We note that there are certain quantitative differences between the experiments in ternary liquids (Figure 3) and in binary liquids (Figure 5). This might be attributed to the influence of phase nucleation in the ternary liquids, in which an energy barrier must be surmounted to bring the system in visible stable phase transition. Moreover, the phase nucleation process is controlled by thermal fluctuations and affected by the defects of wall or impurities in liquids, leading to the stochastic properties of droplet nucleation with ternary liquids. However, a quantitative analysis of these differences is beyond the scope of this study.
V Numerical simulations of the plasmonic bubble in an ethanol-water mixture
V.1 Underlying equations and control parameters
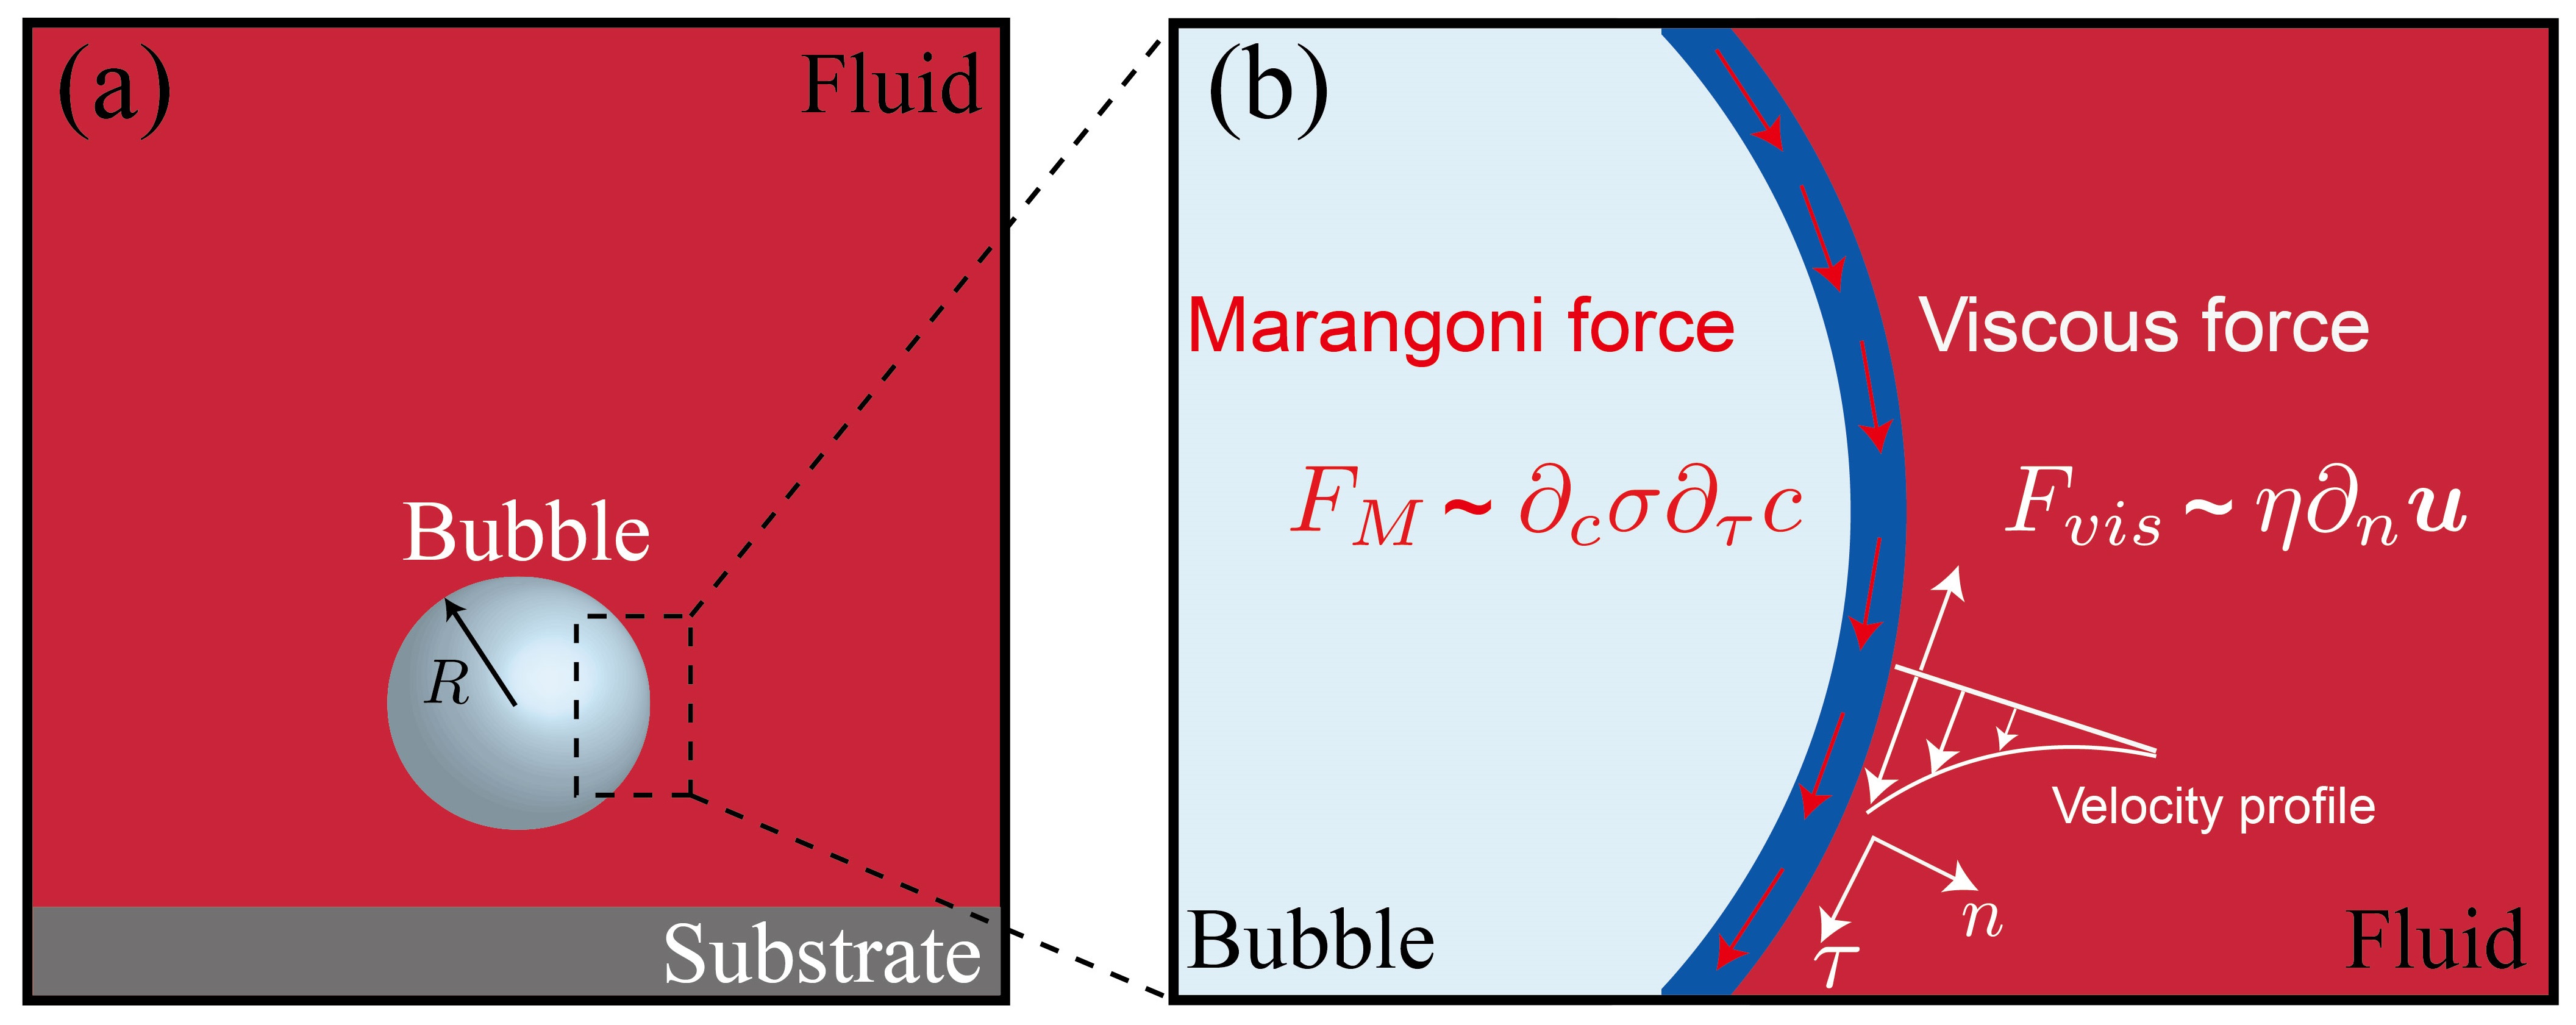
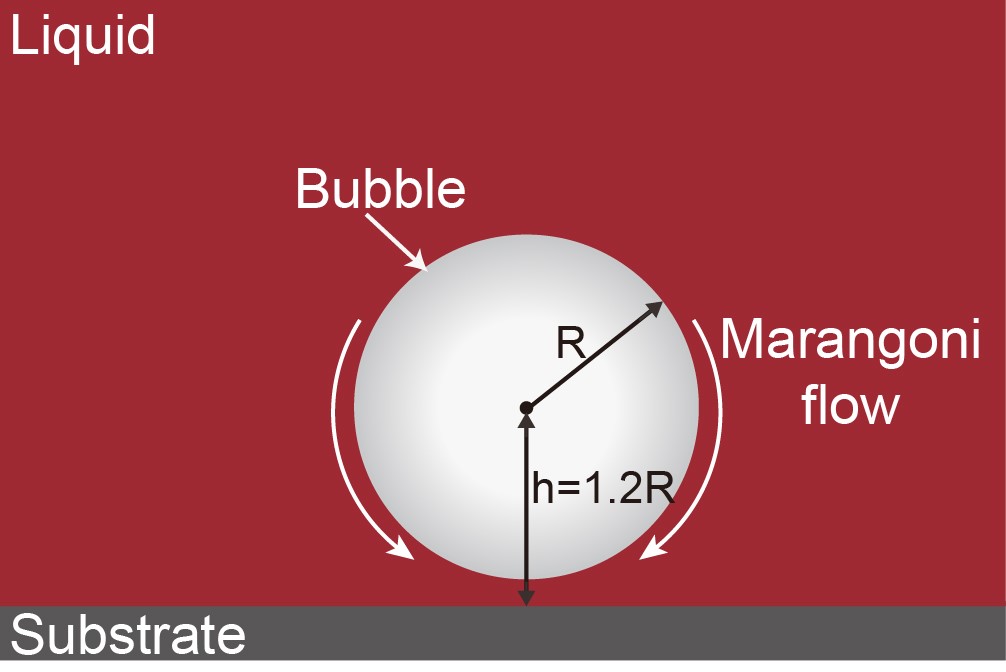
To confirm the outlined physical picture, we numerically investigate the vaporization and plume formation during plasmonic bubble growth. Since the ratio of anethole oil in the ternary liquid is very low and the boiling point of anethole oil (234 ∘C) is much higher than that of water and ethanol, it hardly vaporizes during the experiments. Therefore, to reduce the complexity of the numerical model, we only consider water and ethanol. The physical variables to describe the system are thus the concentration of ethanol and the velocity of the fluid . A bubble of radius immersed in the ethanol-water mixture is fixed near the bottom wall (Figure 6a). Under laser irradiation, the bubble takes up ethanol vapor with a constant rate from the fluid at the bubble surface:
| (1) |
where is the diffusion coefficient of ethanol, and is the concentration gradient in normal direction. The ethanol concentration difference along the bubble surface will lead to a surface tension difference, and induce a Marangoni flow. The solutal Marangoni flow is accounted for by balancing the surface tension difference with the viscous force at the interface (Figure 6b) sternling1959 :
| (2) |
where is the surface tension, represents the derivative of the surface tension with respect to the concentration, is the tangential concentration gradient, is the dynamic viscosity, and is the normal gradient of the velocity.
We non-dimensionalize the velocities, lengths, and concentrations with , , and , respectively. The time evolution of the concentration field and the velocity field are obtained by the Navier-Stokes equation and the advection-diffusion equation:
| (3) |
| (4) |
where and are Schmidt number and Marangoni number, respectively. The Schmidt number is the ratio between the kinematic viscosity to the diffusion coefficient ,
| (5) |
The Marangoni number is the ratio between Marangoni flow induced advection and diffusion, reflecting the strength of the Marangoni force:
| (6) |
In the numerical simulation, we solve the non-dimensional form of the governing Eqs. (3) and (4) and boundary conditions (Eqs. (1) and (2)). The kinematic viscosity of ethanol-water mixture is and the diffusion coefficient of ethanol in water is 10-9 m2/s tan2016pnas ; hills2011 . Accordingly, the Schmidt number is taken as 2220 in the simulation. was varied from to . For details regarding the numerical simulations we refer to the Appendix A.
V.2 Numerical results
The simulation results for the ethanol water system with different values of are shown in Figure 7. It is found that the ethanol concentration field remains perfectly symmetric for (Figure 7a I-III). For , the symmetry of the ethanol concentration breaks and a single plume of ethanol poor liquid is emitted (Figure 7b). For , multiple plumes are emitted (Figure 7c II, d II and e II). The maximum number of the emitted plumes increases with increasing . Moreover, multiple plumes subsequently merge (Figure 7c III, d III and e III), which is consistent with our experimental observations.
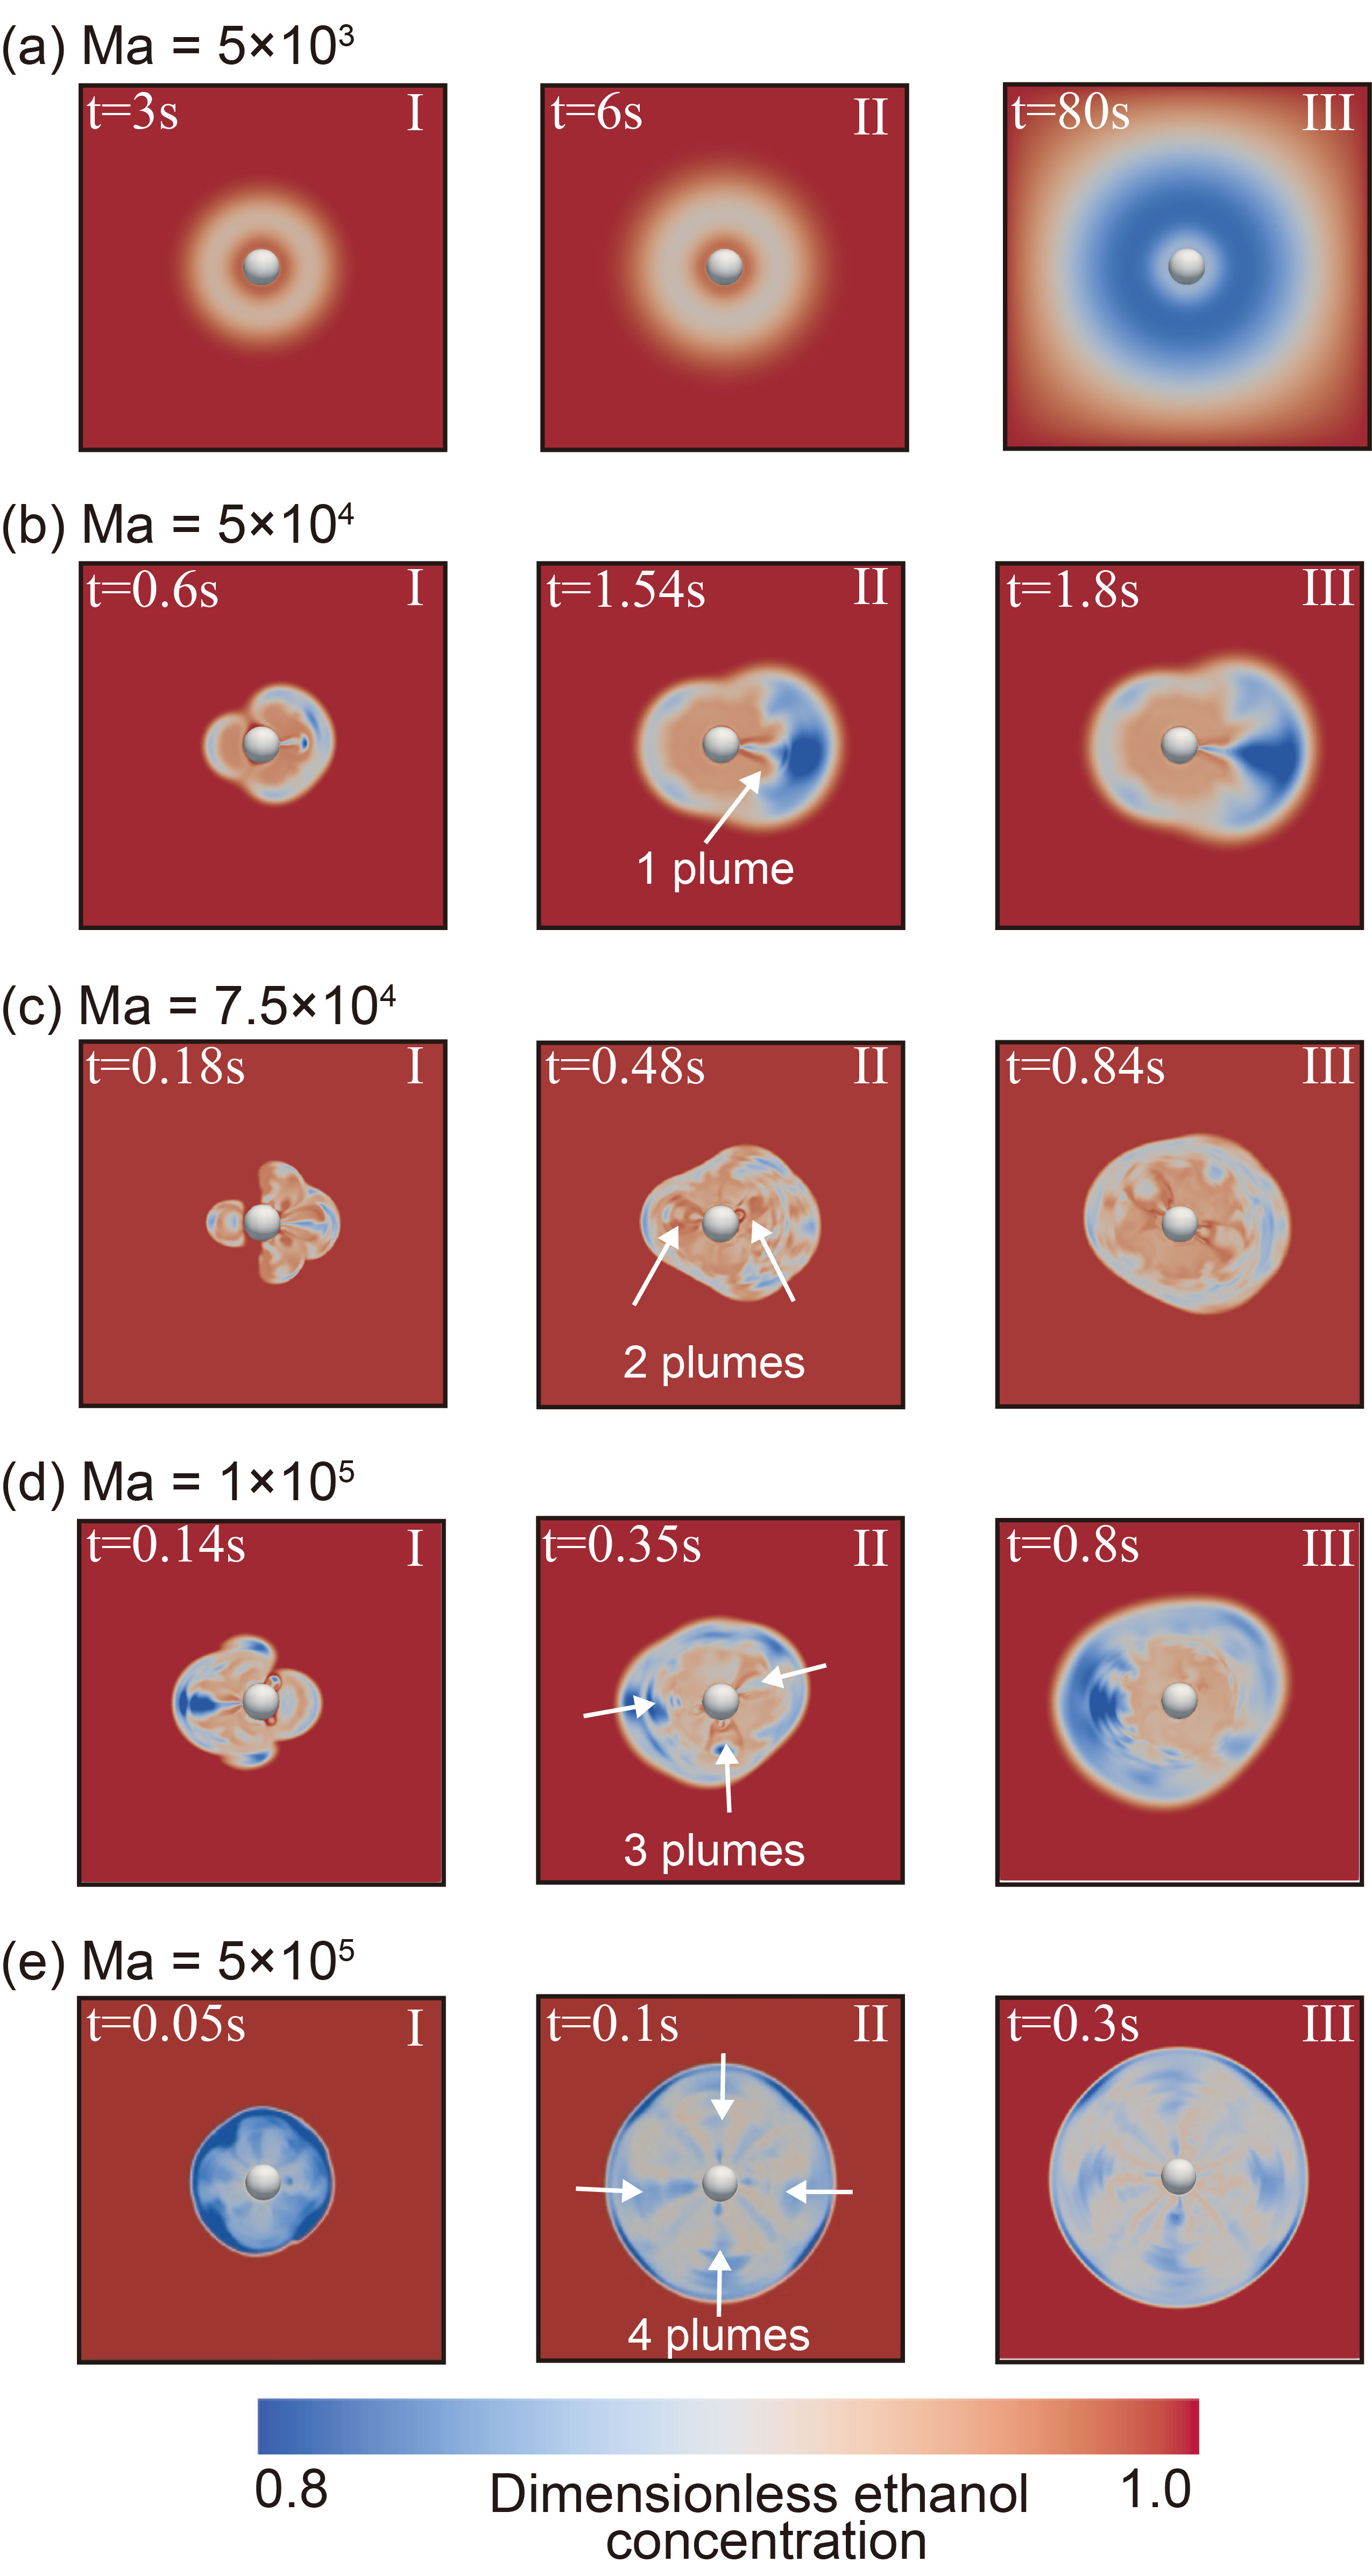
The numerical results clearly show that the formation of plumes is directly related to the Marangoni number . At low Marangoni number , the diffusion process dominates and thus any sharp concentration gradient can be smoothed out by the diffusive process. Therefore, the ethanol concentration field remains symmetric. For above a certain value, the symmetry of ethanol concentration spontaneously breaks and concentration plumes are formed.
A similar phenomenon of symmetry breaking is observed in the case of catalytic particles with diffusio-phoretic effects. Michelin et al. Michelin2013 demonstrates that when the Péclet number (characterizes the ratio between advection led by diffusio-phoresis and mass diffusion) is above a certain value, the particle will break the symmetry spontaneously. Chen et al. yibo2020 further explored catalytic particles at high Péclet number. They found that multiple plumes are generated at the surface of the particle and the number of plumes increase with increasing Péclet number. The system studied here share similarities with the diffusio-phoretic problem in their symmetry-breaking mechanism and the plume emission at the surface. However, the two systems are different, namely in refs. Michelin2013 ; yibo2020 it is the diffusio-phoretic flow at the surface which drives the particle, whereas here it is the Marangoni flow due to the gradient in surface tension.
VI Quantitative comparison between numerical and experimental results
To more quantitatively compare our numerical results with the experimental data, we estimated the Marangoni number in our experiments with the definition of Eq. (6). In the experiments, the bubble radii kept changing with time. In order to compare with the numerical results, we take the radius of the bubble at the moment when pronounced plume formation in the experiments is observed to calculate . As mentioned earlier, we ignored the presence of trans-anethole oil as its relative concentration is very low. The term is estimated to be 1.7 10-5 Nm2/kg from the surface tension curves (Appendix B). To estimate the mass transfer rate , we assume that the bubble growth is dominated by ethanol evaporation. is defined as , where is the consumption rate of ethanol and is the area of bubble surface where the mass transfer takes place. The consumption rate = d()/d, where = 46 Kg/mol is the mole weight of ethanol, is the amount of ethanol molecules in mole, the temperature 353 K (boiling temperature), the ambient pressure and the ideal gas constant. The consumption rate can be obtained by extracting the bubble volume growth rate, i.e. d/d, from the curves shown in Figure 4a.
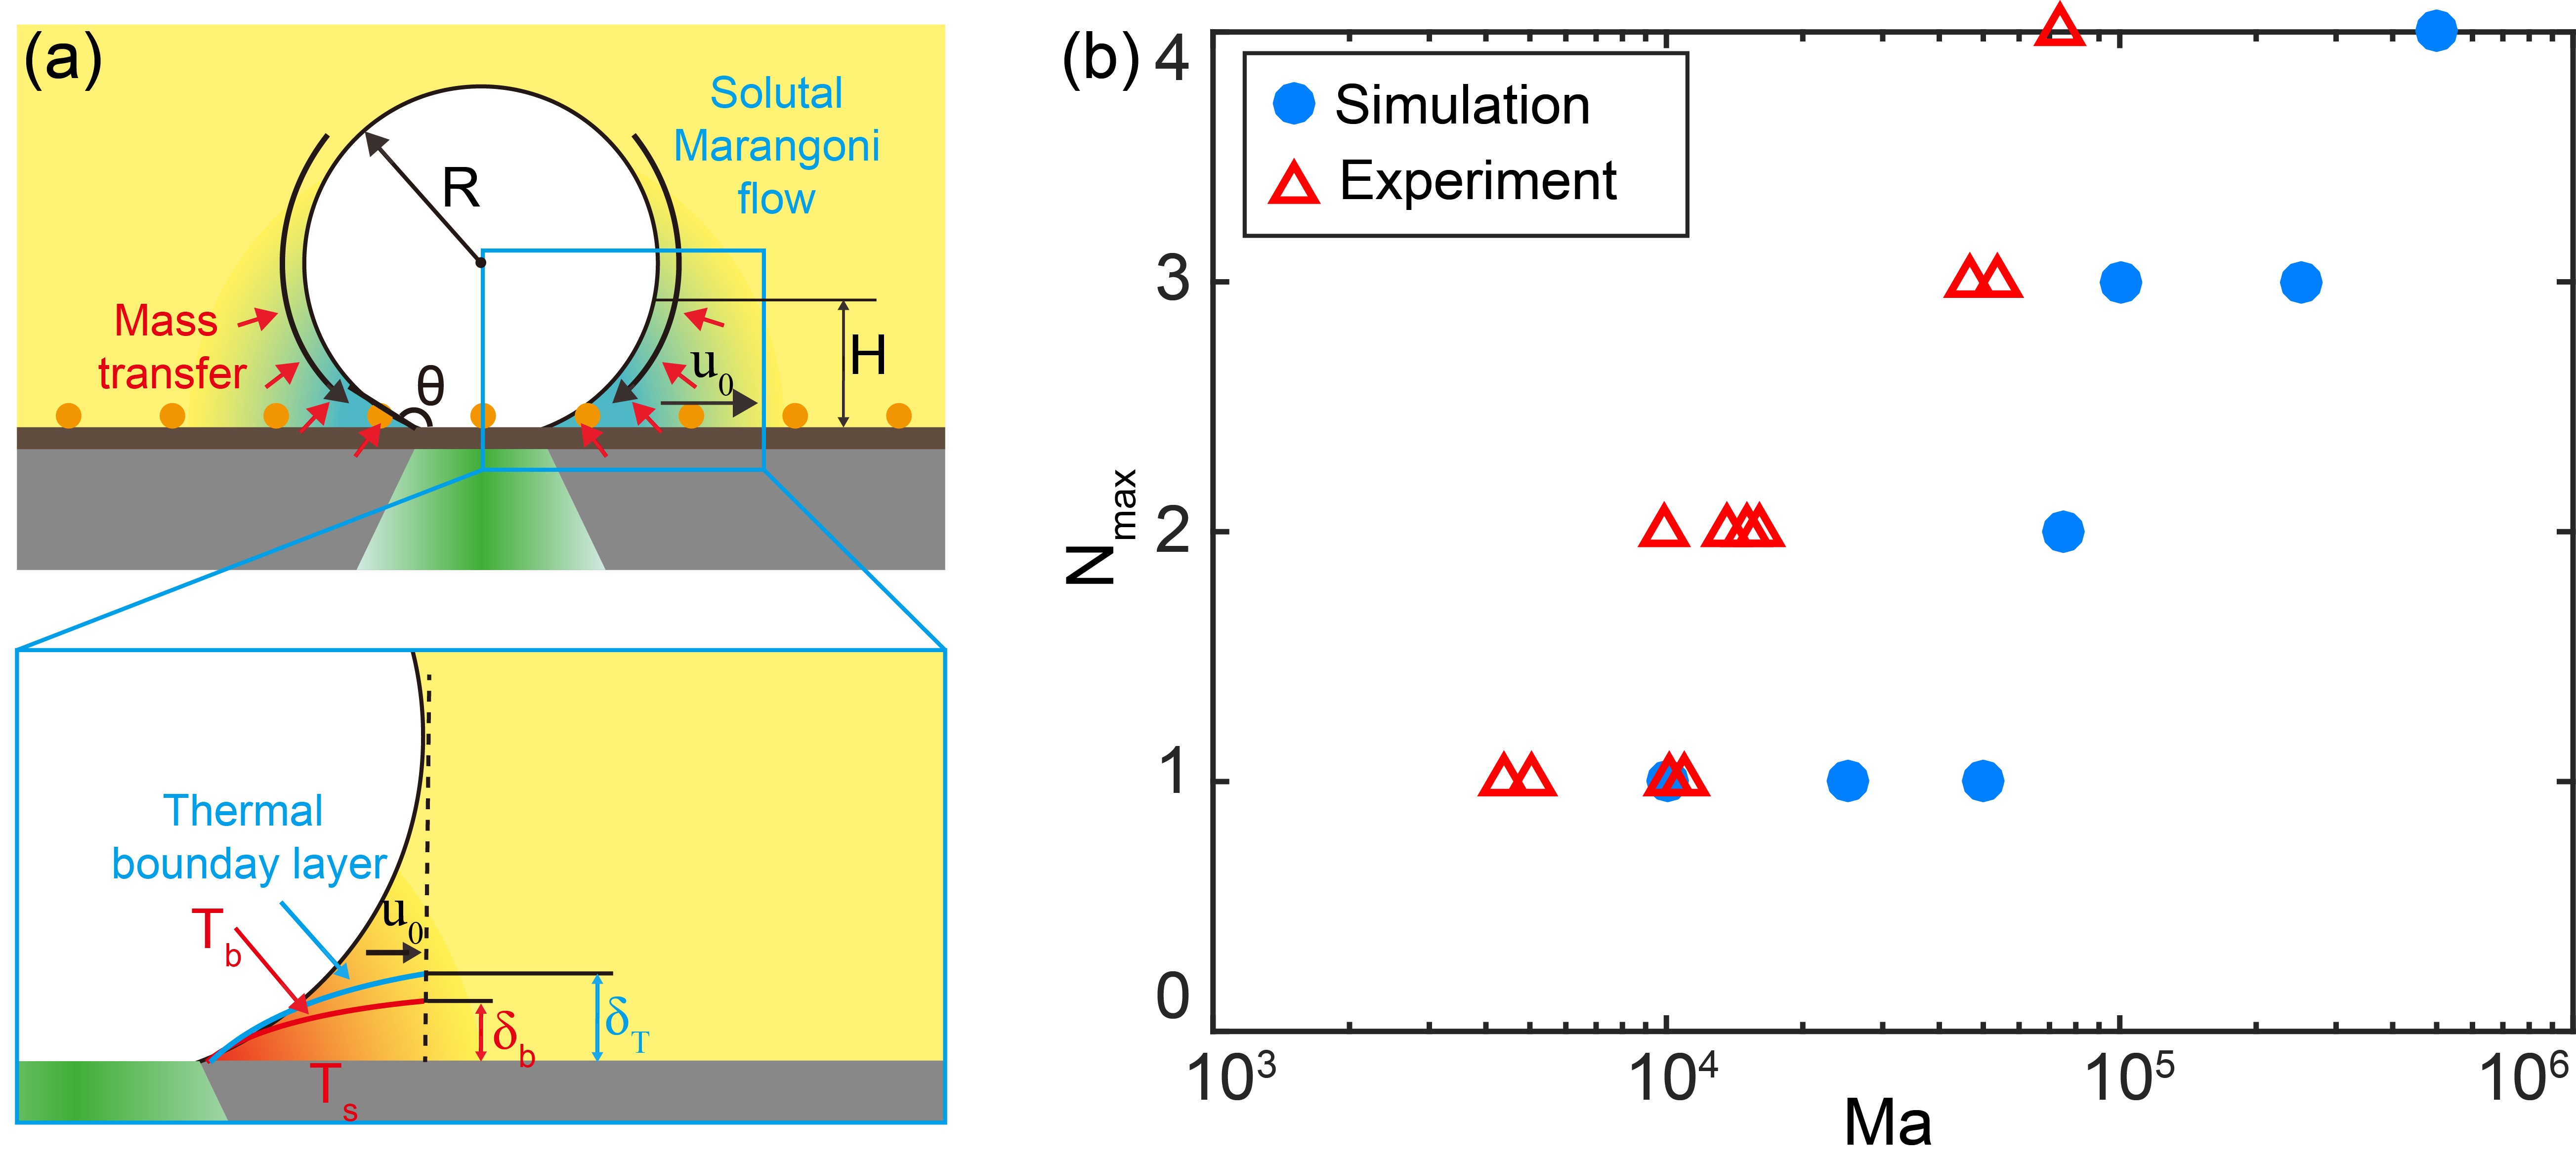
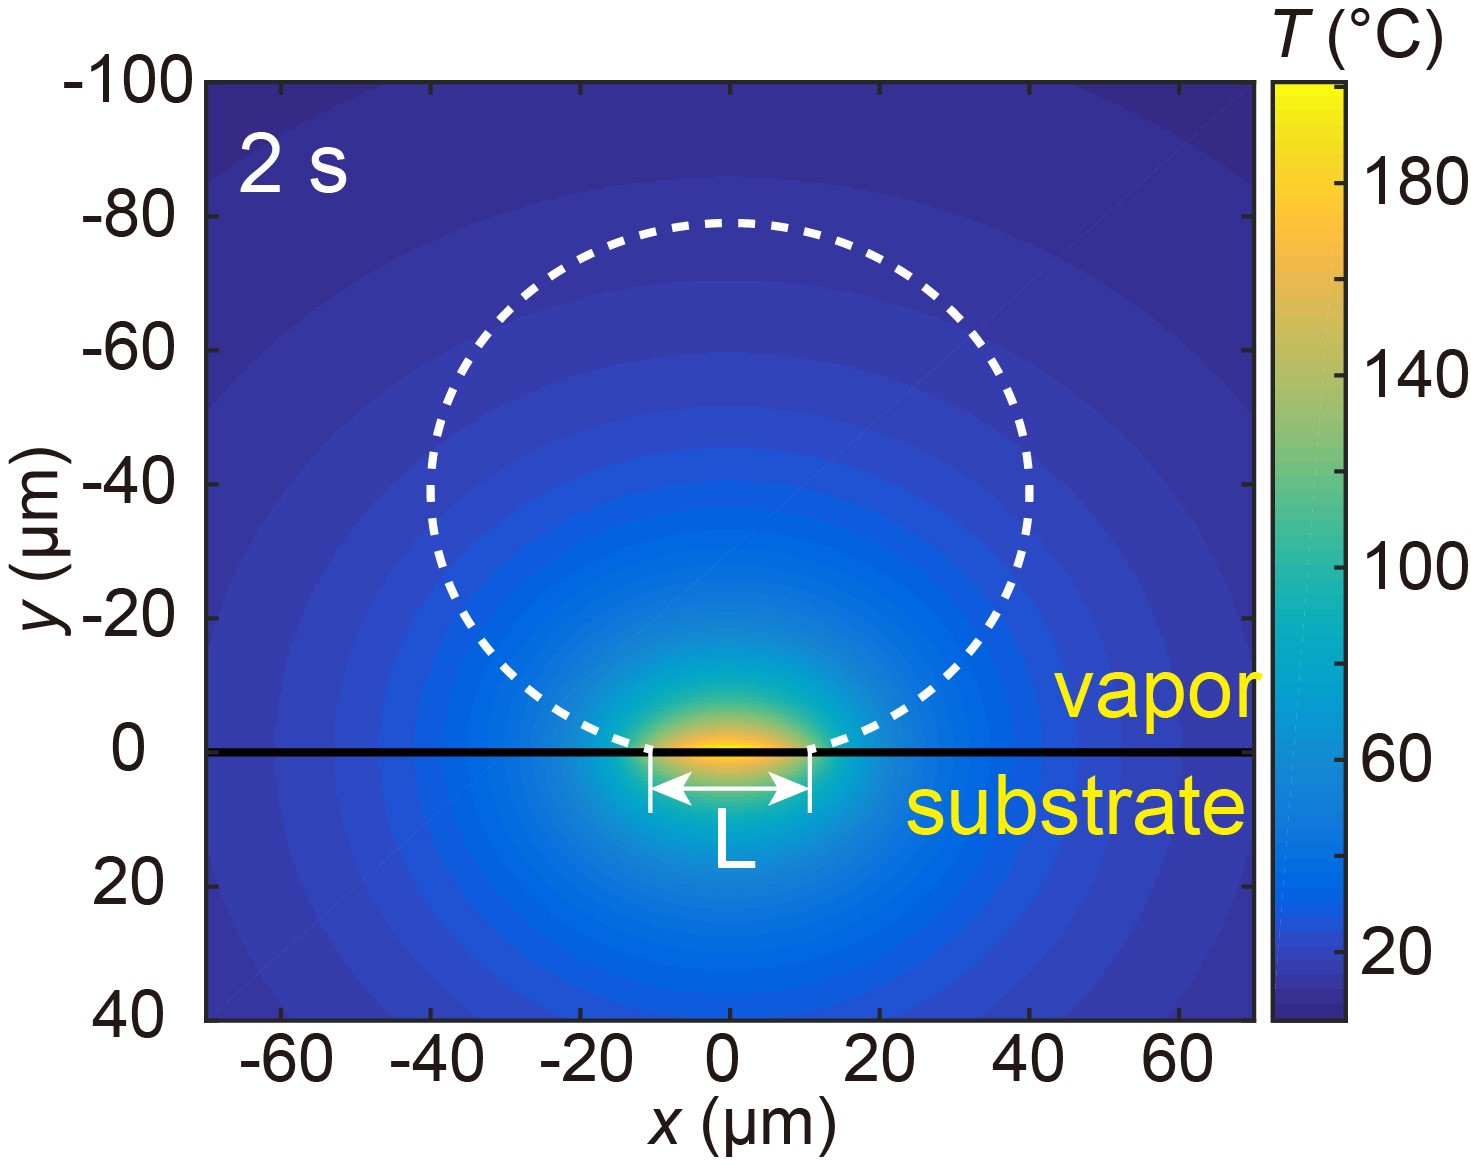
As depicted in Figure 8a, under laser irradiation, only the liquid in the vicinity of the three-phase contact line is heated up to the boiling temperature, resulting in the vaporization of ethanol. Therefore, here we take as the bubble surface area for mass transfer. In order to obtain the height , we determine the width of the thermal boundary layer. As shown in Figure 8a, there is a downward solutal Marangoni flow along the bubble interface and therefore an outward flow along the substrate due to the selective vaporization of ethanol. This flow can be observed from side view images and the flow velocity m/s is obtained by particle image velocity measurement. The thermal boundary layer (the blue curve of the zoom in image in Figure 8a) is given by schlichting1961 . In this expression, the velocity boundary layer is given by , the Reynolds number , the kinematic viscosity m2/s and is the lateral position. The Prandtl number , in which the thermal conductivity = 0.6 W/mK. The heat capacity of the liquid JkgK-1.
Room temperature (20 ∘C) is taken as for the region outside the thermal boundary layer (the blue curve in Figure 8a). The substrate temperature is estimated by our numerical simulation by assuming that the substrate is completely covered by vapor. The heat conductivity of the fused silica substrate was taken as 1.4 W/mK (0-20 ∘C). The details of the numerical simulation method can be found in our recent publicationwang2018 . Using this method, the spatial-temporal evolution of the substrate temperature can be obtained. The temperature field after 2 s of laser irradiation is shown in Figure 12 of (Appendix C). The temperature of the substrate at the three phase contact line is used to determine the thickness of the thermal boundary layer. From the simulation results we obtain a substrate temperature 96 ∘C. By assuming that temperature linearly decreases from the substrate to the blue curve (Figure 8a), the liquid region () having a temperature above the saturation temperature of ethanol water mixture (about 80 ∘C) can be obtained. Our calculation reveals that is about 10 m at m.
The number of plumes as a function of extracted from the experimental data and the numerical simulations is shown in Figure 8b. The numerical and experimental results have the same trend and agree qualitatively well, albeit for a fixed number of plumes the Marangoni number in the simulations is slightly larger than that in the experiments. We believe that this is due to underestimating and the mass transfer rate in the experimental estimation of . Our arguments for this are twofold: First, the surface tension gradient was calculated for the initial ethanol concentration. However, the actual ethanol concentration in the boundary layer is much lower than the initial value because of the selective vaporization of ethanol. Since the surface tension of the ethanol-water mixtures changes more rapidly at lower ethanol concentrations than at larger one, the actual value of is larger than that of the initial value. Second, the ethanol consumption rate was obtained assuming that the substrate is completely covered by vapor. Under this assumption, the substrate temperature, as well as the thermal boundary layer is determined. However, as depicted in the sketch of Figure 8a, part of the substrate is in contact with the liquid outside the pinned bubble footprint area. As the liquid has a higher heat conductivity than vapor, the actual temperature of the substrate must be lower than what we have used in our numerical simulation. The overestimation of the substrate temperature leads to a larger boundary layer and therefore a smaller . These two effects both contribute to the underestimation of the Marangoni numbers from experiments. Nonetheless, it is clear that the numerical results qualitatively agree well with the experimental ones.
VII Conclusions
To summarize, we have experimentally presented the emulsification of oil droplets induced by plasmonic bubble nucleation in ternary liquids of ethanol-water-anethole. It has been shown that anethole oil microdroplets nucleate around the bubble due to the selective vaporization of ethanol. The oil microdroplets then form droplet plumes. When the ethanol-water relative weight ratio increases from 65.0% to 80.0% in the ternary liquids, plasmonic bubbles grow faster and more droplet plumes are emitted. A quantitative understanding on the plume formation is achieved by a numerical study, which shows that the ethanol concentration field can only remain symmetric for a Marangoni number (diffusion dominated). Above a critical value of , a symmetry breaking of the ethanol concentration field takes place, leading to the formation of droplet plumes. The revealed dependence of the maximum plume numbers in the numerical results agrees with that in experiments.
This work has given insight into the rich phenomena of plasmonic bubble induced oil microdroplet nucleation (ouzo effect) in ternary liquids and the self-organization of these microdroplets. The quantitative understanding on plume formation offers valuable information for tuning and optimizing the flow field of multiple component liquids in various physicochemical processes. E.g., systems with a high Marangoni number can lead to breaking of the symmetry of the concentration field, and the emerging convection flow may have the advantage of enhanced mixing of ternary liquids in chemical, pharmaceutical, and cosmetic industries.
Acknowledgements: The authors greatly appreciate the valuable discussions with Xuehua Zhang. We also thank the Dutch Organization for Research (NWO), The Netherlands Center for Multiscale Catalytic Energy Conversion (MCEC), ERC (via Advanced Grant DDD, Project 740479), and the Chinese Scholarship Council (CSC) for the financial support. Y.W. acknowledges the financial support from NSFC (Grants 51775028 and 52075029) and Beijing Youth Talent Support Program.
Appendix A Details on the numerical model
The simulation was conducted in a three dimensional domain with grids. A bubble with a radius is fixed at a distance above the middle of the bottom wall (Figure 9).
In non-dimensional form the boundary conditions (Eqs. (1) and (2)) read:
| (7) |
The governing equations of the flow field were the Navier-Stokes and diffusion-convection equations Eqs. (1) and (2). The equations were spatially discretized using the central second-order finite difference scheme. Along both horizontal and vertical directions, homogenous staggered grids were used. The equations were integrated by a fractional-step method with the non-linear terms computed explicitly by a low-storage third-order Runge-Kutta scheme and the viscous terms computed implicitly by a Crank-Nicolson schemeverzicco1996 . To satisfy the concentration and velocity boundary conditions at the bubble surface, we applied the moving least square (MLS) based immersed boundary (IB) method, where the particle interface was represented by a triangulated Lagrangian mesh. The details of our MLS-based IB method are documented in Spandan et alspandan2017 . Schematic of Figure 10 illustrates the immersed boundary method with staggered grids. For clarity, we use two-dimensional grids in Figure 10 although the simulation is done in three dimensions. The Lagrangian points are denoted as red circle at the boundary (red curve), and the Eulerian points by the squares. A staggered mesh was applied to increase the accuracy. Therefore, the velocity points and concentration/pressure points are at different locations denoted by squares of different colors.
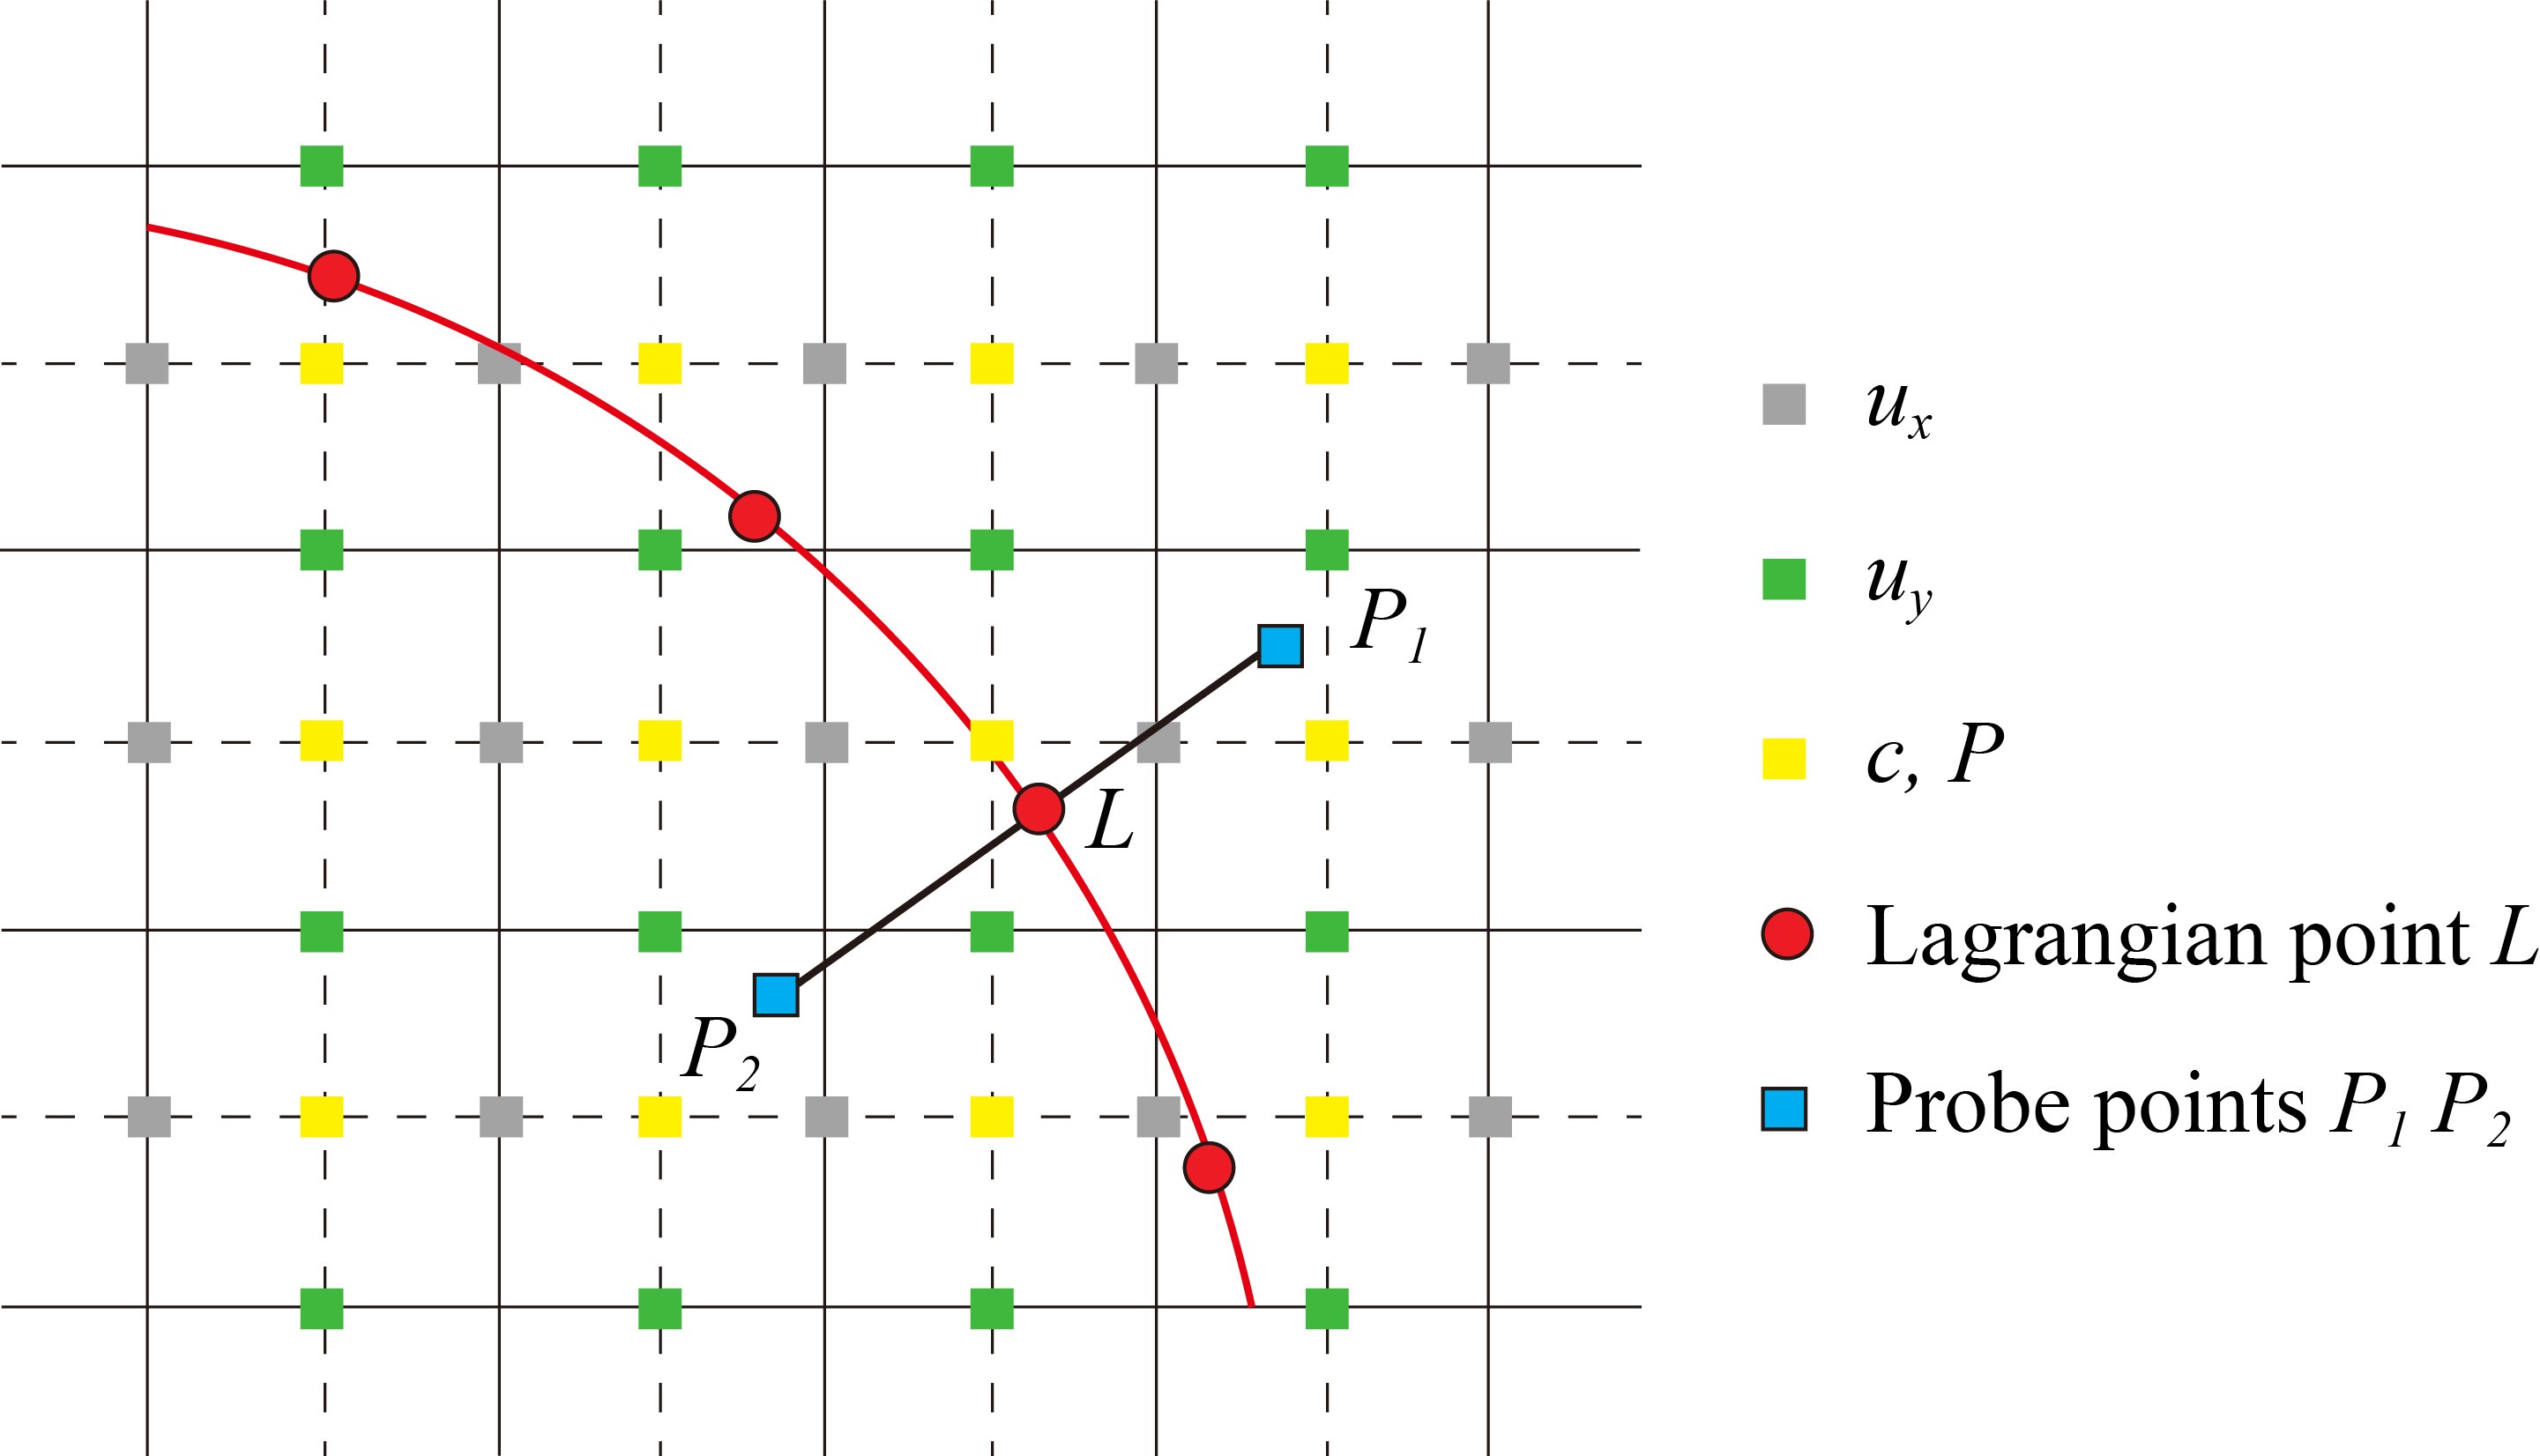
In the simulation, the concentration boundary condition (Eq. (7)a) is satisfied by enforcing the concentration at the inner probe point (point in Figure 10) based on concentration interpolated at the probe located at a short distance (1 grid size h) from the surface of the particle (point in Figure 10):
| (8) |
The surface gradient of the concentration in the velocity boundary condition (Eq. (7)b) was calculated by the nearby Lagrangian concentration. The velocity boundary condition at the surface of the particle (point in Figure 10) was then enforced based on the velocity interpolated at the probe located at a short distance (1 grid size) from the surface of the particle (point in Figure 10):
| (9) |
Appendix B Surface tension of ethanol-water mixtures
Figure 11 shows the surface tensions of the ethanol-water binary liquid with ethanol weight ratio from 0 to 1 at 20 ∘C, at 50 ∘C, and at boiling temperature (which depends on ). For each of the three curves, the surface tension of the binary liquid decreases with the ethanol ratio . It is also seen that changes rapidly for small ethanol fractions and more slowly for larger ethanol fractions. The surface tensions for = 67.5 and = 80 are shown in Table 2.
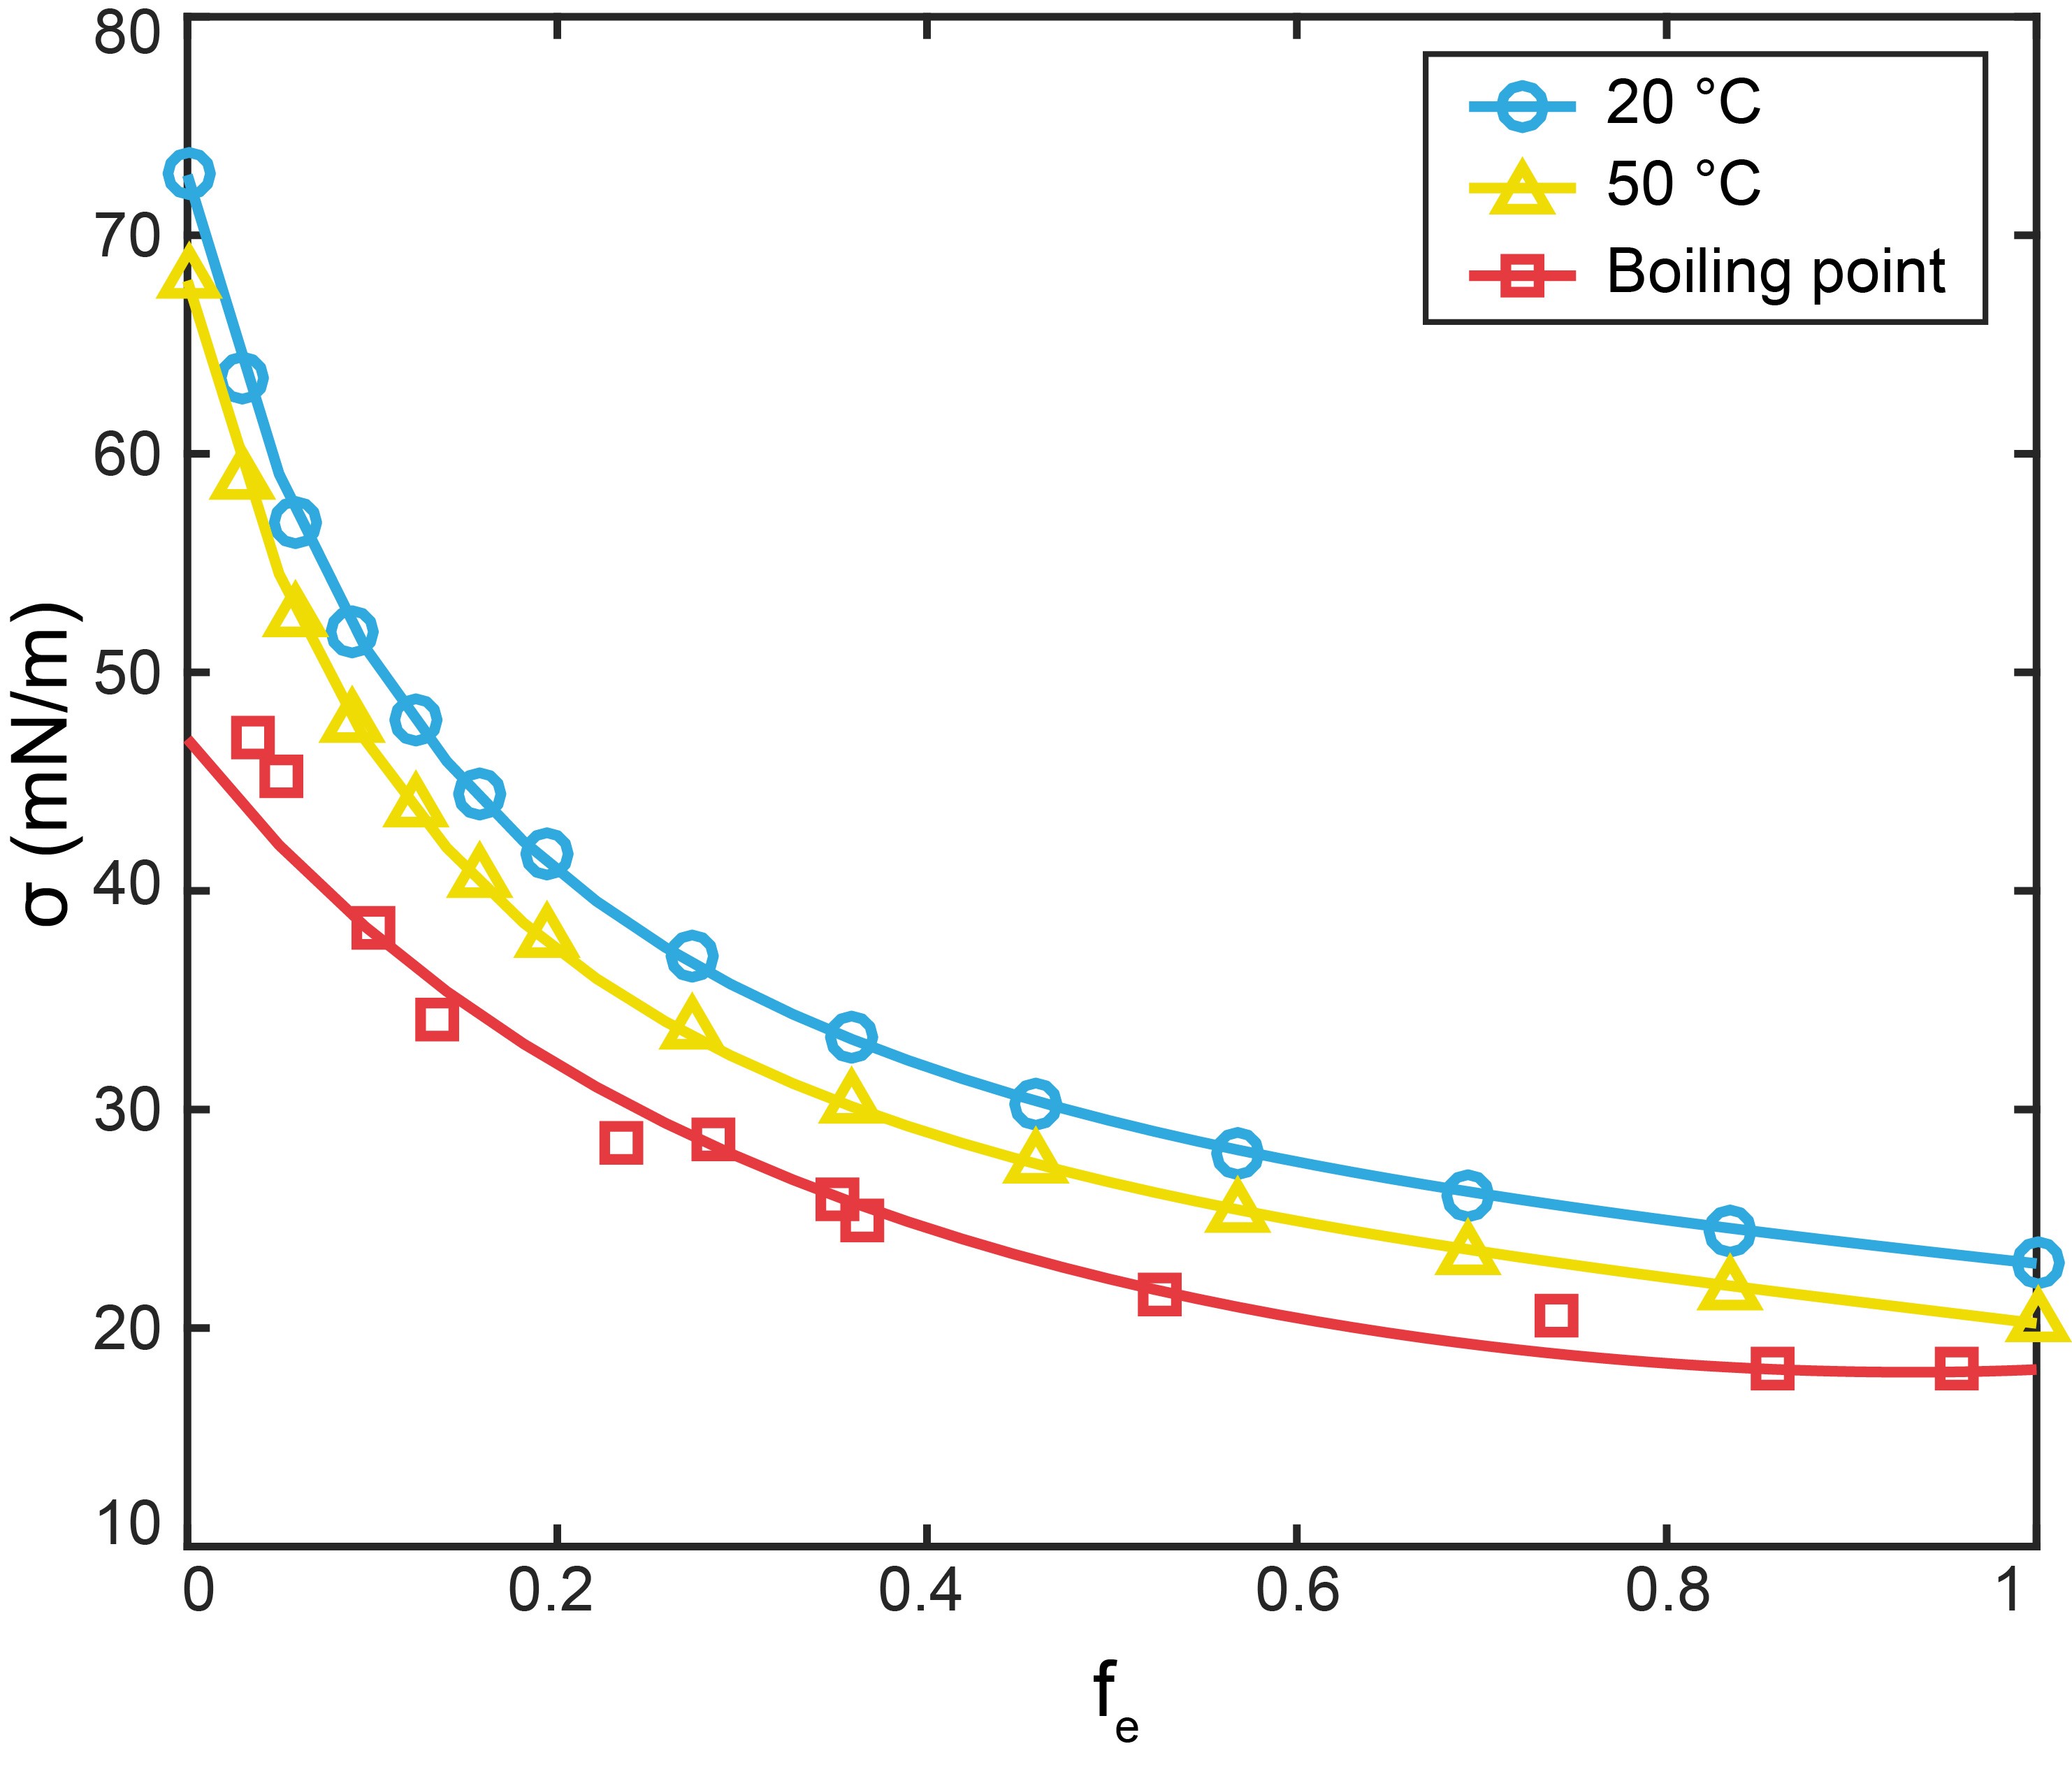
| Temperature | , mN/m | , mN/m |
|---|---|---|
| 20 ∘C | 26.46 | 24.94 |
| 50 ∘C | 23.8 | 22.31 |
| Boiling point | 19.46 | 18.39 |
Appendix C Numerical calculated temperature field of the substrate
References
- (1) H.-L. Liu, C.-H. Fan, C.-Y. Ting, and C.-K. Yeh, Combining microbubbles and ultrasound for drug delivery to brain tumors: current progress and overview, Theranostics 4, 432 (2014).
- (2) Q. Fan, W. Hu, and A. T. Ohta, Laser-induced microbubble poration of localized single cells, Lab Chip 14, 1572 (2014).
- (3) J. Shao, M. Xuan, L. Dai, T. Si, J. Li, and Q. He, Near-infrared-activated nanocalorifiers in microcapsules: vapor bubble generation for in vivo enhanced cancer therapy, Angew. Chem., Int. Ed. 54, 12782 (2015).
- (4) S. Y. Emelianov, P.-C. Li, and M. O’Donnell, Photoacoustics for molecular imaging and therapy, Phys. Today 62, 34 (2009).
- (5) D. Lapotko, Plasmonic nanoparticle-generated photothermal bubbles and their biomedical applications, Nanomedicine 4, 813 (2009).
- (6) C. Zhao, Y. Xie, Z. Mao, Y. Zhao, J. Rufo, S. Yang, F. Guo, J. D. Mai, and T. J. Huang, Theory and experiment on particle trapping and manipulation via optothermally generated bubbles, Lab Chip 14, 384 (2014).
- (7) Y. Xie and C. Zhao, An optothermally generated surface bubble and its applications, Nanoscale 9, 6622 (2017).
- (8) F. Tantussi, G. C. Messina, R. Capozza, M. Dipalo, L. Lovato, and F. A. De, Long-range capture and delivery of water-dispersed nano-objects by microbubbles generated on 3D plasmonic surfaces., Acs Nano 12, 4116 (2018).
- (9) J. R. Adleman, D. A. Boyd, D. G. Goodwin, and D. Psaltis, Heterogenous catalysis mediated by plasmon heating, Nano Lett. 9, 4417 (2009).
- (10) G. Baffou and R. Quidant, Nanoplasmonics for chemistry, Chem. Soc. Rev. 43, 3898 (2014).
- (11) J. Lombard, T. Biben, and S. Merabia, Kinetics of nanobubble generation around overheated nanoparticles, Phys. Rev. Lett. 112, 105701 (2014).
- (12) J. Lombard, T. Biben, and S. Merabia, Nanobubbles around plasmonic nanoparticles: Thermodynamic analysis, Phys. Rev. E 91, 043007 (2015).
- (13) S. Maheshwari, M. van der Hoef, A. Prosperetti, and D. Lohse, Dynamics of formation of a vapor nanobubble around a heated nanoparticle, J. Phys. Chem. C 122, 20571 (2018).
- (14) J. Lombard, T. Biben, and S. Merabia, Ballistic heat transport in laser generated nano-bubbles, Nanoscale 8, 14870 (2016).
- (15) Y. Wang, M. E. Zaytsev, G. Lajoinie, H. L. The, J. C. T. Eijkel, A. van den Berg, M. Versluis, B. M. Weckhuysen, X. Zhang, H. J. W. Zandvliet, and D. Lohse, Giant and explosive plasmonic bubbles by delayed nucleation, Proc. Natl. Acad. Sci. U.S.A. 115, 7676 (2018).
- (16) T. Jollans and M. Orrit, Explosive, oscillatory, and Leidenfrost boiling at the nanoscale, Phys. Rev. E 99, 063110 (2019).
- (17) L. Hou, M. Yorulmaz, N. R. Verhart, and M. Orrit, Explosive formation and dynamics of vapor nanobubbles around a continuously heated gold nanosphere, New J. Phys. 17, 013050 (2015).
- (18) B. Zeng, Y. Wang, M. E. Zaytsev, C. Xia, H. J. Zandvliet, and D. Lohse, Giant plasmonic bubbles nucleation under different ambient pressures, Phys. Rev. E 102, 063109 (2020).
- (19) M. E. Zaytsev, Y. Wang, Y. Zhang, G. Lajoinie, X. Zhang, A. Prosperetti, H. J. W. Zandvliet, and D. Lohse, Gas-vapor interplay in plasmonic bubble shrinkage, J. Phys. Chem. C 124, 5861 (2020).
- (20) Y. Wang, M. E. Zaytsev, H. L. The, J. C. T. Eijkel, H. J. W. Zandvliet, X. Zhang, and D. Lohse, Vapor and gas-bubble growth dynamics around laser-irradiated, water-immersed plasmonic nanoparticles, ACS Nano 11, 2045 (2017).
- (21) X. Li, Y. Wang, M. E. Zaytsev, G. Lajoinie, H. L. The, J. G. Bomer, J. C. T. Eijkel, H. J. W. Zandvliet, X. Zhang, and D. Lohse, Plasmonic bubble nucleation and growth in water: effect of dissolved air, J. Phys. Chem. C 123, 23586 (2019).
- (22) G. Baffou, J. Polleux, H. Rigneault, and S. Monneret, Super-heating and micro-bubble generation around plasmonic nanoparticles under cw illumination, J. Phys. Chem. C 118, 4890 (2014).
- (23) M. E. Zaytsev, G. Lajoinie, Y. Wang, D. Lohse, H. J. W. Zandvliet, and X. Zhang, Plasmonic bubbles in n-alkanes, J. Phys. Chem. C 122, 28375 (2018).
- (24) V. G. Levich, Physicochemical hydrodynamics, Prentice-Hall Inc. (1962).
- (25) D. Lohse and X. Zhang, Physicochemical hydrodynamics of droplets out of equilibrium, Nat. Rev. Phys. 2, 426 (2020).
- (26) X. Li, Y. Wang, B. Zeng, M. Detert, A. Prosperetti, H. J. W. Zandvliet, and D. Lohse, Plasmonic Microbubble Dynamics in Binary Liquids, J. Phys. Chem. Lett. 11, 8631 (2020).
- (27) S. Vitale and J. Katz, Liquid droplet dispersions formed by homogeneous liquid-liquid nucleation: ”The ouzo effect”, Langmuir 19, 4105 (2003).
- (28) H. Tan, C. Diddens, P. Lv, J. G. M. Kuerten, X. Zhang, and D. Lohse, Evaporation-triggered microdroplet nucleation and the four life phases of an evaporating Ouzo drop, Proc. Natl. Acad. Sci. U. S. A. 113, 8642 (2016).
- (29) F. Ganachaud and J. Katz, Nanoparticles and nanocapsules created using the Ouzo effect: Spontaneous emulsification as an alternative to ultrasonic and high-shear devices, Chem. Phys. Chem. 6, 209 (2005).
- (30) H. Tan, C. Diddens, M. Versluis, H.-J. Butt, D. Lohse, and X. Zhang, Self-wrapping of an ouzo drop induced by evaporation on a superamphiphobic surface, Soft Matter 13, 2749 (2017).
- (31) H. Tan, C. Diddens, A. A. Mohammed, J. Li, M. Versluis, X. Zhang, and D. Lohse, Microdroplet nucleation by dissolution of a multicomponent drop in a host liquid, J. Fluid Mech. 870, 217 (2019).
- (32) D. Kashchiev, Nucleation (Elsevier, Oxford, 2000).
- (33) S. Ayuba, D. Suh, K. Nomura, T. Ebisuzaki, and K. Yasuoka, Kinetic analysis of homogeneous droplet nucleation using large-scale molecular dynamics simulations, J. Chem. Phys. 149, 044504 (2018).
- (34) H. Vehkamäki, Classical nucleation theory in multicomponent systems (Springer, Heidelberg, 2006).
- (35) C. Sternling and L. Scriven, Interfacial turbulence: hydrodynamic instability and the Marangoni effect, AIChE J. 5, 514 (1959).
- (36) E. E. Hills, M. H. Abraham, A. Hersey, and C. D. Bevan, Diffusion coefficients in ethanol and in water at 298 K: Linear free energy relationships, Fluid Phase Equilib. 303, 45 (2011).
- (37) S. Michelin, E. Lauga, and D. Bartolo, Spontaneous autophoretic motion of isotropic particles, Phys. Fluids 25, 061701 (2013).
- (38) Y. Chen, K. L. Chong, L. Liu, R. Verzicco, and D. Lohse, Instabilities driven by diffusio-phoretic flow on catalytic surfaces, J. Fluid Mech. in press, (2021).
- (39) H. Schlichting and J. Kestin, Boundary layer theory (Springer, New York: McGraw-Hill, 1961), Vol. 121.
- (40) R. Verzicco and P. Orlandi, A finite-difference scheme for three-dimensional incompressible flows in cylindrical coordinates, J. Comput. Phys. 123, 402 (1996).
- (41) V. Spandan, V. Meschini, R. Ostilla-Mónico, D. Lohse, G. Querzoli, M. D. de Tullio, and R. Verzicco, A parallel interaction potential approach coupled with the immersed boundary method for fully resolved simulations of deformable interfaces and membranes, J. Comput. Phys. 348, 567 (2017).