Evidence for a QCD accelerator in relativistic heavy-ion collisions
Abstract
We report measurements of forward jets produced in Cu+Au collisions at GeV at the Relativistic Heavy Ion Collider. The jet-energy distributions extend to energies much larger than expected by Feynman scaling. This constitutes the first clear evidence for Feynman-scaling violations in heavy-ion collisions. Such high-energy particle production has been in models via QCD string interactions, but so far is untested by experiment. One such model calls this a hadronic accelerator. Studies with a particular heavy-ion event generator (HIJING) show that photons and mesons exhibit such very high-energy production in a heavy-ion collision, so QCD accelerator appropriately captures the physics associated with such QCD string interactions. All models other than HIJING used for hadronic interactions in the study of extensive air showers from cosmic rays either do not include these QCD string interactions, or have smaller effects from the QCD accelerator.
I Introduction
Quantum chromodynamics (QCD) describes the interaction of quarks and gluons (collectively known as partons) due to their color charges. Color is confined in hadrons such as protons and neutrons (collectively known as nucleons), from which atomic nuclei are built. Due to color confinement, partons are studied in high-energy collisions characterized by total center-of-mass energy . When hadrons collide at high energy, most particles are produced by partonic interactions, consisting of a parton from one hadron interacting with a parton from the other hadron. Scattered partons manifest themselves as jets, which are sprays of particles. Scattered partons are connected by QCD field lines to other color charges. The quanta of QCD fields are gluons, which carry color charge. A QCD string is a flux tube between color charges arising because gluons interact with other gluons. Under appropriate conditions, QCD strings can interact with other strings (as shown schematically in Fig. 1) resulting in the theoretical prediction that forward particle production can extend to energies higher than expected for pairwise parton interactions [2, 3].
When the colliding hadrons are heavy ions (HI), the complexity of the collision increases. The conventional view of a HI collision is that it involves multiple instances of a nucleon from one incoming ion interacting with a nucleon from the other incoming ion. These nucleons collide with center-of-mass energy taken as the center-of-mass energy of the colliding heavy ions (). It is typical to scale the incoming momentum by the number of nucleons in each HI and compute from the scaled momenta. Partons from these nucleons then scatter. The complexity of the HI collision is from the superposition of all these scatterings and from strong final-state interactions of the scattered partons. Jets, or their surrogates, that are produced in heavy-ion collisions near midrapidity lose energy when traversing the hot and dense medium produced in the collision [4, 5, 6, 7, 8]. This medium is a quark-gluon plasma [9].
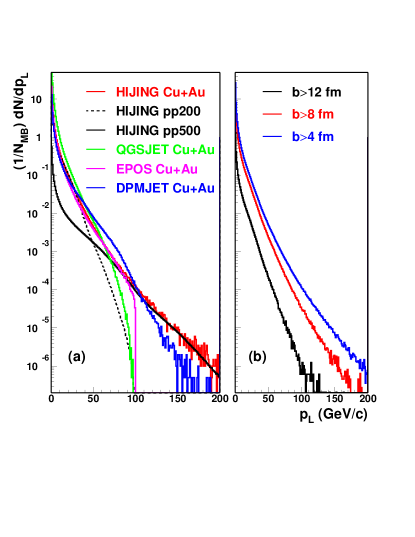
Particles are produced in hadronic collisions as the QCD strings break with a variety of values of transverse () and longitudinal () momentum. In general, most hadronic scattering experiments focus on the dependence. For a given , hadrons produced in the forward direction are found to have a limiting value of of , as seen for model calculations of p+p collisions at GeV in Fig. 2a. Feynman scaling [10] is the expectation the distribution will have a similar shape in the approach to the limiting value for different hadronic collisions. The scaling variable is . It is expected that . In general, studies of only the dependence can not determine the appropriate nucleon-nucleon (NN) , and assume . Some models of HI collisions predict [11, 17, 2, 3] that particles produced in the forward direction can have thereby violating Feynman scaling assuming nucleon-nucleon (Fig. 2a). Figure 2b shows that HIJING [11] predicts progressively larger for produced particles as the impact parameter (), the distance between the colliding nuclei, decreases. It is noted in Ref. [2, 3] that such high-energy hadrons arise from interacting QCD strings. They call this a hadron accelerator, perhaps better as a QCD accelerator, since HIJING predicts that mesons, meson pairs, and photons can have . QCD string interactions are an example of the collective behavior of partons. However, such predictions are not well tested by experiment. Large- Drell-Yan production [12] and production [13, 14] have been reported. As well, measurements of jet production in proton+lead collisions at =5.02 TeV were completed [15, 16]. In all cases produced particles are observed with .
As shown in Fig. 2, HIJING predicts that the distribution for particles produced in Cu+Au collisions at GeV has similar high-energy behavior as production of these same particles in p+p collisions at GeV, or more. These high-energy particles are very relevant for calibrating high-energy cosmic-ray detectors. Models of HI collisions are used to determine the composition of ultra-high energy cosmic rays [18], so checks of models against collider data are important, as has been done by comparing model predictions to LHC data [19]. The EPOS model [20], which is widely used in measurements of high-energy cosmic rays, respects Feynman scaling. The Sibyll model [21] can not be applied here since the target mass is limited. The QGSJET model [22] respects Feynman scaling, and is closer to p+p at GeV since it does not include final-state interactions. The DPMJET model [23] does violate Feynman scaling, although the distribution does not extend as far as predicted by HIJING. Due to the paucity of forward instrumentation at colliders, these theoretical predictions of QCD string interactions are not tested by measurement. Generally, most theory work related to Feynman scaling [24, 25] involves forward single-particle production. However, jets produced in the forward direction are expected to respect Feynman scaling as well [26]. This article reports, for the first time, relevant measurements to test theory predictions regarding QCD string interactions.
We present measurements of yields of jets produced in the forward direction from Cu+Au collisions at GeV. The measurements were made at interaction point (IP) 2 at the Relativistic Heavy Ion Collider (RHIC) at Brookhaven National Laboratory in 2012. The apparatus used for the measurements was previously discussed in our report of forward-jet production in p+p collisions at GeV [27]. The apparatus makes use of the uniquely large ratio of insertion length (straight sections for experimental apparatus) to of RHIC. The Cu+Au collision data was obtained during a test of possible pulse-shape discrimination in the hadron calorimeter, the primary device used for jet finding. Consequently, there was no vernier scan [28] of the two beams meaning that cross sections can not be measured. We instead report fraction of minimum bias (MB) as a yield measure. The basic measurements are to find jets in the hadron calorimeter that faces the Cu beam. Jets are considered as a function of , which is the charge sum in the beam-beam counter (BBC) annulus that faces the Au beam. Generally, is related to the impact parameter () of the colliding ions through HI models, with smaller for larger . The apparatus, other details of the experiment, the basic calibration of measuring devices, and aspects of jet finding and corrections are discussed in the following section.
II Measurements and Analysis Methods
The apparatus staged at IP2 was previously discussed [27]. A 200 cm 120 cm forward calorimeter wall with a central hole for the beams was constructed. The calorimeter wall was made from 236 cells. Each cell was of lead, with an embedded matrix of scintillating fibers that ran along the cell length in a spaghetti calorimeter configuration [29]. The calorimeter wall faced the Cu beam and was positioned 530 cm from the IP. The calorimeter had 5.9 hadronic interaction lengths and 150 radiation lengths of material, so was ideal for finding jets. The calorimeter spanned the pseudorapidity range of for particles produced at the center of the vertex- () distribution. Both charged and neutral particles follow straight-line trajectories until they interact with matter since there was no analysis magnet. The other primary components of the apparatus were two annular arrays of 16 scintillator tiles, which served as beam-beam counters (BBC) [30]. Each BBC array was positioned at cm from the IP. The apparatus is modeled in GEANT [37].
Triggering of event readout for this data was previously discussed [27]. Approximately half of the event sample is from a MB trigger that required hits in both BBC annuli. The other half of the data sample is from a jet trigger that sums ADC values from symmetric patches of the calorimeter to the left and to the right of the Cu beam. The jet trigger results can be emulated by applying the trigger algorithm to MB data, thereby determining the equivalent number of MB events for the jet trigger. ADC data were pedestal-corrected and zero suppressed. Such data were acquired for the triggered bunch crossing, and for the crossing before the trigger, and for the crossing after the trigger. The pre/post data were summed for towers associated with jets and set a limit of of the high-energy jets have contributions from pileup, as expected because all components of the detector apparatus were fast relative to the bunch-crossing frequency and the average interaction rate was only kHz.
The BBC reconstructed the component of the collision vertex () from time-difference measurements, calibrated by the measured distance between the two annuli. Calibration to match arrival times of fast particles produced in the collision was done online, with some final adjustments done in offline analysis. In the analysis, cm is imposed. The BBC is also used to measure total charge from scintillation light. The photomultiplier tube gains were adjusted online to provide an average charge of 100 counts for minimum ionizing particles (MIPs) through one of the detectors. Final adjustments of the BBC charge calibration were done in offline analysis. The total charge measured in the Au-beam facing BBC annulus () is related by simulation to of the colliding ions. HIJING simulations of minimum-bias Cu+Au collisions at GeV followed by GEANT simulations of the IP2 apparatus give a linear dependence of with , with the smallest fm for a requirement. The most central () Cu+Au collisions are predicted to have counts. For such collisions, the calorimeter is highly occupied. This report is restricted to peripheral Cu+Au collisions, to ensure that jet clusters can be robustly found.
Most of the relevant calibration of the calorimeter was previously described [27], although corrections to the calibration are required for Cu+Au collisions. Peaks from MIPs from cosmic-ray muons were matched to set the hardware gain of each cell prior to collisions. Software relative-gain corrections were made to match the slopes of the steeply falling charge distributions for each cell from p+p collision data to PYTHIA/GEANT simulations, which accurately describe data from the individual calorimeter cells, and most other aspects of the data. These same gain corrections work for the Cu+Au data, acquired two months later than the p+p data, except for the 16 cells that had their anode signals split by 50 splitters for the pulse-shape discrimination tests. The signal split meant twice higher software corrections (and energy range) for these cells. HIJING/GEANT simulations accurately describe the individual-cell response to Cu+Au collisions, and many other aspects of the data. Following relative gain calibration of all the cells, the absolute energy scale was determined from reconstruction of neutral pions from pairs of photons detected in the calorimeter. The difference between the average hadronic and electromagnetic energy scales was initially determined from PYTHIA/GEANT simulations, and later confirmed by test-beam measurements at FermiLab (T1064 [34]). T1064 also confirmed good electromagnetic response of the calorimeter, as needed for reconstruction.
After completing basic calibration of the calorimeter, jet finding proceeds. A jet finder is a pattern recognition algorithm [31] that returns a list of jets having pseudorapidity (), azimuthal angle () and energy () for from the list of hit elements of a calorimeter in an event. The hit elements associated with one jet depend on a cone size relative to the jet direction. The objects determined here are called tower jets, which are found either in data or in simulations of data using a realistic event generator (e.g. PYTHIA [33]) and a simulation of the IP2 apparatus using GEANT [37]. Frequently, jets are also found from the list of particles and their momenta returned by an event generator. These are so-called particle jets, that do not have detector effects and are built from particles of known energies. The jet-energy scale is set from comparison of tower jets and particle jets, and checked in the data from 2- and 3-jet mass peaks. The resolution of the found jets has components from the detector performance and from fluctuations of underlying event (UE) in Cu+Au collisions, determined from embedding p+p jets from PYTHIA/GEANT into Cu+Au minimum-bias data. This section describes details of the determination of the jet-energy scale and the resolution of the found jets.
Jets are reconstructed using an implementation [27] of the anti- algorithm [31] with a variety of cone radii (). Checks of the jet finder were independently made by use of the anti- option in the FastJet 3.3.2 package [32]. The jet-energy scale was initially determined for by matching particle jets from PYTHIA [33] to tower jets from PYTHIA/GEANT [27], and then adjusted for other values by a linear correction made to the four momentum of each jet returned by the jet finder. This correction used the parton from PYTHIA/GEANT simulations (where the energy of the parton is known) that was associated with the reconstructed jet as a means of correlating jets found with varying , and ensuring they have the same energy for different . We call this correction jet compensation. A requirement that a good jet has is imposed to ensure minimal effects from the limited acceptance of the calorimeter. We establish that, on average, less than 3% of the jets found in Cu+Au events are fake, by randomly choosing towers from an ensemble of events that had similar to within cm and to within counts, and then applying the jet finder to events constructed from random towers. The fake jets fall more rapidly with increasing energy than real jets and also have smaller tower multiplicity.

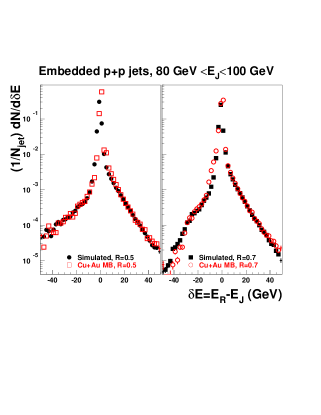
Underlying event (UE) is significantly larger in Cu+Au collisions than in p+p collisions, and arises from particles that are not associated with jets. For Cu+Au data, a further correction to the jet-energy scale is made from analysis of p+p jets from PYTHIA/GEANT embedded into minimum-bias Cu+Au data. Given the good agreement between p+p data and PYTHIA/GEANT [27], either data or simulation suffices for embedding. A distribution of the reconstructed jet energy results when the reconstructed jet is directionally matched to the p+p jet embedded into the event. The mean value of the energy-difference distribution from embedding at a given is subtracted from the jet energy. Figure 3 (left) shows that the embedding results have the same slope with jet energy as found in p+p, with an offset coming from the average effect of UE. The inset to the figure shows how the average additive correction to UE varies with . Hence, the jet-energy calibration is identical between p+p and Cu+Au, except for a additive correction needed for the latter due to UE. The impact of fluctuations of UE is discussed below.
Multiple checks were made of the jet-energy scale for the Cu+Au data. One check compares directionally matched particle jets of energy to tower jets of energy (Fig. 3) from HIJING/GEANT simulations. After correction for accidental matches caused by the jet multiplicity, the distribution of the energy difference is found to be Gaussian. The Gaussian centroid is consistent with being constant to within % for the jet-energy range . Figure 3 shows results for events with . Similar results are found for upper limits on summed charge up to 4000 counts. Other checks made of the jet-energy scale are from mass peaks observed in multi-jet events, which will be discussed in subsequent reports.
Jet-energy resolution must be quantified to unfold measured spectra to recover the true spectrum generated in the collision. There are two sources that affect jet resolution. The energy resolution of the calorimeter impacts the jet resolution. Jet resolution can be worsened from particles that lie beyond the detector acceptance (e.g. soft photons from the decay of neutral pions that fall beyond the jet cone, ). Jet resolution from detector effects is determined from reconstructions of particle and tower jets in PYTHIA/GEANT simulations of p+p collisions. The GEANT simulation is highly constrained since it accurately describes test-beam data (T1064) [34] for negative pions acquired at 6, 12, 18, and 24 GeV. Figure 4b shows that jet resolution from detector effects changes little with jet energy, but does depend on the cone radius used. The resolution difference between and 0.7 is due to differences in the ratio of electromagnetic particles to hadronic particles within the jets. This ratio is important because T1064 data shows electron resolution is times better than negative pion resolution. This ratio can be measured in principle, but is unmeasured at present. Consequently we attribute a systematic uncertainty of half the difference between the and 0.7 results for detector resolution, as discussed further below.
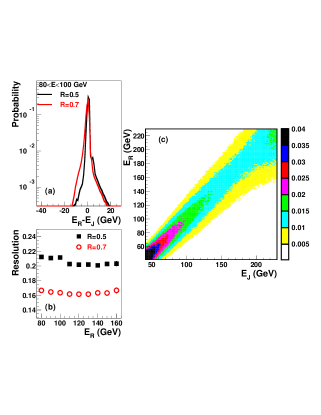
Another source of finite jet resolution for Cu+Au collisions is from fluctuations of UE. This resolution contribution is determined from embedding p+p jets into minimum-bias Cu+Au, and then comparing the reconstructed jet to the embedded jet. Figure 4a shows an energy-difference distribution for events with counts. There are exponential tails to the energy difference distribution that fall from 1% to 0.05%. These tails become more prominent as is increased. Figure 4c shows the response matrix obtained from embedding giving the probability to observe a jet of energy from a jet produced with energy .
A simulation model was developed to explain embedding results (Fig. 4a). The objective is to use the model to explore systematic uncertainties associated with UE. Fig. 5 shows that the embedding results are well explained by a simple model. In the model a p+p jet of energy is selected. Additional towers are randomly produced. Four parameters are introduced to describe the two-component tower energy distributions from minimum-bias Cu+Au events, which the simulation model can reproduce as can HIJING/GEANT simulations. One component of the tower energy distribution is a Gaussian distribution whose centroid is zero. The probability () and are two parameters of the model, with GeV, where is the distance of the tower center from the beam which varies from 5 cm to 116 cm. The parameter is 0.02, and represents the probability a cell becomes a tower with energy drawn at random from the Gaussian distribution. The second component of the tower-energy distribution is exponential. This component is modeled by two parameters corresponding to the probability, , that a cell is a tower whose energy is drawn at random from an exponential distribution specified by slope GeV. The parameter increases quadratically with . For , for jets and for jets. This 4-parameter simulation model accurately describes the embedding results. Systematic uncertainties from UE are estimated by scaling the probabilities by a factor of two, discussed further below.
III Results
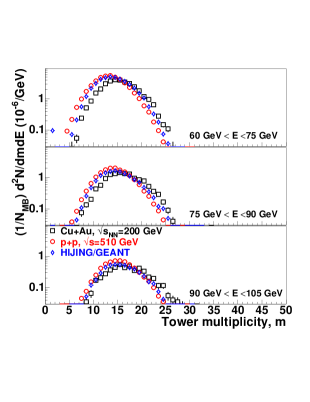
The multiplicity of towers found in jets from Cu+Au collisions is shown in Fig. 6. Comparison is made to HIJING/GEANT simulations. Although the extent of the data and simulation multiplicity distributions match for all energy bins, the average multiplicity from simulation is one tower less than found in the data. Also, the Cu+Au data are compared to jets from p+p at GeV, as motivated by Fig. 2a. The mean tower multiplicity is two towers smaller in p+p compared to Cu+Au, most likely due to UE contributions in HI data. The jet energies are corrected as per Fig. 3 (left); the tower multiplicities are not corrected. Trends in the comparisons persist from low to high energy, with energy independent scale factors used for HIJING/GEANT and p+p. From this we conclude jets with GeV are not from the merging of two or more lower energy jets. This conclusion is supported by embedding studies, as well.
Single event displays show that most events with high-energy jets from peripheral Cu+Au collisions are relatively simple, similar to what is observed for p+p collisions, consistent with embedding results from Fig. 5 that show that most p+p jets are unaffected by UE. There are some events with a high energy jet that also have a large value for the energy sum of cells closest to the beam (the perimeter-1 sum, ), that make the jet cluster less distinct from other activity in the calorimeter. We limit any effect of such events by imposing GeV as an event requirement. Absent this restriction, jets are found to even higher energy than what we report. The restriction is imposed to ensure minimal confusion for the jet finder. For MB events, the distribution of is similar for different bins considered. HIJING/GEANT predicts a similar distribution to that seen in the data, precluding single-beam backgrounds as the source of these events.
Jet-energy resolution impacts the steeply falling energy distributions. The small yield of high-energy jets may be caused by migration of some of the prolific lower-energy jets to high energy, due to finite resolution.
Both detector resolution and UE fluctuations are corrected for in the data by the singular value decomposition (SVD) unfolding algorithm [35]. One input to the SVD unfolding algorithm is a normalized response matrix, shown in Fig. 4c for events with counts. The color scale represents the probability to reconstruct a jet with energy from jets produced with energy . The response matrix is a product of a matrix obtained from embedding studies with a matrix representing detector resolution. The observed jet-energy distribution equals the full normalized response matrix times the true , represented as a vector.
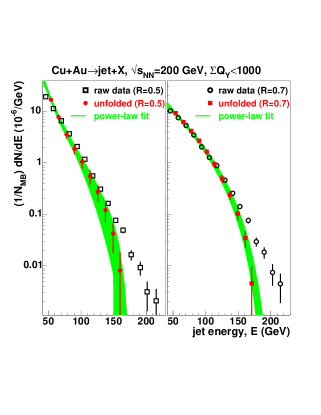
The SVD unfolding algorithm [35] was extensively studied using power-law parameterizations of jet-energy spectra: , with identified as the Feynman scaling variable. A description of the unfolding tests is available in an analysis note [36]. As the impact parameter of the colliding ions decreases, the jet-energy spectra are best described by an exponential function, which from tests may not be uniquely unfolded to eliminate resolution effects and return the true distribution of jets from the collision. For more peripheral HI collisions, negative logarithmic curvature is observed in raw jet-energy distributions (Fig. 7). The raw data extends to energies that are more than two times larger than given by Feynman scaling assuming . The unfolding proceeds via a singular value decomposition [35] of the response matrix (Fig. 4c). Instabilities inherent to SVD unfolding are cured by regularizing the singular values. The statistics per bin of the response matrix are sufficient to ensure stable unfolding results. The regularization parameter, is determined by computing a between the unfolded distribution and an input guide distribution that is initially determined from a power-law fit to the raw data, with the power-law parameters allowed to freely vary. Other choices for the regularization parameter were also made with similar results, albeit with some change in accounted for by including a systematic uncertainty from the regularization parameter. Figure 7 shows that finite resolution does not account for all of the highest energy jets, in that unfolded data can be fit by power-law functions with GeV when is used and GeV when is used. The unfolded results are similar to an independent Monte Carlo method that adjusts the true jet until the response matrix acting on it produces the observed jet-energy distribution. The fitted values correspond to effective NN 334 and 395 GeV, which is significantly larger than the assumption that nucleon-nucleon , similar to model expectations (Fig. 2a). The values are determined from the average of six power-law fits obtained as the jet-energy scale, the jet-energy resolution, the SVD regularization parameter, and UE fluctuations are varied. The uncertainties on are the root-mean squared values from the distributions. The yields of jets are similar when and are used to find jets. The smaller cone size results in a steeper rise of the jet-energy spectrum with decreasing energy at low energy, most likely due to splitting of higher energy jets.
The unfolded data in Fig. 7 includes multiple sources of systematic uncertainty added in quadrature with the statistical uncertainty. The 3% jet-energy scale uncertainty is included in both the raw-data and unfolded points. The width of the power-law fit parameter band is predominantly from jet-energy scale variations. Jet-energy resolution is also included in the uncertainties for the unfolded data points. Half the difference between the R=0.5 and R=0.7 jet-energy resolutions (Fig. 4b) is considered the uncertainty and separate SVD unfoldings are performed for the nominal and modified jet-energy resolution. Variation of the SVD unfolding parameter also contributes to the systematic uncertainty. Finally, the simulation that describes embedding results (Fig. 5) has the tower probability from both Gaussian and exponential distributions artificially increased by a factor of two. Although this may appear a large variation, it illustrates that the dominant effects from unfolding are from detector effects, both jet-energy scale and jet-energy resolution. The impact of UE fluctuations is small, as can be seen from the small probability of exponential tails in Fig. 5. Systematic effects from jet-energy resolution can be reduced in an experiment that measures the electromagnetic fraction of the jet.
| Parameter | ||
|---|---|---|
| (GeV) | ||
Table 1 lists the average value of the power-law fit parameters from the variations used to deduce systematic uncertainty in Fig. 7. The normalization parameter is strongly correlated with the fitted powers . We attribute physical significance to only the parameter, although future extensions of HI models to accommodate a QCD accelerator may find such significance in the other parameters.
Run-by-run analysis shows that no special beam conditions give rise to these high-energy jets. The distribution of the highest-energy tower within the jet qualitatively matches predictions from HIJING/GEANT, again precluding single-beam backgrounds as the origin of the high-energy jets. Similar yields of high-energy jets are found from different parts of the distribution. Contributions from pileup are found to be small. We rule out instrumental or environmental sources of these high-energy jets.
After all corrections and systematic checks, we find that forward-jet production in peripheral Cu+Au collisions exceeds the Feynman-scaling endpoint energy by a factor between 1.7 and 2.0, assuming conventional parton scattering from nucleon-nucleon collisions with .
| Parameter | =1000 | =2000 | =3000 |
|---|---|---|---|
| (GeV) | |||
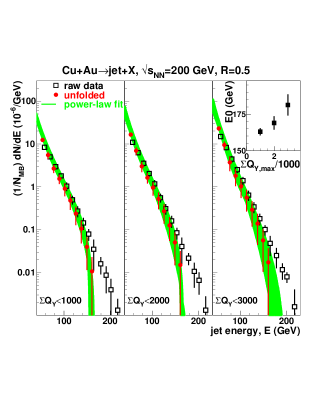
The HIJING model of heavy-ion collisions [11] predicts that single-particle production also violates Feynman scaling, with the magnitude of the effect increasing as the collisions become more central (). To examine this, we systematically increase the upper limit on the Au-beam facing charge sum, as shown in Fig. 8. Checks of the data show that multi-jet mass-peak widths are proportional to the root-mean square of the embedding distribution (Fig. 4a) as is increased. This supports that embedding properly measures resolution from UE fluctuations. To ensure adequate statistics, the acceptance is increased to . Systematic uncertainties are estimated by varying the jet-energy scale by %, the jet-energy resolution by %, the SVD regularization parameter, and UE fluctuations by a factor of 1.5. The uncertainties shown are the quadrature sum of statistical uncertainty and systematic uncertainties from the four variations considered. The jet-energy scale variations makes the largest contribution to the systematic uncertainty, although the SVD regularization variation is dominant for high-energy jets when =3000. As is increased the fitted value increases, as shown in the inset to Fig. 8. This is consistent with expectations regarding string interactions becoming a more effective QCD accelerator at smaller impact parameter. At the very least, Fig. 8 demonstrates that is not resulting from some special centrality selection. Smooth dependence on is observed in all cases. Unlike for HIJING, even the most peripheral Cu+Au collisions still have GeV in unfolded data. The average values of the other fit parameters are shown in Table 2. QCD string interactions have been in some HI collision models for over thirty years. These data provide clear experimental evidence of QCD string interactions. Models will have to be adjusted to better describe these findings. Given the complexity of Cu+Au collisions, it could be possible that some combination of initial-state effects (i.e. modification of parton distributions in nuclei) and final-state effects could explain our measurements.
IV Conclusions
Jets produced by Cu+Au collisions at GeV in the forward direction significantly violate Feynman scaling, assuming nucleon-nucleon . The effective nucleon-nucleon varies linearly from 1.5 to times larger than as the impact parameter decreases. These observations qualitatively match previously untested theoretical expectations of QCD string interactions that are within multiple models of HI collisions. There are important implications of QCD string interactions for the study of very high-energy cosmic rays, particularly for observables that rely on models of the interaction of cosmic-ray primaries in the atmosphere. It is fully expected that QCD string interactions may also provide a window to search for the production of new particles.
Acknowledgements.
We thank the RHIC Operations Group at BNL. This work was supported in part by the Office of NP within the U.S. DOE Office of Science, the Ministry of Ed. and Sci. of the Russian Federation, and the Ministry of Sci., Ed. and Sports of the Rep. of Croatia, and IKERBASQUE and the UPV/EHU. We also thank the operations group and the test beam staff at FNAL.References
- [1]
- [2] N. Armesto, M. A. Braun, E. G. Ferreiro, C. Pajares, and Yu. M. Shabelski, Phys. Lett. B389, 78-82 (1996).
- [3] N. Armesto, M. A. Braun, E. G. Ferreiro, C. Pajares, and Yu. M. Shabelski, https://arxiv.org/abs/hep-ph/9606333.
- [4] STAR collaboration, C. Adler et al., Phys. Rev. Lett. 89, 202301 (2002).
- [5] PHENIX collaboration, K. Adcox et al., Phys. Rev. Lett. 88, 022301 (2001).
- [6] CMS collaboration, Phys. Lett. B 712, 176 (2012).
- [7] ATLAS collaboration, Phys. Lett. B 719, 220 (2013).
- [8] ALICE collaboration, Phys. Lett. B 746, 1 (2015).
- [9] W. Busza, K. Rajagopal, and W. van der Schee Ann. Rev. Nucl. Part. Sci. 68, 339 (2018).
- [10] R. Feynman, Phys. Rev. Lett. 23, 1415 (1969).
- [11] X. N. Wang and M. Gyulassy, Phys. Rev. D44, 3501 (1991).
- [12] J. S. Conway et al., Phys. Rev. D 39, 92 (1989).
- [13] M. J. Leitch, W. M. Lee, M. E. Beddo, C. N. Brown, T. A. Carey, T. H. Chang, et al., Phys. Rev. Lett. 84, 3256 (2000).
- [14] R. Analdi et al., Phys. Lett. B 706, 263 (2012).
- [15] ATLAS collaboration, Phys. Lett. B 748, 392 (2015).
- [16] CMS collaboration, JHEP 05, 043 (2019).
- [17] Zi-Wei Lin, Che Ming Ko, Bao-An Li, Bin Zhang, and Subrata Pal Phys. Rev. C 72, 064901 (2005).
- [18] A. Aab et al., Phys. Rev. D 90, 122006 (2014).
- [19] D. d’Enterria and T. Pierog, JHEP 1608 170 (2016).
- [20] T. Pierog, Iu. Karpenko, J.M. Katzy, E. Yatsenko, and K. Werner Phys. Rev. C 92, 034906 (2015).
- [21] F. Riehn, R. Engel, A. Fedynitch, T. K. Gaisser, and T. Stanev, Phys. Rev. D 102 063002 (2020).
- [22] S. Ostapchenko, Phys. Rev. D 83, 014018 (2011).
- [23] R. Engel, Z. Phys. C66, 203-214 (1995).
- [24] G. H. Arakelyan, C. Merino, C. Pajares, and Yu. M. Shabelski, Phys. Atom. Nucl. 76, 316-325 (2013).
- [25] F. Carvalho, V. P. Goncalves, F. S. Navarra, and D. Spiering, Phys. Rev. D 103, 034021 (2021).
- [26] K. Kutak, H. V. Haevermaet, and P. V. Mechelen, missingJournalPhys. Lett. B 770, 412-417 (2017).
- [27] L. C. Bland et al., Phys. Lett. B750, 660-665 (2015).
- [28] A. Drees, BNL report 67961 (2000).
- [29] T. A. Armstrong et al., Nucl. Instrm. Meth. A 406, 227-258 (1998).
- [30] R. Bindel et al., Nucl. Instrm. Meth. A 474, 38-45 (2001).
- [31] M. Cacciari, G. P. Salam, G. Soyez, JHEP 2008, 063 (2008).
- [32] M. Cacciari, G. P. Salam, and G. Soyez, Eur. Phys. Journ. 72, 1896 (2012).
- [33] T. Sjöstrand, S. Mrenna, and P. Skands, JHEP 2006 (2006).
- [34] H. J. Crawford, T1064, STAR Forward Calorimeter System, Technical Scope of Work for the 2015 FermiLab Test Beam Facility Program.
- [35] A. Höcker and V. Kartvelishvili, Nucl. Inst. Meth. 372, 469-481 (1995).
- [36] L. C. Bland, H. J. Crawford, A. Quintero Forward Dijets at RHIC: Relevant Details, 2022 (unpublished).
- [37] René Brun et al., CERN-W-5013 (1994).