Dresselhaus spin-orbit interaction in the p-AlGaAs/GaAs/AlGaAs structure with a square quantum well: Surface Acoustic Waves Study
Abstract
The effect of spin-orbit interaction was studied in a high-quality -AlGaAs/GaAs/AlGaAs structure with a square quantum well using acoustic methods. The structure grown on a GaAs (100) substrate was symmetrically doped with carbon on both sides of the quantum well. Shubnikov –de Haas-type oscillations of the ac conductance of two-dimensional holes were measured. At a low magnetic field 2 T conductance oscillations undergo beating induced by a spin-orbit interaction. Analysis of the beating character made it possible to separate the conductance contributions from the two heavy holes subbands split by the spin-orbit interaction. For each of the subbands the values of the effective masses and quantum relaxation times have been determined, and then the energy of the spin-orbit interaction was obtained. The quantum well profile, as well as the small magnitude of the spin-orbit interaction, allowed us to conclude that the spin-orbit splitting is governed by the Dresselhaus mechanism.
pacs:
73.63.Hs, 73.50.RbI Introduction
An electron (hole) system in low external magnetic fields or in its absence is usually considered as spin degenerate one. However, in some cases, namely, when a spin-orbit interaction exists in the system, it turned out that the spin degeneracy can be lifted even in the absence of a magnetic field. Two causes of the spin degeneracy lifting are known. One of them is the crystal structure of the material under study: the lack of the spatial inversion symmetry, which is typical, for example, for systems with the zinc-blende crystal structure () Dresselhaus (1955). The second cause is the structural inversion asymmetry of the quantum well Bychkov and Rashba (1984a, b). The spin-orbit interaction is commonly studied experimentally by measuring the Shubnikov-de Haas (SdH) oscillations. Since the spin-orbit interaction induces formation of two subbands with different spin directions at each wavevector and different concentrations, as well as because the magnitude of the spin-orbit splitting is small, in transport experiments this effect manifests itself in a beating of the oscillations. By now, beating of the Shubnikov - de Haas oscillations have been observed and extensively studied in many electronic two-dimensional systems. These are InAs/GaSb, InAs/AlSb Rowe et al. (2001); Luo et al. (1988), GaxIn1-xAs/InP Engels et al. (1997); Guzenko et al. (2007); Herzog et al. (2017), AlxGa1-xN/GaNLo et al. (2002), In0.53Ga0.47As/In0.52Al0.48As Das et al. (1989); Nitta et al. (1997); Dorozhkin (1990), HgTe Minkov et al. (2020, 2019); Gui et al. (2004); Minkov et al. (2016). The objects of studies in the articles referred to above were mainly heterostructures or one-side doped quantum wells. As for two-dimensional hole systems, aside from work Dorozhkin et al. (2010), performed on the InGaAs/GaAs heterostructure, the experiments were carried out mainly on p-GaAs/AlGaAs samples Stormer et al. (1983); Eisenstein et al. (1984); Lu et al. (1998); Habib et al. (2004, 2009); Chiu et al. (2011). In these works, the objects under study were also, for the most part, heterostructures or one-side doped quantum wells. Moreover, two-dimensional structures were formed on GaAs substrates with the (311)A orientation, and the dopants were either Be or Si. Relatively recently high-quality p-GaAs/AlGaAs structures were grown on GaAs substrates oriented along (100) and doped with carbon (C). The mobility in these structures reached a value exceeding 106 cm2/Vs Manfra et al. (2005). In these systems studies of spin-orbit interaction have already been performed in Grbić́ et al. (2004); Nichele et al. (2014); Tarquini et al. (2014); Yuan et al. (2009). In both the heterostructure investigated in Ref. Grbić́ et al. (2004) and the one-side doped quantum well studied in Ref. Nichele et al. (2014), the influence of the spin-orbit interaction on SdH oscillations was clearly manifested. However, in a symmetric quantum well with high mobility and a low concentration studied in Tarquini et al. (2014) no spin-orbit interaction was experimentally observed. In Yuan et al. (2009), in a symmetrically doped quantum well ( cm-2, cm2/Vs at 300 mK), beating of the SdH oscillations were observed. However, its Fourier spectrum peak splitting, which is a specific for the existence of two spin-split subbands, was too weak and could not be analyzed to obtain such characteristics as the effective mass in each subbands.
In this work, we investigate the effect of the spin-orbit interaction on the ac conductance of holes in a 17 nm wide quantum well, symmetrically doped with C. The structure was grown on the (100) GaAs substrate. The measurements were carried out by the Surface Acoustic Waves (SAW) technique in the frequency range 30-300 MHz in magnetic fields up to 18 T, temperatures of 20-300 mK in a linear regime in the wave power, and at =20 mK at various SAW intensities.
II Sample parameters and method
The high-quality samples were multilayer (29 layers) structures grown on a GaAs (100) substrate. The single quantum well in the structure is a 17 nm wide GaAs layer. It is bounded on both sides by 100 nm layers of Al0.24Ga0.76As barrier material acting as symmetrical undoped setbacks from the Carbon -doped layers on each side. Formed in such a way quantum well is a square, highly-symmetrical one. The quantum well is located at the depth 210 nm below the surface of the sample. It has the hole concentration cm-2 and mobility cm2/Vs at 300 mK.
In our studies we utilize the Surface Acoustic Wave technique. In these probeless acoustic experiments a SAW propagates along a surface of a piezoelectric lithium niobate delay line on either edge of which interdigital transducers are placed to excite and detect the wave. The structure under study is pinned down on the surface of the LiNbO3 crystal by means of springs. The electric field accompanying the SAW penetrates into the 2D channel. This ac field induces electrical currents in 2DHG which, in turn, cause Joule losses. As a result of the coupling of the SAW electric field with charge carriers in the quantum well, the SAW attenuation and its velocity shift arise. From simultaneous measurements of and one can determine the complex ac conductance of the 2D structure, . Drichko et al. (2000)
The experiments were carried out in a dilution refrigerator in the magnetic field at T in the temperature interval 20-300 mK. At the base temperature of 20 mK the magnetic field dependences of the and at various SAW intensity were recorded. The SAW frequency was changed from 28 to 307 MHz. The measurements in magnetic fields 2 T were done at slow ramping of 0.05 T/min. A Hall probe was used to measure the magnetic field strength precisely.
III Experiment results and discussions
Fig. 1 shows the magnetic field dependence of real part of ac conductance at different temperatures at MHz. It shows rich oscillation patterns corresponding not only to the integer quantum Hall effect (QHE) but also to fractional QHE regimes, which is typical for a high-quality sample.
At low-field 2 T conductance oscillations undergo beating induced by the spin-orbit interaction Stormer et al. (1983); Eisenstein et al. (1984); Lu et al. (1998); Habib et al. (2004, 2009); Chiu et al. (2011). In this paper we are focusing on the analysis of this effect and, demonstrating only the real part of the ac conductance because in this magnetic field .
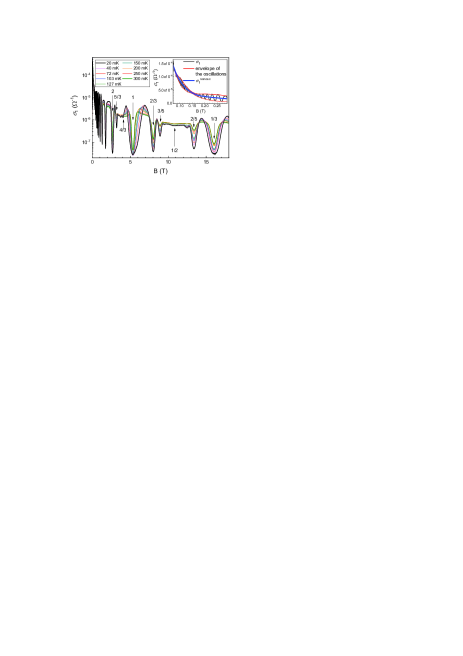
For this purpose we constructed a dependence of the normalized oscillating part of the conductance on the reversed magnetic field 1/, where is monotonically varying non-oscillating background. was determined as the average value of the oscillation envelope in the way illustrated in the inset of Fig. 1. Results of such constructions at various temperatures from 20 mK to 300 mK are presented in Fig. 2(a). The dependences at =20 mK related to several SAW intensities are plotted in Fig. 2(b), where the intensity of the SAW electric field introduced into the sample ranges from W/cm to W/cm.
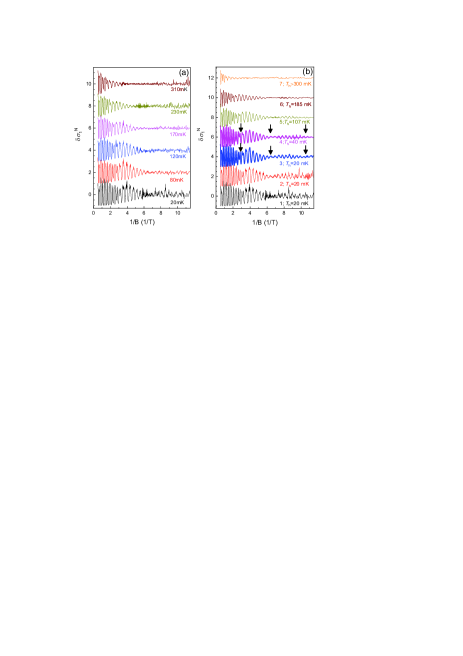
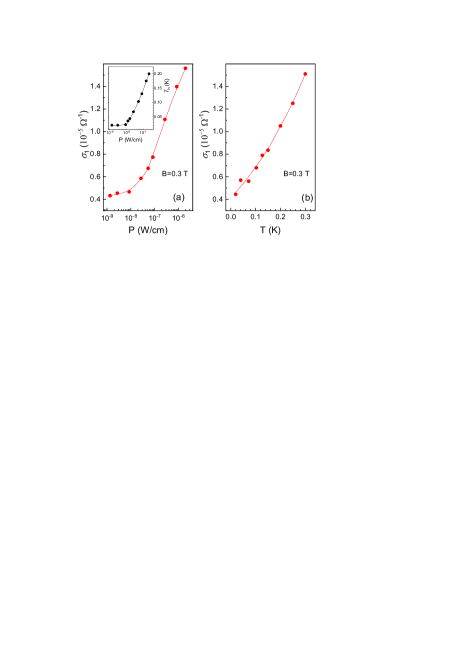
As seen in Fig. 2, the conductance undergoes beating with characteristic nodes marked by arrows. The pattern of beating and nodes is much more pronounced on the dependences acquired at different SAW intensities (Fig. 2(b)) rather than at different temperatures (Fig. 2(a)). This is due to the small value of the signal-to-noise ratio at the minimum SAW power, at which our study of the temperature influence on the conductivity was carried out. With increase in the SAW intensity, the signal-to-noise ratio in the measurements of and increases, but at the same time high intensity can set the system in a nonlinear regime. To check signal linearity, we plotted the dependence of the conductance in the magnetic field of 0.3 T on the SAW intensity at =20 mK (see Fig.3(a)) and on temperature at the minimal intensity (see Fig. 3(b)). Figure 3 evidences that the dependences and are similar. Such similarity is typical for heating of current carriers by the SAW electric field. By comparing and , the dependence of the hole temperature on the SAW intensity was determined and is shown in the inset of Fig. 3(a). It can be seen from the figure that at 10-8 W/cm the system is still in the linear regime, i. e., curves 1, 2, and 3 in Fig. 2(b) correspond to =20 mK. However, for the 4th curve, is equal to 40 mK, for the 5th curve =107 mK, for the 6th curve =185 mK, and for the 7th curve exceeds 300 mK. The values of are shown for each of curves of Fig.2(b).
To clarify the beating structure we carried out the fast Fourier transform (FFT) procedure over the experimental data.
Fig. 4 shows the Fourier spectra of the conductance for magnetic field 2 T for different temperatures in linear regime (a) and for various SAW electric field intensities at 20 mK (b). The Fourier spectra exhibit several components. We see here clearly, especially at low temperatures, a split FFT peak with the FFT frequencies f2.4 T and f2.6 T resulting in appearance of the both the slow oscillation FFT peak at f0.2 T and the sum FFT peak at f5 T. The frequencies can be converted into the densities of the lower and higher populated subbands: cm-2 and cm-2, respectively. Therefore, cm-2 and .
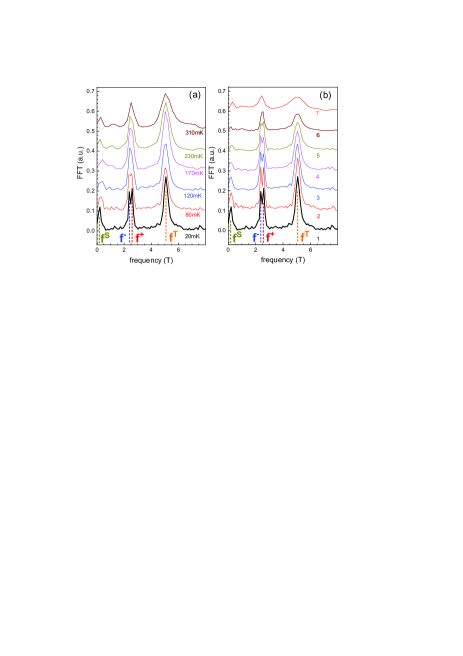
This all confirms that the slow oscillations appear due to the intersubband transitions. Moreover, it is supported by a robustness of the f FFT peak to the temperature and SAW power increase, even when the FFT f+ and f- split is not already observed.
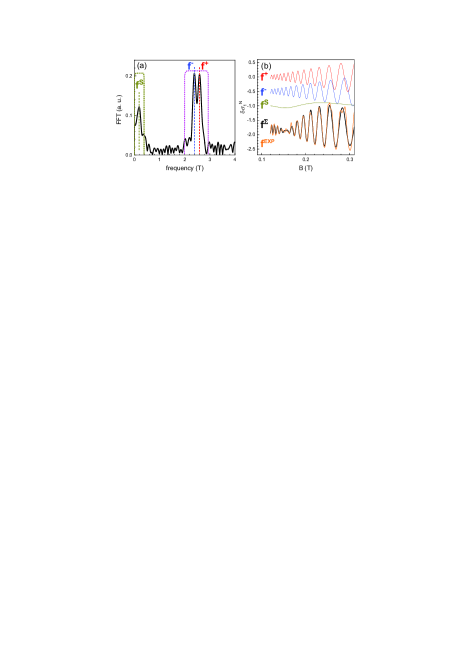
Now we analyze the behavior of different components of the FFT spectrum of the conductance. First, we used a bandpass filter, shown in Fig. 5(a) as an olive dotted line, to isolate the slow component from fast ones. Then, applying the inverse fast Fourier transformation we obtained the slow oscillations of the frequency f, which is shown in Fig. 5(b).
Secondly, we should isolate from each other the two fast oscillations corresponding to upper f+ and lower f- subbands. Since f+ and f- are almost equal bandpass filtering has an ambiguity when constructing the corresponding bandpass filter. That is why the direct inverse fast Fourier transformation would not be precise. Therefore, we used a specially developed software provided to us by O. E. Rut. The software algorithm is described in Ref. Minkov et al. (2020). It carries out the bandpass filtering of the splitted FFT peak with a filter shown in Fig. 5(a) as a pink dotted line. Then, the inverse fast Fourier transformation gives a sum of fast oscillations with frequencies f+ and f-. Finally this sum is fitted to the sum of two Lifshits-Kosevich Lifshits and Kosevich (1956) terms presented in Eq. (6) of Ref. Minkov et al. (2020):
| (1) |
where , . The fitting parameters , , , are described in Ref. Minkov et al. (2020) and references therein. Fast oscillations f+ and f- reconstructed by using the software mentioned above are shown in Fig. 5(b). The quality of such fitting is also illustrated in this figure by comparing the superposition curve fΣ=f+ + f- + f with the experimental one f.
Such procedure was performed for all temperatures in the field region, where beating were observed. It allowed us to build the dependences of the amplitude of oscillations on temperature in different magnetic fields.
In a 2D system with one subband the carrier effective mass is usually determined from the temperature dependence of the amplitude of the SdH-type oscillations by fitting it to the factor with the effective mass as the fitting parameter.
In our case, we can independently determine from temperature dependences of amplitudes as we isolate from each other the fast oscillations corresponding to upper f+ and lower f- subbands. Fig. 6 shows dependence of the oscillation amplitudes 2 of each component for magnetic field 0.27 T. Fits of the oscillation amplitudes to provide us with for each subband.
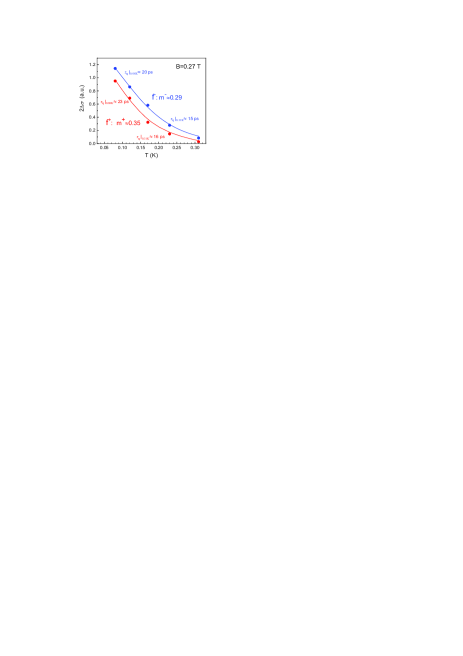
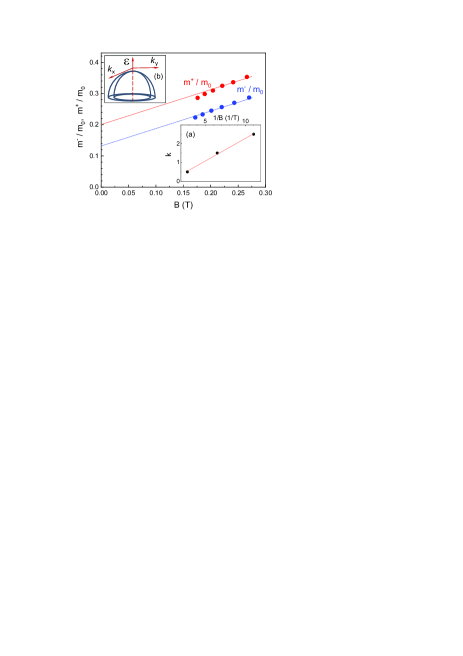
Fig. 7 shows values as a function of magnetic field for each of the spin-split subbands. and nearly linearly increase with . Linear extrapolations of the data to 0 shown by lines in Fig. 7 suggest =0.200.01 and =0.120.01, where is the mass of free electrons.
The quantum scattering times were also obtained from the oscillations’ amplitudes: at =0.27 T the value are 1.610-11s for upper subband and 1.510-11s for lower subband at =0.31 K. The transport relaxation time 1.6210-10s found from zero-field mobility of cm2/Vs at 0.31 K with value of the effective mass =(0.160.04) averaged between and at =0. The ratio 12 indicates that a long-range scattering potential is dominant.
Magnetic field dependences of the effective mass for spin-split subbands formed as the result of the spin-orbit interaction are reported in all studies of this effect Lu et al. (1998); Habib et al. (2004, 2009); Chiu et al. (2011); Nichele et al. (2014); Tarquini et al. (2014). A possible theoretical explanation of the origin of this dependence was proposed in Ref. Simion and Lyanda-Geller (2014). However, the quantum well width, as well as the sample parameters used in the calculations published in Ref. Simion and Lyanda-Geller (2014), differ from those studied in our work. It makes a comparison with the theory of Ref. Simion and Lyanda-Geller (2014) impossible.
Now, since we have estimated the values of effective masses at =0 it is possible to calculate the energy of the spin-orbit splitting . This calculation can be done by two methods.
In the first method, knowing the difference in concentrations in the subbands split by the spin-orbit interaction 5109 cm-2, we use the following formula:
| (2) |
which is valid in our case since .
In the second method, since it is possible to determine the magnetic field position of oscillations beating nodes (see Fig. 3), and the modulation of the SdH-type oscillations induced by the spin-orbit interaction is realized according to the law , then at (in CGS units) k= = 1/2, 3/2, 5/2. From the slope of the dependence of k on 1/ shown in inset of Fig. 7, one can determine =(0.20.05) meV. In both of these methods, as well as in the mobility calculations above, we used averaged =(0.160.04). As we see the values of determined by different methods are close.
As was mentioned in the introduction, the scientists who studied the spin-orbit interaction in two dimensional structures in most cases dealt either with heterostructures or with one-side doped quantum wells. Therefore, almost all of them observed the effect related to structural inversion asymmetry (Rashba splitting), which was much stronger than the bulk inversion asymmetry effect (Dresselhaus splitting) expected in symmetrically doped quantum wells. Also it should be mentioned that the Dresselhaus spin-orbit interaction was studied in -GaAs/AlGaAs using the weak antilocalization in magnetoresistance effect and the energy =0.2 meV was obtained Desrat et al. (2006). Comparing our results with the values of the Rashba energy splitting acquired by these authors on various two dimensional systems: =30 meV Gui et al. (2004), 9 meV Lo et al. (2002), 5.5 meV Nitta et al. (1997), 1.41 meV Stormer et al. (1983), we established that theirs were significantly higher than the value obtained by us: =(0.160.04) meV and =(0.20.05) meV. Since we investigated the spin-orbit interaction in a symmetrically doped square quantum well and obtained a very small value of the spin-orbit splitting, there is a reason to believe that the origin of this effect intrinsically comes from the crystal structure of the material under study (i.e., from the absence of an inversion center), which is typical for zinc-blende () structures (Dresselhaus mechanism). Shown in the inset (b) of Fig. 7 for simplified visualization is the holes spectrum with a presence of the Dresselhaus spin-orbit interaction mechanism. The spectrum consists of two spin-subbands, giving oscillations with close frequencies resulting in a beating.
It is worth noting that determined in the present paper values of the effective masses, quantum relaxation times and energy of the spin-orbit interaction do not depend on frequency in the studied range of 30-300 MHz.
In conclusion, namely using of the high-quality structure -GaAs/AlGaAs (with cm-2) with a square symmetrically doped quantum well and carrying out measurements of the SdH-type oscillations in the low temperature region 20 mK 300 mK gave us the possibility to observe for these structures the spin-orbit interaction which is originated from the Dresselhaus effect.
Acknowledgments
The authors would like to thank O.E. Rut for providing us with the FFT components separation program, G.M. Minkov for fruitful consultations and L.E. Golub for useful discussions and careful reading of the manuscript. The authors are thankful to E. Green, P. Nowell, and L. Jiao for technical assistance. Support from the Russian Foundation for Basic Research (project 19-02-00124) is gratefully acknowledged. The National High Magnetic Field Laboratory is supported by National Science Foundation through NSF/DMR-1644779 and the State of Florida. This research is funded in part by the Gordon and Betty Moore Foundation’s EPiQS Initiative, Grant GBMF9615 to L. N. Pfeiffer, and by the National Science Foundation MRSEC grant DMR 1420541.
References
- Dresselhaus (1955) G. Dresselhaus, Phys. Rev. 100, 580 (1955).
- Bychkov and Rashba (1984a) Y. A. Bychkov and E. I. Rashba, JETP Lett. 39, 78 (1984a).
- Bychkov and Rashba (1984b) Y. A. Bychkov and E. I. Rashba, Journal of Physics C: Solid State Physics 17, 6039 (1984b).
- Rowe et al. (2001) A. C. H. Rowe, J. Nehls, R. A. Stradling, and R. S. Ferguson, Phys. Rev. B 63, 201307 (2001).
- Luo et al. (1988) J. Luo, H. Munekata, F. F. Fang, and P. J. Stiles, Phys. Rev. B 38, 10142 (1988).
- Engels et al. (1997) G. Engels, J. Lange, T. Schäpers, and H. Lüth, Phys. Rev. B 55, R1958 (1997).
- Guzenko et al. (2007) V. A. Guzenko, T. Schäpers, and H. Hardtdegen, Phys. Rev. B 76, 165301 (2007).
- Herzog et al. (2017) F. Herzog, H. Hardtdegen, T. Schäpers, D. Grundler, and M. A. Wilde, New Journal of Physics 19, 103012 (2017).
- Lo et al. (2002) I. Lo, J. K. Tsai, W. J. Yao, P. C. Ho, L.-W. Tu, T. C. Chang, S. Elhamri, W. C. Mitchel, K. Y. Hsieh, J. H. Huang, H. L. Huang, and W.-C. Tsai, Phys. Rev. B 65, 161306 (2002).
- Das et al. (1989) B. Das, D. C. Miller, S. Datta, R. Reifenberger, W. P. Hong, P. K. Bhattacharya, J. Singh, and M. Jaffe, Phys. Rev. B 39, 1411 (1989).
- Nitta et al. (1997) J. Nitta, T. Akazaki, H. Takayanagi, and T. Enoki, Phys. Rev. Lett. 78, 1335 (1997).
- Dorozhkin (1990) S. I. Dorozhkin, Phys. Rev. B 41, 3235 (1990).
- Minkov et al. (2020) G. M. Minkov, O. E. Rut, A. A. Sherstobitov, S. A. Dvoretski, N. N. Mikhailov, V. A. Solov’ev, M. Y. Chernov, S. V. Ivanov, and A. V. Germanenko, Phys. Rev. B 101, 245303 (2020).
- Minkov et al. (2019) G. Minkov, V. Y. Aleshkin, O. Rut, A. Sherstobitov, A. Germanenko, S. Dvoretski, and N. Mikhailov, Physica E 110, 95 (2019).
- Gui et al. (2004) Y. S. Gui, C. R. Becker, N. Dai, J. Liu, Z. J. Qiu, E. G. Novik, M. Schäfer, X. Z. Shu, J. H. Chu, H. Buhmann, and L. W. Molenkamp, Phys. Rev. B 70, 115328 (2004).
- Minkov et al. (2016) G. M. Minkov, A. V. Germanenko, O. E. Rut, A. A. Sherstobitov, M. O. Nestoklon, S. A. Dvoretski, and N. N. Mikhailov, Phys. Rev. B 93, 155304 (2016).
- Dorozhkin et al. (2010) S. I. Dorozhkin, M. O. Skvortsova, A. V. Kudrin, B. N. Zvonkov, Y. A. Danilov, and O. V. Vikhrova, JETP Letters 91, 292 (2010).
- Stormer et al. (1983) H. L. Stormer, Z. Schlesinger, A. Chang, D. C. Tsui, A. C. Gossard, and W. Wiegmann, Phys. Rev. Lett. 51, 126 (1983).
- Eisenstein et al. (1984) J. P. Eisenstein, H. L. Störmer, V. Narayanamurti, A. C. Gossard, and W. Wiegmann, Phys. Rev. Lett. 53, 2579 (1984).
- Lu et al. (1998) J. P. Lu, J. B. Yau, S. P. Shukla, M. Shayegan, L. Wissinger, U. Rössler, and R. Winkler, Phys. Rev. Lett. 81, 1282 (1998).
- Habib et al. (2004) B. Habib, E. Tutuc, S. Melinte, M. Shayegan, D. Wasserman, S. A. Lyon, and R. Winkler, Phys. Rev. B 69, 113311 (2004).
- Habib et al. (2009) B. Habib, M. Shayegan, and R. Winkler, Semiconductor Science and Technology 24, 064002 (2009).
- Chiu et al. (2011) Y. Chiu, M. Padmanabhan, T. Gokmen, J. Shabani, E. Tutuc, M. Shayegan, and R. Winkler, Phys. Rev. B 84, 155459 (2011).
- Manfra et al. (2005) M. J. Manfra, L. N. Pfeiffer, K. W. West, R. de Picciotto, and K. W. Baldwin, Applied Physics Letters 86, 162106 (2005), https://doi.org/10.1063/1.1900949 .
- Grbić́ et al. (2004) B. Grbić, C. Ellenberger, T. Ihn, K. Ensslin, D. Reuter, and A. D. Wieck, Applied Physics Letters 85, 2277 (2004), https://doi.org/10.1063/1.1781750 .
- Nichele et al. (2014) F. Nichele, A. N. Pal, R. Winkler, C. Gerl, W. Wegscheider, T. Ihn, and K. Ensslin, Phys. Rev. B 89, 081306 (2014).
- Tarquini et al. (2014) V. Tarquini, T. Knighton, Z. Wu, J. Huang, L. Pfeiffer, and K. West, Applied Physics Letters 104, 092102 (2014), https://doi.org/10.1063/1.4867086 .
- Yuan et al. (2009) Z. Q. Yuan, R. R. Du, M. J. Manfra, L. N. Pfeiffer, and K. W. West, Applied Physics Letters 94, 052103 (2009), https://doi.org/10.1063/1.3077147 .
- Drichko et al. (2000) I. L. Drichko, A. M. Diakonov, I. Y. Smirnov, Y. M. Galperin, and A. I. Toropov, Phys. Rev. B 62, 7470 (2000).
- Lifshits and Kosevich (1956) I. M. Lifshits and A. M. Kosevich, Sov. Phys. JETP 2, 636 (1956).
- Simion and Lyanda-Geller (2014) G. E. Simion and Y. B. Lyanda-Geller, Phys. Rev. B 90, 195410 (2014).
- Desrat et al. (2006) W. Desrat, D. K. Maude, Z. R. Wasilewski, R. Airey, and G. Hill, Phys. Rev. B 74, 193317 (2006).