2D MULTI-CLASS MODEL FOR GRAY AND WHITE MATTER SEGMENTATION
OF THE CERVICAL SPINAL CORD AT 7T
Aix Marseille Univ, CNRS, CRMBM, Marseille, France
APHM, CHU Timone, Pôle d’Imagerie Médicale, CEMEREM, Marseille, France
nilser-jherald.LAINES-MEDINA@univ-amu.fr
\And
NeuroPoly Lab, Institute of Biomedical Engineering, Polytechnique Montréal, Montréal, QC, Canada
MILA - Québec AI Institute, Montréal, QC, Canada
charley.gros@gmail.com
\And
NeuroPoly Lab, Institute of Biomedical Engineering, Polytechnique Montréal, Montréal, QC, Canada
MILA - Québec AI Institute, Montréal, QC, Canada
jcohen@polymtl.ca
\And
Aix Marseille Univ, CNRS, CRMBM, Marseille, France
APHM, CHU Timone, Pôle d’Imagerie Médicale, CEMEREM, Marseille, France
virginie.callot@univ-amu.fr
\And
Aix Marseille Univ, CNRS, CRMBM, Marseille, France
APHM, CHU Timone, Pôle d’Imagerie Médicale, CEMEREM, Marseille, France
arnaud.le-troter@univ-amu.fr
Abstract
The spinal cord (SC), which conveys information between the brain and the peripheral nervous system, plays a key role in various neurological disorders such as multiple sclerosis (MS) and amyotrophic lateral sclerosis (ALS), in which both gray matter (GM) and white matter (WM) may be impaired. While automated methods for WM/GM segmentation are now largely available, these techniques, developed for conventional systems (3T or lower) do not necessarily perform well on 7T MRI data, which feature finer details, contrasts, but also different artifacts or signal dropout.
The primary goal of this study is thus to propose a new deep learning model that allows robust SC/GM multi-class segmentation based on ultra-high resolution 7T T2*-w MR images. The second objective is to highlight the relevance of implementing a specific data augmentation (DA) strategy, in particular to generate a generic model that could be used for multi-center studies at 7T.
Keywords 7T Spinal cord MRI white matter gray matter multi-class segmentation deep-learning k-Folding Cross-Validation data augmentation ivadomed spinal cord toolbox SCT
1 INTRODUCTION
MRI of the human spinal cord (SC) is a routine clinical procedure that is conventionally performed at a magnetic field strength of 1.5 or 3 Tesla. Recently, Ultra-High Field (UHF) scanners (at 7T Barry et al. (2018) or higher Geldschläger et al. (2021)) have shown great potentialities over conventional systems, as they offer better signal-to-noise ratio (SNR) and contrast-to-noise ratio (CNR) that could be traded for better spatial resolution and increased detection of anatomical and pathological features. Consequently, 7T SC MRI has become an interesting tool for research aimed at improving both clinical diagnosis and description of white matter and gray matter (WM/GM) cord abnormalities. To extract WM/GM information, the segmentation process is an essential method. The two boundaries to be delineated are the WM/CSF (cerebrospinal fluid, surrounding to the cord) and WM/GM (external contour of GM) interfaces. As manual segmentation is time consuming, especially for GM, and has been demonstrated on a very large multi-center study not to be very reproducible, both inter- and intra-experts (Prados et al. Prados et al. (2017)), several fully automated segmentation techniques have been proposed to the community over the last ten years. In their literature review of 2016, De Leener et al De Leener et al. (2016) detailed the methods available at that time, most of which were based on atlases and registration De Leener et al. (2018)Massire et al. (2020) or label fusion Asman et al. (2013). More recently, and with the emergence and success of deep-learning (DL) approaches that are increasingly used for medical image analysis, and especially for MRI segmentation tasks, several models derived from U-Net Ronneberger et al. (2015) architectures have proven to be very efficient and robust for GM Perone et al. (2018) and SC segmentation Gros et al. (2019).
Most of these methods and models have been made available open-source within the spinal cord toolbox (SCT) De Leener et al. (2017), and hence allow the community to contribute to new models that can be implemented quickly on an optimized architecture for SC. It is worth noting that SCT is additionally compatible with the PyTorch models implemented in the recent ivadomed toolbox Gros et al. (2021), an open-source python package used for the design, end-to-end training and evaluation of new DL models applied to medical imaging data. One particularly useful feature in ivadomed is the data loader that can parse participants’ image and metadata for custom data splitting or additional information during training and evaluation, provided that datasets are organized according to the Brain Imaging Data Structure (BIDS) Gorgolewski et al. (2016).
Nonetheless, most of the segmentation methods proposed so far and mentioned above have been widely applied and validated in the context of 3T MRI. With the emergence of 7T systems, SC images with ultra-high spatial resolution (UHR) and contrasts are collected, revealing new details, such as nerve roots or blood vessels, and artifacts or signal drop out, that may challenge existing segmentation methods. The main objective of this study was thus to propose a dedicated approach for 7T SC MRI segmentation, based on an optimized ivadomed model to be integrated in SCT (via the new sct_deepseg function).
The proposed model is based on T2*-weighted images with different spatial resolutions from healthy and pathological subjects. The resulting variability introduced in the MRI database, cumulated with different variants of data augmentation, aimed at avoiding overfitting during the training. A feasibility study was conducted to highlight the relevance of implementing a specific data augmentation strategy that would be robust in the presence of artifacts or intrinsic variability of multi-center acquisitions.
2 MATERIALS AND METHODS
2.1 Participants
A total of 77 subjects were included in this retrospective study. The imaging protocol was approved by local Ethics Committees and written consents were obtained from all subjects prior to MR examinations.
2.2 Monocentric and multicentric datasets
A large monocentric dataset (DS1) was first constructed for development purpose using 72 subjects, including 34 Healthy Controls (HC), 25 patients with Amyotrophic Lateral Sclerosis (ALS), 13 patients with Multiple Sclerosis (MS), scanned in Marseille (France) using a 7T Magnetom system (Siemens, Erlangen, Germany) and an 8-channel Tx/Rx neck coil (Rapid Biomedical, Rimpar, Germany). A second smaller multicentric dataset (DS2), used to assess the model ability to generalize to new acquisition conditions, was composed of 5 HC, acquired in 3 different 7T MR scanners/centers (Zurich (7T Terra, Rapid Biomedical coil), New York (7T Magnetom, home-made volume coil), and Marseille (7T Terra, Rapid Biomedical coil)).
2.3 Image acquisition
All images were acquired using a 2D multi-echo T2*-weighted GRE sequence. Slices were positioned from C1 to C7, in the axial plane, perpendicular to the cord. High, Medium and Low-resolution series (HR, MR, LR, respectively) were acquired (depending on time constraint and investigation purpose). Acquisition parameters for HR are detailed in Massire et al. (2016). Table 1 describes the total number of slices and subjects acquired for each resolution, subject category, and datasets.
| DS | Acq | Res | Th | Matrix | N | Group |
| DS1 | HR | 2.2 | 832x1024 | 26 | (78,0,89) | |
| HR | 4 | 832x1024 | 1 | (13,0,0) | ||
| MR | 5 | 468x576 | 42 | (267,283,0) | ||
| LR | 3.3 | 348x348 | 3 | (15,0,0) | ||
| DS2 | MR | 6 | 500x500 | 1 | (12,0,0) | |
| MR | 6.6 | 304x512 | 1 | (9,0,0) | ||
| LR | 2.2 | 384x384 | 1 | (7,0,0) | ||
| MR | 2.5 | 468x576 | 2 | (34,0,0) |
To increase signal- and contrast-to-noise of anatomical images, Multi Echo Data Image Combination (MEDIC) images were generated from multi-echo T2*-w series by computing the sum of squares of the image from each echo. The meanstdev number of slices per subject was 13.95.9. SC and GM masks were manually segmented for each slice when possible, by two different raters (MS patient group the first rater (XX), and ALS patient group for the second (XX), with an equivalent split for the HC group).
2.4 Pre-processing for bids dataset organization
A pipeline was developed for data BIDS organization (Fig. 1). Each T2*-w slice was resliced at the highest resolution HR of and cropped using a bounding box of pixels centered in the SC area. In this present study, the centering step was done using the barycenter of the mask of manual segmentation but will have to be automated in the future. A linear interpolation was applied during the reslicing step.
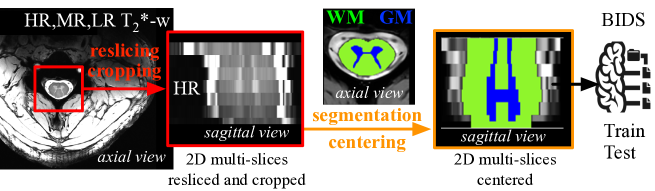
Finally, the complete database was organized in the BIDS convention, with one folder per subject containing the stacked anatomical T2*-w images and the corresponding segmentation (Ground TruthGT) with binary masks of the spinal cord (SCWMGM) and GM.
A total of 807 slices (out of the 1056 anatomical images initially acquired) were processed and included in the BIDS database, separated into the 2 datasets (745 images for DS1 and 62 images for DS2 respectively). The remaining (249 images), corresponds to data that could not be segmented by the experts because of important artifacts or a too lower GM/WM contrast that would induce an uncertainty in the depiction of tissue boundaries. On these criteria, a total of 6.4% for SC and 23.4% for GM were rejected.
2.5 Post-processing and experimental designs
In a first experimental design (Exp1), the monocentric dataset DS1 was used to assess the relevance of simultaneously optimizing a single model with multi-class segmentation (MCS), as compared to two separate single-class segmentation models (SCS), for the automatic segmentation of SC and GM classes. In a second experimental design (Exp2), different Data Augmentation (DA) strategies were compared using DS1 and the multicentric dataset DS2. Two pre-trained segmentation models for GM and SC regions from SCT, respectively run by the functions sct_deepseg_gm Perone et al. (2018) and sct_deepseg_sc Gros et al. (2019), were additionally used to perform an automatic segmentation, considered as a reference model, called “SCT” in this study.
2.5.1 Exp1: Single-class (x2) vs Multi-class (x1) models
To compare the single-class and multi-class models, a k-fold validation method was adopted Fig.2. This approach consists in a Cross-Validation (CV) method that has been demonstrated to be robust and efficient when the sample is limited. For this, 9 folds were established. For each fold (from 0 to 8), the data were distributed as recommended in the literature, i.e. a split corresponding approximately to 70% for the Train set, 15% for the Validation set and 15% for the Test set. Fig.2a gives the schematic representation of distribution of the 9 folds.
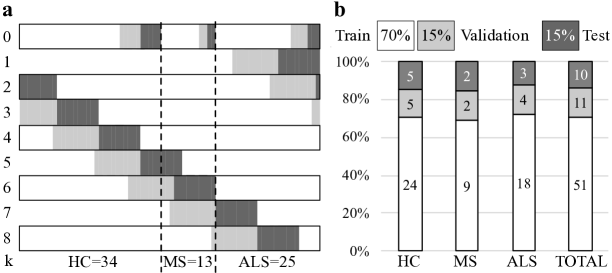
An approximation in the constitution of the sets (not always containing the same number of images) had to be performed, due to the fact that the number of subjects per group and the number of slices per subjects were neither equals nor proportional to the 70/15/15 ratio. The constraint was that for each fold, no slice of the same patient could appear in 2 different sets among Train/Validation/Test. The fold 0 was performed taking into account the heterogeneity of the subject group, with the respect of the 70/15/15 proportion for each category (HC,MS,ALS), as detailed in Fig.2b.
2.5.2 Exp2: Data Augmentation (DA) strategies
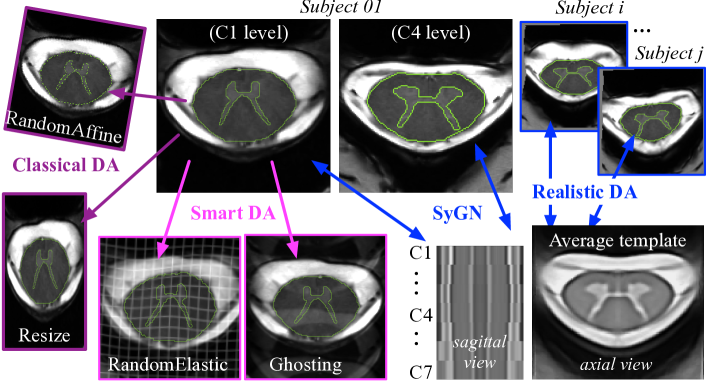
This study also aimed at exploring the impact of data augmentation (DA) for the generalization of the best multi-class model (MCS) (here fold-0, see Results part). For this purpose, different DA strategies were evaluated on DS1 and DS2, with an original contribution consisting in a new approach (called "Hybrid_DA") based on a set of realistic geometric transformations ("Realistic DA"), combined with both "Smart DA" and "Classical DA" strategies (Fig.3). The TorchIO python Library Pérez-García et al. (2021) was used to generate a set of "Smart" transformations, mimicking MRI-specific effects such as ghosting effect and motion artifacts (Fig.3, pink color). The classical DA (such as resize or random affine transformations) was obtained using the default implementation in ivadomed (Fig.3, purple color). Our “Realistic DA” (Fig.3, blue color) was constructed by the estimation of inter-subject registrations using Symmetric Group-wise Normalization approach (SyGN, Avants et al. (2010)Avants et al. (2007)), and the use of the script antsMultivariateTemplateConstruction.sh from ants Library Avants et al. (2014). The resulting template space made it possible to compose several inter-subject deformation fields. The process more specifically consisted in morphing a slice of the Subject i into a slice of the Subject j, thus mixing the contrast of a subject with the anatomy of another subject (and vice versa). For each slice of all N subjects, a set of (N-1) slices with realistic contrasts and correct anatomy were thus generated.
To compare the performance of our Hybrid_DA strategy, other models were evaluated, including Without_DA (no augmentation), Classical_DA (DA implemented by default in ivadomed, like random affine transformations) and SCT (GM and SC models in SCT).
2.6 Statistics and evaluation metrics
To evaluate all segmentations compared to manual segmentation (GT), the Dice Similarity Coefficient (DSC), the Hausdorff distance (HDRFDST), and the Volumetric Similarity (VOLSMTY) were computed on each 2D slice, using the “EvaluateSegmentation” Tool Taha and Hanbury (2015). DSC values of each method were evaluated through a one-way analysis of variance (Nonparametric Wilcoxon test, with a level of significance defined as , corrected for multiple comparisons) were used to compare performance among each method. The latter included a quantification of DSC outliers, which was carried out considering the 95% confidence intervals for the mean and with a 15% of trimming (for the calculation of truncated mean values).
3 RESULTS AND DISCUSSION
3.1 SCS vs MCS using k-fold-CV (Exp1)
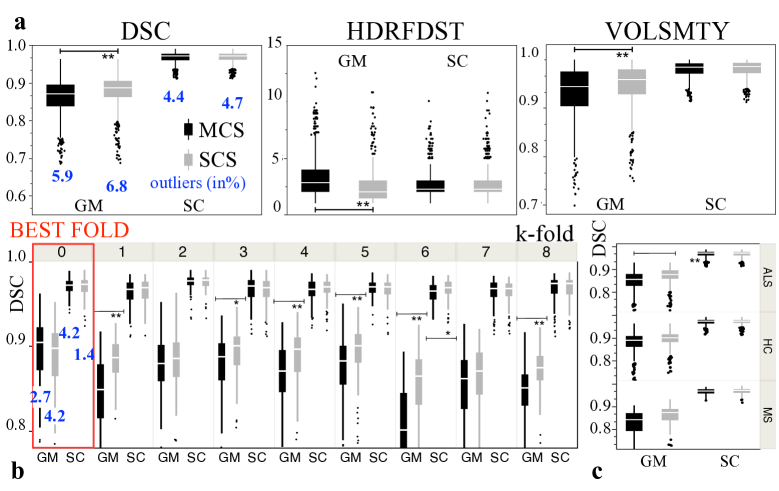
Using all testing sets of DS1 and considering all folds, significantly higher DSC, VOLSMTY and lower HDRFDS values (corrected for multiple comparisons ** ) were observed in average in SCS compared to MCS for GM class, without significant difference for SC class (see Fig.4a). Truncated mean DSC values were vs for GM, and vs for SC, for SCS and MCS, respectively (all outliers excluded). Seven out of 9 folds showed the same result (**SCSMCS) (see Fig.4b) and similar observation was made for each subject category (ALS, HC, MS) (see Fig.4c). However, the best fold (estimated on the fold 0, highlighted in red on Fig.4b) presented with no difference between SCS vs MCS ( and for GM and and for SC), respectively, with slightly higher results for MCS. For all folds, the percentages of outliers were 6.8% and 5.9% for GM and 4.7% and 4.4% for SC, respectively for SCS and MCS.
3.2 Impact of DA and comparison with existing SCT models (Exp2)
For fold 0 on DS1, significantly higher DSC values were observed (cf. Fig.5a) for all proposed DA approaches compared to SCT models, for both GM and SC classes. Surprisingly, the Without_DA model showed high performance on DS1, but as expected from the state-of-the art, collapsed on DS2 (lower mean and higher standard deviation and outliers (cf. Fig.5b)), which reinforces the interest of DA to increase robustness and built a model more generalizable.
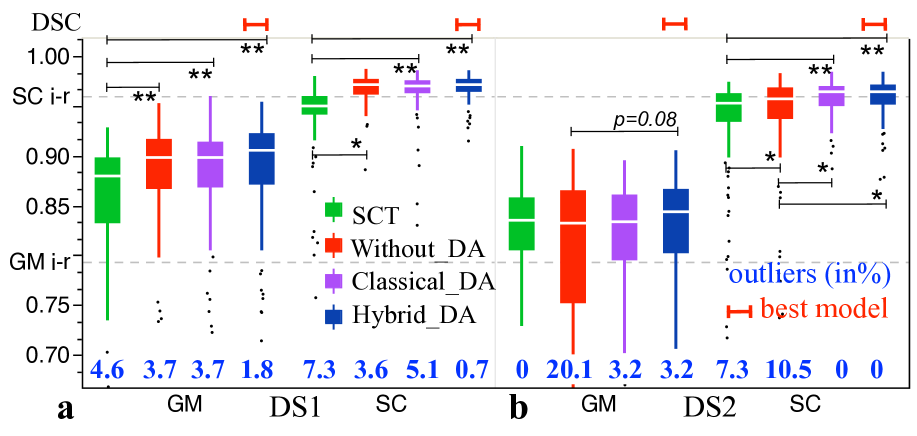
For DS1, truncated mean DSC values for SCT, Without_DA, Classical_DA and Hybrid_DA models were respectively , , and for GM and , , and for SC, and for DS2 , , and for GM and , , and for SC.
4 CONCLUSION
This study highlights the interest of training a specific model containing images of healthy controls and patients at different spatial resolutions for the segmentation of UHR images acquired at 7T, showing very high performances (the best model Hybrid_DA trained on the best fold gives a truncated mean DSC= for GM, and DSC= for SC), significantly better than the existing models trained on images acquired at 1.5T and 3T.
Single-class models showed in average a better performance than multi-class models, especially for GM segmentation, but required two trainings instead of one and especially two inferences. Nonetheless, the best performances (higher similarity metrics, faster training time and lower percentage of outliers) were ultimately obtained using the multi-class segmentation (fold 0). This model was enriched by integrating a hybrid data augmentation (composed of "classical" geometric transformations, artifacts and real GM/WM contrasts distorted with anatomically constrained deformation fields), inspired by the recent study of Zhao et al.Zhao et al. (2019) which addresses the problem of realistic aspect of augmented data using a transformation learned by a convolutional neural network. Further testing and applications on external data are now required to fully evaluate the added value of our approach. In that perspective, our best model was added as the Spinal Cord Toolbox (SCT) and made publicly available on the ivadomed github repository.
5 Acknowledgments
None of the authors have potential conflicts of interest to disclose. The authors sincerely thank R. Dintrich and S. Demortière from CRMBM-CEMEREM (Marseille, France) for SC/GM manual segmentation, as well as M. Seif and J. Vannesjö from Balgrist University Hospital (Zürich, Switzerland) and A. Seifert from the Biomedical Engineering and Imaging Institute (Mount Sinai, NY, USA) for providing external 7T SC MR dataset. This work was performed in a laboratory member of France Life Imaging network (grant ANR-11-INBS-0006) and supported by the French Centre National de la Recherche Scientifique, the Marseille Imaging Institute, the NeuroMarseille Institute, ARSEP (Fondation pour l’Aide à la Recherche sur la Sclérose En Plaques), Fondation Thierry Latran, and MarMaRa Institute (Marseille Maladies rares).
6 Compliance with ethical standards
The study was approved by the local ethics committee (Comité de Protection des Personnes Sud-Méditerranée I, ID RCB : 2011-A00929-32), and written informed consent was obtained before MR imaging for all subjects.
References
- Barry et al. [2018] Robert L. Barry, S. Johanna Vannesjo, Samantha By, John C. Gore, and Seth A. Smith. Spinal cord MRI at 7T. NeuroImage, 168:437–451, March 2018. ISSN 1095-9572.
- Geldschläger et al. [2021] Ole Geldschläger, Dario Bosch, Nikolai I. Avdievich, and Anke Henning. Ultrahigh-resolution quantitative spinal cord MRI at 9.4T. Magnetic Resonance in Medicine, 85(2):1013–1027, 2021. ISSN 15222594. Number: 2.
- Prados et al. [2017] Ferran Prados, John Ashburner, Claudia Blaiotta, Tom Brosch, Julio Carballido-Gamio, Manuel Jorge Cardoso, Benjamin N. Conrad, Esha Datta, Gergely Dávid, Benjamin De Leener, Sara M. Dupont, Patrick Freund, Claudia A.M. Gandini Wheeler-Kingshott, Francesco Grussu, Roland Henry, Bennett A. Landman, Emil Ljungberg, Bailey Lyttle, Sebastien Ourselin, Nico Papinutto, Salvatore Saporito, Regina Schlaeger, Seth A. Smith, Paul Summers, Roger Tam, Marios C. Yiannakas, Alyssa Zhu, and Julien Cohen-Adad. Spinal cord grey matter segmentation challenge. NeuroImage, 152:312–329, May 2017. ISSN 10538119.
- De Leener et al. [2016] Benjamin De Leener, Manuel Taso, Julien Cohen-Adad, and Virginie Callot. Segmentation of the human spinal cord. Magnetic Resonance Materials in Physics, Biology and Medicine, 29(2):125–153, April 2016.
- De Leener et al. [2018] Benjamin De Leener, Vladimir S. Fonov, D. Louis Collins, Virginie Callot, Nikola Stikov, and Julien Cohen-Adad. PAM50: Unbiased multimodal template of the brainstem and spinal cord aligned with the ICBM152 space. NeuroImage, 165:170–179, January 2018. ISSN 10538119.
- Massire et al. [2020] Aurélien Massire, Henitsoa Rasoanandrianina, Maxime Guye, and Virginie Callot. Anterior fissure, central canal, posterior septum and more: New insights into the cervical spinal cord gray and white matter regional organization using T1 mapping at 7T. NeuroImage, 205:116275, January 2020. ISSN 1095-9572.
- Asman et al. [2013] Andrew J. Asman, Seth A. Smith, Daniel S. Reich, and Bennett A. Landman. Robust GM/WM segmentation of the spinal cord with iterative non-local statistical fusion. Medical image computing and computer-assisted intervention: MICCAI, 16(Pt 1):759–767, 2013.
- Ronneberger et al. [2015] Olaf Ronneberger, Philipp Fischer, and Thomas Brox. U-Net: Convolutional Networks for Biomedical Image Segmentation. arXiv 1505.04597, May 2015.
- Perone et al. [2018] Christian S. Perone, Evan Calabrese, and Julien Cohen-Adad. Spinal cord gray matter segmentation using deep dilated convolutions. Scientific Reports, 8(1), April 2018. ISSN 2045-2322.
- Gros et al. [2019] Charley Gros, Benjamin De Leener, Atef Badji, Josefina Maranzano, Dominique Eden, Sara M. Dupont, Jason Talbott, Ren Zhuoquiong, Yaou Liu, Tobias Granberg, Russell Ouellette, Yasuhiko Tachibana, Masaaki Hori, Kouhei Kamiya, Lydia Chougar, Leszek Stawiarz, Jan Hillert, Elise Bannier, Anne Kerbrat, Gilles Edan, Pierre Labauge, Virginie Callot, Jean Pelletier, Bertrand Audoin, Henitsoa Rasoanandrianina, Jean-Christophe Brisset, Paola Valsasina, Maria A. Rocca, Massimo Filippi, Rohit Bakshi, Shahamat Tauhid, Ferran Prados, Marios Yiannakas, Hugh Kearney, Olga Ciccarelli, Seth Smith, Constantina Andrada Treaba, Caterina Mainero, Jennifer Lefeuvre, Daniel S. Reich, Govind Nair, Vincent Auclair, Donald G. McLaren, Allan R. Martin, Michael G. Fehlings, Shahabeddin Vahdat, Ali Khatibi, Julien Doyon, Timothy Shepherd, Erik Charlson, Sridar Narayanan, and Julien Cohen-Adad. Automatic segmentation of the spinal cord and intramedullary multiple sclerosis lesions with convolutional neural networks. NeuroImage, 184:901–915, January 2019. ISSN 1053-8119.
- De Leener et al. [2017] Benjamin De Leener, Simon Lévy, Sara M. Dupont, Vladimir S. Fonov, Nikola Stikov, D. Louis Collins, Virginie Callot, and Julien Cohen-Adad. SCT: Spinal Cord Toolbox, an open-source software for processing spinal cord MRI data. NeuroImage, 145(Pt A):24–43, January 2017. ISSN 1095-9572. Number: Pt A.
- Gros et al. [2021] Charley Gros, Andreanne Lemay, Olivier Vincent, Lucas Rouhier, Marie-Helene Bourget, Anthime Bucquet, Joseph Paul Cohen, and Julien Cohen-Adad. ivadomed: A Medical Imaging Deep Learning Toolbox. Journal of Open Source Software, 6(58):2868, February 2021. ISSN 2475-9066. Number: 58.
- Gorgolewski et al. [2016] Krzysztof J. Gorgolewski, Tibor Auer, Vince D. Calhoun, R. Cameron Craddock, Samir Das, Eugene P. Duff, Guillaume Flandin, Satrajit S. Ghosh, Tristan Glatard, Yaroslav O. Halchenko, Daniel A. Handwerker, Michael Hanke, David Keator, Xiangrui Li, Zachary Michael, Camille Maumet, B. Nolan Nichols, Thomas E. Nichols, John Pellman, Jean-Baptiste Poline, Ariel Rokem, Gunnar Schaefer, Vanessa Sochat, William Triplett, Jessica A. Turner, Gaël Varoquaux, and Russell A. Poldrack. The brain imaging data structure, a format for organizing and describing outputs of neuroimaging experiments. Scientific Data, 3(1):160044, June 2016. ISSN 2052-4463.
- Massire et al. [2016] Aurélien Massire, Manuel Taso, Pierre Besson, Maxime Guye, Jean-Philippe Ranjeva, and Virginie Callot. High-resolution multi-parametric quantitative magnetic resonance imaging of the human cervical spinal cord at 7T. NeuroImage, 143:58–69, December 2016. ISSN 1095-9572.
- Pérez-García et al. [2021] F. Pérez-García, R. Sparks, and S. Ourselin. TorchIO: a Python library for efficient loading, preprocessing, augmentation and patch-based sampling of medical images in deep learning. Comput. Methods Programs Biomed., 2021.
- Avants et al. [2010] Brian B. Avants, Paul Yushkevich, John Pluta, David Minkoff, Marc Korczykowski, John Detre, and James C. Gee. The optimal template effect in hippocampus studies of diseased populations. NeuroImage, 49(3):2457–2466, February 2010. ISSN 1053-8119. Number: 3.
- Avants et al. [2007] B. B. Avants, J. T. Duda, H. Zhang, and J. C. Gee. Multivariate normalization with symmetric diffeomorphisms for multivariate studies. Medical image computing and computer-assisted intervention: MICCAI … International Conference on Medical Image Computing and Computer-Assisted Intervention, 10(Pt 1):359–366, 2007.
- Avants et al. [2014] Brian B. Avants, Nicholas J. Tustison, Michael Stauffer, Gang Song, Baohua Wu, and James C. Gee. The Insight ToolKit image registration framework. Frontiers in Neuroinformatics, 8:44, 2014. ISSN 1662-5196. doi:10.3389/fninf.2014.00044.
- Taha and Hanbury [2015] Abdel Aziz Taha and Allan Hanbury. Metrics for evaluating 3D medical image segmentation: analysis, selection, and tool. BMC Medical Imaging, 15(1):29, December 2015. ISSN 1471-2342. Number: 1.
- Zhao et al. [2019] Amy Zhao, Guha Balakrishnan, Frédo Durand, John V. Guttag, and Adrian V. Dalca. Data augmentation using learned transformations for one-shot medical image segmentation. arXiv 1902.09383, April 2019.