Bandgap tuning in kerfed metastrips under extreme deformation
Abstract
The process of kerfing enables planar structures with the ability to undergo dramatic out-of-plane deformation in response to static loads. Starting from flat and stiff sheets, kerfing allows for the formation of a wide variety of unconventional free-form shapes, making the process especially attractive for architectural applications. In this work, we investigate numerically and experimentally the bandgap behavior of densely cut kerfed strips. Our study reveals a rich landscape of bandgaps that is predominantly ascribable to the activation of resonant sub-units within the kerf unit cells. We also document how the extreme deformability of the strips under twisting and bending loads, enhanced by the meandering cut pattern, can serve as a powerful bandgap tuning mechanism.
Kerfing (or relief cutting) is a perforation process consisting of introducing an intricate, periodic pattern of cuts, referred to as a kerf, in a thin structure in a fashion aimed at deliberately increasing its compliance Kalantar2018_CAADRIA ; Mitov2018_NNJ . Kerfing can be performed via laser or water-jet cutting on a variety of material platforms, including composites, such as medium-density fiberboard (MDF), and metals like aluminum or steel. The spatial periodicity makes the design of kerf patterns easily achievable via automatic generation algorithms Zarrinmehr2017_CG .
By removing solid material and leaving behind a network of interconnected slender elements, kerfing endows an initially flat, homogeneous and relatively stiff sheet with an excess of compliance, making it capable of undergoing dramatic out-of-plane deformation in response to static loads Chen2020_ActaMech . It is possible to classify kerf patterns according to three archetypal genealogies Kalama2020 : 1) linear-cut patterns, involving only parallel cuts and leading to single curvature; 2) offset patterns, in which straight cuts are offset and connected at given angles, allowing double curvature; 3) meandering patterns (the focus of this Letter), featuring tightly interlocking chiral cuts realizable with a variety of cut densities, also conducive to double curvature. The small-scale heterogeneity of densely cut meandering kerfs endows them with extreme deformability that enables morphing into free-form structures. Deformations typically occur within the elastic limit of the material, and are fully reversible upon unloading although, working with composites, it is possible to lock the deformed shapes using epoxy resins. With respect to their ability to undergo large deformation as a result of strategically placed cuts, kerfed sheets are conceptually similar to kirigami structures Zhang2015_PNAS ; Tang2019_PNAS and structures in which out-of-plane instabilities are promoted by a cut pattern Cho2014_PNAS ; Celli2018_SM .
Kerfed panels are especially appealing for architectural applications, where free-form structures have become increasingly ubiquitous for the design of building facades Pottmann2008_ACM ; Andrade2017_FoAR thanks to their ability to meet simultaneously aesthetic and functional requirements. In this context, kerfed sheets represent a light-weight material that naturally lends itself to being reconfigured in free-form shapes of diverse, pre-designed complexity. An additional benefit lies in the fact that kerfed sheets can be shipped flat and easily deformed on-site before installation, with major implications for transportation and logistics.
The periodic microstructure of kerfs allows classifying them as examples of elastic phononic crystals (PCs) and metamaterials Kushawaha1993_PRL ; Sigalas1993_SSC ; Jensen2003_JSV ; Khelif2006_PhysRevE ; Spadoni2009_WM , as well as a special subfamily of perforated plates Slot1971_JEI ; Jing2000_AIAA ; Pedersen2004_SMO ; Hedayatrasa_2016_JMPS . We therefore expect them to exhibit a whole array of dynamical properties classically observed in PCs, and specifically the ability to open bandgaps Liu2000_Science ; Martinsson2003_QJMAM ; Gonella2008_JSS ; Hsu2010_APL ; Wang2015_PhyRevB . The first objective of this study is to assess the effectiveness of kerfed structures as bandgap materials. Recently, significant interest has revolved around the design of tunable structures capable of adjusting their behavior in response to externally applied stimuli. A number of strategies have been proposed, in which the tuning is brought about via electro-mechanical Casadei2012_JAP or magneto-mechanical Bilal2017_AdvM ; Schaeffer2015_JAP coupling, or by deformation or buckling WangCasadei2014_PRL . In this vein, the second objective of this study is to assess whether the intrinsic extreme deformability of kerfs can be leveraged as an effective tuning mechanism.
Here we focus our attention on kerfed strips, obtained by tessellating in one dimension a macro-cell consisting of a finite number of kerf cells. This choice is motivated by the extreme deformability and reconfigurability that are achievable working with strips, even under relatively small loads. The deformability of the strips results from the combined effect of the compliance inherently provided by their slenderness and the geometric softening introduced by the kerfing process.
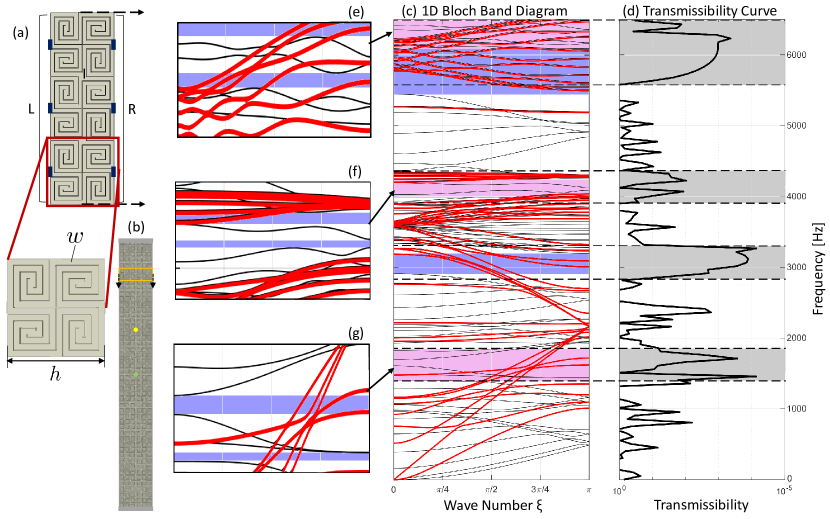
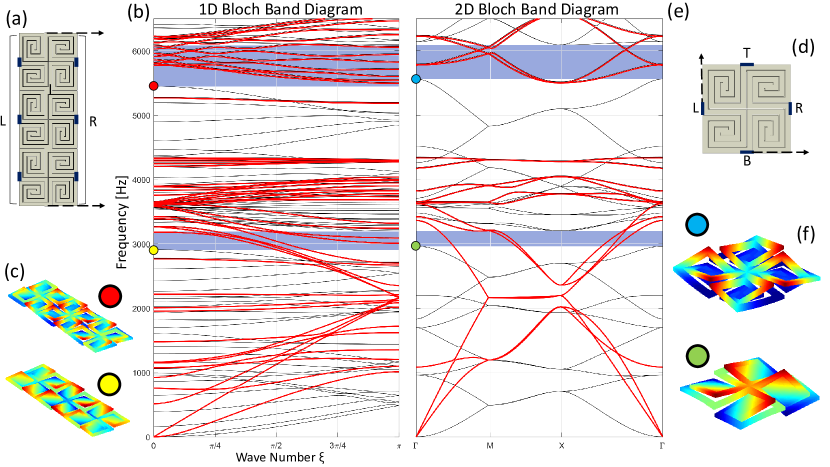
Let us model a strip as shown in Fig. 1(b) via 1D tessellation of the three-cell-wide macro-cell with a densely cut kerfing pattern shown in Fig. 1(a). The geometry of the kerf is as follows: cell size , ligament width and out-of-plane strip thickness . We assume the material properties of 304 stainless steel: Young’s modulus , Poisson’s ratio = 0.27 and density = 7870 . We build a finite element (FE) model of the macro-cell, using a mesh of 8-node isoparametric elements featuring two elements through the thickness. This modeling process is done using the software GMSH Geuzaine_GMSH . To obtain a band diagram, we follow the canonical steps of 1D Bloch analysis, whereby we apply 1D Bloch conditions between the L and R edge nodes, here confined to the protruding elements marked in blue, leaving the other edges free. We then sweep the scalar non-dimensional wavenumber in the irreducible Brillouin zone, and, for each , we solve an eigenvalue problem involving the reduced stiffness and mass matrices of the macro-cell, yielding the macro-cell dispersion branches. The end result is the band diagram of Fig. 1(c), whose high modal density stems from the ability of the 3D FE model to capture all wave polarizations. Through a comparison of the branches against those obtained from a companion planar model of the macro-cell based on 2D elasticity (details in the SM), we can discriminate the strictly in-plane modes, marked in bold red, from those that possess significant out-of-plane character, shown in black. While no total bandgaps are found in the frequency interval of interest, we recognize two flexural bandgaps, marked in purple, in which flexural modes are evanescent but in-plane waves are allowed to propagate.
We complement Bloch analysis with a full-scale steady-state analysis on the 324 kerfed strip depicted in Fig. 1(b). We prescribe fixed boundary conditions at both ends and we apply a sustained harmonic excitation at the mid point (green dot), sweeping the frequency. The displacement is sampled at the point marked by the yellow dot and normalized by the displacement of the excitation point to construct a curve of transmissibility vs. frequency, plotted in Fig. 1(d). The curve features several regions of attenuation, highlighted in gray. It is clear that only two of these regions can be pinpointed to the major flexural bandgaps discussed above. To elucidate the sources of the other attenuation zones, we zoom in on the corresponding intervals of the band diagram marked in bright pink, detailed in the Fig. 1(e-g) insets. We observe the appearance of clusters of narrower bandgaps, interspersed by nearly flat modes characterized by slow propagation velocities, which, in concert, make these intervals globally unfavorable for transmission.
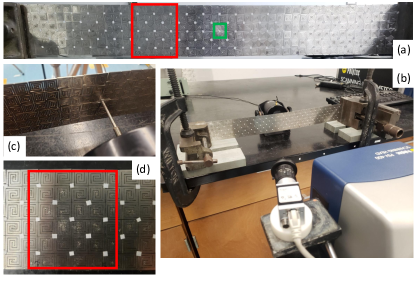
From the numerics, we have evinced a rich bandgap landscape and an even richer availability of transmission attenuation intervals, which suggests that densely cut kerfed strips work efficiently as 1D filters. We now seek experimental validation of these findings through a test whose key features are summarized in Fig. 2. The strip shown in Fig. 2(a) is kerfed from a steel plate according to the geometry used for the model. Fig. 2(b) shows the strip ends clamped using a pair of vices and the scanning head of a laser vibrometer (Polytec PSV-400M-3D, used in 1D mode). The excitation is prescribed out-of-plane with a shaker at the point boxed in green on the rear face of the strip (Fig. 2(c)). The red box denotes the response sampling region; in the Fig. 2(d) detail one can appreciate patches of retro-reflective tape applied at the scan points, conveniently located at the connections between cells where uncut areas are more amenable to scanning.
We prescribe a broadband pseudo-random excitation to excite a broad range of frequencies. A drawback of using this kind of signal is that the shaker output energy spectrum decays sensibly with frequency in the interval of interest, thus failing at supplying enough energy at high frequencies. To overcome this, we apply the signal in 2 kHz increments between 0 and 8 kHz, prescribing higher amplitudes in the upper half of the range, such that a roughly equal amount of energy is injected into the system for all frequencies. We measure the out-of-plane velocity at the designated sampling points, we average them and finally normalize this average by the response of the excitation point to construct a measure of velocity transmissibility, plotted against frequency in Fig. 3(a).
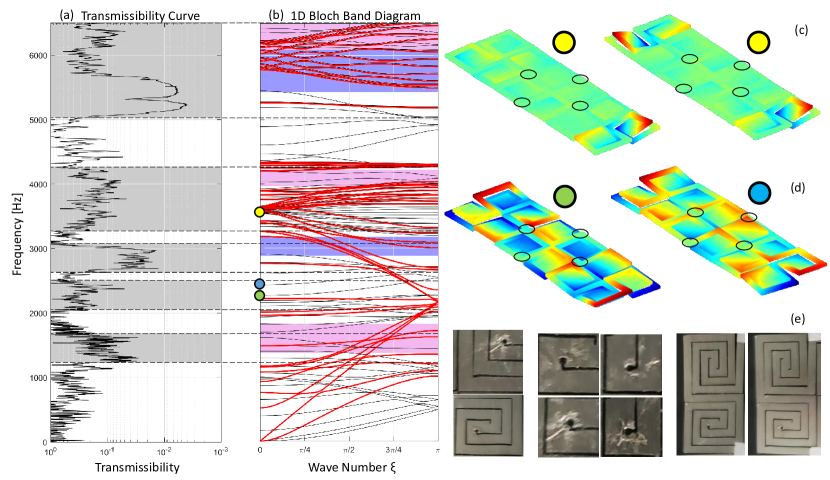
We highlight in gray all the regions of attenuation. Comparing against the band diagram juxtaposed in Fig. 3(b) for reference, we observe an overall satisfactory agreement between these intervals and the regions of attenuation predicted by Bloch analysis. Specifically, we can attribute the large drops in transmissibility starting around 2.6 kHz and 5 kHz to the two major flexural bandgaps highlighted in purple, albeit with some discrepancies in the onset frequencies that we will discuss below. Additionally, we can pinpoint the attenuation zone starting around 1.2 kHz and the upper portion of the one starting at 3.2 kHz to the narrow bandgap clusters previously identified in those intervals.
However, the experimental data displays other dips in transmissibility that cannot be attributed to any obvious attenuation mechanism indicated by the band diagram. Some rationale into this discrepancy can be gained by looking at the mode shapes associated with selected spectral points in these ranges. For example, let us consider the two mode shapes at the spectral point highlighted by the yellow dot at 3.6 kHz, plotted in Fig. 3(c) with color map proportional to the normalized out-of-plane displacement. We observe a localization of deflection at the free edges of the macro-cell (the long sides of the strip), deeming these as waveguide modes germane to the 1D geometry of the strip, while the bulk of the strip experiences negligible motion. The black circles superimposed to the figure mark the location of the scan points where we sample the response. The decision to cluster the sampling in the interior of the strip is dictated by practical difficulties encountered in reliably scanning the peripheral portion of the specimen, mostly due to the abnormal lateral deformation and warping exhibited by the edge cells as the result of the cutting process. We recognize that, at this frequency, our scan point selection cannot pick up any response associated with these modes, thus outputting a spurious attenuation zone. Similar considerations can be made about the mode shapes for the spectral points marked by the green and blue dots plotted in Fig. 3(d). While these are definitely bulk modes, they happen to feature nodes (points experiencing negligible displacements) at the scan point locations, which makes them transparent to our sensing strategy. Here, a denser scan would likely detect this modal response and absorb the apparent bandgap conditions, but such refinement would be prohibitive to achieve with a densely cut kerfed structure. This analysis offers a stark reminder that even experiments conducted with sophisticated measurement tools can detect a variety of attenuation mechanisms that are spurious byproducts of the sensing strategy.
We also report other discrepancies that appear consistently across experimental takes and that cannot be as easily explained by the morphology of the mode shapes or by the sampling procedure. For instance, we observe some frequency downshifts in the experimental data at the onset of both major flexural bandgaps. We believe that the root of these discrepancies lies in a series of defects or geometrical non-idealities embedded in the specimen during the fabrication process, shown in Fig. 3(e), which cause the specimen to deviate from the model. For example, we detect a “waviness” of the cut path that causes a variation in the width of the beams along the kerf pattern. Additionally, we note the presence of fillets where the cutting path terminates, which locally reduce the beams width. Finally, we observe some residual in-plane deformation of the cells located near the edges of the strip, resulting from the lateral pressure exerted during the cutting process. The random distribution of such defects over the specimen domain inevitably relaxes the perfect periodicity assumptions underpinning the numerical model.
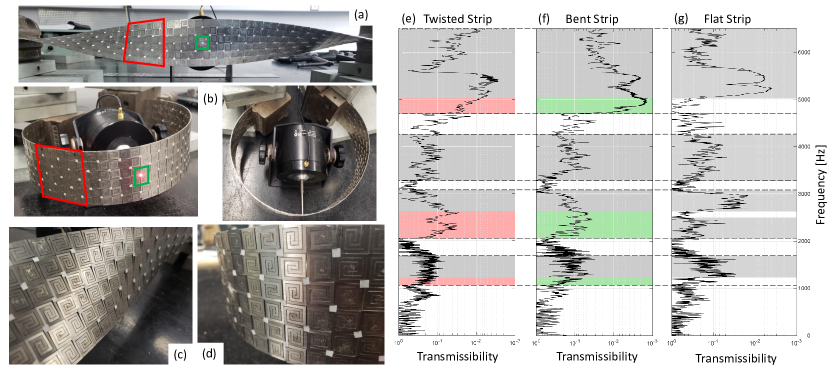
Having established the attenuation behavior of a flat strip, we investigate the possibility to tune its bandgap landscape by subjecting it to a variety of large deformation modes. In our first scenario, we consider a strip twisted by 180∘ from end-to-end, as shown in Fig. 4(a). In the second case, we bend the strip to form a nearly closed loop, as shown in Fig. 4(b). We note that, in both cases, the applied deformation is enabled by a dramatic reconfiguration of the cell’s internal features, which experience localized out-of-plane deflections, effectively “popping” out of the strip plane as shown in Figs. 4(c) and (d). As visible in Figs. 4(a) and (b), the deformation introduces a relative rotation between the sampling region and the excitation region. This warrants a slight modification in our testing protocol, whereby we need to reorient the laser head in-between scans of the two regions to ensure the we always take measurements in a direction locally perpendicular to the strip.
We first examine the transmissibility for the twisted case shown in Fig. 4(e). We observe that the attenuation zones, while overall matching those of the flat strip highlighted in gray and recalled in Fig. 4(g), differ in both shape and width. Specifically, the lowest and highest bandgap openings (around 1 and 5 KHz) display a lower onset compared to their flat strip counterparts, which de facto stretches the intervals of attenuation by the amount marked in pink. Additionally, we observe a merging of the attenuation zones between 2 and 3 KHz, which comes at the expense of the major bandgap depth. Turning our attention to the bending case of Fig. 4(f), we observe a remarkably similar landscape of modifications in the transmissibility curve, here shaded in green. While the available data does not allow reaching a definitive explanation for these corrections, or for their lack of sensitivity to the type of deformation, we propose the following line of interpretation. As the strip deforms, the “pop-out” mechanisms observable in Figs. 4(c) and (d) modify the internal geometry of the cells, thus tuning their resonant characteristics. Incidentally, these geometric modifications are similar between twisting and bending. Since we were able to pinpoint several bandgap formation mechanisms to the resonant behavior of the internal microstructure, it is reasonable to expect these morphological changes in the resonators to affect the onset of bandgaps. Interestingly, the bandgap widening observed here is qualitatively reminiscent of that observed in metamaterials upon randomization of their resonant microstructure Celli2015_APL . The fact that the cell reconfiguration induced by deformation is extremely non-uniform over the strip hints at randomness as a possible co-factor causing these corrections.
In conclusion, we have demonstrated experimentally that kerfed metastrips feature a rich filtering behavior associated with the activation of resonant mechanisms in the kerf cells. This behavior can be modified through the application of extreme twisting and bending deformation, indicating that the compliance induced by kerfing can be leveraged as an effective bandgap tuning mechanism.
The authors acknowledge support from the National Science Foundation (EAGER grant CMMI - 1911678). N.G. also acknowledges partial support from NSF grant CMMI - 1913688. We are grateful to A. Muliana at Texas AM for useful discussions.
References
- [1] N. Kalantar and A. Borhani. Informing deformable formworks - parameterizing deformation behavior of a non-stretchable membrane via kerfing. Proceedings of the 23rd CAADRIA Conference, 2:339–348, 2018.
- [2] D. Mitov, B. Tepavcevic, V. Stojaković, and I. Bajšanski. Kerf bending strategy for thick planar sheet materials. Nexus Network Journal, 21, 10 2018.
- [3] S. Zarrinmehr, M. Ettehad, N. Kalantar, A. Borhani, S. Sueda, and E. Akleman. Interlocked archimedean spirals for conversion of planar rigid panels into locally flexible panels with stiffness control. Computers & Graphics, 66, 06 2017.
- [4] R. Chen, C. Turman, M. Jiang, N. Kalantar, M. Moreno, and A. Muliana. Mechanics of kerf patterns for creating freeform structures. Acta Mech, 231:3499–3524, 2020.
- [5] A.-M. Kalama, D. Tzoni, and I. Symeonidou. Kerf bending: A genealogy of cutting patterns for single and double curvature. Proceedings of the 7th International Conference on Geometry and Graphics, 09 2020.
- [6] Y. Zhang, Z. Yan, K. Nan, D. Xiao, Y. Liu, H. Luan, H. Fu, X. Wang, Q. Yang, J. Wang, W. Ren, H. Si, F. Liu, L. Yang, H. Li, J. Wang, X. Guo, H. Luo, L. Wang, Y. Huang, and J. A. Rogers. A mechanically driven form of kirigami as a route to 3d mesostructures in micro/nanomembranes. Proceedings of the National Academy of Sciences, 112(38):11757–11764, 2015.
- [7] Y. Tang, Y. Li, Y. Hong, S. Yang, and J. Yin. Programmable active kirigami metasheets with more freedom of actuation. Proceedings of the National Academy of Sciences, 116(52):26407–26413, 2019.
- [8] Y. Cho, J. Shin, A. Costa, T. A. Kim, V. Kunin, J. Li, S. Lee, S. Yang, H. Han, IS. Choi, and D.J. Srolovitz. Engineering the shape and structure of materials by fractal cut. Proceedings of the National Academy of Sciences, 111, 11 2014.
- [9] P. Celli, C. McMahan, B. Ramirez, A. Bauhofer, C. Naify, D. Hofmann, B. Audoly, and C. Daraio. Shape-morphing architected sheets with non-periodic cut patterns. Soft Matter, 14, 06 2018.
- [10] H. Pottmann. Geometry of architectural freeform structures. Proceedings of the 2008 ACM Symposium on Solid and Physical Modeling, page 9, 1 2008.
- [11] D. Andrade, M. Harada, and K. Shimada. Framework for automatic generation of facades on free-form surfaces. Frontiers of Architectural Research, 6, 06 2017.
- [12] M.S. Kushwaha, P. Halevi, L. Dobrzynski, and B. Djafari-Rouhani. Acoustic band structure of periodic elastic composites. Physical Review Letters, 71(13):2022–2025, 1993.
- [13] M. Sigalas and E. N. Economou. Band structure of elastic waves in two dimensional systems. Solid State Communications, 86(3):141–143, 1993.
- [14] J.S. Jensen. Phononic band gaps and vibrations in one- and two-dimensional mass–spring structures. Journal of Sound and Vibration, 266:1053–1078, 10 2003.
- [15] A. Khelif, B. Aoubiza, S. Mohammadi, A. Adibi, and V. Laude. Complete band gaps in two-dimensional phononic crystal slabs. Physical Review E, 74:046610, Oct 2006.
- [16] A. Spadoni, M. Ruzzene, S. Gonella, and F. Scarpa. Phononic properties of hexagonal chiral lattices. Wave Motion, 46:435–450, 11 2009.
- [17] T. Slot and W.J. O’Donnell. Effective Elastic Constants for Thick Perforated Plates With Square and Triangular Penetration Patterns. Journal of Engineering for Industry, 93(4):935–942, 11 1971.
- [18] X. Jing and X. Sun. Effect of plate thickness on impedance of perforated plates with bias flow. AIAA Journal, 38:1573–1578, 09 2000.
- [19] N.L. Pedersen. Optimization of holes in plates for control of eigenfrequencies. Structural and Multidisciplinary Optimization, 28:1–10, 01 2004.
- [20] S. Hedayatrasa, K. Abhary, M. Uddin, and C.-T. Ng. Optimum design of phononic crystal perforated plate structures for widest bandgap of fundamental guided wave modes and maximized in-plane stiffness. Journal of the Mechanics and Physics of Solids, 89, 01 2016.
- [21] Z.-Y. Liu, X. Zhang, Y.-W. Mao, Y.-Y. Zhu, Z. Yang, C. Chan, and P. Sheng. Locally resonant sonic materials. Science, 289:1734–6, 10 2000.
- [22] P. Martinsson and A. Movchan. Vibrations of lattice structures and phononic band gaps. The Quarterly Journal of Mechanics and Applied Mathematics, 56, 02 2003.
- [23] S. Gonella and M. Ruzzene. Analysis of in-plane wave propagation in hexagonal and re-entrant lattices. Journal of Sound and Vibration, 312:125–139, 04 2008.
- [24] F.-C. Hsu, C.-I. Lee, J.-C. Hsu, T. C. Huang, C.-H. Wang, and P. Chang. Acoustic band gaps in phononic crystal strip waveguides. Applied Physics Letters, 96:051902–051902, 02 2010.
- [25] P. Wang, F. Casadei, S.H. Kang, and K. Bertoldi. Locally resonant band gaps in periodic beam lattices by tuning connectivity. Phys. Rev. B, 91:020103, Jan 2015.
- [26] F. Casadei, T. Delpero, A. Bergamini, P. Ermanni, and M. Ruzzene. Piezoelectric resonator arrays for tunable acoustic waveguides and metamaterials. Journal of Applied Physics, 112, 09 2012.
- [27] O. Bilal, A. Foehr, and C. Daraio. Reprogrammable phononic metasurfaces. Advanced Materials, 29, 08 2017.
- [28] M. Schaeffer and M. Ruzzene. Wave propagation in reconfigurable magneto-elastic kagome lattice structures. Journal of Applied Physics, 117:194903, 05 2015.
- [29] P. Wang, F. Casadei, S. Shan, J. Weaver, and K. Bertoldi. Harnessing buckling to design tunable locally resonant acoustic metamaterials. Physical review letters, 113:014301, 07 2014.
- [30] C. Geuzaine and J.-F. Remacle. Gmsh: A 3-d finite element mesh generator with built-in pre- and post-processing facilities. International Journal for Numerical Methods in Engineering, 79:1309 – 1331, 09 2009.
- [31] P. Celli and S. Gonella. Manipulating waves with lego® bricks: A versatile experimental platform for metamaterial architectures. Applied Physics Letters, 107, 05 2015.
SUPPLEMENTAL MATERIAL
Analogies and differences between 1D and 2D Bloch analysis
In order to emphasize the need to perform 1D Bloch analysis to properly capture the strip dynamics, we also perform a 2D Bloch analysis on a single densely kerfed unit cell with the same geometric and material characteristics, and we compare the results in Fig. 5.
We show, for reference, the macro-cell and the corresponding band diagram for the 1D Bloch analysis in Fig. 5(a) and Fig. 5(b). The 2D Bloch band diagram shown in Fig. 5(e) is computed from Bloch analysis on the densely kerfed unit cell in Fig. 5(d), upon application of Bloch conditions relating the left and right as well as the bottom and top sets of nodes. We observe that the 1D Bloch band diagram features several additional modes compared to its 2D counterpart, which correspond to waveguide modes germane to the strip, in which the deformation is localized along the strip long edges, that cannot be captured by the unit cell analysis.
We find the availability of major flexural bandgaps, highlighted in purple in Fig. 5 to be consistent between the two analyses in terms of both location and width. In the main body of the work, we also observed the availability of smaller bandgaps in the band structure of the macro-cell. These are not present in the 2D Bloch band diagram, hinting at the fact that their opening is related to mechanisms that are uniquely germane to the strip dynamics.
We also want to draw attention to the mode shapes at the onsets of the major flexural bandgaps, which we show for each analysis in Fig. 5(c) and Fig. 5(f), that exhibit strong flexural activation manifesting as the “flapping” of units interior to the kerf pattern. Incidentally, the same type of internal flexural mechanism is consistently identified in both the 1D and 2D Bloch analysis. From these observations, we attribute the opening of the major bandgaps to the activation of resonant behavior in the microstructure of the kerfing pattern. However, it is important to point out that these are not locally resonant mechanisms as conventionally observed in lattices with internal microstructures [21], in which the resonating elements are typically auxiliary components that one can add or remove from the cell without altering the structure’s static stiffness or load-bearing capabilities. Here, the elements that resonate are an integral part of the connective pathways along with the solid portion of the plate that is retained during the cutting process. In a similar vein to the observed behavior of these kerfed structures, analysis of the dynamic response of periodic lattices of beams has shown that resonant bandgaps can be opened by resonance of the connective beams of the lattice [25].
Comparison between dense and coarse cut kerfed cells
We also investigate an alternative meandering cutting pattern featuring less turns in the cutting path, leading to overall widening of the beam elements and a stiffer response. We call this pattern the coarse cut, and we call unit cells with this particular pattern coarsely kerfed or coarse cells.
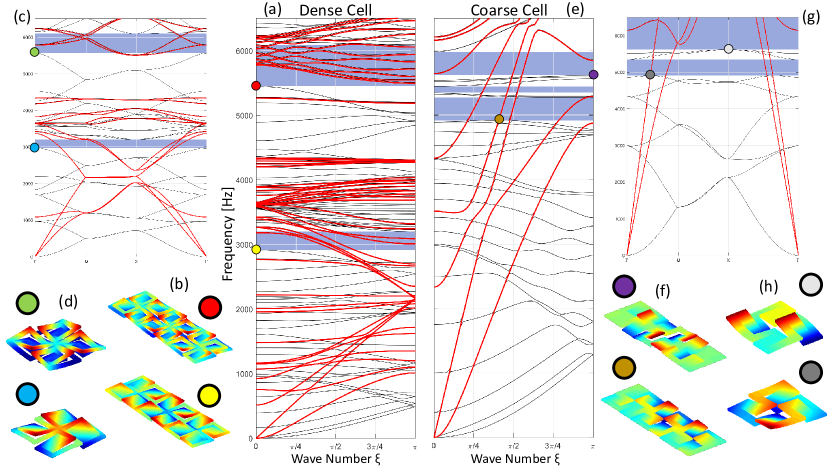
Figs. 6(a-d) feature the now familiar 1D and 2D Bloch analyses as well as mode shapes at the onset of the major bandgaps. Fig. 6(e) shows the band diagram computed from 1D Bloch analysis on a coarsely kerfed macro-cell. Similar to the band diagram of the dense macro-cell, we identify major flexural bandgaps, highlighted in purple. However, we note that the bandgaps of the coarse cell are only clustered at high frequencies, implying that, with this configuration, we are only afforded bandgap behavior in a specific range of our frequency interval of investigation.
We compare the band diagram of the coarse macro-cell to the band diagram of a single coarse unit cell, shown in Fig. 6(g), and we observe good agreement in the location and range of the bandgaps, although we note the existence of a strip mode near 6 kHz in the 1D Bloch band diagram that closes the bandgap of the macro-cell earlier than the corresponding point of the bulk band diagram. From observation of the mode shapes at the onset of the bandgaps of the coarse cell in Fig. 6(f) and Fig. 6(h), we note again significant activation of flexural resonating units in the kerfing pattern, perhaps even more distinct here than in the case of the dense cells.
Strategy to discriminate between strictly in-plane and out-of-plane modes
To distinguish between in-plane and out-of-plane modes of the band diagram, we conduct Bloch analysis on a purely planar model of the kerfed cell (with the same geometric and material parameters) using a 2D mesh of 4-node elements. Such analysis yields a band diagram whose modes are guaranteed to diplsay strictly in-plane character.
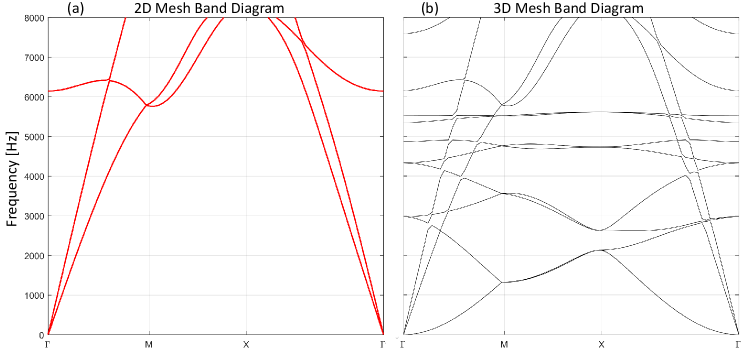
Fig. 7(a) shows the band diagram for a coarsely kerfed unit cell discretized with a 2D FE mesh, and we denote these in-plane modes in bold red to remain consistent with previously shown band diagrams. We compare this band diagram to the band diagram in Fig. 7(b) computed for the 3D model of a coarse unit cell, that captures all possible wave polarizations, i.e., both in-plane and out-of-plane modes. We observe that the red in-plane modes will directly overlie a subset of the modes obtained with the 3D analysis, deeming them as strictly in-plane modes. The remainder branches are therefore recognized as mode characterized by an out-of-plane component. This analysis allows us to immediately identify flexural bandgaps as frequency ranges that do not contain modes with out-of-plane character.
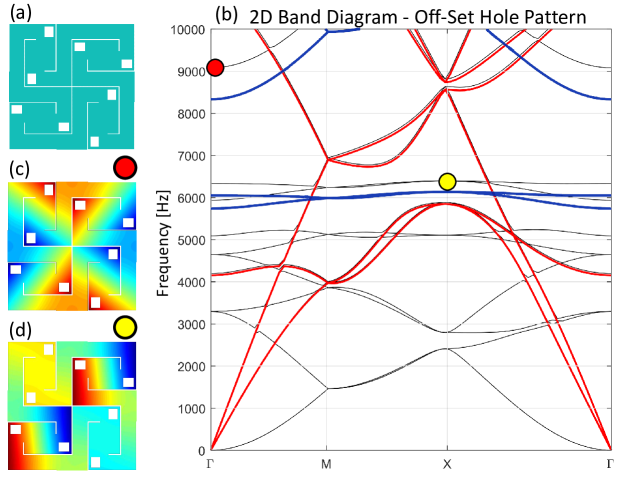
Evidence of resonant behavior via hole placement strategy
We can provide additional insight into the resonant nature of the bandgap-inducing mechanisms by investigating a set of modified kerf patterns featuring off-set micro-perforations. We take a coarsely kerfed cell and introduce small holes at the points shown in Fig. 8(a) with the goal of modifying the band structure in an appreciable capacity.
Fig. 8(b) shows the band diagram of the unit cell with micro-perforations, and we can immediately observe, by comparison with the modes from the band structure of the cell without holes (blue solid lines) that there is a significant upshift in the frequencies of certain modes. Particularly, if we look at the mode marked by the red point, we observe an upshift by several hundreds of Hz afforded by the introduction of the holes. We plot the mode shape corresponding to this spectral point in Fig. 8(c). One can see that the holes have been deliberately placed in regions of the unit cell that experience significant deflection (dark red and dark blue in the color map), alternated by nodes of the mode shape (green regions) with little-to-no displacement.
Let us consider the meandering beam in the interior of each a quarter cell as a structure undergoing flexural deformation, with the node of the mode shape acting as a clamp-like constraint and the regions undergoing large deflections as the free edges. Functionally, notwithstanding the differences in geometry, this can be modeled as a flexural resonator (conceptually analogous to a cantilever platelet), in which the stiffness is predominantly controlled by the elastic properties of the portion close to the root and the inertia by the mass density of the outer regions. Following this analogy, we can see that our hole placement scheme effectively removed material near the edges of the resonator, thus lowering its inertia. Further invoking a lumped-parameter model of the resonator, since the square of the natural frequency of a resonator is inversely proportional to its mass, the introduction of the holes is expected to cause an increase in resonant frequencies. Given that branches of the band diagram indeed migrate towards higher frequencies upon introduction of the micro-perforations, this suggests that the physics behind these modes could be pinpointed to the onset of these resonant mechanisms.