Snowy: Recommending Utterances for
Conversational Visual Analysis
Abstract.
Natural language interfaces (NLIs) have become a prevalent medium for conducting visual data analysis, enabling people with varying levels of analytic experience to ask questions of and interact with their data. While there have been notable improvements with respect to language understanding capabilities in these systems, fundamental user experience and interaction challenges including the lack of analytic guidance (i.e., knowing what aspects of the data to consider) and discoverability of natural language input (i.e., knowing how to phrase input utterances) persist. To address these challenges, we investigate utterance recommendations that contextually provide analytic guidance by suggesting data features (e.g., attributes, values, trends) while implicitly making users aware of the types of phrasings that an NLI supports. We present Snowy, a prototype system that generates and recommends utterances for visual analysis based on a combination of data interestingness metrics and language pragmatics. Through a preliminary user study, we found that utterance recommendations in Snowy support conversational visual analysis by guiding the participants’ analytic workflows and making them aware of the system’s language interpretation capabilities. Based on the feedback and observations from the study, we discuss potential implications and considerations for incorporating recommendations in future NLIs for visual analysis.
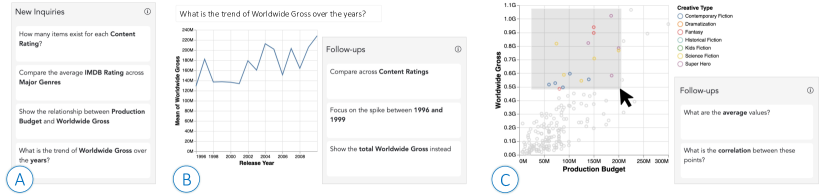
Figure 1 shows three examples of utterance recommendations in Snowy. Figure 1A shows examples of recommendations at the start of a session. Figure 1B shows recommendations of follow-up utterances presented after processing a user utterance. Figure 1C displays examples of deictic utterances shown when users make selections on a chart.
1. Introduction
Several data visualization tools now support natural language (NL) as an input modality for conducting visual analysis (e.g., (Sun et al., 2010; Gao et al., 2015; Setlur et al., 2016; Narechania et al., 2021; Yu and Silva, 2019; ask, 2021; pow, 2021; tho, 2021)). This interest in NLIs is driven by the fact that NL allows users to freely express their data-driven goals and questions without needing to translate their intentions to interface actions (e.g. manually specifying mappings between data attributes and visual encodings) (Grammel et al., 2010). Recent advances in natural language processing and machine learning have resulted in considerable improvements in NLIs with respect to NL understanding. NLIs for visual analysis have matured to support a range of analytic intents while also tackling challenges such as ambiguity (Gao et al., 2015; Setlur et al., 2016) and underspecification (Setlur et al., 2019).
Despite improvements in NL understanding, from a user standpoint, formulating utterances during an analytical workflow remains a challenging task for two key reasons. First, analytical query formulation involves the need to understand the characteristics of the underlying data domain and potential patterns to investigate (e.g., general value distributions, correlations). A lack of analytic guidance during this process can interfere with users developing an accurate sense of progress towards their analysis goals (Grammel et al., 2010; Lee et al., 2019). Second, practical limitations of a system’s NL understanding capabilities requires users to phrase or adjust their utterances in a way that the underlying system can best interpret them (Setlur et al., 2019) (Here, we use the term utterance to refer to any NL command, statement, query, question, or instruction that one may issue to an NLI). Without a clear understanding of the system’s interpretation capabilities, users often end up “guessing” utterances, thus being more prone to system failures. While the lack of analytic guidance and discoverability of NL input are fundamental challenges on their own, in tandem, these can disrupt the analytic workflow and discourage the use of NLIs for visual analysis altogether.
To address these challenges, we introduce Snowy111The name Snowy is inspired by the namesake fictional dog in the Adventures of Tintin comic series (Hergè, 2011) where he addresses his internal monologue to the reader with speech bubbles. He can understand human language and his verbal responses to various situations include jokes, expressions of fright, and pleas to Tintin to exercise caution., a novel mixed-initiative interface that presents NL utterances as recommendations during visual data analysis (Figure 1). Snowy populates its recommendations with contextually relevant data entities (e.g., attributes, values) and phrases the recommendations to highlight the linguistic variations supported by the underlying NL understanding module. This combination of features enables Snowy to provide analytic guidance that goes beyond existing visualization recommendation tools (e.g., (Mackinlay et al., 2007; Wongsuphasawat et al., 2016b, 2017; Demiralp et al., 2017; Key et al., 2012)) that only focus on perceptual features and/or data interestingness, but do not consider NL input, and general NL discovery-focused recommendation tools (e.g., (Furqan et al., 2017a; Corbett and Weber, 2016; Srinivasan et al., 2019)) that consider the interface and language context, but offer no guidance for visual analysis.
In summary, our key contributions include:
-
•
The design and implementation of Snowy, a prototype interface that operationalizes the idea of generating and presenting utterance recommendations for conversational visual analysis. Snowy recommends both 1) follow-up utterances that promote a user’s active analytic context (e.g., most recent utterance, active chart) as well as 2) utterances that complement the user’s historical actions and serve as new inquiries to look at other interesting and/or underexplored aspects of the data.
-
•
A technique for generating utterance recommendations for visual analysis through a combination of data interestingness metrics (e.g., number of times an attribute has been visualized, correlations between attributes in the underlying dataset) as well as language pragmatics (e.g., terms and entities used in preceding utterances).
-
•
Findings from a preliminary user evaluation of Snowy suggesting that contextual utterance recommendations can not only guide visual analysis, but also help people gain awareness of the system’s NL interpretation capabilities.
2. Related Work
The primary goal of our work is to support users via recommendations as they use NL as an input modality during their analytical workflows. Our distillation of prior research relating to recommendations and NL in the context of visual analysis, falls into three main categories: (1) visualization recommendation tools, (2) NLIs for visual analysis, and (3) user interfaces for NL suggestions.
2.1. Visualization Recommendation Tools
Showing visualization recommendations is a popular approach to help users surmount data selection and visual mapping barriers during visual data analysis (Grammel et al., 2010). A detailed review of visualization recommendation (VizRec) systems and techniques is beyond the scope of this paper but can be found in survey manuscripts such as (Lee et al., 2021; Wu et al., 2021; Zhu et al., 2020; Collins et al., 2018). Broadly speaking, however, VizRec systems can be categorized into 1) systems that focus on recommending visual encodings given a set of data attributes or perceptual constraints (e.g., (Mackinlay, 1986; Mackinlay et al., 2007; Moritz et al., 2019; Wongsuphasawat et al., 2016a)) and 2) systems that leverage recommendations to guide visual data exploration and analysis (e.g., (Wongsuphasawat et al., 2016b; Key et al., 2012; Wongsuphasawat et al., 2017; Demiralp et al., 2017; de Araújo Lima and Barbosa, 2020)). We expand upon some tools in the second category since they overlap with the goals of our work. VizRec systems for data exploration recommend visualizations based on data patterns (e.g., (Vartak et al., 2015; Key et al., 2012; Demiralp et al., 2017)) or through a faceted browsing approach showing summaries of attributes in the underlying data (e.g., (Wongsuphasawat et al., 2016b, 2017)). To prune the recommendations and guide analysis, these systems often employ some level of mixed-initiative interaction to steer the system recommendations. For example, VizDeck (Key et al., 2012) allows users to rank and organize its recommendations through a voting mechanism. Systems like Voyager and Voyager 2 (Wongsuphasawat et al., 2016b, 2017) suggest visualizations based on user-selected fields and wildcards to enable rapid iteration through possible data attributes or encodings. Going beyond attributes, systems like VizAssist (Bouali et al., 2016) allow users to select their analytic objectives (e.g., finding correlations, creating and comparing data sub-groups) and then create a slew of visualizations with those selections in mind. Complementing this approach of having users specify objectives, more recent systems like Foresight (Demiralp et al., 2017) include predefined categories of “insights” (e.g., outliers, dispersion) that are used to recommend visualizations displaying those insights. We build upon this general space of mixed-initiative tools for visual analysis by considering underlying data patterns and interactions with data attributes over the course of a session as factors to generate recommendations. However, our work extends this line of research by investigating the idea of generating utterance recommendations (as opposed to visualization recommendations). In doing so, we explore new synergies with research on NLIs for visual analysis and extend the features considered for generating recommendations to not only focus on the underlying data but also concepts from language pragmatics.
2.2. Natural language interfaces for visual analysis
NLIs for visualization systems (ask, 2021; tho, 2021; ibm, 2021; pow, 2021) have evolved over the years to better understand a user’s analytical intent expressed in NL and provide reasonable visualization responses. The forms of inferring intent typically rely on explicitly named data attributes, values, and chart types in the user’s input queries. In addition to inferring intent, these systems focus on techniques for enabling users to converse more effectively with such a system. DataTone (Gao et al., 2015), for instance, provides ambiguity widgets to allow a user to update the system’s default interpretation. Eviza (Setlur et al., 2016) and Analyza (Dhamdhere et al., 2017) support simple pragmatics in analytical interaction through contextual inferencing. Evizeon (Hoque et al., 2017) and Orko (Srinivasan and Stasko, 2018) extend language pragmatics in analytical conversation by understanding follow-up inquiry. Iris (Fast et al., 2018) supports performing complex data science tasks through an NL interface that combines simpler commands through nested conversations. Ask Data (Setlur et al., 2019; ask, 2021) handles various analytical expressions in natural language form such as grouping of attributes, aggregations, filters, and sorts. The system also handles impreciseness around numerical vague concepts such as ‘cheap’ and ‘high’ by inferring a range based on the underlying statistical properties of the data. Other research has explored how ambiguity can be handled in NL utterances with reasonable defaults. Hearst et al. (Hearst et al., 2019) explore appropriate visualization responses based on the shape of the data distributions for singular and plural superlatives in NL utterances (e.g., ‘highest price’ and ‘highest prices’) and numerical graded adjectives (e.g., ‘higher’). Sentifiers (Setlur and Kumar, 2020) explores interpretations and defaults for subjective vague modifiers such as ‘best’ and ‘safe’ during visual analysis.
Despite the advancements in better understanding intent, formulating appropriate NL utterances during data exploration still remains a challenging problem. Users tend to adapt to the suggestions that the system provides even if the system can handle greater degree of variability and underspecificity than what the suggestions provide (Olteanu et al., 2020; Arnold et al., 2020). The problem is further exasperated as users try to find next steps in their analyses that yield useful insights. In our work, we address this cognitive overload in NLIs by recommending utterances with linguistic variation to help guide users during their analytical workflows. Furthermore, prior work has also shown that the combination of NL and direct manipulation facilitates an integrated interaction experience and enables higher degree of freedom of expression during visual analysis (e.g., (Gao et al., 2015; Setlur et al., 2016; Saktheeswaran et al., 2020)). Following these findings, we investigate the proposed idea of generating and presenting utterance recommendations in the context of a multimodal visualization interface that supports both manual view specification and NL input.
2.3. User interfaces for natural language suggestions
The lack of input discoverability has been a long standing challenge for NLIs (Walker et al., 1998; Yankelovich, 1996). Given the general nature of this challenge, we referred to prior approaches in this space to identify design challenges and explore potential solutions. Specifically, we focus on adaptive NL command discovery interfaces that incrementally expose users to the system features through contextual suggestions (e.g., (Myers, 2019a; Furqan et al., 2017b; Corbett and Weber, 2016; Srinivasan et al., 2019)), and explore how such suggestions can be generated during visual analysis.
Query suggestions have also shown to benefit users during exploratory search tasks (e.g., (Otsuka et al., 2012; Medlar et al., 2021)). They are often displayed alongside search results and are intended to be used as follow-on queries or reformulations of the present search query (Bhatia et al., 2011). Methods for generating query suggestions use information from query logs based on click-throughs or query co-occurrence (He et al., 2009). Recent advances support various adaptive techniques to encourage the discovery of new utterances during a user’s search journey through visual feedback, in-situ suggestions, and context-sensitive orientation (Myers, 2019b). We draw inspiration from these ideas of generating query suggestions based on search relevance and prior user interactions, applying them to the context of conversational visual analysis.
In the space of visual analysis tools, systems like Power BI Q&A (pow, 2021), Ask Data (ask, 2021), and Thoughtspot (tho, 2021) display textual suggestions as one types a query. SneakPique (Setlur et al., 2020) displays widgets with embedded visualizations as visual data previews as users type NL utterances. By doing so, these systems help users rapidly formulate or refine their queries. However, since they are invoked only when users type or interact with the text input box, these interfaces offer little or no assistance in scenarios where users are unaware of what query to begin with (e.g. at the start of data exploration) or what aspects of the data to consider next during an analytic session. Furthermore, the suggestions offered by current state-of-the-art tools typically try to showcase the available analytical capabilities and may not be driven by potentially interesting data patterns. This again imposes the task of figuring out what to ask onto the users. Addressing these gaps, in our work, we provide utterance recommendations that users can utilize at different points of their analyses (e.g., at the start of a session, as a follow-up to a prior utterance, or as a follow-up to a deictic action such as selecting points on a chart). These recommendations not only give users a sense for the linguistic capabilities of the system, but also guide them towards interesting data subsets and patterns to consider.
3. Recommending Utterances during Visual Analysis
The key idea driving our research is to explore how utterance recommendations (for brevity, we refer to utterance recommendations as recommendations hereafter) in NLIs can guide visual analysis while implicitly helping users learn and discover the system’s NL understanding capabilities. Operationalizing this idea, however, requires answering several open questions pertaining to the recommendations as well as the interface within which they are incorporated. For instance, regarding the recommendations themselves, what information should the recommendations contain (e.g., attribute names, visualization types, keywords mapping to analytic tasks)? How should the recommendations be phrased? Should they be phrased as system commands or more colloquially? Should the recommendations use data attributes and values that users have previously interacted with so they seem more familiar? Or should recommendations promote breadth in interaction and cover aspects of the data that one may not have looked at before? In terms of their interplay with the interface, when should the recommendations be shown? At the start of a session or during exploration? Should they be generated proactively or be shown on-demand? Which actions should update or trigger recommendations? Since the recommendations show NL utterances, should they only be presented during NL interaction? Or could they also be used to promote multimodal input?
3.1. Design Goals
With the above questions in mind, we compiled a list of six design goals to guide Snowy’s design. These goals were informed by prior work on mixed-initiative user interfaces (Horvitz, 1999), exploratory visualization recommendation systems (e.g., (Wongsuphasawat et al., 2016b, 2017; Demiralp et al., 2017; Cui et al., 2018; Lee et al., 2021)), and NLIs for data visualization (e.g., (Sun et al., 2010; Gao et al., 2015; Setlur et al., 2016; Narechania et al., 2021; Hoque et al., 2017)). We refined the user experiences while iterating over early designs of the prototype.
DG1. Facilitate breadth in data exploration. Prior work on VizRec systems (e.g., (Wongsuphasawat et al., 2016b; Demiralp et al., 2017; Key et al., 2012)) and exploratory data analysis in general (Tufte, 1985) have stressed on the importance and challenges of breadth-oriented exploration. Along these lines, to provide effective analytic guidance during data exploration, the recommendations should promote both analytic and data coverage by spanning across a breadth of intents and data entities.
DG2. Support new inquiry, follow-ups, and deictic utterances. Prior work has shown that NL input can be used in different contexts during visual analysis. Specifically, one-off NL utterances can be used to ask data-driven questions or specify visualizations (e.g., (Sun et al., 2010; Gao et al., 2015; Yu and Silva, 2019; Narechania et al., 2021)). Alternatively, NL can be used to engage in an analytic dialogue, iteratively create and refine a visualization through a sequence of utterances (e.g., (Setlur et al., 2016; Hoque et al., 2017; Setlur et al., 2019)). Finally, NL can be used in concert with direct manipulation actions like selections to perform multimodal interactions (e.g., (Setlur et al., 2016; Srinivasan et al., 2020; Srinivasan et al., 2021a)). Hence, the recommendations shown must support these different scenarios of using NL input during visual analysis and include new inquiry, follow-up, and deictic utterances as and when applicable.
DG3. Use analytic intents as anchors. A definitive characteristic that differentiates NL from traditional visualization GUIs is that NL enables people to clearly express their analytic tasks or intents (e.g., finding correlations, seeing distribution of values in a dataset). Thus, the recommendations should map to one or more analytic intents so that users can leverage these intents as anchors to guide their analyses. To cover a spectrum of functionality exhibited by prior NLIs and VizRec systems, we currently focus on six intents: 1) grouping data by a categorical attribute (e.g. “average sales by region”), 2) seeing data distribution for individual attributes (e.g. “Show count of movies by genres”), 3) understanding the correlation between two quantitative attributes (e.g. “How does profit vary with sales?”), 4) observing the trend in values over time (e.g., “Display quarterly sales since 2019.”), 5) filtering to drill down into a specific data subset (e.g. “Compare sales for USA, Japan, India, and Australia”), and 6) changing the aggregate function used to calculate derived values (e.g. “Show total sales instead of average sales by region”).
DG4. Complement user interaction with data interestingness. Following DG1, the recommendations should consider the users’ interactions and suggest underexplored data entities and analytic intents. However, depending on the size of the dataset, choosing attributes and data subsets to recommend can be difficult and quickly turn into a combinatorial explosion. Recent “insight”-based recommendation tools (e.g., (Cui et al., 2018; Demiralp et al., 2017)), on the other hand, have shown that this challenge can be tackled by computationally analyzing interesting patterns in the underlying data and suggesting the most relevant results. Such recommendations based on patterns in the underlying data can also help with “cold start” scenarios where users are new to a dataset and may not have a clear analytical goal in mind. Thus, the system should consider data interestingness as an additional feature (along with data and analytic coverage) when generating recommendations.
DG5. Support linguistic variation. NL utterances posed to visualization tools often vary from highly specified utterances that contain explicit references to data attributes, chart types, and/or analytic intents (e.g., “Show me a bar chart of average sales by country,” “Show the average profits for countries with over $50M in sales”) to highly underspecified utterances that only contain partial references to data entities or intents (e.g., “Compare sales around the world,” “Show profits for countries with high sales”). While supporting different NL input contexts (DG2), the system must also ensure that the recommendations exhibit ample linguistic variation within and across each context.
DG6. Should be unobtrusive during targeted analysis.
While a key goal of the recommendations is supporting open-ended data exploration, there may be instances where users have a clear goal in mind about what they want to look at.
In such scenarios, the recommendations should not interfere with the user’s thought process but be available to look at in case users want to refer to the recommendations to identify phrasings that match the query in their mind.
Note that these goals are not exhaustive or mutually exclusive, nor are they meant to be prescriptive for utterance recommendations in NLIs for data visualization. For instance, we focus on visual data exploration as our primary usage context and do not consider actions like changing encodings or formatting marks as part of the recommendation space. Instead, DG1-DG6 are only meant to be an initial set of goals to help ground our design and enable us to develop and test an initial prototype in this space.
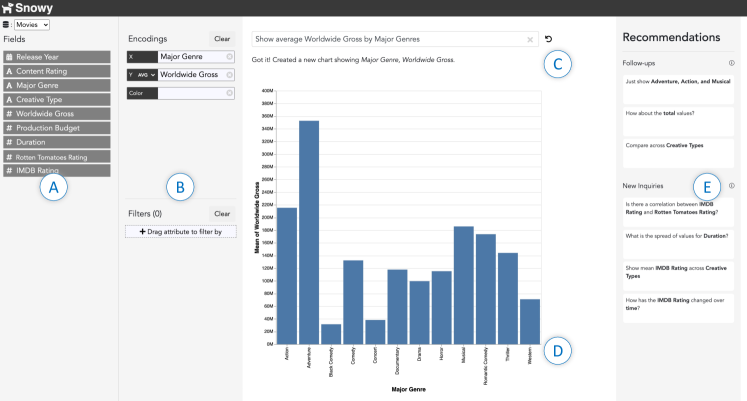
Figure 2 shows Snowy’s user interface.
4. Snowy
Incorporating the aforementioned design considerations, we developed Snowy as a prototype system to investigate the idea of leveraging utterance recommendations for guiding visual analysis, while implicitly helping users discover and learn the system’s NL capabilities. In this section, we first briefly describe Snowy’s interface and walk through a usage scenario that exemplifies how utterance recommendations can aid conversational visual analysis. We subsequently detail Snowy’s design and implementation, discussing how it leverages a combination of features from the underlying data along with the users’ interaction context to present in-situ recommendations.
4.1. Interface and Usage Scenario
Snowy (Figure 2) is a mixed-initiative visualization system that supports NL input as well as direct manipulation interactions through a graphical user interface (GUI). Let us now consider an exemplary usage scenario to understand how the different components of Snowy’s interface collectively support visual analysis (this scenario is also illustrated in the supplementary video).
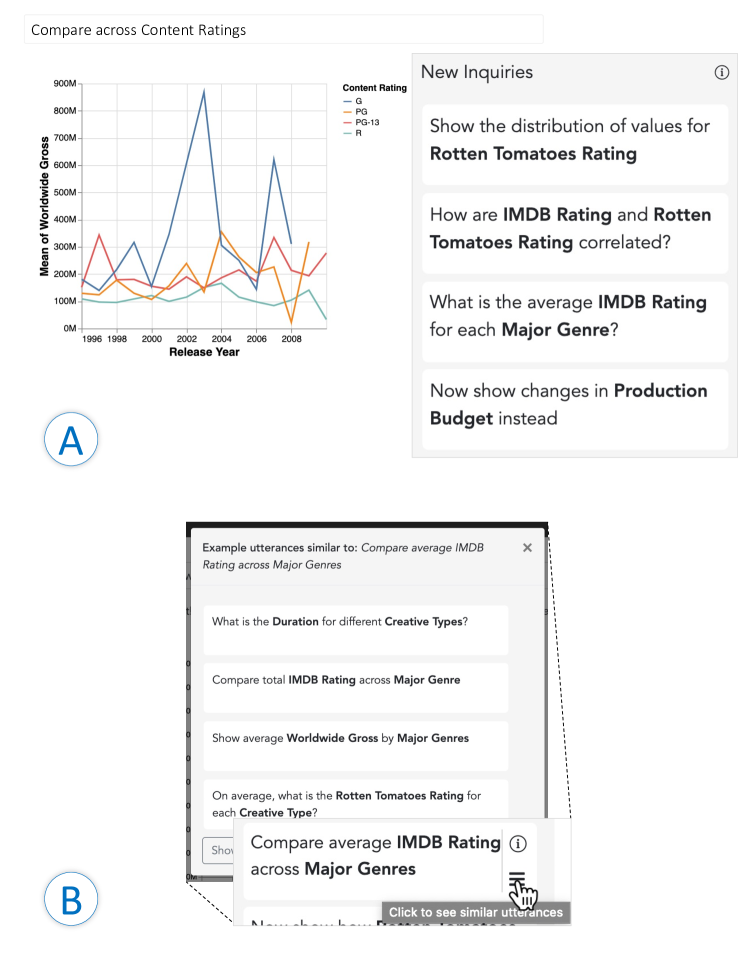
Figure 3 shows two screenshots from the illustrative usage scenario of exploring a movies dataset. Figure 3A displays recommendations highlighting how pragmatic markers such as “instead” can be used to replace active attributes in the visualization. Figure 3B shows recommendations similar to “Compare average IMDB Rating across Major Genres”.
Tintin, an analyst at a movie production house is examining a dataset of previously released movies to identify the types of movies his company should invest in next. The dataset222Provided as supplementary material. contains movies with nine attributes for each movie including its \faCalendar Release Year, \faFont Major Genre, \faHashtag Worldwide Gross, and \faHashtag IMDB Rating, among others (shown in Figure 2A). For consistency, we use this movies dataset for examples throughout this paper.
As Tintin loads the dataset, Snowy scans the underlying data to identify potentially interesting attribute combinations to explore and presents a list of utterance recommendations that Tintin can use to start his exploration (Figure 1A) (DG4). Tintin finds the recommendation to be relevant for observing trends and clicks the recommendation to select it as his input utterance. In response, Snowy renders a line chart and then updates its recommendations to suggest new inquiries, while also including some new recommendations of follow-up utterances to modify the active chart (Figure 1B) (DG2). Looking through the follow-up recommendations, Tintin is intrigued by the idea of continuing to observe the trend of budget but across different Content Ratings, and selects the recommended utterance . Viewing the updated multi-series line chart, Tintin observes that while all movie types except R-rated movies have a higher gross over time, PG-13 movies have had the most stable increase (Figure 3A). Tintin again looks at the new inquiries suggested by Snowy and selects the recommendation to contrast trends across Worldwide Gross and Production Budget. In response, Snowy updates the line chart, swapping the Worldwide Gross attribute on the Y-axis with the Production Budget. Through the updated chart, Tintin notices that movies follow a similar trend for the budget and correspondingly makes a note that his company should consider PG-13 movies more closely.

Figure 4 shows three screenshots from the illustrative usage scenario of exploring a movies dataset. Figure4A shows how a Major Genre filter applied through natural language utterances is also added to the graphical user interface for further refinement. Figure 4B shows how a new scatterplot is created while preserving filters from the previous bar chart. Figure 4C displays that the input query box is cleared when the visualization is updated through the manual view specification panel.
Wondering which attributes to explore next, Tintin skims the recommendations panel and pauses when he sees the utterance . He likes the idea of comparing values across groups of genres, but does not want to use the IMDB Ratings. To see alternative recommendations, he hovers on the recommendation and then clicks the \faBars icon to see similar recommendations (Figure 3B). From the suggested list, he selects as his input utterance. Inspecting the resulting bar chart, Tintin observes that Action and Adventure have notably higher values. In parallel, Snowy also interprets the bar chart and recommends a series of follow-up recommendations, including one to drill down into the three highest grossing genres ( ). As this recommendation matches his observation, Tintin selects this follow-up utterance to refine the scope of his exploration. The system adds a Major Genre filter, allowing Tintin to refine it further through the GUI if needed (Figure 4A).
Considering the active bar chart, Tintin’s prior interactions, and the available data attributes, Snowy now recommends two follow-up utterances to include Creative Type as an additional attribute for comparison, or change the aggregation level of the current chart from average to sum. Snowy also infers that Tintin has performed analytic tasks like looking for trends over time and compared values for quantitative attributes across groups of categorical values. Thus, to broaden his analytic coverage, Snowy promotes utterances pertaining to other analytic tasks like observing correlations between attributes and seeing the distribution items in the dataset in its new inquiry recommendations (Figure 4A) (DG1,DG3). Furthermore, to promote data attribute coverage in his exploration, Snowy populates these recommendations with attributes that Tintin has not previously considered (e.g., Creative Type, IMDB Rating, Duration) (DG1).
Seeing the utterance recommendation
at the top of the new inquiry recommendations, Tintin realizes that he has not considered movie ratings as part of his analysis so far and selects it as his input, resulting in Snowy rendering a scatterplot comparing ratings across the two platforms (Figure 4B).
Tintin subsequently selects the follow-up recommendation to further filter down to PG-13 movies (because he had earlier noticed that these movies tend to have a stable return on investment over time).
Inspecting the scatterplot, Tintin confirms that the ratings across the IMDB and Rotten Tomatoes platforms are fairly correlated and decides to switch his focus back to the return on investment on movies.
To do so, he now manually updates the scatterplot by dragging the Production Budget and Worldwide Gross attribute pills to the X- and Y-encoding shelves, respectively.
In response, Snowy clears the text input box since the visualization was manually specified and updates its utterance recommendations based on the new chart (Figure 4C).
Tintin selects the follow-up recommendation since that is an attribute he had not previously considered, leading to the system coloring points by Creative Type.
To inspect movies with a high gross and return on investment, Tintin draws a selection box on the chart around movies that gross over $500 million while having a budget of $200 million or below. Through the active selection of 13 movies and their mark colors, Tintin identifies that Science Fiction (five movies), Super Hero (four movies) have the highest chance of success, with Contemporary Fiction and Fantasy (two movies each) also being creative types to consider. Based on Tintin’s active selection, Snowy now suggests follow-up utterances for computations that can be performed on the selected items (Figure 1C) (DG2). Tintin selects the recommendation and notes that PG-13 movies having the specified genres and creative types gross, on average, $709 million on an average investment of $132 million. He clears the view and continues exploring other aspects of the data to report any additional findings to his company’s investment team.
4.2. System Overview
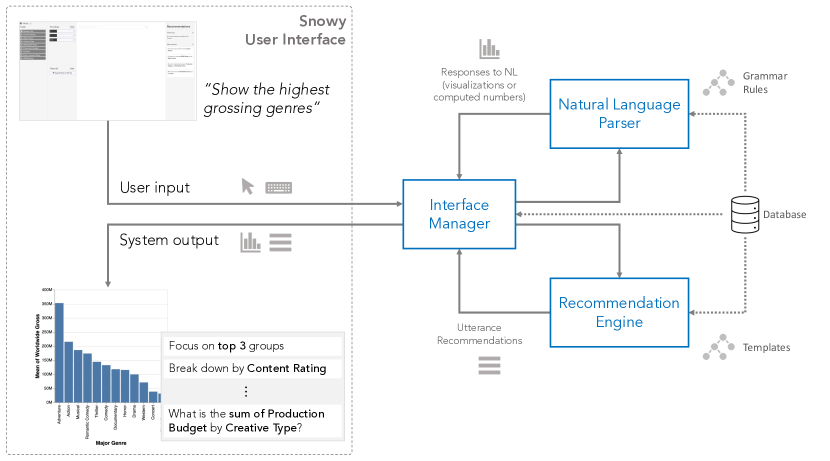
Figure 5 shows Snowy’s system architecture, highlighting connections between the main components—namely, the interface manager, the natural language parser, and the recommendation engine.
Snowy is implemented as a web-based application and is developed using Python, HTML/CSS, and JavaScript. The system accepts any tabular CSV dataset as input. Visualizations in the tool are specified and created using Vega-Lite (Satyanarayan et al., 2016). Snowy currently supports three encoding channels (x, y, color) and three mark types (bar, line, point). These marks and encodings collectively allow users to specify and interact with a canonical set of visualizations including bar charts, line charts, and scatterplots that cover the range of analytic intents currently supported in Snowy. During manual view specification, Snowy selects the default visualization using a simplified version of the Show Me system (Mackinlay et al., 2007), employing similar rules to determine mark types based on the mappings between the visual encodings and attribute data types (e.g., showing a scatterplot if two quantitative attributes are mapped to the xy-channels and showing a line chart if a temporal attribute is visualized on the x-axis with a quantitative attribute on the y-axis).
Figure 5 presents a high-level depiction of the system’s architecture. There are three main components—namely, the Interface Manager, the Natural Language Parser, and the Utterance Recommendation Engine. In the following sections, we describe these individual components and highlight how they collectively support the features in Snowy.
4.3. Interface Manager
Snowy is designed to be a context-sensitive recommendation interface that employs an action-reaction design (Brézillon, 2007), where the user interaction causes the interface to react and update based on the actions that the user makes. User actions that drive recommendations in Snowy include manual view specification or filtering through drag-and-drop, typing NL utterances, selecting recommended utterances, and selecting marks in the active visualization.
As users interact with the tool, Snowy tracks their actions and maintains a context state object that drives the system’s utterance recommendations.

Figure 6 demonstrates a sub-sequence from the illustrative usage scenario showing the changes in attribute and intent scores in Snowy’s context state object along with how the conversation centers are maintained.
4.3.1. Modeling the context state
The context state object is modeled as a combination of 1) the active chart and mark selections, 2) the active utterance, and 3) the user’s data exploration history. The first two are directly captured from the visualization canvas (Figure 2D) and the input box (Figure 2C) respectively. The data exploration history is stored as interaction scores corresponding to attributes, values, and the various analytic intents supported in Snowy (i.e., distribution, group, correlation, trend, filter, and aggregation). While this is not a definitive general model for capturing and understanding user interest, it helps track the user’s coverage in the context of data exploration, enabling the system to promote depth- and/or breadth-oriented exploration through its recommendations (DG1).
For attributes and values, the interaction scores are computed by tracking the number of times data attributes are mapped to visual encodings or data values applied as filters. For intents, the scores are incremented in three scenarios. First, when utterance recommendations are selected, the score for the recommendation’s corresponding intent is incremented (e.g. selecting the recommendation in Figure 4B increments the score for the filter intent). Second, when NL utterances are manually entered, Snowy infers the underlying intent from the input utterance and increments the score based on its confidence in the interpretation. For example, an input utterance like “Show the correlation between IMDB Ratings and Production Budget” leads to a higher increment for the correlation intent compared to the utterance “Show IMDB Ratings against Production Budget” since there is an explicit reference to the intent in the first utterance versus an implicit one in the second. And third, specifically for the filter intent, the score is also incremented if new filters are manually applied through the GUI.
Figure 6 shows instances of the context state object during the aforementioned usage scenario. Between the first and third states in Figure 6, for example, two recommendations were selected ( , ). This leads to the system incrementing the interaction scores for the attributes Worldwide Gross, Release Year, and Content Rating, as well as the intents trend and group (based on the first and second utterance, respectively) from 0 to 1.
4.4. Natural Language Parser
The parser to interpret NL utterances is implemented using the open-source Natural Language for Data Visualization (NL4DV) toolkit (Narechania et al., 2021). The toolkit takes as input a dataset and an utterance corresponding to that dataset, returning a JSON object that includes 1) the attributes and intents referred to in the utterance and 2) an ordered list of Vega-Lite (Satyanarayan et al., 2016) specifications that can be presented in response to the input utterance. We chose to build upon NL4DV instead of implementing a fully-custom module since language understanding was not our primary research focus. However, while NL4DV provides basic interpretation capabilities and the ability to specify a visualization through NL, the toolkit does not support conversational interaction through follow-up and deictic utterances, or utterances for statistical computations (e.g., computing differences or correlation coefficients).
We extend NL4DV’s default grammar with a set of production rules augmented with both syntactic and semantic predicates based on analytical expressions that correspond to different intents commonly found in mainstream systems like Tableau’s VizQL (Stolte et al., 2002; tab, 2021) and Ask Data (ask, 2021). We add support for follow-up utterances by adding a ‘follow-up’ grammar rule that is triggered by pragmatic markers. Pragmatic markers are linguistic cues that convey the intentionality of a follow-up utterance in reference to the current context (Fraser, 1990). These pragmatic markers are often adverbs (e.g., ‘also’, ‘how about‘) or referentials (e.g., ‘this’, ‘that’) that signal the user’s potential communicative intention of following up from a previous conversation state.
Listing 7 shows a subset of the underlying grammar with its production rules specified for the various analytical intents and follow-up utterances. In the grammar, fields without an aggregation are called dimensions (typically, \faFont categorical and \faCalendar temporal attributes) , while measures (typically, \faHashtag quantitative attributes) are fields that are aggregated within groups defined by the set of all dimensions. For brevity, we only show a subset of the production rules and excluded synonyms, date, and place terminals from the grammar in Listing 7.
4.4.1. Supporting a conversational model
To support follow-up utterances, we apply principles of pragmatics by modeling the interactions and recommendation behaviors as a conversation.
Specifically, we incorporate the conversational interaction model for visual analysis proposed by Hoque et al. (Hoque
et al., 2017).
This model builds upon a conversational centering approach (Grosz and Sidner, 1986), where utterances are divided into constituent conversational segments, embedding relationships that may hold between segments.
A center refers to those entities serving to link that utterance to other utterances in the conversation. For a total of utterances in a conversation, each utterance () in the conversation is assigned a set of forward-looking centers, referring to the current focus of the conversation; each utterance other than the initial utterance, is assigned a set of backward-looking centers, , referring to the previous state of the conversation.
The forward and backward-looking centers consist of data attributes and values, visual properties, and analytical intent.
Transitions from the backward-looking center to the forward-looking center are realized through three types of transition states:
Continue: Transition that continues the context from the backward-looking center to the forward-looking one, while potentially adding new entities.
Retain: Transition retains the context from the backward-looking center in the forward-looking one without adding additional entities to the forward-looking one.
Shift: Transition shifts or changes context from the previous one.
Based on this transition model, given an utterance , the parser responds by executing a series of analytical functions derived from the forward-looking centers . Figure 6 illustrates these different types of transitions during the conversation between the movie production house analyst, Tintin and our system, Snowy. In the example, the first utterance asking about gross over years sets the conversational center to the Worldwide Gross and Release Year attributes. The subsequent utterance asking for a comparison across groups adds an attribute, Content Rating to the current center, resulting in a continue transition. The third utterance includes a pragmatic marker (‘instead’) and requests for a change in the attribute shown on the active line chart and indicates interest in the trend intent. Referring to the existing center, the system swaps out the Worldwide Gross measure for the Production Budget, performing a shift transition, while retaining the other two attributes. Finally, the next utterance “Show average Worldwide Gross by Major Genre” switches to a new set of attributes and intent (group), and thus shifts the center to the Worldwide Gross and Major Genre attributes, as the system creates a new bar chart.
4.4.2. Error Handling
Similar to other visualization NLIs (e.g., (Sun et al., 2010; Gao et al., 2015; Setlur et al., 2016)), Snowy also encounters errors when parsing NL input: (1) utterances with ambiguous references (e.g., ‘rating’ can map to multiple attributes, Content Rating and IMDB Rating), (2) underspecified utterances (e.g. “imdb ratings by genre” does not specify a chart type or if IMDB Ratings should be aggregated), and (3) utterances for unsupported operations such as formatting (e.g. “Change blue bars to red”).
Although the system does not update the visualization for utterances requesting unsupported operations, ambiguous and underspecified utterances are handled internally by NL4DV (Narechania et al., 2021), which selects reasonable defaults. However, Snowy’s direct manipulation interface enables users to override these defaults (e.g. dragging an attribute to manually set a binding to override the system default in the case of an utterance with an ambiguous attribute reference). Additionally, the feedback below the text input box also displays potential errors and provides an undo (\faUndo) option to revert the last utterance (Figure 2). Note, however, that the ambiguities and errors do not occur when recommended utterances are selected since Snowy is fully aware of the features driving the utterances and only recommends unambiguous phrasings.
4.5. Utterance Recommendation Engine
Central to Snowy is its recommendation engine that generates contextual utterance suggestions. The system generates the recommendations by considering a combination of patterns in the underling data (e.g., strong correlations, variations in values over a temporal attribute), a user’s session history (e.g., attributes considered, filters applied), and any active interactions with the interface. User interactions that trigger recommendations include issuing an NL utterance, updating the visualization through the manual view specification and filtering panel, as well as directly selecting marks on the active visualization, a behavior commonly referred to as deictic referencing (Clark et al., 1983).
Figure 8 provides an overview of Snowy’s recommendation engine. The engine takes the context state object as input from the interface manager and returns an ordered list of utterance objects in response (Figure 8-top). Utterance objects contain the recommendation text along with other meta-information including the utterance type (‘Follow-up’ versus ‘New Inquiry’) and the associated intent (e.g., filter, group). Given a context state, Snowy performs three steps to generate utterance recommendations: 1) filtering and ranking, 2) parameterization, and 3) linguistic realization. Figure 8 provides a summary of these steps using a system state from the aforementioned scenario (Figure 2). We use Figure 8 as a running example for the remainder of this section.
4.5.1. Filtering and Ranking
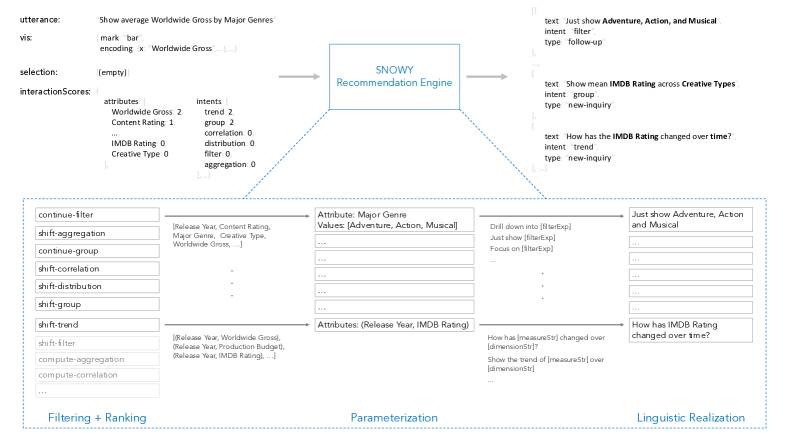
Figure 7 gives an overview of Snowy’s recommendation engine.
Snowy uses the context state to determine which types of utterances it should recommend at any point in time. Specifically, if one or more marks are selected in the active visualization, Snowy prioritizes deictic utterances and checks if it can recommend utterances based on the current chart type and selection. For instance, in Figure 1C, upon detecting multiple selected marks in a scatterplot, Snowy recommends and as follow-up utterances since computing averages and correlations are common analytic tasks for scatterplots (Sarikaya and Gleicher, 2017).
Alternatively, if there are no mark selections but there is an active chart in play, Snowy checks for follow-up utterances to recommend. Follow-up recommendations typically promote continue or shift transitions through utterances that correspond to: 1) adding one or more new attributes to the view if there are unused encoding channels (e.g. in Figure 2 since the color channel is available), 2) changing the active chart’s aggregation level (e.g. in Figure 2 as the bar chart shows the mean), and 3) adding filters (e.g. in Figure 2 for the active Major Genre attribute).
Besides follow-up utterances for an active chart or selection, Snowy also generates new inquiry recommendations to suggest alternative analytic paths for users to consider (DG2). These recommendations focus on shift transitions in the conversational interaction model and map to one or more analytic intents (DG3). Examples of new inquiry recommendations in Figure 2 include and , that suggest shifting focus to the underexplored Duration, IMDB Rating, and Creative Type attributes while considering distribution and group as the underlying analytic intents, respectively.
After shortlisting recommendations types, Snowy orders them such that recommendations mapping to the least covered intent-types (determined using the context state object) precede other recommendations. This ordering helps promote breadth in analytic querying and also tries to make users aware of potentially underexplored system capabilities given their prior interactions (DG1). In the context of Figure 8, this ordering logic results in continue-filter and shift-aggregation being shown before continue-group since the user had previously issued a continue-group utterance ( , Figure 6).
4.5.2. Parameterization
|
|
|
|
||||||||||||||
|---|---|---|---|---|---|---|---|---|---|---|---|---|---|---|---|---|---|
| Correlate | (measure, measure) |
|
|
||||||||||||||
| Group | (dimension, measure) | Standard deviation () |
|
||||||||||||||
| Trend | (dimension, measure) | Standard deviation () |
|
||||||||||||||
| Distribution | (dimension, measure) | Standard deviation () |
|
||||||||||||||
| Filter |
|
|
|
Table 1 lists the supported intent types (correlate, group, trend, distribution, filter), their parameters (attributes and/or values), and the logic used to select the parameters.
As a next step, the system needs to parameterize these shortlisted recommendations with appropriate data and analytic features including attributes (e.g., Content Rating, Worldwide Gross), values (e.g., PG-13, Action and Adventure, 1996-1999), and aggregation functions (e.g., average, sum). Snowy uses a combination of statistical metrics derived from the underlying data and the interaction scores in the context state object to select the recommendation parameters. Table 1 summarizes Snowy’s logic for selecting parameters for different classes of intents. The statistical functions in Table 1 are similar to those in prior work on insight- or data fact-based visualization recommendation systems (e.g., (Demiralp et al., 2017; Cui et al., 2018; Srinivasan et al., 2018)).
The parameter selection logic detailed in Table 1 is driven based on statistical metrics derived directly from the underlying data. However, since the dataset remains constant throughout a session, if only these metrics were used to select parameters, the recommendations may get repetitive if users have already investigated a suggested combination of attributes. To promote breadth in data exploration, besides “data interestiness,” Snowy also incorporates prior interaction scores from the context map such that attributes and values with lower scores are bumped up when selecting parameters (DG4).
An example of the effect of this inclusion of interaction scores during parameterization can be seen in the aforementioned usage scenario by comparing the attributes included in the recommendations in Figures 1A, 1B, 3 to those in Figures 2, 4. Specifically, at the start of the session, the system recommends attributes like Content Rating, Worldwide Gross, and Major Genre given the underlying data patterns. However, as the session progresses, to promote data coverage, the recommendations shift to focus on attributes like Duration and Creative Type since Tintin has either never or only minimally investigated these attributes as part of his exploration (DG1). Although Snowy does not give users control over the parameter selection logic, it does provide a brief rationale for why recommendations are shown through tooltips in the interface (Figure 9).
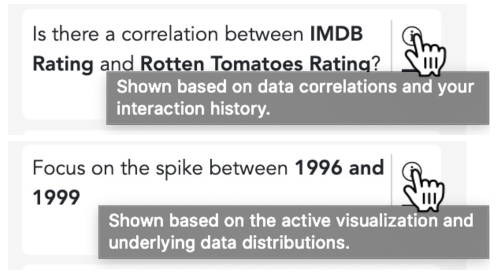
Figure 8 displays examples of explanations accompanying recommendations in Snowy.
[.S !\qsetw.1cm [.VP show !\qsetw.2cm !\qsetw.1cm [.NP change !\qsetw.1cm [.PP in !\qsetw.2cm [.NP IMDB Rating ]] !\qsetw1.8cm [.PP over !\qsetw1cm [.NP time ]]]]] \DescriptionFigure 9 shows an example of a syntax tree for the recommendation “Show change in IMDB Rating over time.”
4.5.3. Linguistic Realization of Recommendations
| Distribution |
|
||
|---|---|---|---|
| Group |
|
||
| Correlate |
|
||
| Trend |
|
||
| Filter |
|
||
| Aggregation | , , |
Table 2 lists examples of utterance recommendations generated for the analytic intents supported by Snowy.
Once all the relevant parameters for the various recommendation types have been determined, they need to be combined together into a well-formed natural language utterance. This process called linguistic realization, involves ordering constituents of the recommendations and generating the right morphological forms (including verb conjugations and agreement) (Reiter and Dale, 2000). We employ a template-based approach for generating NL utterances as recommendations in Snowy. Given that the application domain is a set of known analytical intents along with attributes and values from the underlying datasets, the space of linguistic variations is relatively small and the outputs can be specified using templates (Reiter, 2010). Having a deterministic set of generated NL output also allowed us to control the variability in the recommended NL utterances for testing purposes. We defined the templates by referring to utterances commonly supported across existing NLIs (Setlur et al., 2016; Hoque et al., 2017; Yu and Silva, 2019; Setlur et al., 2019; Narechania et al., 2021) and sample utterances collected through studies investigating the use of NL to create or interact with data visualizations (Tory and Setlur, 2019; Srinivasan et al., 2021b). Note, however, that the current template-based approach can be extended to a task-oriented dialogue approach by using the set of templates along with a language model for generating a larger variety of sentences with linguistic variability.
Our algorithm maps non-linguistic input comprising of data attributes, values, and intent from the parameterization process to a linguistic structure based on a set of predefined templates for each of the intents described in the previous section. These templates contain gaps for the parameters and generate well-formed recommendation utterances when all the gaps have been replaced by linguistic structures that do not contain gaps.
Formally, a template , where S is an abstract syntax tree (AST) for each analytical intent type with open slots in it; is a set of links to additional syntactic structures that are noun (), verb (), and prepositional phrases () that are substituted in the gaps of ; is a set of analytical constraints on the applicability of that are based on the type of . The interior nodes of are non-terminal symbols (i.e., syntactic variables) whose gaps are recursively replaced by groups of terminal symbols (i.e., elementary strings in the utterance) according to ’s production rules as well as synonyms and vocabulary terms based off of (Setlur et al., 2019).
Now, consider the for the trend intent with the parameters and . Figure 10 shows the AST for generating the recommendation, . The parameters lead to generation of partial NPs, with the slots for and filled by IMDB Rating and time respectively. The linguistic realization process generates all possible valid ASTs from , using a bottom-up generative process. Each AST in this set is checked to see whether it is compatible with . After the set of utterances is generated, nouns and verbs are inflected, wherein the base forms of the words are modified to be grammatically sound to account for plurality and tense (Crystal, 2011). A variety of recommendation utterances are randomly generated to maximize the variety of utterance recommendations produced by Snowy. Example utterance recommendations from the various trend ASTs include , , , and , among others. From the resulting set of valid utterances, one is selected at random (in this case, ). Table 2 illustrates additional sample utterance recommendations for different intent types.
Notice from Table 2 that the recommendations exhibit a variety of linguistic variations to exemplify and help discover the capabilities of the underlying NL parser (DG5).
These variations include different phrasing patterns (e.g., questions, commands) and the use of colloquial terms in addition to the underlying data attributes and values (e.g., ‘over time’ for temporal attributes, ‘spike’ for a steep rise and fall trend in a line chart, and modifier terms like ‘low’, ‘high’ when referring to numeric filters).
Furthermore, some recommendations contain explicit references to attributes, values, or intents and can be used as standalone utterances (e.g., , ).
However, other recommendations include implicit references to values and intents, and/or incorporate pragmatic markers to support conversational interaction (e.g., , ).
The choice of which AST is used for generating the recommendation is based on the current context state and the analytical constraints .
For example, in a case like Figure 2, where the active chart is an unsorted bar chart of average Worldwide Gross by Major Genre, the filter recommendation is and explicitly lists the filter group.
However, in the case of Figure 5, when the context state is a sorted bar chart (since the invoking utterance “Show highest grossing genres” includes an extremum token), the recommendation changes to as this phrasing suggests linguistic continuation and supports visual coherence (Tory and Setlur, 2019) by preserving the previous chart structure to show the top 3 groups in the sorted chart. As a session progresses, to make users aware of more advanced interpretation capabilities, Snowy starts recommending utterances that combine intents (e.g., combining
trend and group, combining correlation and group).
5. Preliminary User Study
We conducted a preliminary user study to gather initial feedback on the idea of presenting utterance recommendations during conversational visual analysis and assess the usability of the prototype.
5.1. Participants and Setup
We recruited participants (P1-P10, six males, four females) through a mailing list at a data analytics software company. Participants were recruited on a first-come, first-serve basis. Based on self-reporting by the participants, five had never or infrequently performed data analysis, three occasionally performed data analysis, and two participants analyzed data on a daily basis. When asked about their prior experience level with interactive visualization tools like Tableau and Microsoft Power BI, four participants identified themselves as being expert users, three participants said they were familiar with the general capabilities of these tools and used them somewhat frequently, and three participants said they only occasionally used visualization tools. Since the study involved NL interaction, we also asked participants about their prior experience level with NLIs for visualization including commercial systems like Tableau’s Ask Data and Microsoft’s Power BI Q&A. To this question, four participants said they had little to no experience using these tools, four participants said they frequently used the tools, and two participants said they seldom interacted with such tools, but were aware of their general capabilities. Participation in the study was voluntary and participants were not compensated for their time.
To conform with COVID-19 protocol, all sessions were conducted remotely via the Cisco WebEx video conferencing software (web, 2021). The prototype was hosted on a local server running on the experimenter’s laptop3332.4 GHz MacBook Pro running macOS Catalina 10.15.7 set to a resolution of 3072 1920.. Participants were granted control over the experimenter’s screen during the session (the setup was tested through three pilot studies to ensure there was no lag or technical issues in the interaction experience). All studies followed a think-aloud protocol. The audio, video, and on-screen actions were recorded for all sessions with permission from the participants.
5.2. Procedure
Sessions lasted 42–53 minutes (mean: 49 min.) and were roughly organized as follows:
[0–10 min.]: Introduction to the study goals and time for participants to fill out their background information. Participants were briefly introduced to Snowy’s interface. Since an implicit goal was to assess if the recommendations could help with NL input, the introduction for the NL and recommendation components of the interface were kept to a bare minimum (e.g. how to execute NL utterances or select recommendations) to avoid participant bias.
[10–25 min.]: Participants were given a set of five tasks involving the movies dataset introduced earlier in Section 4.1 and were asked to “solve” them using Snowy. These tasks involved a combination of directed exploration tasks where participants were asked to explore the data with respect to a subset of attributes (e.g. “List 1–3 insights pertaining to the Content Rating attribute”) and Jeopardy-style fact verification tasks, similar to those used in (Gao et al., 2015) where participants were given a fact and had to ask questions of the data to determine if the fact was either true or false. The tasks were framed such that directly typing the instructions into the system would not result in the answer. The order of tasks was randomized across participants.
[25–40 min.]: Participants were then given a second dataset about 500 colleges in the U.S. and were asked to freely explore it with Snowy. The dataset contained nine attributes for each college including three categorical attributes (\faFont Region, \faFont Locale, \faFont Control) and six numerical attributes (e.g., \faHashtag Admission Rate, \faHashtag Cost, \faHashtag Debt). Incorporating both targeted and open-ended exploration allowed us to assess the impact of utterance recommendations across the two popular scenarios for data analysis and validate our specific design goals (DG1, DG6).
[40–50 min.]: Post-session questionnaire on Snowy’s recommendations (Figure 11) along with ten questions from the standard System Usability Scale (SUS) questionnaire (sus, 2021) to help evaluate the prototype’s usability. The questionnaire was complemented with a semi-structured interview where participants talked about their experience using Snowy.
The experimenter script, task descriptions, and datasets are included in supplementary material.
5.3. Results and Discussion
On average, participants completed four out of the five tasks in the first targeted-exploration phase, spending between 12–18 min. (mean: 14 min.), followed by 8–17 min. (mean: 14 min.) on open-ended exploration with the college data. Participants gave Snowy an average SUS score of (a score of is considered as an indicator of good usability (sus, 2021)).
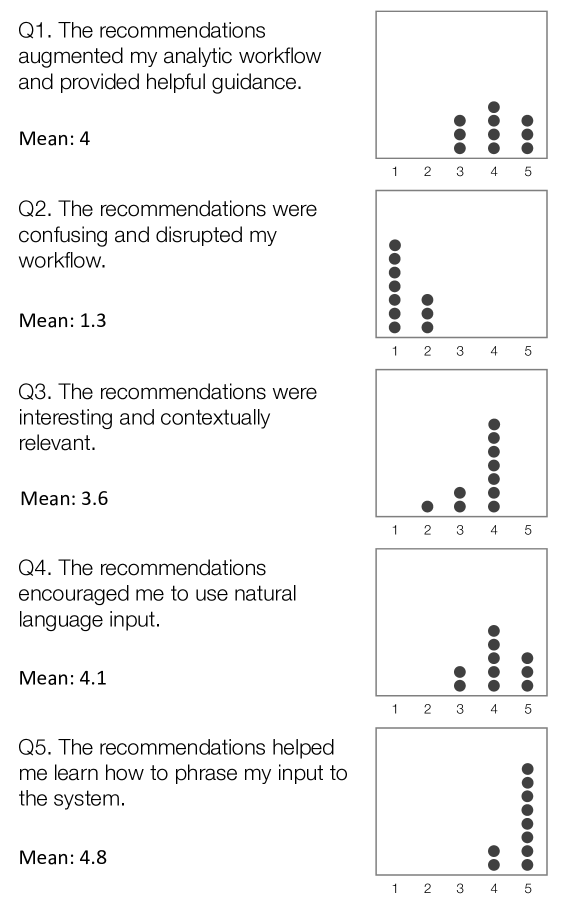
Figure 10 summarizes participant responses to post-session questions. Participants were generally in agreement about recommendations being helpful guidance tools during visual analysis but there were mixed responses about the relevance of the current prototype’s recommendations. However, all participants strongly agreed that the recommendations encouraged them to use natural language input and helped them learn how to interact with the system through language.
5.3.1. Recommendations for guiding visual analysis.
Participants generally agreed that the recommendations supported their analytic workflows and provided useful guidance during data exploration (Figure 11, Q1). For instance, P4 saw the recommendations as good starting points during data exploration and said, “I was curious about what Snowy was picking up and just kind of clicking through those different recommendations to see what the data looks like.” P2 noted that the “recommendations were pretty well spread out” and helped him see the data from different perspectives (i.e., supported different intents, DG3). Recommendations also reminded participants of the analytical capabilities of the tool and helped pivot their exploration around those. For instance, while looking at a bar chart showing total values, P4 saw a recommendation about the average values and realized he could switch aggregations to gain different insights about the same attribute combinations. All participants stated that they found the recommendations more useful during the open-ended exploration. For instance, P9 said “it was really helpful for exploratory, but not so much in the first focused part. For the last few tasks I didn’t even look at the recommendations…” This reaction was not surprising as Snowy was designed with data exploration in mind (as opposed to targeted analysis). That said, participants also confirmed that the recommendations did not obstruct their workflow during targeted analysis (DG6) and they could “simply not look” when they knew what actions they wanted to perform (Figure 11, Q2).
5.3.2. Relevance of recommended content.
Although participants were in agreement about the utility of recommendations to guide their exploration, the feedback on the relevance of recommended utterance parameters (i.e., attributes and values) was rather mixed (Figure 11, Q3). Some participants felt that the recommendations did a good job at suggesting what they wanted to explore next. P3 cited an example from her session and said, “I had some assumptions in my head, like, for the movies, maybe the budget would be somehow related to, you know, Worldwide Gross and it is quite delightful when I found that was actually a recommended query too.” In other cases, especially sessions involving participants with prior experience with NLIs, we observed various assumptions that participants made as they drew from their past experiences. For instance, these participants assumed that the recommendations were randomly parameterized and thus only viewed them as sample phrases. For instance, P8 said, “the odds that you’re going to guess the fields I actually want to look at are terribly low. So I was looking at what is the verbiage around the fields trying to pull that out.” Similarly, P1 said, “I’m not really understanding why it gave the choices. Like, is it’s based on previously asked questions or what? So I thought they were relevant as, like, oh, let me explore, but I’m not exactly sure.” While these specific participants later noted that they had forgotten about the tooltips that provide high-level explanations for recommendations, their feedback suggests the need for surfacing better explanations in the interface.
5.3.3. Recommendations to aid NL discovery and usage.
All participants were in strong agreement that the recommendations helped them discover and learn the various ways NL could be used as input to the system (Q4 and Q5 in Figure 11). For instance, P2 said, “the most valuable part of the recommendations was to know how to describe to the system, the kinds of things I’d want to see. It’s a really good tutorial.” P5 highlighted how the recommendations were useful as phrasing templates even when they did not suggest the exact content that she was looking for - “Obviously you can’t read my mind. So, when I was looking for something very specific, it wouldn’t exactly be there. But it would be a good be guiding tool to know how I could ask questions.” Participants also appreciated the linguistic variety in the recommendations to help them understand the different ways that the NL utterances could be expressed. P9, for instance, said, “seeing the recommendations helped me because I could see, like, oh, I can phrase it as a question or I can use synonyms or, you know, that gave me information I needed and seeing examples is really helpful.” Commenting specifically on the follow-up recommendations, P10 said “Words like ‘drill down’ are helpful to indicate that it’s the same inquiry but just like a follow-up on it. And words like ‘instead’ also helped.”
The individual participant responses (Figure 11) and the subjective feedback together helped us validate our high-level premise that utterance recommendations can guide visual analysis while implicitly making users aware of the system’s NL capabilities. Participant feedback suggested that while the current recommendations in Snowy provide good linguistic variety, there is a need for providing users better explanations about the provenance of the system’s behavior.
5.4. Design Considerations
Findings from the study brought up three important factors to consider when incorporating utterance recommendations in the context of conversational visual analysis tools:
-
•
Show visual previews of system changes. Participants who were familiar with visualization tools and concepts like graphical encodings commented that it would be helpful if the system provided additional feedback or even a preview for what actions selecting a recommendation would result in. For instance, referring to recommendations like , P4 said, “I got the sense of what it’s recommending, but at the same time, I wasn’t sure what that’s going to do to the visualization.” Specifically, in this case, P4 was unsure if “break down” would lead to Content Rating being mapped to color or if the system will somehow create a small multiples chart instead.
-
•
Adaptable interfaces for managing recommendations. Following DG1 and DG4, we designed the recommendations in Snowy to be adaptive to the user’s interaction based on available data entities (e.g., underexplored attributes are prioritized during parameterization, recommendations mapping to infrequently used intents are shown first). While this functionality aids breadth-oriented exploration, it makes it challenging to go back to prior recommendations as their ordering or parameters might have changed (Findlater and Gajos, 2009). For example, P10 had selected a recommendation and wanted to go back to a recommendation she saw earlier, but did not want to investigate at the time (“I saw a suggestion here before I clicked some other suggestions.. Is there any way to request the same examples?”). Addressing such scenarios and exploring alternative adaptable interfaces (Stuerzlinger et al., 2006; Findlater and McGrenere, 2008) that allow users to bookmark, organize, and track utterance recommendations over time, would be an interesting approach to pursue.
-
•
Placement of recommendations. Recommendations are persistently displayed on the right side panel of the interface (Figure 2E). Participants generally liked this placement for convenient reference, while not impeding their workflow during targeted analysis (DG6). For follow-up recommendations however, we observed that participants sometimes missed noticing the recommendations although they were suggesting the exact intent and attribute(s) they were interested in (e.g. filtering or grouping a bar chart by a specific categorical attribute like Region). To this end, P3 suggested that an alternative would be to show the recommendations, especially follow-ups, closer to the the input box since they are typically the most immediate actions one may want to take. However, doing so could be distracting while users are typing their questions, especially if the recommendations frequently update. Thoughtful placement of recommendations in such an interface would need to strike a balance between non-obtrusiveness and in-situ availability.
6. Limitations and Future Work
Supporting additional visualizations and intent categories. The current encoding channels of x, y, and color along with the bar, point, and line marks allow the creation of canonical visualization types and provide enough variability to test the underlying idea of leveraging utterance recommendations. However, moving forward, for the system to have practical value, more data types and visualizations (e.g., maps, small multiples) need to be supported. Furthermore, while our focus in this paper was on core visual analysis intents, people may want to use NL to accomplish other tasks like styling a visualization or for user interface operations at the tool level. For instance, during the study, two participants (P2, P8) said they would like the utterances to cover a more general set of actions and have a tighter coupling with the GUI (e.g., removing attributes through NL, changing the colors used in a chart). While supporting these, in theory, can be done by adding more types of recommendations (e.g., analytic intents, visualization styling), thinking about the manifestation of these recommendations in the interface and the ways to delineate different recommendation types are open points for future work.
Investigating the impact of utterance recommendations on analytic workflows and learnability. The preliminary study helped us validate the premise that utterance recommendations can guide visual analysis while aiding with NL discoverability. However, deeper investigations are required to understand the specific benefits of utterance recommendations and their impact on analytic workflows. Future work could involve running a study comparing Snowy to a baseline tool that recommends visualizations (as opposed to NL utterances). Such a study could help better understand the unique pros and cons of utterance recommendations and shed light on design considerations to combine utterance recommendations with thumbnail-style chart previews. Participants positively commented on the potential of utterance recommendations to aid NL discovery and learning, with P7 comparing Snowy’s utterances to command suggestions offered by voice assistants like Amazon Alexa and Google Home. However, this feedback was based on a single session involving 30 minutes of interaction with the tool. To truly assess the usefulness of NL recommendations, it would be necessary to conduct a longitudinal study with Snowy where participants use the interface with their individual datasets and workflows over a longer time period.
Mitigating potential biases. To promote breadth of coverage in its recommendations, Snowy’s recommendation engine tracks and incorporates the count of interactions with attributes and intents. ‘Coverage’, however, is a very simplistic metric and may not account for the various types of analytic and cognitive biases (Wall et al., 2018; Dimara et al., 2018), or prevent people ignoring their external knowledge about the data domain and blindly follow the recommendations. It is critical to incorporate richer models to identify potential biases in user interactions while generating the recommendations (e.g. by leveraging cognitive bias metrics such as those suggested by Wall et al. (Wall et al., 2017)) and investigate designs to surface and mitigate potential biases during exploratory data analysis (Wall et al., 2019).
Applying machine learning approaches for utterance realization. While the current template-based approach for utterance realization works effectively for a small set of known intents, it can be rather challenging to configure templates for large-scale systems that cover a more comprehensive range of intents and data domains. An interesting direction to pursue is applying machine learning for supporting linguistic realization. Recent deep-learning language models such as GPT-3 (Brown et al., 2020) could also be an alternative to consider for providing greater linguistic variability in utterances at low configuration cost.
Incorporating data semantics during utterance realization. While inferring the semantics of the underlying data to generate domain-specific phrasings and recommendations is an open, vast area for research, we also identified more short-term ways to improve the recommendations by incorporating data semantics. For example, one of the participants (P7) suggested that if the recommendations were rephrased to use terms from the data domain (e.g., “movies” or “colleges” instead of “items”), they would be more engaging and interpretable, especially for non-technical domain-experts. Improving the language of the recommendations and investigating such simple, but important semantic modifications and data curation is another area for improvement going forward.
Exploring voice input and chatbots. In this paper, we focus on Snowy as a desktop system that supports NL interaction through text input. The premise of leveraging utterance recommendations for conversational visual analysis is generalizable and can be applied in other applications and contexts. For instance, prior work on multimodal interfaces for data visualization involving voice input (e.g., (Saktheeswaran et al., 2020; Srinivasan et al., 2021a)) has highlighted that NL discovery is a persistent challenge. Along these lines, a compelling opportunity for future research lies in exploring how utterance recommendations similar to those in Snowy can be generated and surfaced in the context of voice-based interfaces to data (as opposed to text). Exploring these alternative interfaces would need to consider user context, device modalities, as well as differences in language pragmatics and syntax structure for generating recommendations.
7. Conclusion
NLIs for visual analysis tools have evolved as a promising medium for users to converse with data and gain insights by expressing their inquiries in simple language. The process of sense-making and getting insights from the data continues to be a challenge as users need to formulate their questions while making progress in their analytical journey. In this paper, we introduce a mixed-initiative system, Snowy that provides both analytical and linguistic guidance to the user by presenting utterance recommendations. The system suggests new inquiries as well as follow-up utterances based on the user’s current context, providing useful next steps for interesting and underexplored aspects of the data. A preliminary evaluation of Snowy suggests that contextual utterance recommendations can not only guide visual analysis, but also help people gain awareness of the system’s NL interpretation capabilities. We hope that insights learned from our work can inspire new research directions in the combined space of NL, recommendations, and analytical capabilities. As we move a step closer towards realizing richer analytical conversation experiences during visual analysis, the excitement for potential innovation and opportunity can be best expressed by Captain Haddock (had, 2021), a fictional character in The Adventures of Tintin as he exclaims - “Blistering blue barnacles!”
Acknowledgements.
We thank Clark Wildenradt for his input and suggestions for improving Snowy’s interface. We also thank members of the Tableau Research Team and the anonymous reviewers for their helpful feedback, and all the study participants for their opinions and insights.References
- (1)
- had (2021) 2021. Captain Haddock. https://en.wikipedia.org/wiki/Captain_Haddock.
- web (2021) 2021. Cisco WebexTM. https://www.webex.com.
- ibm (2021) 2021. IBM Watson Analytics. http://www.ibm.com/analytics/watson-analytics.
- pow (2021) 2021. Microsoft Q & A. https://powerbi.microsoft.com/en-us/documentation/powerbi-service-q-and-a.
- sus (2021) 2021. System Usability Scale (SUS). https://www.usability.gov/how-to-and-tools/methods/system-usability-scale.html.
- tab (2021) 2021. Tableau Software. https://www.tableau.com.
- ask (2021) 2021. Tableau’s Ask Data. https://www.tableau.com/products/new-features/ask-data.
- tho (2021) 2021. ThoughtSpot. http://www.thoughtspot.com.
- Arnold et al. (2020) Kenneth C. Arnold, Krysta Chauncey, and Krzysztof Z. Gajos. 2020. Predictive Text Encourages Predictable Writing. In Proceedings of the 25th International Conference on Intelligent User Interfaces (Cagliari, Italy) (IUI ’20). Association for Computing Machinery, New York, NY, USA, 128–138. https://doi.org/10.1145/3377325.3377523
- Bhatia et al. (2011) Sumit Bhatia, Debapriyo Majumdar, and Prasenjit Mitra. 2011. Query Suggestions in the Absence of Query Logs. In Proceedings of the 34th International ACM SIGIR Conference on Research and Development in Information Retrieval (Beijing, China) (SIGIR ’11). Association for Computing Machinery, New York, NY, USA, 795–804. https://doi.org/10.1145/2009916.2010023
- Bouali et al. (2016) Fatma Bouali, Abdelheq Et-tahir Guettala, and Gilles Venturini. 2016. VizAssist: an interactive user assistant for visual data mining. Vis. Comput. 32, 11 (2016), 1447–1463. https://doi.org/10.1007/s00371-015-1132-9
- Brézillon (2007) Patrick Brézillon. 2007. Context Modeling: Task Model and Practice Model. In Modeling and Using Context, Boicho Kokinov, Daniel C. Richardson, Thomas R. Roth-Berghofer, and Laure Vieu (Eds.). Springer Berlin Heidelberg, Berlin, Heidelberg, 122–135.
- Brown et al. (2020) Tom B Brown, Benjamin Mann, Nick Ryder, Melanie Subbiah, Jared Kaplan, Prafulla Dhariwal, Arvind Neelakantan, Pranav Shyam, Girish Sastry, Amanda Askell, et al. 2020. Language models are few-shot learners. arXiv preprint arXiv:2005.14165 (2020).
- Clark et al. (1983) Herbert H. Clark, Robert Schreuder, and Samuel Buttrick. 1983. Common ground at the understanding of demonstrative reference. Journal of Verbal Learning and Verbal Behavior 22, 2 (1983), 245–258. https://doi.org/10.1016/S0022-5371(83)90189-5
- Collins et al. (2018) Christopher Collins, Natalia Andrienko, Tobias Schreck, Jing Yang, Jaegul Choo, Ulrich Engelke, Amit Jena, and Tim Dwyer. 2018. Guidance in the human–machine analytics process. Visual Informatics 2, 3 (2018), 166–180.
- Corbett and Weber (2016) Eric Corbett and Astrid Weber. 2016. What can I say? addressing user experience challenges of a mobile voice user interface for accessibility. In Proceedings of the 18th international conference on human-computer interaction with mobile devices and services. 72–82.
- Crystal (2011) D. Crystal. 2011. A Dictionary of Linguistics and Phonetics. Wiley. https://books.google.com/books?id=3ZPQVuSgDAkC
- Cui et al. (2018) Zhe Cui, Sriram Karthik Badam, Adil Yalçin, and Niklas Elmqvist. 2018. DataSite: Proactive Visual Data Exploration with Computation of Insight-based Recommendations. CoRR abs/1802.08621 (2018).
- de Araújo Lima and Barbosa (2020) Raul de Araújo Lima and S. Barbosa. 2020. VisMaker: a Question-Oriented Visualization Recommender System for Data Exploration. ArXiv abs/2002.06125 (2020).
- Demiralp et al. (2017) Çağatay Demiralp, Peter J Haas, Srinivasan Parthasarathy, and Tejaswini Pedapati. 2017. Foresight: Rapid data exploration through guideposts. arXiv preprint arXiv:1709.10513 (2017).
- Dhamdhere et al. (2017) Kedar Dhamdhere, Kevin S. McCurley, Ralfi Nahmias, Mukund Sundararajan, and Qiqi Yan. 2017. Analyza: Exploring Data with Conversation. In Proceedings of the 22nd International Conference on Intelligent User Interfaces (IUI 2017). 493–504.
- Dimara et al. (2018) Evanthia Dimara, Steven Franconeri, Catherine Plaisant, Anastasia Bezerianos, and Pierre Dragicevic. 2018. A task-based taxonomy of cognitive biases for information visualization. IEEE transactions on visualization and computer graphics 26, 2 (2018), 1413–1432.
- Fast et al. (2018) Ethan Fast, Binbin Chen, Julia Mendelsohn, Jonathan Bassen, and Michael S Bernstein. 2018. Iris: A conversational agent for complex tasks. In Proceedings of the 2018 CHI Conference on Human Factors in Computing Systems. 1–12.
- Findlater and Gajos (2009) Leah Findlater and Krzysztof Z Gajos. 2009. Design space and evaluation challenges of adaptive graphical user interfaces. AI Magazine 30, 4 (2009), 68–68.
- Findlater and McGrenere (2008) Leah Findlater and Joanna McGrenere. 2008. Impact of screen size on performance, awareness, and user satisfaction with adaptive graphical user interfaces. In Proceedings of the SIGCHI Conference on Human Factors in Computing Systems. 1247–1256.
- Fraser (1990) Bruce Fraser. 1990. An approach to discourse markers. Journal of Pragmatics 14 (06 1990), 383–398. https://doi.org/10.1016/0378-2166(90)90096-V
- Furqan et al. (2017a) Anushay Furqan, Chelsea Myers, and Jichen Zhu. 2017a. Learnability through Adaptive Discovery Tools in Voice User Interfaces. In Proceedings of the 2017 CHI Conference Extended Abstracts on Human Factors in Computing Systems (Denver, Colorado, USA) (CHI EA ’17). Association for Computing Machinery, New York, NY, USA, 1617–1623. https://doi.org/10.1145/3027063.3053166
- Furqan et al. (2017b) Anushay Furqan, Chelsea Myers, and Jichen Zhu. 2017b. Learnability Through Adaptive Discovery Tools in Voice User Interfaces. In Proceedings of the 2017 CHI Conference Extended Abstracts on Human Factors in Computing Systems (Denver, Colorado, USA) (CHI EA ’17). ACM, New York, NY, USA, 1617–1623. https://doi.org/10.1145/3027063.3053166
- Gao et al. (2015) Tong Gao, Mira Dontcheva, Eytan Adar, Zhicheng Liu, and Karrie G. Karahalios. 2015. DataTone: Managing Ambiguity in Natural Language Interfaces for Data Visualization. In Proceedings of the 28th Annual ACM Symposium on User Interface Software Technology (UIST 2015). ACM, New York, NY, USA, 489–500.
- Grammel et al. (2010) Lars Grammel, Melanie Tory, and Margaret-Anne Storey. 2010. How information visualization novices construct visualizations. IEEE Transactions on Visualization and Computer Graphics 16, 6 (2010), 943–952.
- Grosz and Sidner (1986) Barbara J. Grosz and Candace L. Sidner. 1986. Attention, Intentions, and the Structure of Discourse. Computational Linguistics 12, 3 (July 1986), 175–204. http://dl.acm.org/citation.cfm?id=12457.12458
- He et al. (2009) Qi He, Daxin Jiang, Zhen Liao, Steven C. H. Hoi, Kuiyu Chang, Ee-Peng Lim, and Hang Li. 2009. Web Query Recommendation via Sequential Query Prediction. In Proceedings of the IEEE International Conference on Data Engineering (ICDE ’09). IEEE Computer Society, USA, 1443–1454. https://doi.org/10.1109/ICDE.2009.71
- Hearst et al. (2019) Marti Hearst, Melanie Tory, and Vidya Setlur. 2019. Toward interface defaults for vague modifiers in natural language interfaces for visual analysis. In 2019 IEEE Visualization Conference (VIS). IEEE, 21–25.
- Hergè (2011) Hergè. 2011. The Adventures of Tintin. Bantam. https://books.google.com/books?id=9IOQZwEACAAJ
- Hoque et al. (2017) Enamul Hoque, Vidya Setlur, Melanie Tory, and Isaac Dykeman. 2017. Applying pragmatics principles for interaction with visual analytics. IEEE transactions on visualization and computer graphics 24, 1 (2017), 309–318.
- Horvitz (1999) Eric Horvitz. 1999. Principles of mixed-initiative user interfaces. In Proceedings of the SIGCHI conference on Human Factors in Computing Systems. 159–166.
- Key et al. (2012) Alicia Key, Bill Howe, Daniel Perry, and Cecilia Aragon. 2012. VizDeck. Proceedings of the 2012 international conference on Management of Data - SIGMOD ’12 (2012), 681. https://doi.org/10.1145/2213836.2213931
- Lee et al. (2019) Doris Jung-Lin Lee, John Lee, Tarique Siddiqui, Jaewoo Kim, Karrie Karahalios, and Aditya Parameswaran. 2019. You can’t always sketch what you want: Understanding Sensemaking in Visual Query Systems. IEEE Transactions on Visualization and Computer Graphics (2019), 1–1. https://doi.org/10.1109/TVCG.2019.2934666
- Lee et al. (2021) Doris Jung-Lin Lee, Vidya Setlur, Melanie Tory, Karrie Karahalios, and Aditya Parameswaran. 2021. Deconstructing Categorization in Visualization Recommendation: A Taxonomy and Comparative Study. arXiv:2102.07070 [cs.HC]
- Mackinlay (1986) Jock Mackinlay. 1986. Automating the design of graphical presentations of relational information. ACM Transactions on Graphics 5, 2 (1986), 110–141. https://doi.org/10.1145/22949.22950
- Mackinlay et al. (2007) Jock Mackinlay, Pat Hanrahan, and Chris Stolte. 2007. Show me: Automatic presentation for visual analysis. IEEE transactions on visualization and computer graphics 13, 6 (2007), 1137–1144.
- Medlar et al. (2021) Alan Medlar, Jing Li, and Dorota Głowacka. 2021. Query Suggestions as Summarization in Exploratory Search. In Proceedings of the 2021 Conference on Human Information Interaction and Retrieval (Canberra ACT, Australia) (CHIIR ’21). Association for Computing Machinery, New York, NY, USA, 119–128. https://doi.org/10.1145/3406522.3446020
- Moritz et al. (2019) Dominik Moritz, Chenglong Wang, Greg L Nelson, Halden Lin, Adam M Smith, Bill Howe, and Jeffrey Heer. 2019. Formalizing visualization design knowledge as constraints: Actionable and extensible models in Draco. IEEE transactions on visualization and computer graphics 25, 1 (2019), 438–448.
- Myers (2019a) Chelsea M Myers. 2019a. Adaptive suggestions to increase learnability for voice user interfaces. In Proceedings of the 24th International Conference on Intelligent User Interfaces: Companion. 159–160.
- Myers (2019b) Chelsea M. Myers. 2019b. Adaptive Suggestions to Increase Learnability for Voice User Interfaces. In Proceedings of the 24th International Conference on Intelligent User Interfaces: Companion (Marina del Ray, California) (IUI ’19). Association for Computing Machinery, New York, NY, USA, 159–160. https://doi.org/10.1145/3308557.3308727
- Narechania et al. (2021) Arpit Narechania, Arjun Srinivasan, and John Stasko. 2021. NL4DV: A toolkit for generating analytic specifications for data visualization from natural language queries. IEEE Transactions on Visualization and Computer Graphics 27, 2 (2021), 369–379.
- Olteanu et al. (2020) Alexandra Olteanu, Fernando Diaz, and Gabriella Kazai. 2020. When Are Search Completion Suggestions Problematic? Proc. ACM Hum.-Comput. Interact. 4, CSCW2, Article 171 (Oct. 2020), 25 pages. https://doi.org/10.1145/3415242
- Otsuka et al. (2012) Atsushi Otsuka, Yohei Seki, Noriko Kando, and Tetsuji Satoh. 2012. QAque: Faceted Query Expansion Techniques for Exploratory Search Using Community QA Resources. In Proceedings of the 21st International Conference on World Wide Web (Lyon, France) (WWW ’12 Companion). Association for Computing Machinery, New York, NY, USA, 799–806. https://doi.org/10.1145/2187980.2188203
- Reiter (2010) Ehud Reiter. 2010. Natural Language Generation. John Wiley & Sons, Ltd, Chapter 20, 574–598. https://doi.org/10.1002/9781444324044.ch20 arXiv:https://onlinelibrary.wiley.com/doi/pdf/10.1002/9781444324044.ch20
- Reiter and Dale (2000) Ehud Reiter and Robert Dale. 2000. Building Natural Language Generation Systems. Cambridge University Press. https://doi.org/10.1017/CBO9780511519857
- Saktheeswaran et al. (2020) Ayshwarya Saktheeswaran, Arjun Srinivasan, and John Stasko. 2020. Touch? speech? or touch and speech? investigating multimodal interaction for visual network exploration and analysis. IEEE transactions on visualization and computer graphics 26, 6 (2020), 2168–2179.
- Sarikaya and Gleicher (2017) Alper Sarikaya and Michael Gleicher. 2017. Scatterplots: Tasks, data, and designs. IEEE transactions on visualization and computer graphics 24, 1 (2017), 402–412.
- Satyanarayan et al. (2016) Arvind Satyanarayan, Dominik Moritz, Kanit Wongsuphasawat, and Jeffrey Heer. 2016. Vega-lite: A grammar of interactive graphics. IEEE transactions on visualization and computer graphics 23, 1 (2016), 341–350.
- Setlur et al. (2016) Vidya Setlur, Sarah E. Battersby, Melanie Tory, Rich Gossweiler, and Angel X. Chang. 2016. Eviza: A Natural Language Interface for Visual Analysis. In Proceedings of the 29th Annual Symposium on User Interface Software and Technology (Tokyo, Japan) (UIST 2016). ACM, New York, NY, USA, 365–377.
- Setlur et al. (2020) Vidya Setlur, Enamul Hoque, Dae Hyun Kim, and Angel X. Chang. 2020. Sneak Pique: Exploring Autocompletion as a Data Discovery Scaffold for Supporting Visual Analysis. Association for Computing Machinery, New York, NY, USA, 966–978. https://doi.org/10.1145/3379337.3415813
- Setlur and Kumar (2020) Vidya Setlur and Arathi Kumar. 2020. Sentifiers: Interpreting Vague Intent Modifiers in Visual Analysis using Word Co-occurrence and Sentiment Analysis. 2020 IEEE Visualization Conference (VIS) (2020), 216–220.
- Setlur et al. (2019) Vidya Setlur, Melanie Tory, and Alex Djalali. 2019. Inferencing Underspecified Natural Language Utterances in Visual Analysis. In Proceedings of the 24th International Conference on Intelligent User Interfaces (Marina del Ray, California) (IUI ’19). Association for Computing Machinery, New York, NY, USA, 40–51. https://doi.org/10.1145/3301275.3302270
- Srinivasan et al. (2019) Arjun Srinivasan, Mira Dontcheva, Eytan Adar, and Seth Walker. 2019. Discovering Natural Language Commands in Multimodal Interfaces. In Proceedings of the 24th International Conference on Intelligent User Interfaces (Marina del Ray, California) (IUI ’19). Association for Computing Machinery, New York, NY, USA, 661–672. https://doi.org/10.1145/3301275.3302292
- Srinivasan et al. (2018) Arjun Srinivasan, Steven M Drucker, Alex Endert, and John Stasko. 2018. Augmenting visualizations with interactive data facts to facilitate interpretation and communication. IEEE transactions on visualization and computer graphics 25, 1 (2018), 672–681.
- Srinivasan et al. (2020) Arjun Srinivasan, Bongshin Lee, Nathalie Henry Riche, Steven M Drucker, and Ken Hinckley. 2020. InChorus: Designing consistent multimodal interactions for data visualization on tablet devices. In Proceedings of the 2020 CHI Conference on Human Factors in Computing Systems. 1–13.
- Srinivasan et al. (2021a) Arjun Srinivasan, Bongshin Lee, and John Stasko. 2021a. Interweaving Multimodal Interaction With Flexible Unit Visualizations for Data Exploration. IEEE Transactions on Visualization and Computer Graphics 27, 8 (2021), 3519–3533. https://doi.org/10.1109/TVCG.2020.2978050
- Srinivasan et al. (2021b) Arjun Srinivasan, Nikhila Nyapathy, Bongshin Lee, Steven M. Drucker, and John Stasko. 2021b. Collecting and Characterizing Natural Language Utterances for Specifying Data Visualizations. In Proceedings of the 2021 CHI Conference on Human Factors in Computing Systems. ACM, Article 464, 10 pages.
- Srinivasan and Stasko (2018) Arjun Srinivasan and John Stasko. 2018. Orko: Facilitating multimodal interaction for visual exploration and analysis of networks. IEEE transactions on visualization and computer graphics 24, 1 (2018), 511–521.
- Stolte et al. (2002) Chris Stolte, Diane Tang, and Pat Hanrahan. 2002. Polaris: A System for Query, Analysis, and Visualization of Multidimensional Relational Databases. IEEE Transactions on Visualization and Computer Graphics 8, 1 (Jan. 2002), 52–65. https://doi.org/10.1109/2945.981851
- Stuerzlinger et al. (2006) Wolfgang Stuerzlinger, Olivier Chapuis, Dusty Phillips, and Nicolas Roussel. 2006. User interface façades: towards fully adaptable user interfaces. In Proceedings of the 19th annual ACM symposium on User interface software and technology. 309–318.
- Sun et al. (2010) Yiwen Sun, Jason Leigh, Andrew Johnson, and Sangyoon Lee. 2010. Articulate: A semi-automated model for translating Natural Language queries into meaningful visualizations. In International Symposium on Smart Graphics. Springer, 184–195.
- Tory and Setlur (2019) Melanie Tory and Vidya Setlur. 2019. Do what i mean, not what i say! design considerations for supporting intent and context in analytical conversation. In 2019 IEEE Conference on Visual Analytics Science and Technology (VAST). IEEE, 93–103.
- Tufte (1985) Edward R Tufte. 1985. The visual display of quantitative information. The Journal for Healthcare Quality (JHQ) 7, 3 (1985), 15.
- Vartak et al. (2015) Manasi Vartak, Samuel Madden, and Aditya N Parmeswaran. 2015. SEEDB : Supporting Visual Analytics with Data-Driven Recommendations. (2015).
- Walker et al. (1998) Marilyn A. Walker, Jeanne Fromer, Giuseppe Di Fabbrizio, Craig Mestel, and Don Hindle. 1998. What Can I Say?: Evaluating a Spoken Language Interface to Email. In Proceedings of the SIGCHI Conference on Human Factors in Computing Systems (Los Angeles, California, USA) (CHI ’98). ACM Press/Addison-Wesley Publishing Co., New York, NY, USA, 582–589. https://doi.org/10.1145/274644.274722
- Wall et al. (2017) Emily Wall, Leslie M Blaha, Lyndsey Franklin, and Alex Endert. 2017. Warning, bias may occur: A proposed approach to detecting cognitive bias in interactive visual analytics. In 2017 IEEE Conference on Visual Analytics Science and Technology (VAST). IEEE, 104–115.
- Wall et al. (2018) Emily Wall, Leslie M Blaha, Celeste Lyn Paul, Kristin Cook, and Alex Endert. 2018. Four perspectives on human bias in visual analytics. In Cognitive biases in visualizations. Springer, 29–42.
- Wall et al. (2019) Emily Wall, John Stasko, and Alex Endert. 2019. Toward a design space for mitigating cognitive bias in vis. In 2019 IEEE Visualization Conference (VIS). IEEE, 111–115.
- Wongsuphasawat et al. (2016a) Kanit Wongsuphasawat, Dominik Moritz, Anushka Anand, Jock Mackinlay, Bill Howe, and Jeffrey Heer. 2016a. Towards a general-purpose query language for visualization recommendation. In Proceedings of the Workshop on Human-In-the-Loop Data Analytics. ACM, 4.
- Wongsuphasawat et al. (2016b) Kanit Wongsuphasawat, Dominik Moritz, Anushka Anand, Jock Mackinlay, Bill Howe, and Jeffrey Heer. 2016b. Voyager: Exploratory Analysis via Faceted Browsing of Visualization Recommendations. IEEE Transactions on Visualization and Computer Graphics 22, 1 (2016), 649–658. https://doi.org/10.1109/TVCG.2015.2467191
- Wongsuphasawat et al. (2017) Kanit Wongsuphasawat, Zening Qu, Dominik Moritz, Riley Chang, Felix Ouk, Anushka Anand, Jock Mackinlay, Bill Howe, and Jeffrey Heer. 2017. Voyager 2 : Augmenting Visual Analysis with Partial View Specifications. (2017). https://doi.org/10.1145/3025453.3025768
- Wu et al. (2021) Aoyu Wu, Yun Wang, Xinhuan Shu, Dominik Moritz, Weiwei Cui, Haidong Zhang, Dongmei Zhang, and Huamin Qu. 2021. Survey on Artificial Intelligence Approaches for Visualization Data. arXiv preprint arXiv:2102.01330 (2021).
- Yankelovich (1996) Nicole Yankelovich. 1996. How do users know what to say? interactions 3, 6 (1996), 32–43.
- Yu and Silva (2019) Bowen Yu and Cláudio T Silva. 2019. Flowsense: A natural language interface for visual data exploration within a dataflow system. IEEE transactions on visualization and computer graphics 26, 1 (2019), 1–11.
- Zhu et al. (2020) Sujia Zhu, Guodao Sun, Qi Jiang, Meng Zha, and Ronghua Liang. 2020. A survey on automatic infographics and visualization recommendations. Visual Informatics 4, 3 (2020), 24–40.